


区域尺度上植物的氮(N)和磷(P)特征能反映植物特性及其对环境条件的长期响应与适应(侯学煜, 1982)。大多数陆地生态系统的生产力经常受N、P或二者的共同限制。叶片作为植物的主要光合器官, 其N : P的大小经常被用来表明生态系统生产力受到哪种元素的限制作用, 但是这种限制关系会随着外界环境的改变而变化(Koerselman & Meuleman, 1996; Aerts & Chapin, 2000; Güsewell, 2004; He et al., 2008; von Oheimb et al., 2010)。例如, 从全球格局来看, 高纬度地区的温带森林更易受N的限制, 而低纬度地区的热带与亚热带森林更易受P的限制(Reich & Oleksyn, 2004; Wardle et al., 2004; 阎恩荣等, 2008)。相同区域的植物也可能因为外界环境与内在属性的区别, 其受限制的营养元素也不同(Aerts & Chapin, 2000; Wardle et al., 2004; Davidson et al., 2007)。植被生产力受所处环境条件中关键养分如N、P的可利用量控制, 土壤N和P含量的大小在一定程度上调节着植物C : N和C : P的大小(Tessier & Raynal, 2003; Güsewell, 2004; Hogan et al., 2010)。因此, 植物体的C : N和C : P在一定程度上可反映单位养分供应量所能达到的生产力, N : P用来表征植物受N、P养分的限制格局(Wardle et al., 2004; He et al., 2006, 2008)。
由于不同生活型树种生境的差异及常绿树种较高的叶龄, 常绿树种与落叶树种、针叶树种与阔叶树种的叶片的C、N、P含量存在明显差异(Aerts & Chapin, 2000; 孙书存和陈灵芝, 2001; Liu et al., 2006)。研究表明, 成熟叶片的N含量与其衰老过程中的N转移率呈明显正相关关系, 而P转移量的大小与其初始含量值并不相关(Chapin & Kedrowski, 1983; Niklas, 2006)。Aerts (1996)的研究显示, 全球常绿植物的N再吸收率显著低于落叶植物, 而常绿与落叶植物间P的再吸收率无明显差异。相关研究针对全球不同区域的树种进行了多种综合分析(Niva et al., 2003; Ågren, 2008), 结果表明, 不同植物中N浓度的增加均慢于P浓度的增加, 部分植物的养分再吸收并不受当地环境条件控制。植物的N、P养分再吸收效率不仅影响植物从所在环境获得的N、P量, 而且可能影响植物生长的受限因子(Elser et al., 1996; Townsend et al., 2007; Mulder & Elser, 2009)。目前全球或区域大尺度上的植被C、N、P化学计量特征或养分再吸收特征已有较多研究(Han et al., 2005; He et al., 2006, 2008; Richardson et al., 2008), 但是较少将养分再吸收效率与生态系统的化学计量学结合起来, 而比较不同区域植物的生态化学计量学特征与养分再吸收的研究更少(任书杰等, 2007; 阎恩荣等, 2010)。
本研究选择中国典型区域的温带针阔混交林、亚热带常绿阔叶林、热带季雨林和亚热带人工针叶林, 通过对不同类型的天然成熟林与人工近熟林叶片和凋落物的C : N : P化学计量特征与N、P养分再吸收特征的研究, 试图回答以下问题: 1)不同森林类型叶片与凋落物的生态化学计量特征的差异及叶片与凋落物化学计量比的关系; 2)不同生活型植物的C : N : P化学计量特征及差异; 3)叶片C : N : P与温度和降水的关系; 4)森林类型与N、P养分再吸收特征的关系。
1 材料和方法
1.1 样地概况
试验材料来源于中国生态系统研究网络4个生态站点的典型森林类型: 长白山试验站的温带针阔混交林、鼎湖山试验站的亚热带常绿阔叶林、西双版纳试验站的热带季雨林及千烟洲试验站的亚热带人工林。长白山站位于吉林省安图县二道白河镇境内, 土壤为山地暗棕色森林土, 年平均气温3.6 ℃, 年平均降水量713 mm, 无霜期109-141天。鼎湖山站位于广东省肇庆市鼎湖山国家级自然保护区内, 年平均气温20.9 ℃, 年平均降水量1 564 mm, 土壤为赤红壤。西双版纳试验站位于云南省西双版纳傣族自治州勐腊县勐仑镇境内, 植被类型为热带季节雨林、季雨林, 地带性土壤为砖红壤和赤红壤; 年平均气温21.5 ℃, 年平均降水量1 557 mm, 终年无霜。千烟洲生态试验站位于江西省泰和县境内, 试验区年平均气温17.8 ℃, 年平均降水量1 360 mm; 无霜期290天, 主要的土壤类型是红壤。研究选择的代表树木类型见表1。4个森林类型的土壤元素含量特征见表2。
表1 主要树种及其生活型
Table 1
| 站名 Station name | 地理位置 Geographic location | 海拔 Elevation (m) | 森林类型 Forest type | 代表树种 Representative tree species | 生活型 Life form |
|---|---|---|---|---|---|
| 长白山站 Changbaishan Station | 41°41′ N, 127°42′ E | 736 | 温带针阔混交林 Temperate needle broad-leaved mixed forest | 水曲柳 Fraxinus mandschurica 红松 Pinus koraiensis 紫椴 Tilia amurensis 锥栗 Castanea henryi | DB EN DB DB |
| 鼎湖山站 Dinghushan Station | 23°09′ N, 112°30′ E | 300 | 亚热带常绿阔叶林 Subtropical evergreen broad-leaved forest | 锥栗 Castanea henryi 黄果厚壳桂 Cryptocarya concinna 云南银柴 Aporusa yunnanensis | DB EB EB |
| 西双版纳站 Xishuangbanna Station | 21°41′ N, 101°25′ E | 570 | 热带季雨林 Tropical monsoon forest | 白颜树 Gironniera subaequalis 梭果玉蕊 Barringtonia fusicarpa 云树 Garcinia cowa | EB EB EB |
| 千烟洲站 Qianyanzhou Station | 26°44′ N, 115°03′ E | 100 | 亚热带人工林 Subtropical plantation forest | 湿地松 Pinus elliottii 马尾松 Pinus massoniana 杉木 Cunninghamia lanceolata 木荷 Schima superba | EN EN EN EB |
DB, 落叶阔叶树; EB, 常绿阔叶树; EN, 常绿针叶树。
DB, deciduous broad-leaved tree; EB, evergreen broad-leaved tree; EN, evergreen needle tree.
表2 4种森林类型的土壤特征(0-10 cm) (平均值±标准偏差)
Table 2
| 森林类型 Forest type | pH | 有机碳 Organic carbon (mg·g-1) | 全氮 Total nitrogen (mg·g-1) | 全磷 Total phosphorus (mg·g-1) |
|---|---|---|---|---|
| 温带针阔混交林 Temperate needle broad-leaved mixed forest | 5.48 ± 0.14 | 164.32 ± 8.48 | 13.04 ± 0.84 | 1.56 ± 0.25 |
| 热带季雨林 Tropical monsoon forest | 4.66 ± 0.14 | 10.60 ± 1.68 | 1.13 ± 0.13 | 0.20 ± 0.04 |
| 亚热带常绿阔叶林 Subtropical evergreen broad-leaved forest | 4.08 ± 0.07 | 32.80 ± 3.67 | 2.50 ± 0.26 | 0.29 ± 0.02 |
| 亚热带人工林 Subtropical plantation forest | 4.54 ± 0.21 | 11.83 ± 3.55 | 0.86 ± 0.2 | 0.11 ± 0.01 |
1.2 取样方法
由于4个站点的森林均为近熟林或成熟林, 森林的叶片与凋落物的元素含量较稳定, 通过一年的采样即可反映叶片与凋落物的基本状态。因此取样日期从2007年3月开始, 到2008年5月结束, 在以上4种森林类型的各个群落分别设置3个重复进行取样。取样内容包括: 研究期间每两个月进行一次植被冠层叶片采样; 在各样地内设置凋落物收集器(1 m × 1 m), 收集不同树种的凋落物。选择的植物种类均为样地的代表性树种。研究期间共收集到4个站点的植物叶片样品126份, 凋落物样品80份。
1.3 样品室内测定、处理和化学分析方法
分析项目为植物叶片与凋落物的全碳、全氮、全磷含量。采集的植物叶片样品分树种进行测定, 凋落物是取与新鲜叶相同比例的混合样进行分析。使用样品粉碎机磨成0.15 mm的粉末后测定。植物叶片的C含量用重铬酸钾外加热法测定, 植物全N用凯氏定氮法测定, 植物全P用硝酸-高氯酸消煮-钼锑抗分光光度法测定(鲁如坤, 2000)。植物样品分析: 同一物种之间的样品算出算术平均数, 不同林型的N、P含量根据物种在所调查样方内的比例进行平均来表示, 得出不同森林类型的N和P的含量。
1.4 数据分析
叶片和凋落物的C : N : P采用质量比表示。森林类型的C、N、P含量和C : N : P是根据各树种在群落中的比例, 利用加权平均计算的, 各森林类型叶片和凋落物的C、N、P含量及C : N : P为该类型下群落的平均值, 区域水平的含量为3个重复样方的平均值。
Nresorption为养分再吸收率, Nleaf为叶片的养分含量, Nlitter为凋落物的养分含量, Nleafmax为植物生长最旺盛时叶片的养分含量(Milla et al., 2005)。
采用成对比较t检验判断同森林类型下两群落间及同群落内乔木间C、N、P含量与C : N : P的差异。利用单因素方差分析法分别判断不同森林类型对叶片和凋落物C、N、P含量、C : N : P及N、P养分再吸收的差别。采用Tukey检验进行各水平间平均值的配对比较。
2 结果
2.1 不同区域森林的叶片与凋落物的C、N、P元素含量
4种森林类型中植物叶片的C含量变化幅度较大(370.10-568.00 mg·g-1), 鼎湖山站的黄果厚壳桂(Cryptocarya concinna)叶片C含量最高, 云南银柴(Aporusa yunnanensis)叶片C含量最低; 叶片N和P含量在不同物种间的变化幅度非常大(N为7.75- 36.30 mg·g-1, P为0.45-2.72 mg·g-1), 西双版纳站的白颜树(Gironniera subaequalis)叶片N含量最高, 千烟洲站的湿地松(Pinus elliottii)叶片N含量最低; 长白山站的紫椴(Tilia anurensis)叶片P含量最高, 千烟洲站的湿地松叶片P含量最低。凋落物C含量的变化幅度为441.70-545.90 mg·g-1, 西双版纳常绿季雨林的凋落物C含量最高, 长白山站凋落物的C含量最低。凋落物的N含量变化幅度为8.60-18.80 mg·g-1, 千烟洲站的湿地松凋落物N含量最低。凋落物的P含量变化幅度为0.23-1.19 mg·g-1, 长白山站凋落物的P含量最高, 千烟洲站湿地松凋落物的P含量最低, 凋落物的N和P含量与新鲜叶片相比有显著下降(表3)。
表3 4种森林类型叶片和凋落物的C、N和P含量(平均值±标准偏差)
Table 3
| 树种 Tree species | n | 碳含量 Carbon content (mg·g-1) | 氮含量 Nitrogen content (mg·g-1) | 磷含量 Phosphorus content (mg·g-1) | ||
|---|---|---|---|---|---|---|
| 叶 Leaf | 温带针阔混交林 Temperate needle broad-leaved mixed forest | 红松 Pinus koraiensis | 14 | 522.90 ± 21.00 | 15.20 ± 1.60 | 1.30 ± 0.30 |
| 水曲柳 Fraxinus mandschurica | 4 | 455.52 ± 12.40 | 20.20 ± 2.60 | 1.36 ± 0.25 | ||
| 紫椴 Tilia anurensis | 3 | 484.90 ± 14.00 | 25.60 ± 3.30 | 2.33 ± 0.40 | ||
| 热带季雨林 Tropical monsoon forest | 云树 Garcinia cowa | 12 | 445.97 ± 12.99 | 13.50 ± 1.30 | 0.81 ± 0.04 | |
| 梭果玉蕊 Barringtonia fusicarpa | 12 | 490.35 ± 20.75 | 19.98 ± 2.04 | 1.30 ± 0.12 | ||
| 白颜树 Gironniera subaequalis | 12 | 446.73 ± 19.80 | 31.00 ± 1.80 | 1.03 ± 0.10 | ||
| 亚热带常绿阔叶林 Subtropical evergreen broadleaved forest | 锥栗 Castanea henryi | 7 | 494.80 ± 27.48 | 19.00 ± 2.08 | 1.03 ± 0.23 | |
| 黄果厚壳桂 Cryptocarya concinna | 7 | 548.60 ± 18.84 | 20.20 ± 1.36 | 1.15 ± 0.09 | ||
| 云南银柴 Aporusa yunnanensis | 7 | 374.87 ± 27.41 | 20.27 ± 1.05 | 0.90 ± 0.12 | ||
| 亚热带人工林 Subtropical plantation forest | 湿地松 Pinus elliottii | 12 | 522.70 ± 19.62 | 10.02 ± 1.38 | 0.62 ± 0.13 | |
| 杉木 Cunninghamia lanceolat | 12 | 510.65 ± 15.06 | 10.88 ± 1.13 | 0.75 ± 0.11 | ||
| 马尾松 Pinus massoniana | 12 | 522.59 ± 15.97 | 14.77 ± 1.68 | 1.02 ± 0.19 | ||
| 木荷 Superba schima | 12 | 490.85 ± 21.55 | 16.42 ± 2.34 | 0.63 ± 0.15 | ||
| 凋落物 Litter | 温带针阔混交林 Temperate needle broad-leaved mixed forest | 14 | 485.47 ± 28.17 | 12.94 ± 1.98 | 0.93 ± 0.21 | |
| 热带季雨林 Tropical monsoon forest | 12 | 504.57 ± 21.96 | 17.05 ± 1.25 | 0.70 ± 0.08 | ||
| 亚热带常绿阔叶林 Subtropical evergreen broad-leaved forest | 6 | 514.12 ± 19.28 | 14.22 ± 2.21 | 0.43 ± 0.12 | ||
| 亚热带湿地松人工林 Subtropical Pinus elliottii plantation | 12 | 526.36 ± 17.97 | 5.63 ± 1.36 | 0.24 ± 0.09 | ||
| 亚热带杉木人工林 Subtropical Cunninghamia lanceolat plantation | 12 | 518.81 ± 16.41 | 7.47 ± 1.36 | 0.29 ± 0.06 | ||
| 亚热带木荷人工林 Subtropical Schima superba plantation | 12 | 486.28 ± 14.82 | 10.89 ± 1.01 | 0.30 ± 0.02 | ||
| 亚热带马尾松人工林 Subtropical Pinus massoniana plantation | 12 | 521.51 ± 16.40 | 7.72 ± 2.10 | 0.36 ± 0.15 | ||
2.2 不同区域森林的生态化学计量学特征
不同区域森林类型的植被的生态化学计量学主要特征见表4。温带针叶林叶片的C : N : P (321 : 13 : 1)显著低于亚热带的人工常绿针叶林(728 : 18 : 1), 亚热带常绿阔叶林叶片(561 : 22 : 1)明显高于热带季雨林(442 : 19 : 1); 凋落物的C : N : P是温带针叶林最低(552 : 14 : 1), 亚热带人工常绿针叶林最高(1 950 : 27 : 1), 亚热带常绿阔叶林凋落物的C : N : P为1 305 : 35 : 1; 热带季雨林凋落物的C : N : P为723 : 24 : 1。
表4 不同森林类型的生态化学计量特征
Table 4
| 森林类型 Forest type | C : N : P |
|---|---|
| 温带针阔混交林 Temperate needle broad-leaved mixed forest | 321 : 13 : 1 |
| 热带季雨林 Tropical monsoon forest | 442 : 19 : 1 |
| 亚热带常绿阔叶林 Subtropical evergreen broad-leaved forest | 561 : 22 : 1 |
| 亚热带人工林 Subtropical plantation forest | 728 : 18 : 1 |
| 温带针阔混交林凋落物 Litter of temperate needle broad-leaved mixed forest | 552 : 14 : 1 |
| 热带季雨林凋落物 Litter of tropical monsoon forest | 723 : 24 : 1 |
| 亚热带常绿阔叶林凋落物 Litter of subtropical evergreen broad-leaved forest | 1 305 : 35 : 1 |
| 亚热带人工林凋落物 Litter of subtropical plantation forest | 1 950 : 27 : 1 |
叶片的C : N在常绿阔叶林和常绿针叶林间差异极显著(p < 0.001, n = 36), 且同一森林类型的针叶林群落间差异显著; 在同一森林群落内, 不同物种之间也有显著差异(p < 0.05, n = 12), 如温带针阔混交林的红松(Pinus koraiensis)与水曲柳(Fraxinus mandschurica)、亚热带常绿阔叶林的云南银柴与其他两树种之间均有显著差异(p < 0.05, n = 12), 热带季雨林的白颜树与云树(Garcinia cowa)之间也存在显著差异(p < 0.05, n = 12)。叶片的C : P在不同森林类型间及同一类型的两个群落间均差异极显著(p < 0.01, n = 12), 其差异性与C : N类似。叶片的N : P也是常绿阔叶树种的白颜树最高(30.10), 亚热带人工林、热带季雨林与亚热带常绿阔叶林的其他植物居中, 温带针阔混交林的紫椴最低(10.99), 除了在亚热带人工林与热带季雨林的针叶与阔叶树种之间有显著差异外, 其余不同地域内的不同群落间无显著差异。亚热带人工林的凋落物的C : N和C : P显著高于其他三地的凋落物, 而不存在显著的林型差异。凋落物的N : P在各森林类型间无显著差异。
综合分析发现, 天然成熟林的C : N和C : P明显低于人工林的对应比值, 本研究中3个区域成熟林的C : N和C : P分别为25-26和321-561, 亚热带人工林的C : N和C : P分别为42和728, 显示不同区域的成熟林的C : N和C : P具有明显的一致性特征(表4)。
2.3 叶片的C、N、P含量及其计量比与气温和降水的关系
在4种森林类型的元素含量与化学计量比中, 植物叶片的C、P含量随着月平均气温的升高而增加, 但只有叶片的C含量与月平均气温的相关关系显著(p < 0.05, n = 126), 叶片的N含量随着月平均气温的升高而降低(图1), 但其相关关系不显著(p > 0.05, n = 126); 植物叶片的C、N、P化学计量与气温的关系是: 叶片的C : N和C : P与月平均气温是负相关关系, 但均不显著(p > 0.05, n = 126), 植物叶片的N : P与月平均气温呈极显著负相关关系(p < 0.01, n = 126)。
图1
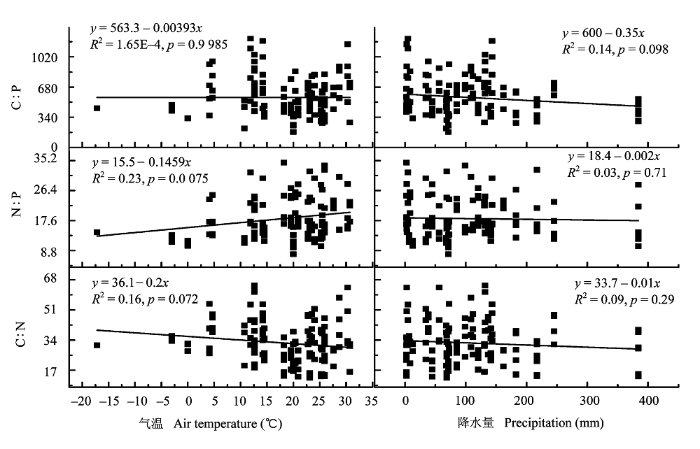
图1
不同区域叶片的碳氮磷计量比与月平均气温与降水量的关系。
Fig. 1
Relationships of C, N, P ratios of leaf in different regions with monthly average air temperature and precipitation.
4个区域植物叶片的C含量与月降水量呈负相关关系, N和P含量与月降水量呈正相关关系, 但这3种相关性均不显著(p > 0.05, n = 126); 植物叶片的C、N、P化学计量比与降水量的关系是: 叶片的C : N、C : P和N : P与月降水量均呈负相关关系, 但相关性不显著(p > 0.05, n = 126)。
2.4 植被N、P养分的再吸收特征
在4个区域的森林类型中, 热带季雨林的N再吸收率特征与亚热带常绿阔叶林类似, 亚热带人工林与温带针阔混交林具有类似的N再吸收特征。亚热带人工常绿针叶林的N再吸收率与落叶阔叶林无显著差异, 温带针阔混交林的常绿针叶树与亚热带常绿阔叶林中的落叶阔叶树间无显著差异(p > 0.05)。但比较而言, 人工成熟林比天然成熟林具有更高的N再吸收率。与之相比, 温带针阔混交林与热带季雨林的P再吸收率整体上低于亚热带人工林与亚热带常绿阔叶林, 但所有森林均保有较高的P再吸收率(图2)。
图2
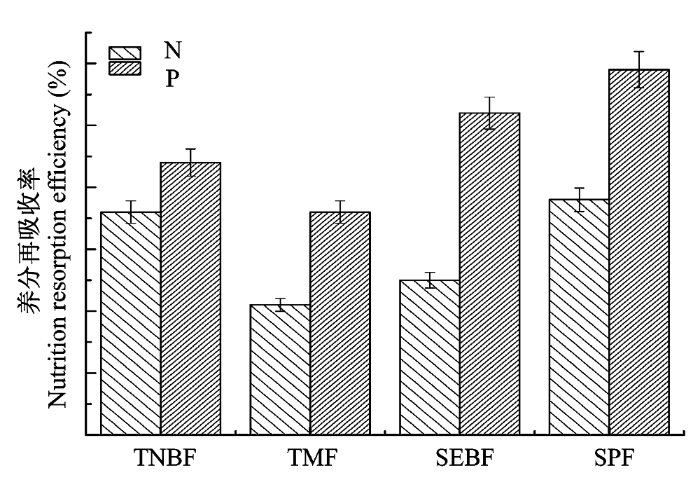
图2
不同区域森林的养分再吸收率(平均值±标准误差, n = 3)。SEBF, 亚热带常绿阔叶林; SPF, 亚热带人工林; TMF, 热带季雨林; TNBF, 温带针阔混交林。
Fig. 2
Nutrition resorption efficiency of forest in different regions (mean ± SE, n = 3). SEBF, subtropical evergreen broad-leaved forest; SPF, subtropical plantation forest; TMF, tropical monsoon forest; TNBF, temperate needle broad-leaved mixed forest.
3 讨论
3.1 化学计量学特征的比较
在本研究中, 温带针阔混交林叶片的C : N : P质量比为321 : 13 : 1 (折合成原子比分别为829 : 29 : 1), 显著低于全球森林叶片的C : N : P原子比 1 212 : 28 : 1 (McGroddy et al., 2004)。亚热带人工林的C : N : P质量比为728 : 18 : 1 (原子比为1 881 : 40 : 1), 亚热带常绿阔叶林的C : N : P质量比为561 : 22 : 1 (原子比为1 449 : 49 : 1), 均显著高于全球水平, 热带季雨林的C : N : P质量比为442 : 19 : 1 (原子比为1 142 : 42 : 1), 与全球水平较一致。温带针阔混交林与热带季雨林凋落物的C : N : P的原子比分别为1 426 : 31 : 1和1 868 : 53 : 1, 显著低于全球森林凋落物的C : N : P原子比(3 007 : 45 : 1; McGroddy et al., 2004), 亚热带人工林和亚热带常绿阔叶林凋落物的C : N : P原子比分别为5 038 : 60 : 1和3 371 : 78 : 1, 均高于全球森林凋落物的C : N : P原子比。与我国大尺度草原区的研究结果(He et al., 2006, 2008)相比, 本研究中除了热带季雨林的白颜树的C : N (14.41)低于草原区叶片的C : N平均值(17.9), 其他所有树种的C : N均明显高于草原叶片的C : N平均值; 草原区叶片N : P的平均值 (15.30)稍高于本研究中温带针阔混交林所有树木的N : P (11.05-14.94), 也高于亚热带人工林的马尾松(Pinus massoniana) (14.71)与杉木(Cunninghamia lanceolata) (14.70), 与热带季雨林的梭果玉蕊(Barringtonia fusicarpa) (15.22)接近, 但是比本研究中亚热带常绿阔叶林的树种都小, 也小于亚热带人工林与热带季雨林的其他树种。
通过对比亚热带人工林与亚热带常绿阔叶林(刘兴诏等, 2010)的马尾松与木荷(Schima superba)发现, 亚热带人工林的马尾松与亚热带常绿阔叶林的马尾松叶片的全P含量相近, 但是其N含量只相当于鼎湖山马尾松叶片N含量的2/3, 从而使得亚热带人工林马尾松叶的N : P为14.48, 而亚热带常绿阔叶林的同类比值为22.70。亚热带人工林的木荷与亚热带常绿阔叶林的针阔混交林的比较发现, 亚热带人工林中木荷的N、P含量均比亚热带常绿阔叶林中同类植物的含量低, 但由于P含量相对更低, 因此亚热带人工林的N : P反而比亚热带常绿阔叶林的高。
Han等(2005)的研究结果表明, 中国不同温度带的753种陆生植物叶片的N : P的几何平均值为14.4, 大于温带针阔混交林的N : P (12.51), 但小于其他3个区域森林类型的N : P (平均值为19.19)。与全球植被叶片的平均N : P (Reich & Oleksyn, 2004)相比, 同样只有温带针阔混交林的N : P平均值小于全球平均值13.8, 其他3个区域的树木平均值则远高于全球平均值。具体到树种, 只有温带针阔混交林的红松与紫椴的N : P (11.79和11.05)低于全球平均值, 其他所有树种的N : P均高于全球平均值。在区域尺度上, 叶片的C : N : P在区域内的不同生境、不同树种之间均具有比较大的分异特征, 这主要与不同地点的温度和水分供应有关(McGroddy et al., 2004; Reich & Oleksyn, 2004; Han et al., 2005)。
从全球的研究结果来看: 从热带常绿林到温带落叶林, 直至寒带针叶林的地带性梯度上, 叶片的C : N、C : P和N : P逐次降低(Reich & Oleksyn, 2004; Han et al., 2005; Liu et al., 2006)。本研究中也基本存在这种趋势, 但由于树种选择的差别, 热带季雨林与亚热带常绿阔叶林的变化与全球的结果并不完全相同(McGroddy et al., 2004; 张林和罗天祥, 2004; Niklas, 2006), 且本研究中亚热带人工林的化学计量比基本高于同纬度区域的天然林。从本研究也可以看出, 在较小尺度上, 分布在同一地区的不同植被, 由于生活型的差异, 如温带针阔混交林中常绿针叶林的叶片的C : N、C : P高于落叶阔叶林; 亚热带人工林叶片的C : N显著高于亚热带常绿阔叶林与热带季雨林, 亚热带湿地松人工林的C : N与C : P最高, 此现象既反映了人工林植物叶片具有较高的C含量, 也表明在单位N、P养分条件下, 人工林植物的叶片建成效率显著高于天然成熟林植物, 当然这可能也与亚热带人工林的林龄比天然成熟林低有关。
3.2 不同生活型森林植物的N、P养分适应特征
研究表明, 不同生活型植物叶片的养分含量存在明显差异(Aerts, 1996; Aerts & Chapin, 2000; Liu et al., 2006), 通常落叶树叶片的养分含量高于常绿树, 阔叶树的养分含量高于针叶树。但本研究也发现有例外情况, 如亚热带常绿阔叶林的锥栗(Castanea henryi)的N含量小于本区域内的其他2个树种。本研究中低纬度地区植物的P含量显著低于高纬度地区的植物, 意味着低纬度地区树种较低的P吸收效率, 即: 与高纬度植物相比, 其吸收同等单位P可生产更多的叶生物量(Aerts, 1996; 孙书存和陈灵芝, 2001)。
研究表明, 相对而言, 低纬度地区的植物更易受P的限制, 高纬度地区的植物更易受N的限制, 被认为应具有更高的P或N再吸收效率(Chapin & Moilanen, 1991; Aerts & Chapin, 2000)。但是, 本研究的N、P养分再吸收结果并不完全支持上述结论, 即: 虽然亚热带人工林与亚热带常绿阔叶林比温带针阔混交林有更高的P再吸收效率, 但热带季雨林的P再吸收率低于温带针阔混交林; 而且温带针阔混交林的N再吸收效率虽高于亚热带常绿阔叶林与热带季雨林, 但低于处于低纬度的亚热带人工林。与阎恩荣等(2010)的研究结果相比, 本研究中的常绿阔叶林N的养分再吸收率略低, 而P的养分再吸收率明显较高; 本研究中常绿针叶林的N、P养分再吸收率均较高, 这可能与两地的树种组成差异相关。因此, 受N或P限制的植被并不一定具有高的N或P再吸收率, 不能简单地由植物叶片的某种养分含量低推导出生境中的相关养分供应不足, 或植被具有更高的养分再吸收效率。由此可见, 植被较高的N、P养分转移率可能并不是植物对N、P养分胁迫的一种重要适应机制(阎恩荣等, 2010)。Killingbeck (1996)认为: 在系统进化上较近的植物具有相似的养分转移率, 养分转移可能只是物种固有的特征, 植物的遗传差异可能是影响叶片衰老前后养分转移的主要因素(Oleksyn et al., 2003; Luyssaert et al., 2005)。
3.3 叶片N和P的计量关系与月平均气温和降水量的关系
虽然叶片的N、P含量和C : N : P反映了植物对当地营养条件的适应, 但研究表明, 叶片的N、P含量和C : N : P仍然存在大尺度尤其是全球尺度的变化规律。Reich和Oleksyn (2004)对全球452个样点的研究发现, 随着年平均气温的升高, 叶片的N和P含量降低, 而N : P升高; 从热带到寒冷干旱的中纬度地区, N和P的含量升高, 这主要是由与温度有关的植物生理计量学和土壤年龄的生物地理梯度引起的; 越靠近赤道区域, 随着年平均气温的升高, N : P升高, 这是由于P是古老的热带土壤的主要限制因素, 而N是年轻的温带土壤和高纬度土壤的主要限制因素(Reich & Oleksyn, 2004; Lambers et al., 2008)。本研究中N和P的含量并不随温度的升高而降低, 而是N : P与温度的关系显著, 这与Reich和Oleksyn (2004)在全球尺度的研究结果基本一致; 但是与任书杰等(2007)与Han等(2005)在中国尺度的研究结果并不一致, 可能与区域较小、代表性树种数量有限有关系。在热带地区, 年降水量在1 500 -5 000 mm之间变化, 叶片的N : P与降水量也没有相关性(Townsend et al., 2007), 这与本研究结果较一致。
4 结论
1)亚热带人工林与其他区域的天然成熟林相比具有更高的C : N与C : P, 说明在相同的N、P养分条件下, 人工林植物叶片的碳固定效率要高于天然林, 这可能与人工林林龄较小有关; 同时, 即使3个站点在空间区域上差异较大, 但3个区域天然成熟林植物叶片的C : N与C : P较为相近, 反映了成熟林碳氮磷化学计量比趋同的特征;
2)月平均温度与4个典型森林类型叶片的N : P具有较好的线性相关关系, 但与森林叶片的C : N和C : P并没有显著的线性相关关系;
3) 4种典型森林类型的N和P养分再吸收效率与当地土壤的养分状况并不完全一致, 土壤的N、P含量低并不一定导致当地植物的N、P再吸收效率高, 养分再吸收效率可能与物种的遗传属性更加相关;
4)依靠树木的生活型(常绿阔叶、常绿针叶、落叶阔叶和落叶针叶等森林类型)并不能直接判断某一树种的化学计量比, 因为植物的化学计量比不完全依赖于其生活型。
致谢
国家自然科学基金(30670312)、国家科技部 “973”计划(2010CB833503)和中国科学院创新方向项目(KZCX2-YW-QN301)资助。
参考文献
Nutrient resorption from senescing leaves of perennials: Are there general patterns?
The mineral nutrition of wild plants revisited: a re-evaluation of processes and patterns
Stoichiometry and nutrition of plant growth in natural communities
Seasonal changes in nitrogen and phosphorous fractions and autumn retranslocation in evergreen and deciduous Taiga trees
Nutritional controls over nitrogen and phosphorus resorption from alaskan birch leaves
Recuperation of nitrogen cycling in Amazonian forests following agricultural abandonment

Phosphorus (P) is generally considered the most common limiting nutrient for productivity of mature tropical lowland forests growing on highly weathered soils. It is often assumed that P limitation also applies to young tropical forests, but nitrogen (N) losses during land-use change may alter the stoichiometric balance of nutrient cycling processes. In the Amazon basin, about 16% of the original forest area has been cleared, and about 30-50% of cleared land is estimated now to be in some stage of secondary forest succession following agricultural abandonment. Here we use forest age chronosequences to demonstrate that young successional forests growing after agricultural abandonment on highly weathered lowland tropical soils exhibit conservative N-cycling properties much like those of N-limited forests on younger soils in temperate latitudes. As secondary succession progresses, N-cycling properties recover and the dominance of a conservative P cycle typical of mature lowland tropical forests re-emerges. These successional shifts in N:P cycling ratios with forest age provide a mechanistic explanation for initially lower and then gradually increasing soil emissions of the greenhouse gas nitrous oxide (N(2)O). The patterns of N and P cycling during secondary forest succession, demonstrated here over decadal timescales, are similar to N- and P-cycling patterns during primary succession as soils age over thousands and millions of years, thus revealing that N availability in terrestrial ecosystems is ephemeral and can be disrupted by either natural or anthropogenic disturbances at several timescales.
Organism size, life history, and N : P stoichiometry
N : P ratios in terrestrial plants: variation and functional significance
Leaf nitrogen and phosphorus stoichiometry across 753 terrestrial plant species in China
Stoichiometry and large-scale patterns of leaf carbon and nitrogen in the grassland biomes of China
Leaf nitrogen: phosphorus stoichiometry across Chinese grassland biomes
Leaf N and P stoichiometry covaries with many aspects of plant biology, yet the drivers of this trait at biogeographic scales remain uncertain. Recently we reported the patterns of leaf C and N based on systematic census of 213 species over 199 research sites in the grassland biomes of China. With the expanded analysis of leaf P, here we report patterns of leaf P and N:P ratios, and analyze the relative contribution of climatic variables and phylogeny in structuring patterns of leaf N:P stoichiometry. Average values of leaf P and N:P ratio were 1.9 mg g(-1) and 15.3 (mass ratio), respectively, consistent with the previous observation of a higher N:P ratio in China's flora than the global averages (ca. 13.8), resulting from a lower leaf P. Climatic variables had very little direct correlation with leaf P and N:P ratios, with growing season precipitation and temperature together explaining less than 2% of the variation, while inter-site differences and within-site phylogenetic variation explained 55 and 26% of the total variation in leaf P and N:P ratios. Across all sites and species, leaf N and P were highly positively correlated at all levels. However, the within-site, within-species covariations of leaf N and P were weaker than those across sites and across species. Leaf N and P relationships are driven by both variation between sites at the landscape scale (explaining 58% of the variance) and within sites at the local scale (explaining 24%), while the climatic factors exerted limited influence (explaining less than 3%). In addition, leaf N:P ratios in two dominant genera Kobresia and Stipa had different responses to precipitation. This study suggests that geographic variation and between-species variation, rather than climatic variation, are the major determinants of grassland foliar stoichiometry at the biome level.
Effects of nitrogen enrichment on phosphatase activity and nitrogen: phosphorus relationships in Cladonia portentosa
*Relationships between nitrogen deposition in the UK and phosphomonoesterase (PME) activity and nitrogen (N) and phosphorus (P) concentrations in Cladonia portentosa were quantified to understand factors limiting lichen growth and to further develop biomarkers for N pollution. *Lichen was collected from sites differing either in rates of wet N (NH(4)(+) + NO(3)(-)) deposition or in annual mean N concentration in rainfall based on both measured and modelled data sets. The PME activity, and total N and P concentrations were measured in specific horizontal strata in lichen mats and PME activity in the thallus was located using an enzyme-labelled fluorescent phosphatase substrate. *With an increase in modelled N deposition from 4.1 to 32.8 kg N ha(-1) yr(-1), PME activity, thallus N and N : P ratio increased by factors of 2.3, 1.4 and 1.8, respectively. Correlations with modelled data were generally stronger than with measured data and those with N deposition were stronger than those with N concentration in rainfall. The PME activity was located solely in the lichen fungus in outer regions of the thallus. *Nitrogen enrichment changes lichen N : P ratios from values typical of N limitation (for example, 10) to those indicative of P limitation (for example, 26) driving upregulation of PME activity.
Nutrients in senesced leaves: keys to the search for potential resorption and resorption proficiency
The vegetation N : P ratio: a new tool to detect the nature of nutrient limitation
Plant nutrient-acquisition strategies change with soil age
Nitrogen (N) tends to limit plant productivity on young soils; phosphorus (P) becomes increasingly limiting in ancient soils because it gradually disappears through leaching and erosion. Plant traits that are regarded as adaptations to N- and P-limited conditions include mycorrhizas and cluster roots. Mycorrhizas 'scavenge' P from solution or 'mine' insoluble organic N. Cluster roots function in severely P-impoverished landscapes, 'mining' P fixed as insoluble inorganic phosphates. The 'scavenging' and 'mining' strategies of mycorrhizal species without and non-mycorrhizal species with cluster roots, respectively, allow functioning on soils that differ markedly in P availability. Based on recent advances in our understanding of these contrasting strategies of nutrient acquisition, we provide an explanation for the distribution of mycorrhizal species on less P-impoverished soils, and for why, globally, cluster-bearing species dominate on severely P-impoverished, ancient soils, where P sensitivity is relatively common.
Leaf litter nitrogen concentration as related to climatic factors in Eurasian forests
N and P stoichiometry of plant and soil in lower subtropical forest successional series in southern China
Does the commonly used estimator of nutrient resorption in tree foliage actually measure what it claims to?
A descriptive temporal model is considered to be the best available estimator for accretion, resorption and proportional nutrient resorption. However, ecological studies rarely collect sufficient data for applying such a model. A less-demanding and commonly used estimator for proportional resorption (PR) calculates PR as the percentage of the nutrient pool that is withdrawn from mature foliage before leaf abscission. Data from an intensive sampling campaign of the aboveground nutrient pools and fluxes of two Betula pendula Roth. stands were used. We showed that the commonly used estimator is not an accurate estimator for accretion, resorption and proportional resorption. The commonly used estimator underestimated the proportional resorption of N on the average by 3-10%, and the proportional resorption of P by 20-25%. The low accuracy of the estimations was shown to be caused by a lack of selectiveness of the commonly used estimator. In other words, the commonly used estimator does not measure the underlying processes in specific nutrient accretion and resorption at the stand level. However, when a sufficiently high sampling density with several samples at a given point in time is used, then the commonly used estimator preserves the ranking relationship between the PR of different sites for N in 97% of the cases and for P in 71%. The commonly used estimator can thus be used in comparative studies as an index for proportional nutrient resorption only. The quantitative results should not be taken literally, as they are based on only two sets of observations. However, the results show that the commonly used estimator should no longer be used as a measure for accretion, resorption or PR whenever the plant accretes nutrients in the foliage as a compensation for nutrient losses due to foliar leaching and litterfall during the growing season.
Scaling of C : N : P stoichiometry in forests worldwide: implications of terrestrial redfield-type ratios
Does the gradualness of leaf shedding govern nutrient resorption from senescing leaves in Mediterranean woody plants?
The resorption of nutrients from senescing leaves is a key component of the nutrient conservation strategy of plants. Despite its relevance, the regulation of the efficiency of this process is poorly understood. The aim of this work was to test the hypothesis that species that shed leaves gradually along the year are less efficient reabsorbing nutrients from senescing leaves than species that shed leaves in a short period. N-, P-, and K-resorption-efficiencies were measured in 11 Mediterranean species and regressed against an index of the gradualness of leaf shedding. Additionally, the bivariate relations among leaf nutrient content before senescence, nutrient content in senesced leaves, pool of nutrients reabsorbed during senescence, and nutrient resorption efficiency, were examined. K-resorption-efficiency was markedly lower in species with protracted leaf-shedding, in agreement with the initial hypothesis. This pattern was less significant for N- and P-resorption-efficiencies. When leaf nutrient content before senescence was high, the amount of nutrients reabsorbed and the amount of nutrients in senesced leaves were high. Consequently, nutrient resorption efficiency was unaffected by the leaf nutrient status before senescence. It is concluded that the leaf shedding pattern per se influences nutrient resorption in Mediterranean perennials, irrespective of additional environmental controls. Furthermore, it is suggested that plants differing in nutrient status do not exhibit different nutrient resorption efficiencies because the nutrient content of leaves before senescence affects the components of resorption efficiency in countervailing ways.]]>
Soil acidity, ecological stoichiometry and allometric scaling in grassland food webs
Plant allometry, leaf nitrogen and phosphorus stoichiometry, and interspecific trends in annual growth rates
BACKGROUND: Life forms as diverse as unicellular algae, zooplankton, vascular plants, and mammals appear to obey quarter-power scaling rules. Among the most famous of these rules is Kleiber's (i.e. basal metabolic rates scale as the three-quarters power of body mass), which has a botanical analogue (i.e. annual plant growth rates scale as the three-quarters power of total body mass). Numerous theories have tried to explain why these rules exist, but each has been heavily criticized either on conceptual or empirical grounds. N,P-STOICHIOMETRY: Recent models predicting growth rates on the basis of how total cell, tissue, or organism nitrogen and phosphorus are allocated, respectively, to protein and rRNA contents may provide the answer, particularly in light of the observation that annual plant growth rates scale linearly with respect to standing leaf mass and that total leaf mass scales isometrically with respect to nitrogen but as the three-quarters power of leaf phosphorus. For example, when these relationships are juxtaposed with other allometric trends, a simple N,P-stoichiometric model successfully predicts the relative growth rates of 131 diverse C3 and C4 species. CONCLUSIONS: The melding of allometric and N,P-stoichiometric theoretical insights provides a robust modelling approach that conceptually links the subcellular 'machinery' of protein/ribosomal metabolism to observed growth rates of uni- and multicellular organisms. Because the operation of this 'machinery' is basic to the biology of all life forms, its allometry may provide a mechanistic explanation for the apparent ubiquity of quarter-power scaling rules.
Nutrient resorption from senescing leaves of the clonal plant Linnaea borealis in relation to reproductive state and resource availability
Nutrient conservation increases with latitude of origin in European Pinus sylvestris populations
or = 0.67, P
Global patterns of plant leaf N and P in relation to temperature and latitude
Leaf nitrogen and phosphorus stoichio- metry across 654 terrestrial plant species in NSTEC
Shifts in leaf N : P ratio during resorption reflect soil P in temperate rainforest
Leaf nutrient dynamics and resorption efficiency of Quercus liaotungensis in the Dongling Mountain region
Use of nitrogen to phosphorus ratios in plant tissue as an indicator of nutrient limitation and nitrogen saturation
Controls over foliar N : P ratios in tropical rain forests
Correlations between foliar nutrient concentrations and soil nutrient availability have been found in multiple ecosystems. These relationships have led to the use of foliar nutrients as an index of nutrient status and to the prediction of broadscale patterns in ecosystem processes. More recently, a growing interest in ecological stoichiometry has fueled multiple analyses of foliar nitrogen:phosphorus (N:P) ratios within and across ecosystems. These studies have observed that N:P values are generally elevated in tropical forests when compared to higher latitude ecosystems, adding weight to a common belief that tropical forests are generally N rich and P poor. However, while these broad generalizations may have merit, their simplicity masks the enormous environmental heterogeneity that exists within the tropics; such variation includes large ranges in soil fertility and climate, as well as the highest plant species diversity of any biome. Here we present original data on foliar N and P concentrations from 150 mature canopy tree species in Costa Rica and Brazil, and combine those data with a comprehensive new literature synthesis to explore the major sources of variation in foliar N:P values within the tropics. We found no relationship between N:P ratios and either latitude or mean annual precipitation within the tropics alone. There is, however, evidence of seasonal controls; in our Costa Rica sites, foliar N:P values differed by 25% between wet and dry seasons. The N:P ratios do vary with soil P availability and/or soil order, but there is substantial overlap across coarse divisions in soil type, and perhaps the most striking feature of the data set is variation at the species level. Taken as a whole, our results imply that the dominant influence on foliar N:P ratios in the tropics is species variability and that, unlike marine systems and perhaps many other terrestrial biomes, the N:P stoichiometry of tropical forests is not well constrained. Thus any use of N:P ratios in the tropics to infer larger-scale ecosystem processes must comprehensively account for the diversity of any given site and recognize the broad range in nutrient requirements, even at the local scale.
N : P ratio and the nature of nutrient limitation in Calluna-Dominated Heathlands
Ecosystem properties and forest decline in contrasting long-term chronosequences
During succession, ecosystem development occurs; but in the long-term absence of catastrophic disturbance, a decline phase eventually follows. We studied six long-term chronosequences, in Australia, Sweden, Alaska, Hawaii, and New Zealand; for each, the decline phase was associated with a reduction in tree basal area and an increase in the substrate nitrogen-to-phosphorus ratio, indicating increasing phosphorus limitation over time. These changes were often associated with reductions in litter decomposition rates, phosphorus release from litter, and biomass and activity of decomposer microbes. Our findings suggest that the maximal biomass phase reached during succession cannot be maintained in the long-term absence of major disturbance, and that similar patterns of decline occur in forested ecosystems spanning the tropical, temperate, and boreal zones.
N : P stoichiometry in secondary succession in evergreen broad-leaved forest, Tiantong, East China
C : N : P stoichiometry across evergreen broad-leaved forests, evergreen coniferous forests and deciduous broad-leaved forests in the Tiantong region, Zhejiang Province, eastern China
Advances in ecological studies on leaf lifespan and associated leaf traits
