


随着大气温室气体含量上升, 全球气温变暖, 气候模式发生显著变化, 在一定程度上影响了植物的现实与潜在空间分布格局, 从而导致了一系列生态与社会效能的连锁反应(Thuiller et al., 2005)。因此, 有必要对我国植物未来潜在空间分布的发展趋势进行研究, 以预估并积极应对气候变化所造成的影响。
传统的动植物物种调查方法已经不能满足较大时空尺度内物种分布特征格局模拟和预测的需要, 因此, 综合应用地理信息系统、统计学以及生态学的物种空间分布模型应运而生, 并在近年得到长足发展, 成为模拟和预测区域物种空间分布特征的有效工具(Guisan & Thuiller, 2005)。在空间尺度较大且缺乏详细观测数据的情况下, 通常采用统计模型研究植物的潜在分布范围。统计模型是通过分析采样数据与生态环境因子之间的关系, 以环境空间检测样点与已知样点之间的相似性为依据来模拟植物潜在空间分布的。目前, 在基于不同方法与模型考虑空间依赖性的植物分布模拟研究中, 着重考虑气候要素(作为主导驱动因子)对较大时空尺度内植物潜在分布的影响, 而疏于考虑诸如土壤因子等相对气候要素而言变化速率缓慢的环境限制因子(Loehle & LeBlanc, 1996; Miller et al., 2007; Segarra et al., 2009; Tsuyama et al., 2011)。有关土壤要素对植物分布影响的综合评价研究(Pearson et al., 2002; Lehmann et al., 2003)表明, 在全球气候变化背景下, 土壤质地(Ashcroft et al., 2011)、土壤养分(He et al., 1999)、土壤蓄水能力(Coops et al., 2005)等属性对植物分布及其模拟准确率有显著影响, 因此有可能造成评价全球气候变化对植物分布格局变化影响的不确定性。
毛竹(Phyllostachys edulis)是我国南方重要的森林资源与经济作物(Song et al., 2011), 具有生长速度快、可以隔年连续采伐及永续利用等特点, 其特有的巨大生态价值、经济与社会价值引起了国内外多领域科研工作者的广泛关注(Oppel et al., 2004; 谢寅峰等, 2007; Viña et al., 2008, 2010; Donald et al., 2009; 李腾飞和李俊清, 2009; Nath et al., 2009; Veldman et al., 2009; Yen et al., 2010; 刘君良等, 2011; 涂利华等, 2011; 庄明浩等, 2011)。毛竹是多年生常绿树种, 适宜温暖湿润的气候条件, 对土壤的要求高于一般树种, 在厚层肥沃、湿润、排水和透气性良好的酸性砂质壤土上生长良好。张雷等(2011)通过耦合DOMAIN (Carpenter et al., 1993)和NeuralEnsembles (O’hanley, 2009)模型预测我国毛竹潜在分布, 指出未来气候变化将导致毛竹适宜生长区向北迁移33-266 km, 面积增加7.4%-13.9%。该研究为气候变化背景下毛竹潜在空间分布模拟提供了重要的研究思路与理论支持。本文以我国毛竹为研究对象, 在前人研究基础上, 将土壤因子引入模拟变量中, 基于支持向量机(Support Vector Machine, SVM)方法的物种分布模型, 利用政府间气候变化专门委员会(IPCC)发布的加拿大气候模型与分析中心全球耦合模式的第三个版本(CGCM3)历史与未来气候情景模式数据, 模拟1981-2099年我国毛竹的潜在空间分布及变化趋势。本研究通过比较考虑土壤限制前后模型模拟的精度、因子重要性及潜在分布的时空格局等, 探究土壤要素对毛竹潜在空间分布的影响, 对毛竹等高生态与经济价值植物在气候变化背景下潜在空间分布模拟的理论与方法进行补充与完善。
1 数据来源及处理
1.1 毛竹地理分布数据
本研究所使用的毛竹林现实空间分布数据来源于中国科学院植物研究所绘制的1:100万植被图(中国科学院中国植物图编委会, 2001), 该植被图基本反映了20世纪80、90年代植被分布状况。从此图中提取的毛竹现实空间分布图层显示, 我国毛竹林分布范围为23.57°-31.91° N、103.95°-121.70° E, 总面积约为2.2 × 10⁴ km2, 主要分布在浙江、福建、四川、湖南等南方省份。对毛竹矢量图层进行栅格化处理, 空间分辨率设为10 km × 10 km, 得到共计223个毛竹林现实分布栅格单元, 用于物种分布模型模拟训练与检验。
1.2 气候变量
为保证用于物种分布模型训练的历史气候数据与用于模型预测的未来气候数据的一致性, 本研究所使用的气温和降水数据来源于IPCC数据发布中心发布的CGCM3历史气候数据(1980-2000年)和未来气候情景模式A2气候数据(2001-2099年)。CGCM3为加拿大气候模型与分析中心全球耦合模式的第三个版本, 是Hadley气候预测和研究中心发展的海气耦合模型。气候情景模式A2描述了具有区域性外向型经济的异质性世界, 全球CO2浓度由2000年的380 μmol·mol-1增加到2080年的700 μmol·mol-1, 同时温度增加了2.8 ℃ (Thuiller et al., 2005)。在众多未来气候情景模式中, 本研究所引用的A2模式气温增加最为显著, 该气候条件下模拟得到的我国毛竹潜在分布区向北迁移更加明显, 结合我国南北土壤条件差异, 更易于体现土壤因子在毛竹潜在分布模拟中的限制作用。
在气候要素选择上, 我们参考张雷等(2011)在预测我国毛竹潜在分布中所选的9个具有明显生物学意义的气候预测变量, 包括夏季5-9月降水量、年降水量、气温年较差、最暖月平均气温、最冷月平均气温、<0 ℃年积温、>18 ℃年积温、>5 ℃年积温和年平均气温。本研究所使用的CGCM3原始月均气温和降水数据为grid格式, 空间分辨率为2.8°, 先将其转化为文本格式, 提取我国区域内数据点, 结合我国数字高程模型(DEM), 利用ANUSPLIN软件包(朱求安等, 2010)进行空间插值, 得到空间分辨率为10 km × 10 km、时间分辨率为月的气温和降水栅格数据集。在此基础上, 计算上述各气候变量中每年的气温平均值、气温极值、积温、累计降水等, 进一步得到1981-2099年6个时间段(1981-2000, 2001- 2020, 2021-2040, 2041-2060, 2061-2080, 2081- 2099)的各气候变量平均值。
1.3 土壤变量
本研究中, 我们以FAO提供的1:500万全球土壤图为基础, 选取与毛竹生长紧密相关的土壤因子。FAO全球土壤图源于样地调查得到的土壤剖面信息, 按FAO土壤单位和表层土壤质地对土壤剖面数据进行分组, 分别对土壤表层(0-30 cm)和底层(30-100 cm)众多理化属性进行加权统计计算。考虑到毛竹适宜土壤的质地、酸碱程度及营养状况等(李国庆等, 1983; 徐家琦和秦海清, 2003), 本研究选取砂粒含量(%)、土壤pH、有机碳含量(%)、氮含量(%) 4个土壤属性, 得到土壤上下层共8个因子作为模拟毛竹潜在空间分布的土壤因子(Stoner & Baumgardner, 1981)。FAO全球土壤数据为矢量格式, 分别对我国范围内表层与底层土壤的选定属性进行矢量数据栅格化处理, 栅格分辨率为10 km × 10 km, 以匹配物种分布模型中植物与气候输入数据。
2 研究方法
2.1 支持向量机模型
Vapnik于1995年提出的支持向量机(SVM)是一种新的机器学习算法。该方法从统计学习理论发展而来, 主要是针对小样本数据学习、分类和预测而设计的一种方法(Cristianini & Scholkopf, 2002)。SVM模型设计可用来解决两类分类问题, 其基本原理是在特征空间寻找一个超平面来最大化地将两类目标分离。本研究中由于仅有竹类现实存在的栅格单元, 因此采用Schölkopf等(1999)提出的单类别支持向量机(one-class SVM)方法。
基于one-class SVM方法的物种分布模型较其他物种分布模型具有的显著优点包括通过寻找超球面的边界来划分数据, 对数据的概率密度分布没有假设, 解决了当输入数据不满足正态分布或数据不足时无法验证是否满足这一分布的问题; 不需要生成“假设”无物种分布数据点, 无需大量的模拟来进行负数据的潜在分布的抗差估计, 特别适合于无物种分布数据点不可信或实际意义不大的状况。关于one-class SVM原理的详细介绍见Guo等(2005)文献。本文使用ModEco软件(Guo & Liu, 2010)所提供的one-class SVM模型, 利用我国毛竹现实分布及其所在位置气候因子与土壤因子的同时段同分辨率数据, 建立我国毛竹适宜生长的环境条件规则, 并以此适宜条件规则监测其他地区, 判断现实中无毛竹分布区域的气候与土壤条件是否适合毛竹生长, 即毛竹潜在分布区域, 并以此模拟我国毛竹潜在分布的时空分布, 并分析和评价气候和土壤各个因子及因子交互作用对模拟结果的影响。
2.2 模型模拟及评估
本研究把不同模拟因子分为两组对毛竹潜在分布进行模拟: 第一组仅包含气候因子, 共有6个时段的数据集, 每个数据集包含9个气候因子; 另一组同时包含气候因子和土壤因子, 同为6个时段的数据集, 每个数据集包含9个气候因子及8个土壤因子。两组模拟中的气候与土壤因子空间分辨率均与毛竹现实分布数据一致。SVM模型基于毛竹现实分布栅格训练样点, 分别用两组模拟因子的1981- 2000年数据集进行模型训练, 建立分类规则, 并得到该时段毛竹潜在分布区。然后基于完成训练的模型所建立的分类规则分别利用两组模拟因子的2001-2099年5时段数据集对未来毛竹潜在分布区进行模拟。
为比较两组模拟因子参与模型的模拟质量, 我们选用真阳性率和受试者工作特征曲线(Receiver Operating Characteristic curve, 简称ROC曲线)两种方法对模拟结果进行评价。真阳性率(true positive rate, TPR) (Elith & Burgman, 2002), 又称为灵敏度(sensitivity, SEN), 在物种分布模型评价中指实际有物种分布, 而且按照该模型试验的标准, 被正确地判断为有该物种分布的百分比。理论上讲, 一个好的模型的模拟结果不仅应当有较高的真阳性率, 而且应当有较高的真阴性率(true negative rate, TNR), 即实际无物种分布被正确地判断为无该物种分布的百分比。当仅有物种分布数据时, 无法估计真阴性率, 只有借助这一指标对物种分布模拟结果的优劣做出评价。研究中通过交叉验证得到的精度表示了真阳性率。十层交叉验证方法的基本步骤: 首先, 训练数据被随机分为大小相等的10个子集; 其次, 每一个子集轮流用来精度评价, 其他的9个子集用来训练样本; 最后, 总的精度通过取每次验证精度的平均值得到。Fielding和Bell (1997)将ROC曲线引入到生态模型评估中, ROC曲线计算不同阈值正确模拟存在的百分率和正确模拟不存在的百分率, 然后将正确模拟存在的百分率和正确模拟不存在的百分率分别在y和x轴上表示, 通过比较曲线和45°线(表示物种处于随机分布状态)之间的面积(area under the ROC curve, AUC)确定模型的精度(Hanley & McNeil, 1982)。AUC值越大表示其分布与随机分布的差别越大, 环境因子与物种分布模型之间的相关性越大, 即模型模拟效果越好。
3 结果和讨论
3.1 模型模拟精度评估
基于前文所述的毛竹现实分布样点、SVM模型和两组模拟因子, 我们分别得到土壤因子参与前后1981-2000年我国毛竹潜在分布模拟的结果。通过十层交叉验证方法, 评价基于两组模拟因子的模型模拟精度(表1), 结果仅使用气候驱动因子的模拟和同时使用气候因子及土壤限制因子的模型模拟结果都具有较高的真阳性率, 其中不考虑土壤限制的模型模拟精度略高, 模拟精度为0.9948。仅考虑气候因子模拟结果面积比同时考虑气候因子和土壤因素限制的模拟结果多1440个栅格, 但不考虑土壤限制模拟结果的AUC值比考虑土壤限制模拟结果的AUC值要低一些, 表明其模拟效果比后者要差。由于毛竹生长与气候、土壤要素均有较强的相关性, 同时考虑气候与土壤影响更能反映真实的自然条件, 同时考虑气候与土壤要素可优化SVM模型对毛竹潜在空间分布的模拟效果。
表1 1981-2000年毛竹潜在分布的模拟结果评价
Table 1
| 无土壤限制 Without soil constrain | 有土壤限制 With soil constrain | |
|---|---|---|
| 模拟栅格数 Grid number of simulation | 27 358 | 25 918 |
| 真阳性率 True positive rate | 0.994 8 | 0.988 6 |
| 受试者工作特征曲线下面积 Area under receiver operating characteristic curve | 0.916 8 | 0.925 1 |
为评价气候因子与土壤因子对毛竹潜在分布模拟的影响, 我们采用如下方法对各个模拟因子进行了因子重要性分析: 首先, 我们以1981-2000年所有气候与土壤因子作为整体因子组, 从中选取一个待评价因子, 将其从整体因子组中剔除, 利用剩余因子进行模型模拟, 得到交叉验证后毛竹潜在分布模拟的真阳性率; 随后再用被剔除的待评价因子进行毛竹潜在分布模拟, 得到交叉验证的真阳性率。我们认为, 当某一因子具有较强的独立模拟毛竹潜在分布能力且缺少该因子后整体因子组模拟结果精度显著下降时, 该因子在模拟中具有较重要作用。对有所模拟因子逐一处理, 得到各因子重要性分析结果, 如图1所示。
图1
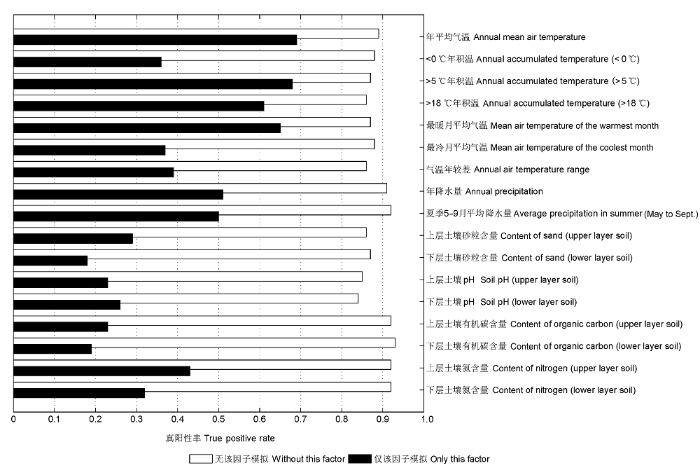
结果表明, 在毛竹潜在分布模拟中, 气候因子起主导作用, 而土壤因子以限制作用为主。气候因子中, 气温相关因子较降水相关因子对模型模拟影响更为明显, 特别是年平均气温、> 5 ℃积温、最暖月平均气温和> 18 ℃积温等表征温暖程度的模拟因子, 不仅具有较强的独立模拟毛竹潜在分布能力(真阳性率均高于0.6), 且当缺少这些因子时, 模拟结果较整体因子组模拟结果(真阳性率为0.9886)均呈现明显下降, 表明与温暖程度相关的气温因子对毛竹潜在分布的影响最大, 也可能使其成为全球变化条件下毛竹潜在分布变化的重要主导因子。与气候因子相比, 土壤因子中表征土壤质地(土壤沙粒含量)和酸碱性(土壤pH)因子虽然自身的独立模拟毛竹潜在分布能力较弱(均低于0.3), 但缺少这些因子时整体因子组模拟结果精度同样表现为明显下降, 且不及缺少主导气温因子的模拟结果。该结果表明在气候条件起主导作用的条件下, 土壤质地与酸碱性属性对于毛竹潜在分布有明显的限制作用, 直接影响区域尺度上模型模拟结果的空间异质性。表征水分条件的因子(年平均降水和夏季降水量)和土壤肥力的因子(土壤有机碳、氮含量)均对毛竹潜在分布模拟的影响较小。
毛竹生长发育的生态环境中, 以温度、降水和土壤三要素为毛竹生长必需的生活要素, 在不同地区其潜在分布的主导环境限制因子也有所差异(徐家琦和秦海清, 2003)。本研究的因子重要性分析表明, 以我国毛竹现实存在样点为基础的潜在分布模拟中, 表征温暖程度的气候因子起主导作用, 而表征土壤质地和酸碱性的土壤因子以限制作用为主。该结果与毛竹本身的生长特性有关, 从植物生长机理角度而言, 气温与降水等气候因子是驱动植物生长的主导条件, 该条件从根本上决定了植物潜在分布的空间范围。因此, 在全球变化背景下, 随着北半球中高纬度地区气温升高, 毛竹潜在分布确实有向北迁移的可能。尽管如此, 诸如土壤理化性质等因素在气候适宜的条件下, 在一定程度上限制了植物潜在分布的立地基础, 从而影响了区域尺度上植物潜在分布的空间异质性, 这也导致了毛竹潜在分布向北迁移的幅度和范围受到土壤因子的限制。
3.2 毛竹潜在分布区时空分布
基于上一节中完成的模型训练及精度评价, 分别利用两组模拟变量(仅包含气候因子组和同时包含气候与土壤因子组)及各自模型分类规则模拟我国2001-2099年5时段毛竹潜在分布状况。
统计两组变量模拟的毛竹潜在空间分布区面积, 通过回归分析得到其年际变化和线性趋势, 如图2。结果表明: 基于两组变量的模拟结果均表现为随着时间推移, 毛竹潜在分布区面积逐渐增加, 各时期不考虑土壤因素限制模拟的潜在分布区面积均大于考虑土壤限制的模拟面积。对于不考虑土壤限制的模拟而言, 具有较高的起始潜在分布面积, 约274万km2; 6个时段的潜在分布区面积呈明显的线性增加趋势, 决定系数R2为0.932, 线性斜率为1501。而对于考虑土壤因素限制的潜在分布区模拟, 潜在分布区初始面积较小, 约246万km2; 线性增加趋势较缓慢, 线性斜率仅为不考虑土壤约束时线性增率的1/2, R2为0.938, 线性斜率为849.7。两组模拟结果的起始面积有所差别, 同时, 二者面积差随时间增加有扩大趋势, 表明土壤因素对于毛竹潜在适宜生长区空间分布模拟具有明显的限制作用。
图2
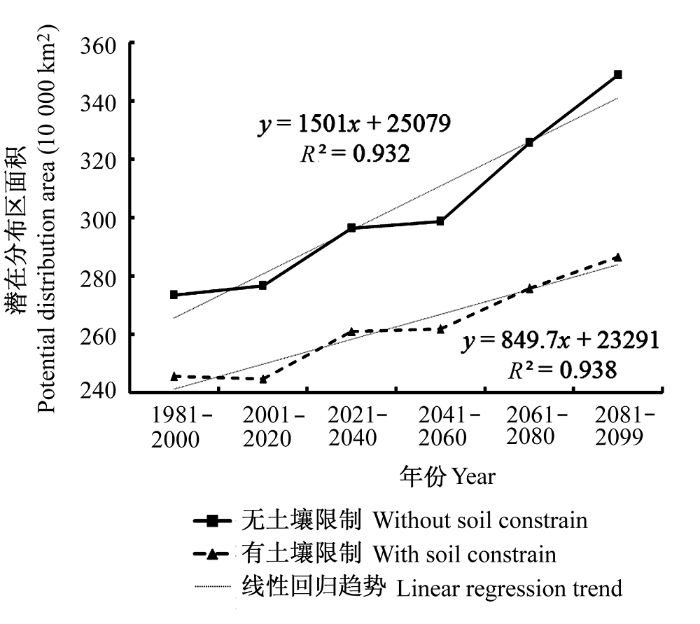
图2
未来气候情景模式A2下1981-2099年我国毛竹潜在分布年际变化。
Fig. 2
Inter-annual variations of potential distribution of Phyllostachys edulis in China from 1981 to 2099 under the future climate change scenario A2.
进一步按纬度带(1°纬度带)分别统计两组变量对毛竹潜在分布的模拟结果, 如图3所示, 我们发现在各个纬度带上, 考虑土壤要素限制组的毛竹潜在分布区面积均小于仅考虑气候要素组的模拟结果, 表明在我国沿纬度梯度, 土壤要素为限制毛竹潜在分布的环境要素; 在小于30° N的地区, 两组环境变量间对毛竹潜在分布的模拟面积差异并不大, 而大于30° N的区域该差异非常明显, 这与南北方土壤属性差异有较大关系, 在南方地区, 土壤条件较为一致, 适宜毛竹生长的区域广泛, 而北方土壤性质发生较大变化, 土壤pH不能满足自然状态下毛竹的生长(郝吉明等, 2001), 表现出对毛竹潜在分布的明显限制作用, 表明土壤对植物潜在分布的限制具有明显的地域性差异。
图3
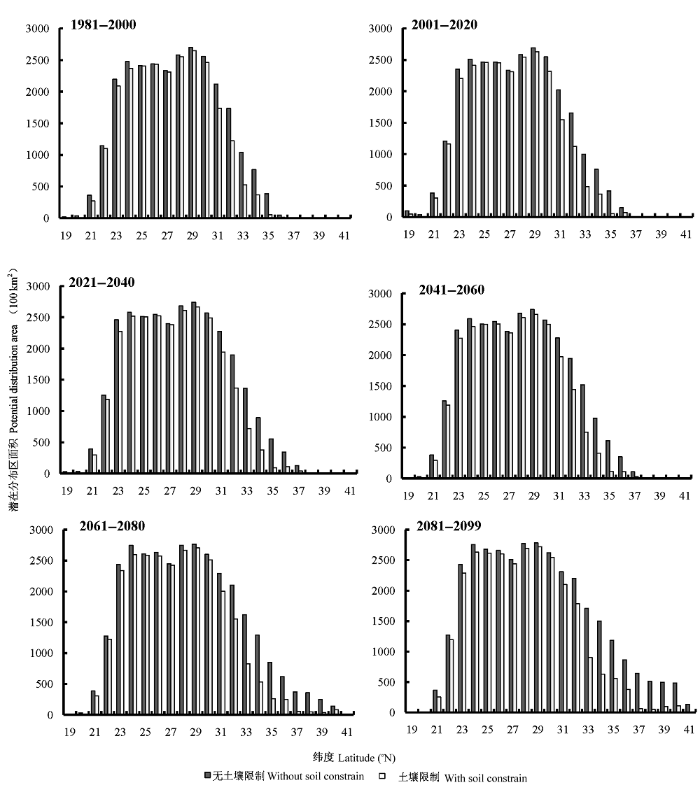
图3
未来气候情景模式A2下1981-2099年我国毛竹潜在分布随纬度的变化。
Fig. 3
Latitudinal variations in potential distribution of Phyllostachys edulis in China from 1981 to 2099 under the future climate change scenario A2.
3.3 潜在分布区质心迁移
通过ARCGIS软件计算基于两组模拟变量得到的毛竹潜在分布区的质心位置, 并以此定量分析毛竹潜在分布区的年际迁移距离和方向。图4展示了未来气候情景模式A2下1981-2099年我国毛竹潜在分布区质心迁移状况, 可以看出, 毛竹潜在分布区在1981-2000年的初始质心有所差异。不考虑土壤约束的潜在分布区质心更靠北; 同时, 不考虑土壤约束的潜在分布区质心向北迁移较明显, 达到1.3°左右, 此结论与张雷等(2011)对毛竹潜在分布模拟的结果一致。而考虑土壤约束的潜在分布区质心主要向着北偏西方向移动, 向北迁移仅有0.6°左右。这表明在气候变暖的背景下, 土壤对毛竹潜在分布区向北扩展具有明显的限制作用, 即使未来气候条件适宜毛竹生长, 土壤等环境因子仍会限制其生存。
图4
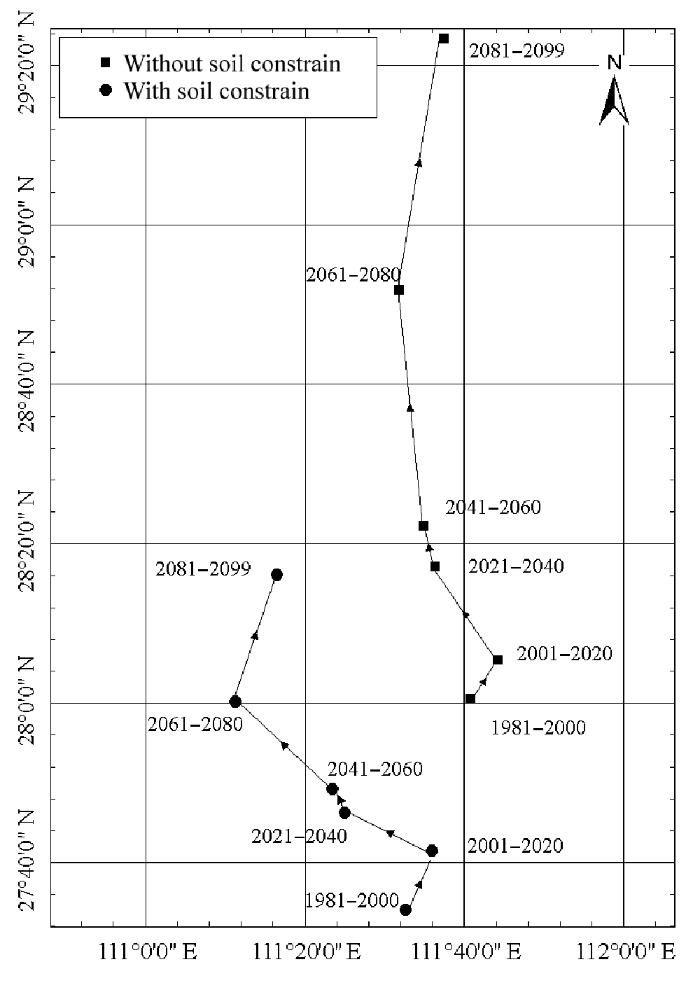
图4
未来气候情景模式A2下1981-2099年我国毛竹潜在分布变化。
Fig. 4
Variation of potential distribution of Phyllostachys edulis in China from 1981 to 2099 under the future climate change scenario A2.
目前, 我国有竹子34属560余种, 一些野生竹种有很宽的生态幅度, 能适应不同的气候条件与土壤类型。但毛竹作为我国竹类中种植最广、经济价值最高的竹种, 对气候与土壤等环境条件要求较为严格(李国庆等, 1983; 徐家琦和秦海清, 2003)。经过多年毛竹北移的研究与实践, 我国毛竹已在山东、河南等地部分地区人工引种栽培成功。尽管如此, 对于不能满足毛竹生长发育的栽培地, 需在毛竹引种栽培前进行大量的人工干预措施, 改善林地土壤的理化性质。河南省博爱县引种霍山毛竹时, 栽培地多为pH≥7.4或盐渍化土壤, 造成毛竹生长不良; 安徽省皖东丘陵地区引种毛竹, 由于黄土黏性强和通透性差, 易导致竹鞭渍水死亡, 严重影响毛竹生长与产量(徐家琦和秦海清, 2003)。由此看见, 在自然状态下, 即使气温、降水等气候要素可以满足毛竹生长需求, 土壤要素对其生长也具有明显的限制作用。因此在利用物种分布模型模拟毛竹适宜生长区潜在分布的时空格局时, 即应考虑气候因子的主导作用, 也应同时考虑土壤因子的限制作用。然而, 植物的迁移扩散与众多因素有关, 除气候与土壤因素外, 植物自身的生物学特性、物种及种间竞争、灾害干扰、土地覆盖与利用类型、人类活动等都会对其造成显著影响。本研究仅从气候、土壤等环境因子角度考虑, 以毛竹现实存在的生存环境条件为背景知识, 利用one-class SVM模型建立毛竹适宜环境判别规则并模拟气候变化背景下适宜生长区的潜在空间变化。该方法不能从机理上解释物种如何适应环境条件, 也无法给出真实的生存环境的临界阈值, 具有一定局限性。在今后针对毛竹自然状态下迁移与扩散的研究中, 需进一步考虑上述因素的影响。
4 结论
本研究使用基于SVM方法的物种分布模型, 利用气候、土壤因子模拟我国毛竹潜在空间分布, 聚焦于考虑土壤因子前后模拟结果的差异比较, 旨在探究土壤因子对毛竹潜在空间分布模拟的影响。研究结果表明, 仅以气候因子为模拟变量和同时考虑气候与土壤因子为模拟变量的毛竹潜在空间分布模拟均具有较高精度, 毛竹潜在适宜分布区均表现为面积增加并向北扩张。同时考虑气候与土壤因子的模拟结果具有较高的模拟效率, 且毛竹潜在分布区面积增幅与向北迁移幅度均小于仅使用气候因子的模拟, 表明土壤要素对植物潜在分布具有明显的限制作用。
参考文献
An evaluation of environmental factors affecting species distributions
DOI:10.1016/j.ecolmodel.2010.10.003
URL
[本文引用: 1]

Many different models can be built to explain the distributions of species. Often there is no single model that is clearly better than the alternatives, and this leads to uncertainty over which environmental factors are limiting species' distributions. We investigated the support for different environmental factors by determining the drop in model performance when selected predictors were excluded from the model building process. We used a paired t-test over 37 plant species so that an environmental factor was only deemed significant if it consistently improved the results for multiple species. Geology and winter minimum temperatures were found to be the environmental factors with the most support, with a significant drop in model performance when either of these factors was excluded. However, there was less support for summer maximum temperature, as other environmental factors could combine to produce similar model performance. Our method of evaluating environmental factors using multiple species will not be capable of detecting predictors that are only important for one or two species, but it is difficult to distinguish these from spurious correlations. The strength of the method is that it increases inference for factors that consistently affect the distributions of many species. We discourage the assessment of models against predefined benchmarks, such as an area under the curve (AUC) of more than 0.7, as many alternative models for the same species produce similar results. Therefore, the benchmarks do not provide any indication of how the performance of the selected model compares to alternative models, and they provide weak inference to accept any selected model. (C) 2010 Elsevier B.V.
DOMAIN: a flexible modelling procedure for mapping potential distributions of plants and animals
DOI:10.1007/BF00051966 URL [本文引用: 1]
Assessing the past and future distribution and productivity of ponderosa pine in the Pacific Northwest using a process model, 3-PG
Support vector machines and kernel methods: the new generation of learning machines
Population, distribution, habitat use and breeding of Gurney’s Pitta Pitta gurneyi in Myanmar and Thailand
DOI:10.1017/S0959270909008612 URL [本文引用: 1]
Predictions and their validation: rare plants in the Central Highlands, Victoria, Australia
A review of methods for the assessment of prediction errors in conservation presence/absence models
Predicting species distribution: offering more than simple habitat models
DOI:10.1111/ele.2005.8.issue-9 URL [本文引用: 1]
Support vector machines for predicting distribution of sudden oak death in Califernia
DOI:10.1016/j.ecolmodel.2004.07.012 URL [本文引用: 1]
ModEco: an integrated software package for ecological niche modeling
DOI:10.1111/eco.2010.33.issue-4 URL [本文引用: 1]
The meaning and use of the area under a Receiver Operating Characteristic (ROC) curve
DOI:10.1148/radiology.143.1.7063747
URL
PMID:7063747
[本文引用: 1]
A representation and interpretation of the area under a receiver operating characteristic (ROC) curve obtained by the
Linking an ecosystem model and a landscape model to study forest species response to climate warming
DOI:10.1016/S0304-3800(98)00147-1 URL [本文引用: 1]
GRASP: generalized regression analysis and spatial prediction
DOI:10.1016/S0304-3800(02)00354-X URL [本文引用: 1]
A study of the technical effects on introducing Phyllostachys pubescens northward
毛竹北移技术效果的研究
Analysis of the concentration of total phenolics in Fargesia denudate Yi
四川王朗自然保护区缺苞箭竹(Fargesia denudate)总酚含量及变化规律
Estimation of the physical and mechanical properties of Neosinocalamus affinins using near infrared spectroscopy
DOI:10.3964/j.issn.1000-0593(2011)03-0647-05
URL
[本文引用: 1]
Near infrared spectroscopy was applied to rapidly predict density, modulus of rupture and tensile strength parallel to grain of neosinocalamus af finins. Backward interval partial least squares (BiPLS) was used to find the most informative spectrum ranges, and build models based on raw spectra and pretreated spectra, including first derivative spectra, second derivative spectra, Savitzky-Golay smoothing spectra and standard normalized variate spectra. And partial least squares (PLS) models were also developed in the whole wavelength range 350 similar to 2500 nm. The results show that compared with PLS models, BiPLS could effectively find the optimal spectrum regions and improve the predictive ability of models. The optimal models of density, modulus of rupture and tensile strength parallel to grain were obtained through BiPLS method that separated the whole spectra pre-treated by standard normalized variate, second derivative and first derivative respectively into 20, 30 and 20 intervals. And the prediction models of density, modulus of rupture and tensile strength parallel to grain had correlation coefficient (r) 0.85, 0.88 and 0.88, as well as root mean standard error of prediction (RMSEP) 0.0524, 0.0185 and 0.0292, respectively. The relation between NIR predicted values and actual values was good in all cases. Therefore, the experimental results demonstrated that NIR spectroscopy was promising for predicting the physical and mechanical properties of neosinocalamus af finins.
近红外光谱法分析慈竹物理力学性质的研究
DOI:10.3964/j.issn.1000-0593(2011)03-0647-05
URL
[本文引用: 1]
Near infrared spectroscopy was applied to rapidly predict density, modulus of rupture and tensile strength parallel to grain of neosinocalamus af finins. Backward interval partial least squares (BiPLS) was used to find the most informative spectrum ranges, and build models based on raw spectra and pretreated spectra, including first derivative spectra, second derivative spectra, Savitzky-Golay smoothing spectra and standard normalized variate spectra. And partial least squares (PLS) models were also developed in the whole wavelength range 350 similar to 2500 nm. The results show that compared with PLS models, BiPLS could effectively find the optimal spectrum regions and improve the predictive ability of models. The optimal models of density, modulus of rupture and tensile strength parallel to grain were obtained through BiPLS method that separated the whole spectra pre-treated by standard normalized variate, second derivative and first derivative respectively into 20, 30 and 20 intervals. And the prediction models of density, modulus of rupture and tensile strength parallel to grain had correlation coefficient (r) 0.85, 0.88 and 0.88, as well as root mean standard error of prediction (RMSEP) 0.0524, 0.0185 and 0.0292, respectively. The relation between NIR predicted values and actual values was good in all cases. Therefore, the experimental results demonstrated that NIR spectroscopy was promising for predicting the physical and mechanical properties of neosinocalamus af finins.
Model-based assessments of climate change effects on forests: a critical review
DOI:10.1016/0304-3800(96)83709-4 URL [本文引用: 1]
Incorporating spatial dependence in predictive vegetation models
Aboveground standing biomass and carbon storage in village bamboos in Northeast India
NeuralEnsembles: a neural network based ensemble forecasting program for habitat and bioclimatic suitability analysis
DOI:10.1111/eco.2009.32.issue-1 URL [本文引用: 1]
Habitat selection by the pale-headed brush-finch (Atlapetes pallidiceps) in southern Ecuador: implications for conservation
SPECIES: a spatial evaluation of climate impact on the envelope of species
Estimating the support of a high-dimensional distribution
DOI:10.1162/089976601750264965
URL
PMID:11440593
[本文引用: 1]
Suppose you are given some data set drawn from an underlying probability distribution P and you want to estimate a
Coupling soil water and shoot dynamics in three grass species: a spatial stochastic model on water competition in neotropical savanna
DOI:10.1016/j.ecolmodel.2009.06.045 URL [本文引用: 1]
Carbon sequestration by Chinese bamboo forests and their ecological benefits: assessment of potential, problems, and future challenges
DOI:10.1139/A11-015
URL
[本文引用: 1]
Bamboo is widely distributed in Southeast Asia, Africa, and Latin America. As a major non-wood forest product and wood substitute, bamboo is of increasing interest to ecologists owing to its rapid growth and correspondingly high potential for mitigating climate change. With a long history of production and utilization of bamboo, China is one of the countries with the richest bamboo resources and largest area of bamboo forest, and has paid unprecedented attention in recent decades to management of its bamboo forests. This review summarizes the versatility of bamboo in terms of its ecological benefits including carbon sequestration, water and soil conservation, its benefits for socioeconomic development, and its potential to mitigate climate change. Current problems, and the future potential of and challenges to rapidly expanding bamboo forests under both wider use of intensive management and the effects of global warming, are also discussed.
Characteristic variations in reflectance of surface soils
DOI:10.2136/sssaj1981.03615995004500060031x URL [本文引用: 1]
Climate change threats to plant diversity in Europe
Climatic controls of a keystone understory species, Sasamorpha borealis, and an impact assessment of climate change in Japan
DOI:10.1007/s13595-011-0086-y
URL
[本文引用: 1]
Introduction The aims of this study were to identify the climatic conditions controlling the distribution of Sasamorpha borealis and to assess the impact of climate change on the species in Japan.
Materials and methods The relationship between S. borealis distribution and climatic variables in the Japanese Archipelago was explored using classification tree analysis. Potential habitat maps under the current and future climates were generated at about 1-km spatial resolution.
Results The model was highly accurate. Although snow cover has been thought to be the most important factor controlling S. borealis distribution, we revealed that the species requires high precipitation during the growing season even in humid Japanese environments. Areas with high summer (May-September) precipitation (PRS) were classified as potential habitat irrespective of other climatic conditions. In areas with moderate PRS, potential habitat was limited to cooler and less snow-covered areas and areas with low PRS were classified as non-habitat. The high fitness of the predicted to the observed distributions suggested that S. borealis could have survived throughout the Japanese Archipelago during the glacial period.
Conclusion In future climates, 29.0-39.1% of the current potential habitat was predicted to change to non-habitat due to increasing dryness in the growing season. Areas with high precipitation remained a potential habitat for S. borealis.
Effect of simulated nitrogen deposition on nutrient release in decomposition of several litter fractions of two bamboo species
模拟氮沉降对两种竹林不同凋落物组分分解过程养分释放的影响
Selective logging and fire as drivers of alien grass invasion in a Bolivian tropical dry forest
DOI:10.1016/j.foreco.2009.07.024 URL [本文引用: 1]
Evaluating MODIS data for mapping wildlife habitat distribution
DOI:10.1016/j.rse.2007.09.012 URL [本文引用: 1]
Range-wide analysis of wildlife habitat: implications for conservation
DOI:10.1016/j.biocon.2010.04.046 URL [本文引用: 1]
Effects of exogenous nitric oxide on photosynthetic characteristic of Indocalamus barbatus under a simulated acid rain stress condition
外源一氧化氮对模拟酸雨胁迫下箬竹(Indocalamus barbatus)光合特性的影响
Study on condition factor of north transplanting and introduction of Phyllostachys edulisin
毛竹北移和引种栽培制约因素研究
Estimating biomass production and carbon storage for a fast-growing makino bamboo (Phyllostachys makinoi) plant based on the diameter distribution model
DOI:10.1016/j.foreco.2010.04.021 URL [本文引用: 1]
Predicting the potential distribution of Phyllostachys edulis with DOMAIN and NeuralEnsembles Models
DOI:10.11707/j.1001-7488.20110704
URL
[本文引用: 3]
In this paper a profile technique- DOMAIN was used to map potential habitat suitable for moso bamboo (Phyllostachys edulis). and to select the areas with low suitable habitat as pseudo-absences. Then a group discrimination technique-NeuralEnsembles was employed to predict the potential distribution of moso bamboo (hereafter termed hybrid model) based on pseudo-absences and true presences data. Sensitivity, Kappa and the area under the curve (AUC) values of receiver operator characteristic (ROC) curve were employed to assess model predictive accuracy. Meanwhile, we investigated the sample size effects of pseudo-absences generated by DOMAIN on model performance. We also compared model performance of hybrid model with single model-NeurnalEnsembles. Results indicated that the hybrid model could achieve a higher accuracy in simulating current distribution of moso bamboo in comparison to single model. Sensitivity and AUC were relatively independent from pseudo-absence sample size, but Kappa declined with the increasing pseudo-absence sample size. Climate change is likely to have dramatic effects on the potential distribution of moso bamboo, with the northward migration ranging from 33 to 266 km, and the area expansion by 7.4% to 13.9%.
基于DOMAIN和NeuralEnsembles模型预测中国毛竹潜在分布
DOI:10.11707/j.1001-7488.20110704
URL
[本文引用: 3]
In this paper a profile technique- DOMAIN was used to map potential habitat suitable for moso bamboo (Phyllostachys edulis). and to select the areas with low suitable habitat as pseudo-absences. Then a group discrimination technique-NeuralEnsembles was employed to predict the potential distribution of moso bamboo (hereafter termed hybrid model) based on pseudo-absences and true presences data. Sensitivity, Kappa and the area under the curve (AUC) values of receiver operator characteristic (ROC) curve were employed to assess model predictive accuracy. Meanwhile, we investigated the sample size effects of pseudo-absences generated by DOMAIN on model performance. We also compared model performance of hybrid model with single model-NeurnalEnsembles. Results indicated that the hybrid model could achieve a higher accuracy in simulating current distribution of moso bamboo in comparison to single model. Sensitivity and AUC were relatively independent from pseudo-absence sample size, but Kappa declined with the increasing pseudo-absence sample size. Climate change is likely to have dramatic effects on the potential distribution of moso bamboo, with the northward migration ranging from 33 to 266 km, and the area expansion by 7.4% to 13.9%.
Simulation and trend analysis of soil temperature in China from 1955 to 2006 using IBIS model
基于IBIS模型的1955~2006年中国土壤温度模拟及时空演变分析
Physiological responses of three dwarf ornamental bamboos to the elevated atmospheric ozone concentration
3种地被类观赏竹对大气臭氧浓度倍增的生理响应
