Optimization and evaluation of vegetation photosynthesis and respiration model using the measurements collected from the forest site of subtropical coniferous-evergreen
LIU Cheng1, *, , HUANG Jian-Ping1, **, , DIAO Yi-Wei1, WEN Xue-Fa2, XIAO Wei1, ZHANG Mi1, LEE Xu-Hui1, LIU Shou-Dong1
1Yale-NUIST Center on Atmospheric Environment, Nanjing University of Information Science & Technology, Nanjing 210044, China2Institute of Geographic Sciences and Natural Resources Research, Chinese Academy of Sciences, Beijing 100101,China
通讯作者: ** 通讯作者Author for correspondence (E-mail:hjpfwj@gmail.com)
Determination of carbon cycling model parameters is critical to simulate the net ecosystem CO2 exchange (NEE). The objectives of this study were to determine the parameters of vegetation photosynthesis and respiration model (VPRM) and improve the calculation of NEE to benefit regional modeling of CO2.
Methods
Two schemes are examined in optimization of the parameters in VPRM. Two years CO2 flux and meteorological observational data in 2010-2011 at the Qianyanzhou (QYZ) eddy tower site are used to determine the parameters in VPRM and another full year flux observational data in 2012 are used to evaluate the model performance. Several statistics metrics are calculated to evaluate the model performance on NEE simulations.
Important findings
The results indicate, traditional method with Michaelis-Menten equation is not suitable to determine the parameters of VPRM, whereas the method with parameters retrieved from the VPRM calculation equation provides much more reasonable results. The parameter of maximum light use efficiency (λ) is critical for the VPRM calculation of NEE. Our result is larger than the typical value of C3 plant (1/6), but consistent with the other studies. Using the optimized parameters, VPRM is able to capture NEE variations for different seasons. The statistics calculation with one-year NEE simulation shows that, the mean bias is -0.86 μmol·m-2·s-1 and correlation coefficient is 0.72. Overall, the VPRM performs much better in growing season than the non-growing season when the peak value of NEE is underestimated by 52%. The VPRM simulated NEE shows better agreement with observations on sunny days than rainy or cloudy days.
Keywords:net ecosystems exchange (NEE)
;
parameter optimization
;
Qianyanzhou
;
vegetation photosynthesis and respiration model
LIUCheng, HUANGJian-Ping, DIAOYi-Wei, WENXue-Fa, XIAOWei, ZHANGMi, LEEXu-Hui, LIUShou-Dong. Optimization and evaluation of vegetation photosynthesis and respiration model using the measurements collected from the forest site of subtropical coniferous-evergreen. Chinese Journal of Plant Ecology, 2015, 39(4): 388-397 https://doi.org/10.17521/cjpe.2015.0038
过去20多年, 涡度相关技术被广泛用于NEE观测(Goulden et al., 1997; Hollinger et al., 1999; Baldocchi et al., 2001; Law et al., 2002)。CO2通量观测资料已被成功用于包括VPRM模型在内的各种陆地生态系统模型参数的优化。Mahadevan等(2008)利用北美地区22个不同植被类型站点的通量观测资料对VPRM的4个关键参数(最大光量子效率(λ)、光合作用到达半饱和值时对应的光合有效辐射(PAR0)、呼吸参数(α和β))进行了优化, 参数优化后的VPRM较好地模拟了各站点的NEE时空变化。Hilton等(2013)利用北美65个通量站点观测资料对VPRM不同植被类型的参数进行了不同时间及空间尺度优化拟合, 提出了一组较为完整且适合于北美地区不同植被类型的模型参数(λ、PAR0、α、β)。而Yuan等(2013, 2014)将相关研究扩展到全球范围, 他们利用全球150个通量站点资料及VPRM中GEE计算公式反演得到一组与GEE有关的VPRM参数λ、PAR0。这些研究表明, VPRM参数随各地的气候条件存在较大的变化。相对而言, 我国在这方面的研究还存在明显不足。
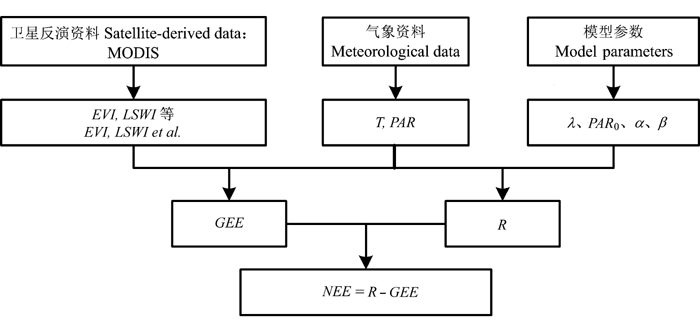
Fig. 1 Schematic diagram of the vegetation photosynthesis respiration model (VPRM). EVI, enhanced vegetation index; GEE, gross ecosystem CO2 exchange; LSWI, land surface water index; NEE, net ecosystem CO2 exchange; PAR, photosynthetically active radiation; R, respiration; T, temperature.
Table 1 A comparison of the parameters derived from two schemes at Qianyanzhou site
方案 Scheme
λ
PAR0 (μmol·m-2·s-1)
α (μmol CO2·m-2·s-1·℃-1)
β (μmol CO2·m-2·s-1)
1
0.048
514
0.164
0.906
2
0.203
345
0.164
0.906
λ, maximum quantum efficiency; PAR0, half saturation value of photosynthesis; α and β, respiration parameters.λ, 最大光量子效率; PAR0, 光合作用到达半饱和值时对应的光合有效辐射; α和β, 光合呼吸参数。
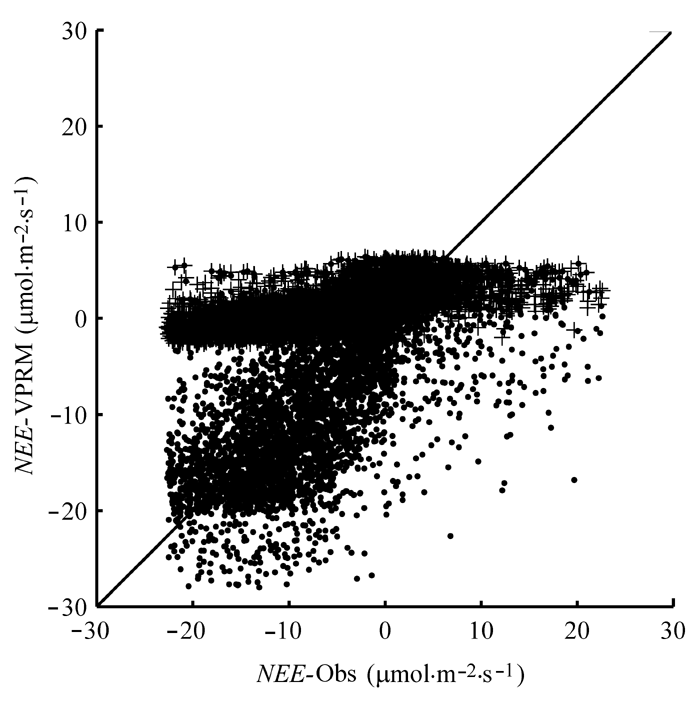
Fig. 2 A comparison of VPRM-simulated net ecosystem CO2 exchange (NEE-VPRM) with observed NEE (NEE-Obs) for year 2012 at Qianyanzhou site. +, simulated NEE with optimized parameters of scheme 1; ·, simulated NEE with optimized parameters of scheme 2; Solid black line, 1:1 line.
Table 2
表2
表2 VPRM模拟生态系统净CO2交换(NEE)与观测值之间统计分析
Table 2 Statistical analysis between simulated net ecosystem CO2 exchange (NEE) and observed NEE
2012年 Year 2012
斜率 Slope
截距 Intercept (μmol·m-2·s-1)
R平方值 R square
均方根误差 Root mean squared error (μmol·m-2·s-1)
平均误差 Mean bias (μmol·m-2·s-1)
有效数据 Valid data
方案一 Scheme 1
全年0.5 h NEE All year 0.5 h NEE
0.17
2.44
0.51
9.58
6.68
5 909
生长旺季时刻平均 Mean diurnal variation during the peak growing season
0.27
3.49
0.97
8.01
5.63
48
非生长旺季时刻平均 Mean diurnal variation during the non-peak growing season
0.06
1.78
0.61
4.12
2.24
48
方案二 Scheme 2
全年0.5 h NEE All year 0.5 h NEE
0.73
-2.23
0.52
6.23
-0.86
5 909
生长旺季时刻平均 Mean diurnal variation during the peak growing season
0.92
0.65
0.96
1.72
0.87
48
非生长旺季时刻平均 Mean diurnal variation during the non-peak growing season
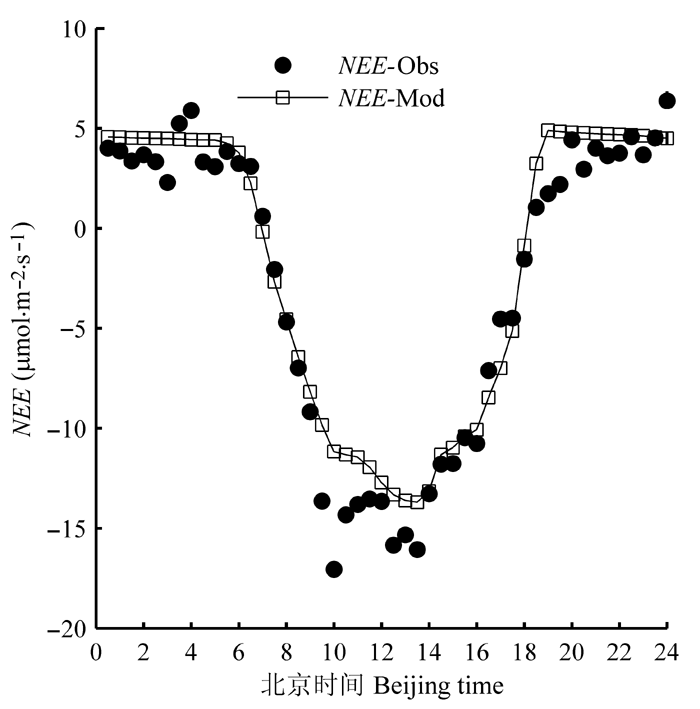
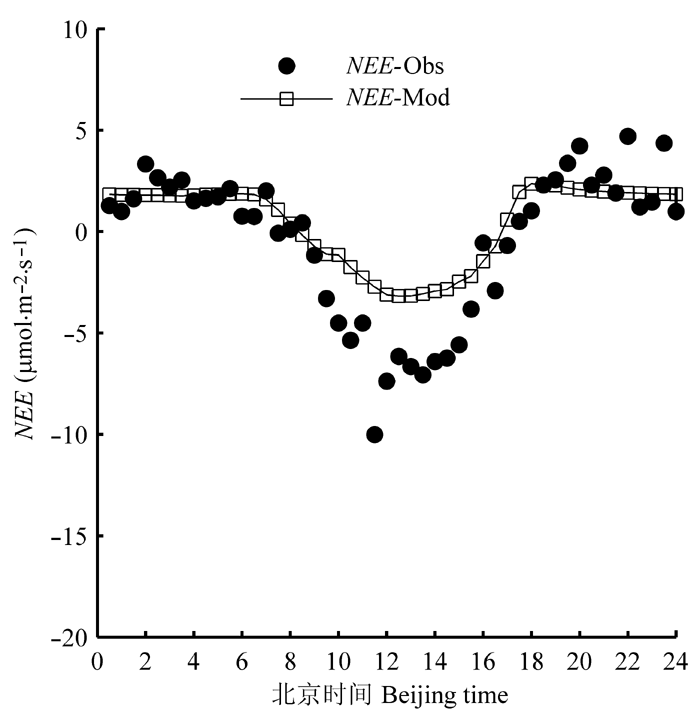
Fig. 3 A comparison between the observed and modeled mean diurnal variation of net ecosystem CO2 exchange (NEE) during the peak growing season (April to September) of 2012 at Qianyanzhou site. NEE-Obs, observed NEE; NEE-Mod, simulated NEE with optimized parameters of scheme 2.
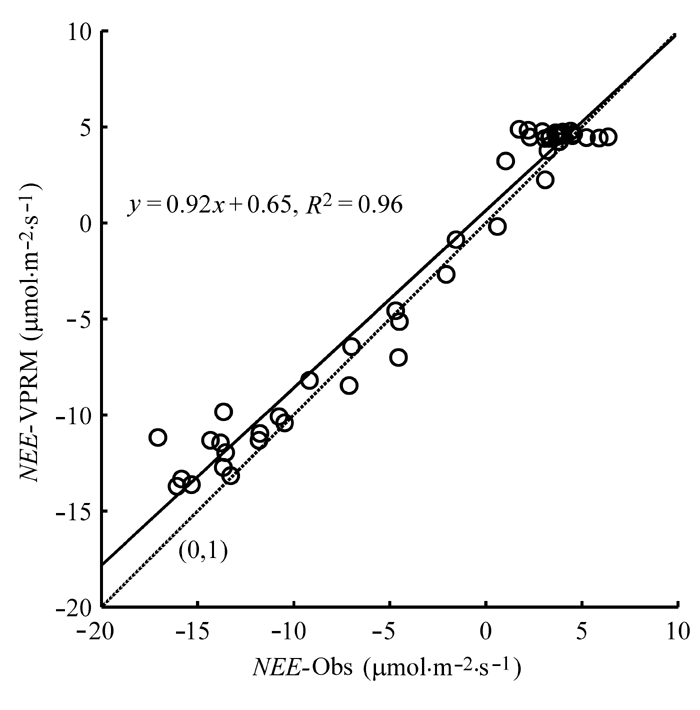
Fig. 4 Regression analyses between the VPRM modeled net ecosystem CO2 exchange (NEE-VPRM) and observed NEE (NEE-Obs) during growing season (April to September) in year 2012 at Qianyanzhou site. Black circle: simulated NEE with optimized parameters of scheme 2; dotted line: 1:1 line.
Fig. 5 A comparison between the observed and modeled mean diurnal variation of net ecosystem CO2 exchange (NEE) during the non-peak growing season of 2012 at Qianyanzhou site. NEE-Obs, observed NEE; NEE-Mod, simulated NEE with optimized parameters of scheme 2.
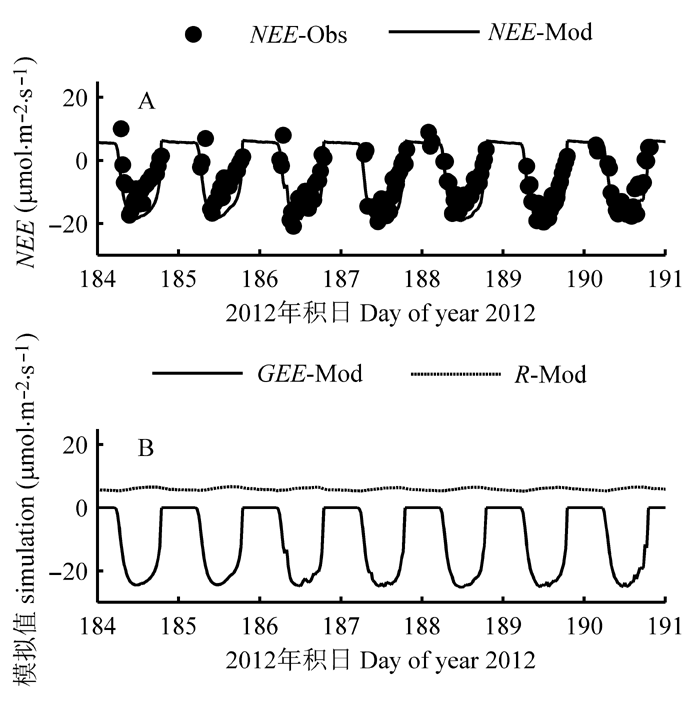
Fig. 6 A comparison of simulated net ecosystem CO2 exchange (NEE) with observations at Qianyanzhou site during the day 184-190 of 2012 (sunny). NEE-Obs, observed NEE; NEE-Mod, simulated NEE with optimized parameters of scheme 2; GEE-Mod, simulated gross ecosystem CO2 exchange with optimized parameters of scheme 2; R-Mod,simulated respiration with optimized parameters of scheme 2.
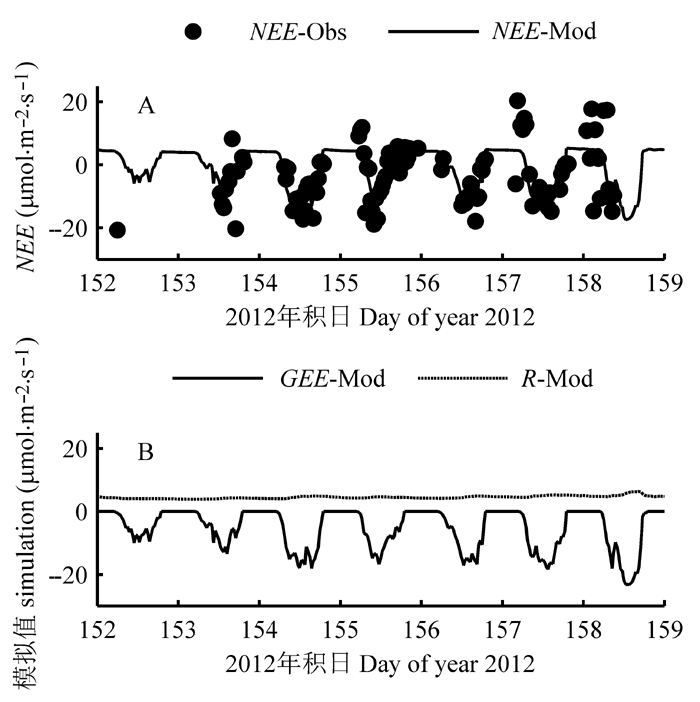
Fig. 7 A comparison of simulated net ecosystem CO2 exchange (NEE) with observations at Qianyanzhou site during the day 152-158 of 2012 (cloudy). NEE-Obs, observed NEE; NEE-Mod, simulated NEE with optimized parameters of scheme 2; GEE-Mod, simulated gross ecosystem CO2 exchange with optimized parameters of scheme 2; R-Mod,simulated respiration with optimized parameters of scheme 2.
IPCC (2007). Climate change 2007: The physical science basis. In: Contribution of Working Group I to the Fourth Assessment Report of the Intergovernmental Panel on Climate Change. Cambridge University Press, Cambridge.
Environmental controls over carbon dioxide and water vapor exchange of terrestrial vegetation.
Agricultural and Forest Meteorology, 113, 97-120.
[15]
LiHG, WuJ (2006). Uncertainty analysis in ecological studies: An overview. In: Wu J, Jones KB, Li H, Loucks OL eds. Scaling and Uncertainty Analysis in Ecology: Methods and Applications. Springer, Dordrecht, The Netherlands. 45-66.
Mesoscale covariance of transport and CO2 fluxes: Evidence from observations and simulations using the WRF-VPRM coupled atmosphere-biosphere model
1
2007
... 目前模拟碳循环的模型主要包括统计模型、过程模型及遥感模型等.统计模型相对简单, 气候因子易获取, 但生态生理机制不是很清楚, 且估算误差大.而过程模型过于复杂, 所需参数太多, 且难以获得(朱文泉等, 2005).自Monteith (1972)提出净初级生产力(NPP)与植物吸收的光合有效辐射(FAPAR)线性相关理论以来, 随着遥感技术和产品的推广与应用, 基于卫星遥感数据的光能利用率(LUE)模型迅速发展起来.CASA (Carnegie-Ames- Stanford Approach; Potter et al., 1993; Potter and Klooster, 1998)、CFix (Carbon Fix; Veroustraete et al., 2002)、CFlux (Carbon Flux; Turner et al., 2006; King et al., 2011)、EC-LUE (Eddy Covariance-Light Use Efficiency; Yuan et al., 2007, 2010)等均将FAPAR考虑为归一化植被指数(NDVI)的线性函数.然而, NDVI对大气条件、土壤背景及闭合冠层饱和等非常敏感(Huete et al., 1997), 可能导致利用NDVI数据模拟总生态系统CO2交换量(GEE)存在较大的不确定性.Xiao等(2004a, 2004b)发展了一个植被光合模型(VPM), 并利用FAPAR与增强型植被指数(EVI)的函数关系代替NDVI, 结果表明对GEE的模拟得到了较大的改进(Xiao et al., 2004a, 2004b, 2005a, 2005b).而Mahadevan等(2008)在VPM的基础上发展了植被光合呼吸模型(VPRM), 此模型考虑了GEE对光的非线性响应函数关系, 并添加了呼吸项, 可以直接计算NEE.VPRM具有两大特点: 一是需要的参数少, 二是输入变量如空气温度、光合有效辐射(PAR)、植被和水分指数等均可通过观测或由卫星反演资料获取.这些优势使得VPRM在区域碳通量模拟等方面得到了广泛的应用(Mahadevan et al., 2008; Hilton et al., 2013).此外, VPRM还被耦合到天气预报模式(WRF, Weather Research and Forecasting Model)中, 用于反演分析大气CO2浓度的变化(Ahmadov et al., 2007, 2009; Pilla et al., 2011).刁一伟等(2015)将WRF-VPRM耦合模式用于长江三角洲地区CO2通量及浓度的模拟, 发现NEE的模拟偏差是导致CO2浓度预报误差的主要原因之一.因此, 优化VPRM模型中的关键参数, 可改进NEE的模拟, 并为三维模式提供准确的生物CO2源. ...
Comparing high resolution WRF-VPRM simulations and two global CO2 transport models with coastal tower measurements of CO2.
1
2009
... 目前模拟碳循环的模型主要包括统计模型、过程模型及遥感模型等.统计模型相对简单, 气候因子易获取, 但生态生理机制不是很清楚, 且估算误差大.而过程模型过于复杂, 所需参数太多, 且难以获得(朱文泉等, 2005).自Monteith (1972)提出净初级生产力(NPP)与植物吸收的光合有效辐射(FAPAR)线性相关理论以来, 随着遥感技术和产品的推广与应用, 基于卫星遥感数据的光能利用率(LUE)模型迅速发展起来.CASA (Carnegie-Ames- Stanford Approach; Potter et al., 1993; Potter and Klooster, 1998)、CFix (Carbon Fix; Veroustraete et al., 2002)、CFlux (Carbon Flux; Turner et al., 2006; King et al., 2011)、EC-LUE (Eddy Covariance-Light Use Efficiency; Yuan et al., 2007, 2010)等均将FAPAR考虑为归一化植被指数(NDVI)的线性函数.然而, NDVI对大气条件、土壤背景及闭合冠层饱和等非常敏感(Huete et al., 1997), 可能导致利用NDVI数据模拟总生态系统CO2交换量(GEE)存在较大的不确定性.Xiao等(2004a, 2004b)发展了一个植被光合模型(VPM), 并利用FAPAR与增强型植被指数(EVI)的函数关系代替NDVI, 结果表明对GEE的模拟得到了较大的改进(Xiao et al., 2004a, 2004b, 2005a, 2005b).而Mahadevan等(2008)在VPM的基础上发展了植被光合呼吸模型(VPRM), 此模型考虑了GEE对光的非线性响应函数关系, 并添加了呼吸项, 可以直接计算NEE.VPRM具有两大特点: 一是需要的参数少, 二是输入变量如空气温度、光合有效辐射(PAR)、植被和水分指数等均可通过观测或由卫星反演资料获取.这些优势使得VPRM在区域碳通量模拟等方面得到了广泛的应用(Mahadevan et al., 2008; Hilton et al., 2013).此外, VPRM还被耦合到天气预报模式(WRF, Weather Research and Forecasting Model)中, 用于反演分析大气CO2浓度的变化(Ahmadov et al., 2007, 2009; Pilla et al., 2011).刁一伟等(2015)将WRF-VPRM耦合模式用于长江三角洲地区CO2通量及浓度的模拟, 发现NEE的模拟偏差是导致CO2浓度预报误差的主要原因之一.因此, 优化VPRM模型中的关键参数, 可改进NEE的模拟, 并为三维模式提供准确的生物CO2源. ...
Fluxnet: a new tool to study the temporal and spatial variability of ecosystem-scale carbon dioxide, water vapor, and energy flux densities.
1
2001
... 过去20多年, 涡度相关技术被广泛用于NEE观测(Goulden et al., 1997; Hollinger et al., 1999; Baldocchi et al., 2001; Law et al., 2002).CO2通量观测资料已被成功用于包括VPRM模型在内的各种陆地生态系统模型参数的优化.Mahadevan等(2008)利用北美地区22个不同植被类型站点的通量观测资料对VPRM的4个关键参数(最大光量子效率(λ)、光合作用到达半饱和值时对应的光合有效辐射(PAR0)、呼吸参数(α和β))进行了优化, 参数优化后的VPRM较好地模拟了各站点的NEE时空变化.Hilton等(2013)利用北美65个通量站点观测资料对VPRM不同植被类型的参数进行了不同时间及空间尺度优化拟合, 提出了一组较为完整且适合于北美地区不同植被类型的模型参数(λ、PAR0、α、β).而Yuan等(2013, 2014)将相关研究扩展到全球范围, 他们利用全球150个通量站点资料及VPRM中GEE计算公式反演得到一组与GEE有关的VPRM参数λ、PAR0.这些研究表明, VPRM参数随各地的气候条件存在较大的变化.相对而言, 我国在这方面的研究还存在明显不足. ...
Carbon dynamics along a chronosequence of slash pine plantations in north Florida.
Physiological responses of a black spruce forest to weather.
1
1997
... 过去20多年, 涡度相关技术被广泛用于NEE观测(Goulden et al., 1997; Hollinger et al., 1999; Baldocchi et al., 2001; Law et al., 2002).CO2通量观测资料已被成功用于包括VPRM模型在内的各种陆地生态系统模型参数的优化.Mahadevan等(2008)利用北美地区22个不同植被类型站点的通量观测资料对VPRM的4个关键参数(最大光量子效率(λ)、光合作用到达半饱和值时对应的光合有效辐射(PAR0)、呼吸参数(α和β))进行了优化, 参数优化后的VPRM较好地模拟了各站点的NEE时空变化.Hilton等(2013)利用北美65个通量站点观测资料对VPRM不同植被类型的参数进行了不同时间及空间尺度优化拟合, 提出了一组较为完整且适合于北美地区不同植被类型的模型参数(λ、PAR0、α、β).而Yuan等(2013, 2014)将相关研究扩展到全球范围, 他们利用全球150个通量站点资料及VPRM中GEE计算公式反演得到一组与GEE有关的VPRM参数λ、PAR0.这些研究表明, VPRM参数随各地的气候条件存在较大的变化.相对而言, 我国在这方面的研究还存在明显不足. ...
Global percent tree cover at a spatial resolution of 500 meters: First results of the MODIS vegetation continuous fields algorithm.
Improving North American terrestrial CO2 flux diagnosis using spatial structure in land surface model residuals.
1
2013
... 目前模拟碳循环的模型主要包括统计模型、过程模型及遥感模型等.统计模型相对简单, 气候因子易获取, 但生态生理机制不是很清楚, 且估算误差大.而过程模型过于复杂, 所需参数太多, 且难以获得(朱文泉等, 2005).自Monteith (1972)提出净初级生产力(NPP)与植物吸收的光合有效辐射(FAPAR)线性相关理论以来, 随着遥感技术和产品的推广与应用, 基于卫星遥感数据的光能利用率(LUE)模型迅速发展起来.CASA (Carnegie-Ames- Stanford Approach; Potter et al., 1993; Potter and Klooster, 1998)、CFix (Carbon Fix; Veroustraete et al., 2002)、CFlux (Carbon Flux; Turner et al., 2006; King et al., 2011)、EC-LUE (Eddy Covariance-Light Use Efficiency; Yuan et al., 2007, 2010)等均将FAPAR考虑为归一化植被指数(NDVI)的线性函数.然而, NDVI对大气条件、土壤背景及闭合冠层饱和等非常敏感(Huete et al., 1997), 可能导致利用NDVI数据模拟总生态系统CO2交换量(GEE)存在较大的不确定性.Xiao等(2004a, 2004b)发展了一个植被光合模型(VPM), 并利用FAPAR与增强型植被指数(EVI)的函数关系代替NDVI, 结果表明对GEE的模拟得到了较大的改进(Xiao et al., 2004a, 2004b, 2005a, 2005b).而Mahadevan等(2008)在VPM的基础上发展了植被光合呼吸模型(VPRM), 此模型考虑了GEE对光的非线性响应函数关系, 并添加了呼吸项, 可以直接计算NEE.VPRM具有两大特点: 一是需要的参数少, 二是输入变量如空气温度、光合有效辐射(PAR)、植被和水分指数等均可通过观测或由卫星反演资料获取.这些优势使得VPRM在区域碳通量模拟等方面得到了广泛的应用(Mahadevan et al., 2008; Hilton et al., 2013).此外, VPRM还被耦合到天气预报模式(WRF, Weather Research and Forecasting Model)中, 用于反演分析大气CO2浓度的变化(Ahmadov et al., 2007, 2009; Pilla et al., 2011).刁一伟等(2015)将WRF-VPRM耦合模式用于长江三角洲地区CO2通量及浓度的模拟, 发现NEE的模拟偏差是导致CO2浓度预报误差的主要原因之一.因此, 优化VPRM模型中的关键参数, 可改进NEE的模拟, 并为三维模式提供准确的生物CO2源. ...
Seasonal patterns and environmental control of carbon dioxide and water vapour exchange in an ecotonal boreal forest.
1
1999
... 过去20多年, 涡度相关技术被广泛用于NEE观测(Goulden et al., 1997; Hollinger et al., 1999; Baldocchi et al., 2001; Law et al., 2002).CO2通量观测资料已被成功用于包括VPRM模型在内的各种陆地生态系统模型参数的优化.Mahadevan等(2008)利用北美地区22个不同植被类型站点的通量观测资料对VPRM的4个关键参数(最大光量子效率(λ)、光合作用到达半饱和值时对应的光合有效辐射(PAR0)、呼吸参数(α和β))进行了优化, 参数优化后的VPRM较好地模拟了各站点的NEE时空变化.Hilton等(2013)利用北美65个通量站点观测资料对VPRM不同植被类型的参数进行了不同时间及空间尺度优化拟合, 提出了一组较为完整且适合于北美地区不同植被类型的模型参数(λ、PAR0、α、β).而Yuan等(2013, 2014)将相关研究扩展到全球范围, 他们利用全球150个通量站点资料及VPRM中GEE计算公式反演得到一组与GEE有关的VPRM参数λ、PAR0.这些研究表明, VPRM参数随各地的气候条件存在较大的变化.相对而言, 我国在这方面的研究还存在明显不足. ...
A comparison of vegetation indices over a global set of TM images for EOS-MODIS.
2
1997
... 目前模拟碳循环的模型主要包括统计模型、过程模型及遥感模型等.统计模型相对简单, 气候因子易获取, 但生态生理机制不是很清楚, 且估算误差大.而过程模型过于复杂, 所需参数太多, 且难以获得(朱文泉等, 2005).自Monteith (1972)提出净初级生产力(NPP)与植物吸收的光合有效辐射(FAPAR)线性相关理论以来, 随着遥感技术和产品的推广与应用, 基于卫星遥感数据的光能利用率(LUE)模型迅速发展起来.CASA (Carnegie-Ames- Stanford Approach; Potter et al., 1993; Potter and Klooster, 1998)、CFix (Carbon Fix; Veroustraete et al., 2002)、CFlux (Carbon Flux; Turner et al., 2006; King et al., 2011)、EC-LUE (Eddy Covariance-Light Use Efficiency; Yuan et al., 2007, 2010)等均将FAPAR考虑为归一化植被指数(NDVI)的线性函数.然而, NDVI对大气条件、土壤背景及闭合冠层饱和等非常敏感(Huete et al., 1997), 可能导致利用NDVI数据模拟总生态系统CO2交换量(GEE)存在较大的不确定性.Xiao等(2004a, 2004b)发展了一个植被光合模型(VPM), 并利用FAPAR与增强型植被指数(EVI)的函数关系代替NDVI, 结果表明对GEE的模拟得到了较大的改进(Xiao et al., 2004a, 2004b, 2005a, 2005b).而Mahadevan等(2008)在VPM的基础上发展了植被光合呼吸模型(VPRM), 此模型考虑了GEE对光的非线性响应函数关系, 并添加了呼吸项, 可以直接计算NEE.VPRM具有两大特点: 一是需要的参数少, 二是输入变量如空气温度、光合有效辐射(PAR)、植被和水分指数等均可通过观测或由卫星反演资料获取.这些优势使得VPRM在区域碳通量模拟等方面得到了广泛的应用(Mahadevan et al., 2008; Hilton et al., 2013).此外, VPRM还被耦合到天气预报模式(WRF, Weather Research and Forecasting Model)中, 用于反演分析大气CO2浓度的变化(Ahmadov et al., 2007, 2009; Pilla et al., 2011).刁一伟等(2015)将WRF-VPRM耦合模式用于长江三角洲地区CO2通量及浓度的模拟, 发现NEE的模拟偏差是导致CO2浓度预报误差的主要原因之一.因此, 优化VPRM模型中的关键参数, 可改进NEE的模拟, 并为三维模式提供准确的生物CO2源. ...
... EVI、LSWI等指数由MODIS卫星反演数据所得.我们采用的是美国国家航空航天局Terra卫星搭载的MODIS传感器上的8 d平均陆地表面反照率产品MOD09A1, 其空间分辨率为500 m.蓝(459-479 nm)、红(620-670 nm)、近红外(841-875 nm)和短波红外(1628-1652 nm) 4个波段的数据用于植被指数的计算.植被指数可通过以下公式(Huete et al., 1997; Xiao et al., 2002)计算: ...
... 目前模拟碳循环的模型主要包括统计模型、过程模型及遥感模型等.统计模型相对简单, 气候因子易获取, 但生态生理机制不是很清楚, 且估算误差大.而过程模型过于复杂, 所需参数太多, 且难以获得(朱文泉等, 2005).自Monteith (1972)提出净初级生产力(NPP)与植物吸收的光合有效辐射(FAPAR)线性相关理论以来, 随着遥感技术和产品的推广与应用, 基于卫星遥感数据的光能利用率(LUE)模型迅速发展起来.CASA (Carnegie-Ames- Stanford Approach; Potter et al., 1993; Potter and Klooster, 1998)、CFix (Carbon Fix; Veroustraete et al., 2002)、CFlux (Carbon Flux; Turner et al., 2006; King et al., 2011)、EC-LUE (Eddy Covariance-Light Use Efficiency; Yuan et al., 2007, 2010)等均将FAPAR考虑为归一化植被指数(NDVI)的线性函数.然而, NDVI对大气条件、土壤背景及闭合冠层饱和等非常敏感(Huete et al., 1997), 可能导致利用NDVI数据模拟总生态系统CO2交换量(GEE)存在较大的不确定性.Xiao等(2004a, 2004b)发展了一个植被光合模型(VPM), 并利用FAPAR与增强型植被指数(EVI)的函数关系代替NDVI, 结果表明对GEE的模拟得到了较大的改进(Xiao et al., 2004a, 2004b, 2005a, 2005b).而Mahadevan等(2008)在VPM的基础上发展了植被光合呼吸模型(VPRM), 此模型考虑了GEE对光的非线性响应函数关系, 并添加了呼吸项, 可以直接计算NEE.VPRM具有两大特点: 一是需要的参数少, 二是输入变量如空气温度、光合有效辐射(PAR)、植被和水分指数等均可通过观测或由卫星反演资料获取.这些优势使得VPRM在区域碳通量模拟等方面得到了广泛的应用(Mahadevan et al., 2008; Hilton et al., 2013).此外, VPRM还被耦合到天气预报模式(WRF, Weather Research and Forecasting Model)中, 用于反演分析大气CO2浓度的变化(Ahmadov et al., 2007, 2009; Pilla et al., 2011).刁一伟等(2015)将WRF-VPRM耦合模式用于长江三角洲地区CO2通量及浓度的模拟, 发现NEE的模拟偏差是导致CO2浓度预报误差的主要原因之一.因此, 优化VPRM模型中的关键参数, 可改进NEE的模拟, 并为三维模式提供准确的生物CO2源. ...
Parameterization of a diagnostic carbon cycle model for continental scale application.
1
2011
... 过去20多年, 涡度相关技术被广泛用于NEE观测(Goulden et al., 1997; Hollinger et al., 1999; Baldocchi et al., 2001; Law et al., 2002).CO2通量观测资料已被成功用于包括VPRM模型在内的各种陆地生态系统模型参数的优化.Mahadevan等(2008)利用北美地区22个不同植被类型站点的通量观测资料对VPRM的4个关键参数(最大光量子效率(λ)、光合作用到达半饱和值时对应的光合有效辐射(PAR0)、呼吸参数(α和β))进行了优化, 参数优化后的VPRM较好地模拟了各站点的NEE时空变化.Hilton等(2013)利用北美65个通量站点观测资料对VPRM不同植被类型的参数进行了不同时间及空间尺度优化拟合, 提出了一组较为完整且适合于北美地区不同植被类型的模型参数(λ、PAR0、α、β).而Yuan等(2013, 2014)将相关研究扩展到全球范围, 他们利用全球150个通量站点资料及VPRM中GEE计算公式反演得到一组与GEE有关的VPRM参数λ、PAR0.这些研究表明, VPRM参数随各地的气候条件存在较大的变化.相对而言, 我国在这方面的研究还存在明显不足. ...
Environmental controls over carbon dioxide and water vapor exchange of terrestrial vegetation.
 , 黄建平
, 黄建平

