Airborne spectranomics: mapping canopy chemical and taxonomic diversity in tropical forests
1
2009
... 光谱变异假说是生物多样性直接遥感监测的主要理论基础, 即遥感图像光谱多样性与物种多样性有关.光谱多样性, 有时也被称为光学多样性(Palmer et al., 2002; Ustin & Gamon, 2010)、光谱异质性或光谱变异性(Rocchini et al., 2010), 表征光谱反射率的空间变化, 这种变化与植物多样性相关的植物光学性状的差异有关, 可以用来反映物种多样性(Gillespie et al., 2008; Nagendra & Rocchini, 2008).基于光谱变异假说的光谱多样性与物种多样性的研究已经有很多, 在温带森林(Laliberté et al., 2020), 亚热带森林(Kalacska et al., 2007), 热带森林(Asner & Martin, 2009; Féret & Asner, 2014; Schäfer et al., 2016), 草原(Oldeland et al., 2010; Wang et al., 2016, 2018; Gholizadeh et al., 2020)均有报道.常用光谱多样性指数包括变异系数(CV)(Somers et al., 2015; Wang et al., 2016), 凸包体积(CHV)(Dahlin, 2016; Gholizadeh et al., 2018), 凸包面积(CHA)(Gholizadeh et al., 2018), 光谱角度制图(SAM)(Zhang et al., 2006; Gholizadeh et al., 2018), 光谱信息散度(SID)(Chang, 2000)等. ...
Airborne laser-guided imaging spectroscopy to map forest trait diversity and guide conservation
1
2017
... 除了考虑与植物多样性的关系, 植物功能多样性也是生物多样性的重要组成部分, 它包括植物的化学、生理和形态结构的多样性, 反映了群落、景观、甚至大空间尺度内功能性状的变异性, 决定了生态系统的功能和稳定性(Tilman et al., 1997; Ruiz-Benito et al., 2014).利用卫星遥感影像和野外实测功能性状的关系建模, 反演植物功能多样性对实现全球生物多样性快速监测具有重要意义(Jetz et al., 2016).但由于计算植物功能多样性的可用区域很少且不可重复测量, 传统的计算植物功能多样性的方法不适合用于长期和大规模的监测.遥感反演功能多样性的原理是基于系统发育差异和资源限制导致的植物性状不同(Schweiger et al., 2018), 这些性状主要包括叶片氮浓度、叶片碳浓度、比叶面积、叶片干物质含量和叶面积等叶片性状, 以及株高、树冠横截面积和胸径等全株性状(Ma et al., 2019), 性状上的差异进而影响光谱反射率(Wang et al., 2018).已经有很多研究基于机载高光谱数据绘制高空间分辨率的植物功能多样性空间分布图(Asner et al., 2017; Schneider et al., 2017; Zheng et al., 2021), 但在更大的区域范围内由于获取数据难以实现且成本昂贵, 研究还较少.Sentinel-2号卫星等多光谱空间遥感的发展有利于克服高空间分辨率和监测范围的问题(Rossi et al., 2020; Hauser et al., 2021).目前相关的研究还较少且受很多因素影响, 比如野外数据和卫星影响时间不匹配, 物种的区域差异与方法的适用性等等, 这都有待进一步补充和验证, 可以考虑作为接下来的研究方向. ...
Random forests
1
2001
... 除了基于光谱多样性的方法, 基于机器学习的方法在森林植被分类和植物多样性监测中也得到了广泛的关注.随机森林(Breiman, 2001)是一种广泛被用于预测的非参数的机器学习算法, 它不假设数据的正态分布, 具有对噪声不敏感、分类更快更稳定的特点(Clark & Roberts, 2012; Miao et al., 2012), 是用于森林多样性建模的最优方法之一(Mallinis et al., 2020; Gyamfi-Ampadu et al., 2021).随机森林里包括用于评估模型准确性的集成交叉验证, 能对重要变量进行排序, 并以非线性的方式处理交互数据.Erinjery等(2018)采用最大似然法和随机森林分类的方法, 基于Sentinel-2光谱波段及其衍生的NDVI和纹理、Sentinel-1 SAR波段及其纹理对高海拔热带雨林不同植被类型图进行了绘制, 分类精度可达75%以上.Mallinis等(2020)基于4种不同分辨率的卫星数据, 利用随机森林回归的方法对森林植物多样性进行了评估, 结果发现基于WorldView-2图像生成的模型精度最高, Shannon-Wiener多样性指数估算精度为0.44, Simpson多样性指数为0.37. ...
Hyperspectral remote sensing of canopy biodiversity in Hawaiian lowland rainforests
1
2007
... 近年来, 随着遥感技术的迅速发展, 使得在大尺度、多时空上评估生物多样性成为可能.遥感数据具有覆盖范围广、可持续性强以及可重复的特点(Nagendra, 2001; Duro et al., 2007), 有助于迅速地揭示大面积生物多样性丢失状况, 对大尺度、长时间序列的生物多样性评估至关重要(Turner, 2014).生物多样性遥感监测方法可总结为直接法和间接法两种(Turner et al., 2003).直接法是利用高空间分辨率和高光谱分辨率的卫星传感器直接识别物种、种群或群落.Ke等(2010)利用QuickBird高分辨率多光谱数据和激光雷达数据, 通过图像分割和基于目标的分类方法对森林物种进行识别, 发现两种数据均有较好的结果, 但是结合两种数据源能获取更高的精度, Kappa系数最高可达91.6%.Cross等(2019)利用WorldView-3卫星影像对热带森林里的6个森林物种进行了分类, 分类准确率高达85.37%.间接法是通过遥感数据反演与生物多样性密切相关的指标或参数, 再与野外实测数据构建统计模型以反演生物多样性.植被指数、植物生化组分和植被结构等都可以作为植物多样性研究的相关指标.归一化植被指数(NDVI)经常被用来指示区域的物种多样性(Fairbanks & Mcgwire, 2004; Feeley et al., 2005), 而增强型植被指数(EVI)则可以更好地在植被茂密的地区代替NDVI (Waring et al., 2006).此外, 与光谱变异相关的叶片叶绿素、氮含量、色素、水分等生化组分的变化也可以用来估算森林物种多样性(Carlson et al., 2007). ...
Accelerated modern human-induced species losses: entering the sixth mass extinction
1
2015
... 森林是陆地生态系统的重要组成部分, 占全球陆地面积的30%, 在维持生物多样性和生物圈功能方面发挥着重要作用(Pan et al., 2013; Harrison et al., 2014).然而, 由于人类活动和气候变化的影响, 生物多样性正在以一种前所未有的速度丧失(Ceballos et al., 2015).及时掌握森林生物多样性的现状、格局、变化趋势和受到的威胁, 是制定生物多样性保护政策和措施的前提.长久以来, 森林植物多样性监测依赖于大量的野外调查, 费时费力, 调查结果也受样地选择、调查方法、抽样调查的力度、参与调查人员的专业知识等诸多因素限制(Gotelli & Colwell, 2001; Graham & Hijmans, 2006).同时, 野外调查集中在物种和样地水平, 难以在景观、区域乃至全球尺度上实现对森林植物多样性在时空上的连续监测(Kerr & Ostrovsky, 2003; Nicholson et al., 2009; Levrel et al., 2010; Pereira et al., 2010). ...
An information-theoretic approach to spectral variability, similarity, and discrimination for hyperspectral image analysis
1
2000
... 光谱变异假说是生物多样性直接遥感监测的主要理论基础, 即遥感图像光谱多样性与物种多样性有关.光谱多样性, 有时也被称为光学多样性(Palmer et al., 2002; Ustin & Gamon, 2010)、光谱异质性或光谱变异性(Rocchini et al., 2010), 表征光谱反射率的空间变化, 这种变化与植物多样性相关的植物光学性状的差异有关, 可以用来反映物种多样性(Gillespie et al., 2008; Nagendra & Rocchini, 2008).基于光谱变异假说的光谱多样性与物种多样性的研究已经有很多, 在温带森林(Laliberté et al., 2020), 亚热带森林(Kalacska et al., 2007), 热带森林(Asner & Martin, 2009; Féret & Asner, 2014; Schäfer et al., 2016), 草原(Oldeland et al., 2010; Wang et al., 2016, 2018; Gholizadeh et al., 2020)均有报道.常用光谱多样性指数包括变异系数(CV)(Somers et al., 2015; Wang et al., 2016), 凸包体积(CHV)(Dahlin, 2016; Gholizadeh et al., 2018), 凸包面积(CHA)(Gholizadeh et al., 2018), 光谱角度制图(SAM)(Zhang et al., 2006; Gholizadeh et al., 2018), 光谱信息散度(SID)(Chang, 2000)等. ...
Predicting tree species diversity using geodiversity and Sentinel-2 multi-seasonal spectral information
1
2020
... 本研究目前只是在温带森林中开展, 因为气候地理条件差异, 如果要将此方法应用在不同地区的不同类型的森林中, 还需要进行进一步的验证和评估.国外相关学者基于Sentinel-2A影像, 以地中海地区的落叶阔叶林和针阔混交林为研究对象, 利用随机森林回归方法对森林植物多样性进行评估, 结果发现估算的Shannon-Wiener多样性指数精度在0.29-0.31之间, 而Simpson多样性指数的估算精度可达0.31-0.37 (Chrysafis et al., 2020; Mallinis et al., 2020).本研究的结果与这些结论略有差异.本研究除了基于波段本身, 还加入了与植物多样性相关的指数作为随机森林的输入变量, 据此估算的Shannon-Wiener多样性指数精度较高, 但未发现光谱多样性与Simpson多样性指数有显著关系(R2 = 0.1), 这可能是受限于东北森林类型及其物种分布格局.今后的研究在应用到其他区域时, 可以在更大尺度上利用更多样方数据来进一步验证. ...
Species-level differences in hyperspectral metrics among tropical rainforest trees as determined by a tree-based classifier
1
2012
... 除了基于光谱多样性的方法, 基于机器学习的方法在森林植被分类和植物多样性监测中也得到了广泛的关注.随机森林(Breiman, 2001)是一种广泛被用于预测的非参数的机器学习算法, 它不假设数据的正态分布, 具有对噪声不敏感、分类更快更稳定的特点(Clark & Roberts, 2012; Miao et al., 2012), 是用于森林多样性建模的最优方法之一(Mallinis et al., 2020; Gyamfi-Ampadu et al., 2021).随机森林里包括用于评估模型准确性的集成交叉验证, 能对重要变量进行排序, 并以非线性的方式处理交互数据.Erinjery等(2018)采用最大似然法和随机森林分类的方法, 基于Sentinel-2光谱波段及其衍生的NDVI和纹理、Sentinel-1 SAR波段及其纹理对高海拔热带雨林不同植被类型图进行了绘制, 分类精度可达75%以上.Mallinis等(2020)基于4种不同分辨率的卫星数据, 利用随机森林回归的方法对森林植物多样性进行了评估, 结果发现基于WorldView-2图像生成的模型精度最高, Shannon-Wiener多样性指数估算精度为0.44, Simpson多样性指数为0.37. ...
Classification of tropical forest tree species using meter-scale image data
1
2019
... 近年来, 随着遥感技术的迅速发展, 使得在大尺度、多时空上评估生物多样性成为可能.遥感数据具有覆盖范围广、可持续性强以及可重复的特点(Nagendra, 2001; Duro et al., 2007), 有助于迅速地揭示大面积生物多样性丢失状况, 对大尺度、长时间序列的生物多样性评估至关重要(Turner, 2014).生物多样性遥感监测方法可总结为直接法和间接法两种(Turner et al., 2003).直接法是利用高空间分辨率和高光谱分辨率的卫星传感器直接识别物种、种群或群落.Ke等(2010)利用QuickBird高分辨率多光谱数据和激光雷达数据, 通过图像分割和基于目标的分类方法对森林物种进行识别, 发现两种数据均有较好的结果, 但是结合两种数据源能获取更高的精度, Kappa系数最高可达91.6%.Cross等(2019)利用WorldView-3卫星影像对热带森林里的6个森林物种进行了分类, 分类准确率高达85.37%.间接法是通过遥感数据反演与生物多样性密切相关的指标或参数, 再与野外实测数据构建统计模型以反演生物多样性.植被指数、植物生化组分和植被结构等都可以作为植物多样性研究的相关指标.归一化植被指数(NDVI)经常被用来指示区域的物种多样性(Fairbanks & Mcgwire, 2004; Feeley et al., 2005), 而增强型植被指数(EVI)则可以更好地在植被茂密的地区代替NDVI (Waring et al., 2006).此外, 与光谱变异相关的叶片叶绿素、氮含量、色素、水分等生化组分的变化也可以用来估算森林物种多样性(Carlson et al., 2007). ...
Spectral diversity area relationships for assessing biodiversity in a wildland-agriculture matrix
1
2016
... 光谱变异假说是生物多样性直接遥感监测的主要理论基础, 即遥感图像光谱多样性与物种多样性有关.光谱多样性, 有时也被称为光学多样性(Palmer et al., 2002; Ustin & Gamon, 2010)、光谱异质性或光谱变异性(Rocchini et al., 2010), 表征光谱反射率的空间变化, 这种变化与植物多样性相关的植物光学性状的差异有关, 可以用来反映物种多样性(Gillespie et al., 2008; Nagendra & Rocchini, 2008).基于光谱变异假说的光谱多样性与物种多样性的研究已经有很多, 在温带森林(Laliberté et al., 2020), 亚热带森林(Kalacska et al., 2007), 热带森林(Asner & Martin, 2009; Féret & Asner, 2014; Schäfer et al., 2016), 草原(Oldeland et al., 2010; Wang et al., 2016, 2018; Gholizadeh et al., 2020)均有报道.常用光谱多样性指数包括变异系数(CV)(Somers et al., 2015; Wang et al., 2016), 凸包体积(CHV)(Dahlin, 2016; Gholizadeh et al., 2018), 凸包面积(CHA)(Gholizadeh et al., 2018), 光谱角度制图(SAM)(Zhang et al., 2006; Gholizadeh et al., 2018), 光谱信息散度(SID)(Chang, 2000)等. ...
Visible/near infrared reflectance and chlorophyll content in Eucalyptus leaves
2
1999
... Formula of calculating vegetation index
Table 2 | 植被指数 Vegetation index | 计算公式 Calculate formula | 参考文献 Reference |
| TCARI | 3[(R699.19 - R668.98) - 0.2(R699.19 - R550.67)(R699.19/R668.98)] | Kim et al., 1994 |
| OSAVI | (1 + 0.16)(R750 - R705)/(R750 + R705 + 0.16) | Wu et al., 2008 |
| OSAVI2 | (1 + 0.16)(R800 - R670)/(R800 + R670 + 0.16) | Rondeaux et al., 1996 |
| DATT | (R850 - R710)/(R850 - R680) | Datt, 1999 |
| DATT2 | R850/R710 | Datt, 1999 |
| Gitelson | 1/R700 | Gitelson et al., 1999 |
| SR1 | R750/R700 | Gitelson & Merzlyak, 1997 |
| SR2 | R700/R670 | McMurtrey III et al., 1994 |
| SR3 | R730/R706 | Zarco-Tejada et al., 2003 |
| SR4 | R675/R700 | Gitelson et al., 2003 |
| MSI | R1600/R819 | Hunt & Rock, 1989 |
| NDII | (R819 - R1649)/(R819 + R1649) | Hardisky et al., 1983 |
| CRI1 | 1/R510 - 1/R550 | Gitelson et al., 2002 |
| CRI2 | 1/R510 - 1/R700 | Gitelson et al., 2002 |
| ARI | 1/R550 - 1/R700 | Sims & Gamon, 2002 |
| PSRI | (R680 - R500)/R750 | Merzlyak et al., 1999 |
| NDVI | (R750.66 - R704.6)/(R750.66 + R704.6) | Gitelson & Merzlyak, 1994 |
| GNDVI | (R783 - R560)/(R783 + R560) | Rozenstein et al., 2019 |
| TNDVI | ((R842 - R665)/(R842 + R665) + 0.5)^0.5 | Rozenstein et al., 2019 |
| WDVI | R842 - R665 × 0.5 | Rozenstein et al., 2019 |
| NDI45 | (R705 - R665)/(R705 + R665) | Delegido et al., 2011 |
| SAVI | (1 + L) × (R799.09 - R680.045)/(R799.09 + R680.045 + L) (L = 0.5) | Huete, 1988 |
| SAVI2 | R799.09/(R680.045+ b/a) (a = 0.969 1, b = 0.084 726) | Major et al., 1990 |
| ARVI | RB = R680.045 - r(R444.5 - R680.045) (r = 1)
ARVI = (R799.09 - RB)/(R799.09 + RB) | Kaufman & Tanre, 1992 |
| SARVI | RB = R680.045 - r(R444.5 - R680.045) (r = 1, L = 0.5)
SARVI = (1 + L)(R799.09 - RB)/(R799.09 + RB + L) | Kaufman & Tanre, 1992 |
| EVI | G(R799.09 - R680.045)/(R799.09 + C1R680.045 - C2R444.5 + L)
(G = 2.5, C1 = 6, C2 = 7.5, L = 1) | Huete et al., 1997 |
| IRECI | (R783 - R665)/(R705/R740) | Frampton et al., 2013 |
| IPVI | R842/(R842 + R665) | Rozenstein et al., 2019 |
| PSSRA | R783/R665 | Rozenstein et al., 2019 |
| RVI | R842/R665 | Rozenstein et al., 2019 |
ARI, 花青素反射指数; ARVI, 耐大气植被指数; CRI, 类胡萝卜素反射指数; DATT, DATT植被指数; EVI, 增强型植被指数; Gitelson, Gitelson植被指数; GNDVI,绿色归一化差异植被指数; IPVI, 红外植被百分比指数; IRECI, 倒红边叶绿素指数; MSI, 水分胁迫指数; NDI45, 归一化差异指数; NDII, 归一化红外指数; NDVI, 归一化植被指数; OSAVI, 优化型土壤调节植被指数; PSRI, 植物衰老反射指数; PSSRA, 特征色素简单比值指数; RVI, 比值植被指数; SARVI, 土壤大气阻抗植被指数; SAVI, 土壤调节植被指数; SR, 比值植被指数; TCARI, 转换型叶绿素吸收植被指数; TNDVI, 转化后的归一化植被指数; WDVI, 加权差分植被指数.公式中的R及右下角数字代表位于该波长处的反射值. ...
... Datt,
1999 | Gitelson | 1/R700 | Gitelson et al., 1999 |
| SR1 | R750/R700 | Gitelson & Merzlyak, 1997 |
| SR2 | R700/R670 | McMurtrey III et al., 1994 |
| SR3 | R730/R706 | Zarco-Tejada et al., 2003 |
| SR4 | R675/R700 | Gitelson et al., 2003 |
| MSI | R1600/R819 | Hunt & Rock, 1989 |
| NDII | (R819 - R1649)/(R819 + R1649) | Hardisky et al., 1983 |
| CRI1 | 1/R510 - 1/R550 | Gitelson et al., 2002 |
| CRI2 | 1/R510 - 1/R700 | Gitelson et al., 2002 |
| ARI | 1/R550 - 1/R700 | Sims & Gamon, 2002 |
| PSRI | (R680 - R500)/R750 | Merzlyak et al., 1999 |
| NDVI | (R750.66 - R704.6)/(R750.66 + R704.6) | Gitelson & Merzlyak, 1994 |
| GNDVI | (R783 - R560)/(R783 + R560) | Rozenstein et al., 2019 |
| TNDVI | ((R842 - R665)/(R842 + R665) + 0.5)^0.5 | Rozenstein et al., 2019 |
| WDVI | R842 - R665 × 0.5 | Rozenstein et al., 2019 |
| NDI45 | (R705 - R665)/(R705 + R665) | Delegido et al., 2011 |
| SAVI | (1 + L) × (R799.09 - R680.045)/(R799.09 + R680.045 + L) (L = 0.5) | Huete, 1988 |
| SAVI2 | R799.09/(R680.045+ b/a) (a = 0.969 1, b = 0.084 726) | Major et al., 1990 |
| ARVI | RB = R680.045 - r(R444.5 - R680.045) (r = 1)
ARVI = (R799.09 - RB)/(R799.09 + RB) | Kaufman & Tanre, 1992 |
| SARVI | RB = R680.045 - r(R444.5 - R680.045) (r = 1, L = 0.5)
SARVI = (1 + L)(R799.09 - RB)/(R799.09 + RB + L) | Kaufman & Tanre, 1992 |
| EVI | G(R799.09 - R680.045)/(R799.09 + C1R680.045 - C2R444.5 + L)
(G = 2.5, C1 = 6, C2 = 7.5, L = 1) | Huete et al., 1997 |
| IRECI | (R783 - R665)/(R705/R740) | Frampton et al., 2013 |
| IPVI | R842/(R842 + R665) | Rozenstein et al., 2019 |
| PSSRA | R783/R665 | Rozenstein et al., 2019 |
| RVI | R842/R665 | Rozenstein et al., 2019 |
ARI, 花青素反射指数; ARVI, 耐大气植被指数; CRI, 类胡萝卜素反射指数; DATT, DATT植被指数; EVI, 增强型植被指数; Gitelson, Gitelson植被指数; GNDVI,绿色归一化差异植被指数; IPVI, 红外植被百分比指数; IRECI, 倒红边叶绿素指数; MSI, 水分胁迫指数; NDI45, 归一化差异指数; NDII, 归一化红外指数; NDVI, 归一化植被指数; OSAVI, 优化型土壤调节植被指数; PSRI, 植物衰老反射指数; PSSRA, 特征色素简单比值指数; RVI, 比值植被指数; SARVI, 土壤大气阻抗植被指数; SAVI, 土壤调节植被指数; SR, 比值植被指数; TCARI, 转换型叶绿素吸收植被指数; TNDVI, 转化后的归一化植被指数; WDVI, 加权差分植被指数.公式中的R及右下角数字代表位于该波长处的反射值. ...
Evaluation of Sentinel-2 red-edge bands for empirical estimation of green LAI and chlorophyll content
1
2011
... Formula of calculating vegetation index
Table 2 | 植被指数 Vegetation index | 计算公式 Calculate formula | 参考文献 Reference |
| TCARI | 3[(R699.19 - R668.98) - 0.2(R699.19 - R550.67)(R699.19/R668.98)] | Kim et al., 1994 |
| OSAVI | (1 + 0.16)(R750 - R705)/(R750 + R705 + 0.16) | Wu et al., 2008 |
| OSAVI2 | (1 + 0.16)(R800 - R670)/(R800 + R670 + 0.16) | Rondeaux et al., 1996 |
| DATT | (R850 - R710)/(R850 - R680) | Datt, 1999 |
| DATT2 | R850/R710 | Datt, 1999 |
| Gitelson | 1/R700 | Gitelson et al., 1999 |
| SR1 | R750/R700 | Gitelson & Merzlyak, 1997 |
| SR2 | R700/R670 | McMurtrey III et al., 1994 |
| SR3 | R730/R706 | Zarco-Tejada et al., 2003 |
| SR4 | R675/R700 | Gitelson et al., 2003 |
| MSI | R1600/R819 | Hunt & Rock, 1989 |
| NDII | (R819 - R1649)/(R819 + R1649) | Hardisky et al., 1983 |
| CRI1 | 1/R510 - 1/R550 | Gitelson et al., 2002 |
| CRI2 | 1/R510 - 1/R700 | Gitelson et al., 2002 |
| ARI | 1/R550 - 1/R700 | Sims & Gamon, 2002 |
| PSRI | (R680 - R500)/R750 | Merzlyak et al., 1999 |
| NDVI | (R750.66 - R704.6)/(R750.66 + R704.6) | Gitelson & Merzlyak, 1994 |
| GNDVI | (R783 - R560)/(R783 + R560) | Rozenstein et al., 2019 |
| TNDVI | ((R842 - R665)/(R842 + R665) + 0.5)^0.5 | Rozenstein et al., 2019 |
| WDVI | R842 - R665 × 0.5 | Rozenstein et al., 2019 |
| NDI45 | (R705 - R665)/(R705 + R665) | Delegido et al., 2011 |
| SAVI | (1 + L) × (R799.09 - R680.045)/(R799.09 + R680.045 + L) (L = 0.5) | Huete, 1988 |
| SAVI2 | R799.09/(R680.045+ b/a) (a = 0.969 1, b = 0.084 726) | Major et al., 1990 |
| ARVI | RB = R680.045 - r(R444.5 - R680.045) (r = 1)
ARVI = (R799.09 - RB)/(R799.09 + RB) | Kaufman & Tanre, 1992 |
| SARVI | RB = R680.045 - r(R444.5 - R680.045) (r = 1, L = 0.5)
SARVI = (1 + L)(R799.09 - RB)/(R799.09 + RB + L) | Kaufman & Tanre, 1992 |
| EVI | G(R799.09 - R680.045)/(R799.09 + C1R680.045 - C2R444.5 + L)
(G = 2.5, C1 = 6, C2 = 7.5, L = 1) | Huete et al., 1997 |
| IRECI | (R783 - R665)/(R705/R740) | Frampton et al., 2013 |
| IPVI | R842/(R842 + R665) | Rozenstein et al., 2019 |
| PSSRA | R783/R665 | Rozenstein et al., 2019 |
| RVI | R842/R665 | Rozenstein et al., 2019 |
ARI, 花青素反射指数; ARVI, 耐大气植被指数; CRI, 类胡萝卜素反射指数; DATT, DATT植被指数; EVI, 增强型植被指数; Gitelson, Gitelson植被指数; GNDVI,绿色归一化差异植被指数; IPVI, 红外植被百分比指数; IRECI, 倒红边叶绿素指数; MSI, 水分胁迫指数; NDI45, 归一化差异指数; NDII, 归一化红外指数; NDVI, 归一化植被指数; OSAVI, 优化型土壤调节植被指数; PSRI, 植物衰老反射指数; PSSRA, 特征色素简单比值指数; RVI, 比值植被指数; SARVI, 土壤大气阻抗植被指数; SAVI, 土壤调节植被指数; SR, 比值植被指数; TCARI, 转换型叶绿素吸收植被指数; TNDVI, 转化后的归一化植被指数; WDVI, 加权差分植被指数.公式中的R及右下角数字代表位于该波长处的反射值. ...
Comparison of tree species classifications at the individual tree level by combining ALS data and RGB images using different algorithms
1
2016
... 凸包面积是一种新的光谱多样性指标(Deng et al., 2016; Gholizadeh et al., 2018).CHA是样方L的平均光谱和该样方内第V个像元的光谱所组成的二维空间中的凸包面积.如果一个像元的平均光谱和该区域的平均光谱相似或与其高度相关, 这些波段在图里的位置会近乎在一条直线上, 凸包面积趋于0.样方平均CHA的表达式如下: ...
机载激光雷达及高光谱的森林乔木物种多样性遥感监测
1
2018
... 基于聚类方法的估算结果略低于基于像元光谱多样性方法, 这可能是受影像分辨率的限制.影像的分辨率对估算生物多样性有直接的影响, 分类的精度主要依赖于种间的光谱变异性(Zhang et al., 2006).现有学者利用无人机和激光雷达数据, 将分辨率提高到单木水平, 通过单木分割并结合了植物叶片的生化组分以及结构参数等特征, 大大提高了分类精度(董文雪等, 2018; Zhao et al., 2018; 衣海燕等, 2020).在预测试的时候本研究也尝试其他聚类方法, 自定义模糊C均值聚类可以根据聚类有效性函数自动获取聚类数目, 解决了在物种数量未知时的初始值选择的问题(Zhao et al., 2018; 衣海燕等, 2020), 可以较好地解决遥感信息的不确定性及多解性.但与前人的研究结果相比, 本研究使用该方法得到的结果精度并不高, 这也主要是受空间分辨率的限制, 不能从单木尺度进行聚类. ...
Development of a large area biodiversity monitoring system driven by remote sensing
1
2007
... 近年来, 随着遥感技术的迅速发展, 使得在大尺度、多时空上评估生物多样性成为可能.遥感数据具有覆盖范围广、可持续性强以及可重复的特点(Nagendra, 2001; Duro et al., 2007), 有助于迅速地揭示大面积生物多样性丢失状况, 对大尺度、长时间序列的生物多样性评估至关重要(Turner, 2014).生物多样性遥感监测方法可总结为直接法和间接法两种(Turner et al., 2003).直接法是利用高空间分辨率和高光谱分辨率的卫星传感器直接识别物种、种群或群落.Ke等(2010)利用QuickBird高分辨率多光谱数据和激光雷达数据, 通过图像分割和基于目标的分类方法对森林物种进行识别, 发现两种数据均有较好的结果, 但是结合两种数据源能获取更高的精度, Kappa系数最高可达91.6%.Cross等(2019)利用WorldView-3卫星影像对热带森林里的6个森林物种进行了分类, 分类准确率高达85.37%.间接法是通过遥感数据反演与生物多样性密切相关的指标或参数, 再与野外实测数据构建统计模型以反演生物多样性.植被指数、植物生化组分和植被结构等都可以作为植物多样性研究的相关指标.归一化植被指数(NDVI)经常被用来指示区域的物种多样性(Fairbanks & Mcgwire, 2004; Feeley et al., 2005), 而增强型植被指数(EVI)则可以更好地在植被茂密的地区代替NDVI (Waring et al., 2006).此外, 与光谱变异相关的叶片叶绿素、氮含量、色素、水分等生化组分的变化也可以用来估算森林物种多样性(Carlson et al., 2007). ...
Compositional shifts in root-associated bacterial and archaeal microbiota track the plant life cycle in field-grown rice
1
2018
... 利用44个变量初步构建随机森林回归模型, 对这些变量进行重要性评估.变量的重要性排序按“%IncMSE”的大小表示, “%IncMSE”即increase in mean squared error, 是基于每一棵决策树的袋外数据误差, 通过对每一个预测变量随机赋值, 如果袋外数据误差增幅越大, 其值被随机替换后模型估算的误差就越大, 说明该变量的重要性越高.但某些变量可能对多样性的估算作用很小, 或者变量间存在共线性, 从而影响回归结果.为进一步提高随机森林的估算精度, 减少噪声和冗余信息的干扰, 本研究基于十折交叉验证对变量进行筛选, 选取重要性高且使交叉验证误差最小的特征变量作为模型的输入变量(Genuer et al., 2010; Edwards et al., 2018).基于所选择的变量构建最终的随机森林回归模型, 使用留一法验证模型精度.输入变量选择在R语言的“randomforest”包中实现, 留一法交叉验证在python中的sklearn库中实现. ...
Mapping and assessment of vegetation types in the tropical rainforests of the Western Ghats using multispectral Sentinel-2 and SAR Sentinel-1 satellite imagery
1
2018
... 除了基于光谱多样性的方法, 基于机器学习的方法在森林植被分类和植物多样性监测中也得到了广泛的关注.随机森林(Breiman, 2001)是一种广泛被用于预测的非参数的机器学习算法, 它不假设数据的正态分布, 具有对噪声不敏感、分类更快更稳定的特点(Clark & Roberts, 2012; Miao et al., 2012), 是用于森林多样性建模的最优方法之一(Mallinis et al., 2020; Gyamfi-Ampadu et al., 2021).随机森林里包括用于评估模型准确性的集成交叉验证, 能对重要变量进行排序, 并以非线性的方式处理交互数据.Erinjery等(2018)采用最大似然法和随机森林分类的方法, 基于Sentinel-2光谱波段及其衍生的NDVI和纹理、Sentinel-1 SAR波段及其纹理对高海拔热带雨林不同植被类型图进行了绘制, 分类精度可达75%以上.Mallinis等(2020)基于4种不同分辨率的卫星数据, 利用随机森林回归的方法对森林植物多样性进行了评估, 结果发现基于WorldView-2图像生成的模型精度最高, Shannon-Wiener多样性指数估算精度为0.44, Simpson多样性指数为0.37. ...
Patterns of floristic richness in vegetation communities of California: regional scale analysis with multi-temporal NDVI
1
2004
... 近年来, 随着遥感技术的迅速发展, 使得在大尺度、多时空上评估生物多样性成为可能.遥感数据具有覆盖范围广、可持续性强以及可重复的特点(Nagendra, 2001; Duro et al., 2007), 有助于迅速地揭示大面积生物多样性丢失状况, 对大尺度、长时间序列的生物多样性评估至关重要(Turner, 2014).生物多样性遥感监测方法可总结为直接法和间接法两种(Turner et al., 2003).直接法是利用高空间分辨率和高光谱分辨率的卫星传感器直接识别物种、种群或群落.Ke等(2010)利用QuickBird高分辨率多光谱数据和激光雷达数据, 通过图像分割和基于目标的分类方法对森林物种进行识别, 发现两种数据均有较好的结果, 但是结合两种数据源能获取更高的精度, Kappa系数最高可达91.6%.Cross等(2019)利用WorldView-3卫星影像对热带森林里的6个森林物种进行了分类, 分类准确率高达85.37%.间接法是通过遥感数据反演与生物多样性密切相关的指标或参数, 再与野外实测数据构建统计模型以反演生物多样性.植被指数、植物生化组分和植被结构等都可以作为植物多样性研究的相关指标.归一化植被指数(NDVI)经常被用来指示区域的物种多样性(Fairbanks & Mcgwire, 2004; Feeley et al., 2005), 而增强型植被指数(EVI)则可以更好地在植被茂密的地区代替NDVI (Waring et al., 2006).此外, 与光谱变异相关的叶片叶绿素、氮含量、色素、水分等生化组分的变化也可以用来估算森林物种多样性(Carlson et al., 2007). ...
Prediction of plant diversity in grasslands using Sentinel-1 and -2 satellite image time series
1
2020
... 但是, 研究发现两种光谱多样性指数均不能估算Simpson多样性指数和物种丰富度.这主要是由于遥感估算多样性是基于面上的信息, 物种所占的面积比例对影像光谱的影响更大, 而非物种的个数.Shannon-Wiener多样性指数考虑了物种的数量和每个物种的相对丰度用以衡量异质性(Pielou, 1966), 所以估算精度较高, 而Simpson多样性指数则是反映群落中少数物种的优势度(Fauvel et al., 2020).此外, 多样性指数的估算比物种丰富度指数的估算更准确, 可能是因为丰富度仅基于物种的存在或缺失, 稀有物种的存在会影响物种丰富度, 但在影像上可能难以监测.在森林中稀有物种的冠幅占比较小, Sentinel-2A卫星的分辨率有限, 传感器很难检测到细微的单个物种变化, 而更多地指示像元内优势物种变异, 因此Shannon-Wiener多样性指数更适合区域尺度森林植物多样性的遥感估算(Oldeland et al., 2010). ...
The utility of spectral indices from Landsat ETM+ for measuring the structure and composition of tropical dry forests
1
2005
... 近年来, 随着遥感技术的迅速发展, 使得在大尺度、多时空上评估生物多样性成为可能.遥感数据具有覆盖范围广、可持续性强以及可重复的特点(Nagendra, 2001; Duro et al., 2007), 有助于迅速地揭示大面积生物多样性丢失状况, 对大尺度、长时间序列的生物多样性评估至关重要(Turner, 2014).生物多样性遥感监测方法可总结为直接法和间接法两种(Turner et al., 2003).直接法是利用高空间分辨率和高光谱分辨率的卫星传感器直接识别物种、种群或群落.Ke等(2010)利用QuickBird高分辨率多光谱数据和激光雷达数据, 通过图像分割和基于目标的分类方法对森林物种进行识别, 发现两种数据均有较好的结果, 但是结合两种数据源能获取更高的精度, Kappa系数最高可达91.6%.Cross等(2019)利用WorldView-3卫星影像对热带森林里的6个森林物种进行了分类, 分类准确率高达85.37%.间接法是通过遥感数据反演与生物多样性密切相关的指标或参数, 再与野外实测数据构建统计模型以反演生物多样性.植被指数、植物生化组分和植被结构等都可以作为植物多样性研究的相关指标.归一化植被指数(NDVI)经常被用来指示区域的物种多样性(Fairbanks & Mcgwire, 2004; Feeley et al., 2005), 而增强型植被指数(EVI)则可以更好地在植被茂密的地区代替NDVI (Waring et al., 2006).此外, 与光谱变异相关的叶片叶绿素、氮含量、色素、水分等生化组分的变化也可以用来估算森林物种多样性(Carlson et al., 2007). ...
Mapping tropical forest canopy diversity using high-fidelity imaging spectroscopy
2
2014
... 光谱变异假说是生物多样性直接遥感监测的主要理论基础, 即遥感图像光谱多样性与物种多样性有关.光谱多样性, 有时也被称为光学多样性(Palmer et al., 2002; Ustin & Gamon, 2010)、光谱异质性或光谱变异性(Rocchini et al., 2010), 表征光谱反射率的空间变化, 这种变化与植物多样性相关的植物光学性状的差异有关, 可以用来反映物种多样性(Gillespie et al., 2008; Nagendra & Rocchini, 2008).基于光谱变异假说的光谱多样性与物种多样性的研究已经有很多, 在温带森林(Laliberté et al., 2020), 亚热带森林(Kalacska et al., 2007), 热带森林(Asner & Martin, 2009; Féret & Asner, 2014; Schäfer et al., 2016), 草原(Oldeland et al., 2010; Wang et al., 2016, 2018; Gholizadeh et al., 2020)均有报道.常用光谱多样性指数包括变异系数(CV)(Somers et al., 2015; Wang et al., 2016), 凸包体积(CHV)(Dahlin, 2016; Gholizadeh et al., 2018), 凸包面积(CHA)(Gholizadeh et al., 2018), 光谱角度制图(SAM)(Zhang et al., 2006; Gholizadeh et al., 2018), 光谱信息散度(SID)(Chang, 2000)等. ...
... 聚类分析是一种根据数据相似性划分分组的无监督分类方法, 这种方法与训练数据收集和数据分布无关, 可以直接映射植物多样性而不单独辨别树种(Féret & Asner, 2014; Féret & de Boissieu, 2020).聚类的方法很多, 本研究用到的是K均值聚类, 在尝试了3 × 3、5 × 5、7 × 7和9 × 9的聚类窗口后, 最终选定了聚类效果最好的5 × 5的聚类窗口.原因主要是受影像分辨率的限制, 更小的窗口导致聚类效果受影响, 无法聚类, 扩大窗口范围则不能与实地野外调查的样地大小相匹配, 估算结果误差较大.当所选的移动窗口为5 × 5时, 根据聚类结果计算得到的Shannon-Wiener多样性指数的估算结果最好(R2 = 0.58, p < 0.01), 7 × 7的移动窗口估算结果次之(R2 = 0.33, p < 0.01), 9 × 9的移动窗口效果最差(R2 = 0.26, p < 0.05).通过聚类的方法获得的其他指数与实测值均无显著关系, 可能是因为通过聚类得到的物种数是基于光谱的波谱物种数, 并不是实际的物种数, 以此计算的结果与实测值有一定差异. ...
biodivMapR: an R package for α- and β-diversity mapping using remotely sensed images
2
2020
... 然而, 由于物种内的光谱变异会混淆物种间的光谱多样性, 进一步影响植物多样性的预测精度.聚类分析作为一种非监督分类绘制植物多样性图的有效方法, 可以基于聚类结果进一步计算光谱异质性, 能够在一定程度上减少物种内光谱变异(Medina et al., 2013; Féret & de Boissieu, 2020).目前使用非监督分类方法的森林植物多样性研究还较少.Féret和de Boissieu (2020)基于Sentinel-2光谱影像, 利用K均值聚类生成光谱物种图, 再以此绘制了亚马孙某片森林的α和β多样性.也有研究基于分辨率更高的高光谱影像, 通过不同聚类方法反演植物多样性.Medina等(2013)基于AISA机载高光谱数据, 利用光谱方差估算物种丰富度, 发现基于层次聚类得到的Shannon-Wiener多样性指数与野外数据之间的相关性是可变的, 甚至在某些情况下是负的, 但在聚类后进行光谱解混可以显著改善.Zhao等(2018)利用机载高光谱和激光雷达数据对神农架自然保护区森林冠层的单木进行分割, 利用自适应模糊C均值聚类方法, 估算了该区域的树种丰富度和Shannon-Wiener多样性指数(R2 = 0.83, 均方根误差(RMSE) = 0.25). ...
... 聚类分析是一种根据数据相似性划分分组的无监督分类方法, 这种方法与训练数据收集和数据分布无关, 可以直接映射植物多样性而不单独辨别树种(Féret & Asner, 2014; Féret & de Boissieu, 2020).聚类的方法很多, 本研究用到的是K均值聚类, 在尝试了3 × 3、5 × 5、7 × 7和9 × 9的聚类窗口后, 最终选定了聚类效果最好的5 × 5的聚类窗口.原因主要是受影像分辨率的限制, 更小的窗口导致聚类效果受影响, 无法聚类, 扩大窗口范围则不能与实地野外调查的样地大小相匹配, 估算结果误差较大.当所选的移动窗口为5 × 5时, 根据聚类结果计算得到的Shannon-Wiener多样性指数的估算结果最好(R2 = 0.58, p < 0.01), 7 × 7的移动窗口估算结果次之(R2 = 0.33, p < 0.01), 9 × 9的移动窗口效果最差(R2 = 0.26, p < 0.05).通过聚类的方法获得的其他指数与实测值均无显著关系, 可能是因为通过聚类得到的物种数是基于光谱的波谱物种数, 并不是实际的物种数, 以此计算的结果与实测值有一定差异. ...
Evaluating the capabilities of Sentinel-2 for quantitative estimation of biophysical variables in vegetation
1
2013
... Formula of calculating vegetation index
Table 2 | 植被指数 Vegetation index | 计算公式 Calculate formula | 参考文献 Reference |
| TCARI | 3[(R699.19 - R668.98) - 0.2(R699.19 - R550.67)(R699.19/R668.98)] | Kim et al., 1994 |
| OSAVI | (1 + 0.16)(R750 - R705)/(R750 + R705 + 0.16) | Wu et al., 2008 |
| OSAVI2 | (1 + 0.16)(R800 - R670)/(R800 + R670 + 0.16) | Rondeaux et al., 1996 |
| DATT | (R850 - R710)/(R850 - R680) | Datt, 1999 |
| DATT2 | R850/R710 | Datt, 1999 |
| Gitelson | 1/R700 | Gitelson et al., 1999 |
| SR1 | R750/R700 | Gitelson & Merzlyak, 1997 |
| SR2 | R700/R670 | McMurtrey III et al., 1994 |
| SR3 | R730/R706 | Zarco-Tejada et al., 2003 |
| SR4 | R675/R700 | Gitelson et al., 2003 |
| MSI | R1600/R819 | Hunt & Rock, 1989 |
| NDII | (R819 - R1649)/(R819 + R1649) | Hardisky et al., 1983 |
| CRI1 | 1/R510 - 1/R550 | Gitelson et al., 2002 |
| CRI2 | 1/R510 - 1/R700 | Gitelson et al., 2002 |
| ARI | 1/R550 - 1/R700 | Sims & Gamon, 2002 |
| PSRI | (R680 - R500)/R750 | Merzlyak et al., 1999 |
| NDVI | (R750.66 - R704.6)/(R750.66 + R704.6) | Gitelson & Merzlyak, 1994 |
| GNDVI | (R783 - R560)/(R783 + R560) | Rozenstein et al., 2019 |
| TNDVI | ((R842 - R665)/(R842 + R665) + 0.5)^0.5 | Rozenstein et al., 2019 |
| WDVI | R842 - R665 × 0.5 | Rozenstein et al., 2019 |
| NDI45 | (R705 - R665)/(R705 + R665) | Delegido et al., 2011 |
| SAVI | (1 + L) × (R799.09 - R680.045)/(R799.09 + R680.045 + L) (L = 0.5) | Huete, 1988 |
| SAVI2 | R799.09/(R680.045+ b/a) (a = 0.969 1, b = 0.084 726) | Major et al., 1990 |
| ARVI | RB = R680.045 - r(R444.5 - R680.045) (r = 1)
ARVI = (R799.09 - RB)/(R799.09 + RB) | Kaufman & Tanre, 1992 |
| SARVI | RB = R680.045 - r(R444.5 - R680.045) (r = 1, L = 0.5)
SARVI = (1 + L)(R799.09 - RB)/(R799.09 + RB + L) | Kaufman & Tanre, 1992 |
| EVI | G(R799.09 - R680.045)/(R799.09 + C1R680.045 - C2R444.5 + L)
(G = 2.5, C1 = 6, C2 = 7.5, L = 1) | Huete et al., 1997 |
| IRECI | (R783 - R665)/(R705/R740) | Frampton et al., 2013 |
| IPVI | R842/(R842 + R665) | Rozenstein et al., 2019 |
| PSSRA | R783/R665 | Rozenstein et al., 2019 |
| RVI | R842/R665 | Rozenstein et al., 2019 |
ARI, 花青素反射指数; ARVI, 耐大气植被指数; CRI, 类胡萝卜素反射指数; DATT, DATT植被指数; EVI, 增强型植被指数; Gitelson, Gitelson植被指数; GNDVI,绿色归一化差异植被指数; IPVI, 红外植被百分比指数; IRECI, 倒红边叶绿素指数; MSI, 水分胁迫指数; NDI45, 归一化差异指数; NDII, 归一化红外指数; NDVI, 归一化植被指数; OSAVI, 优化型土壤调节植被指数; PSRI, 植物衰老反射指数; PSSRA, 特征色素简单比值指数; RVI, 比值植被指数; SARVI, 土壤大气阻抗植被指数; SAVI, 土壤调节植被指数; SR, 比值植被指数; TCARI, 转换型叶绿素吸收植被指数; TNDVI, 转化后的归一化植被指数; WDVI, 加权差分植被指数.公式中的R及右下角数字代表位于该波长处的反射值. ...
Variable selection using Random forests
1
2010
... 利用44个变量初步构建随机森林回归模型, 对这些变量进行重要性评估.变量的重要性排序按“%IncMSE”的大小表示, “%IncMSE”即increase in mean squared error, 是基于每一棵决策树的袋外数据误差, 通过对每一个预测变量随机赋值, 如果袋外数据误差增幅越大, 其值被随机替换后模型估算的误差就越大, 说明该变量的重要性越高.但某些变量可能对多样性的估算作用很小, 或者变量间存在共线性, 从而影响回归结果.为进一步提高随机森林的估算精度, 减少噪声和冗余信息的干扰, 本研究基于十折交叉验证对变量进行筛选, 选取重要性高且使交叉验证误差最小的特征变量作为模型的输入变量(Genuer et al., 2010; Edwards et al., 2018).基于所选择的变量构建最终的随机森林回归模型, 使用留一法验证模型精度.输入变量选择在R语言的“randomforest”包中实现, 留一法交叉验证在python中的sklearn库中实现. ...
Multi-temporal assessment of grassland α- and β-diversity using hyperspectral imaging
1
2020
... 光谱变异假说是生物多样性直接遥感监测的主要理论基础, 即遥感图像光谱多样性与物种多样性有关.光谱多样性, 有时也被称为光学多样性(Palmer et al., 2002; Ustin & Gamon, 2010)、光谱异质性或光谱变异性(Rocchini et al., 2010), 表征光谱反射率的空间变化, 这种变化与植物多样性相关的植物光学性状的差异有关, 可以用来反映物种多样性(Gillespie et al., 2008; Nagendra & Rocchini, 2008).基于光谱变异假说的光谱多样性与物种多样性的研究已经有很多, 在温带森林(Laliberté et al., 2020), 亚热带森林(Kalacska et al., 2007), 热带森林(Asner & Martin, 2009; Féret & Asner, 2014; Schäfer et al., 2016), 草原(Oldeland et al., 2010; Wang et al., 2016, 2018; Gholizadeh et al., 2020)均有报道.常用光谱多样性指数包括变异系数(CV)(Somers et al., 2015; Wang et al., 2016), 凸包体积(CHV)(Dahlin, 2016; Gholizadeh et al., 2018), 凸包面积(CHA)(Gholizadeh et al., 2018), 光谱角度制图(SAM)(Zhang et al., 2006; Gholizadeh et al., 2018), 光谱信息散度(SID)(Chang, 2000)等. ...
Detecting prairie biodiversity with airborne remote sensing
1
2019
... 除了基于光谱多样性方法, 本研究也采用了机器学习的方法对森林植物多样性进行了估算, 结果发现基于所选特征指数的随机森林回归对Shannon- Wiener多样性指数有较好的反演结果(R2 = 0.79, p < 0.01), 而对其他多样性指数的估算效果较低.随机森林估算结果的准确性主要受两个方面因素的影响.一方面是受影像分辨率的影响, 影像分辨率不同对研究结果会产生一定影响.在草地生态系统中的大规模模拟研究表明, α多样性的估算精度随着空间分辨率的降低而下降, 最佳的估算精度是像元 大小与单个植株大小相接近时的精度(Wang et al., 2018).这是因为遥感反映的是面上的信息, 利用遥感数据计算的不是物种间的光谱变异, 而是用像元代表的群落间的光谱变异间接指示物种间的变异,其中存在一定的误差, 而将分辨率提升到单木尺度会提高估算精度.另一方面受输入特征变量的影响, 本研究在44个输入变量中通过十折交叉验证对变量进行了筛选, 最后挑选了使估算结果最好的6个特征变量, 去除了变量间共线性和冗余信息的干扰.在变量挑选时发现输入的两种光谱多样性指数的重要性排序明显高于其余的特征变量, 说明这两种指数可以作为随机森林估算植物多样性的重要指标, 间接证明了前面直接利用两种指标进行植物多样性估算的可行性和合理性.但是, 重要性排序中的CV的重要性程度略高于CHA, 这可能是因为CHA与其他植被指数间存在一定相关性, 会对重要性结果产生一定影响.此外, 在森林生态系统类型中, 森林的空间分布和结构参数也会影响估算结果(Marceau et al., 1994; Gholizadeh et al., 2019), 即使采用相同分辨率的影像, 在不同地区或不同森林类型中结果可能存在一定差异(Mallinis et al., 2020; Gyamfi-Ampadu et al., 2021). ...
Remote sensing of biodiv improve ersity: soil correction and data dimension reduction methods assessment of α-diversity (species richness) in prairie ecosystems
6
2018
... 光谱变异假说是生物多样性直接遥感监测的主要理论基础, 即遥感图像光谱多样性与物种多样性有关.光谱多样性, 有时也被称为光学多样性(Palmer et al., 2002; Ustin & Gamon, 2010)、光谱异质性或光谱变异性(Rocchini et al., 2010), 表征光谱反射率的空间变化, 这种变化与植物多样性相关的植物光学性状的差异有关, 可以用来反映物种多样性(Gillespie et al., 2008; Nagendra & Rocchini, 2008).基于光谱变异假说的光谱多样性与物种多样性的研究已经有很多, 在温带森林(Laliberté et al., 2020), 亚热带森林(Kalacska et al., 2007), 热带森林(Asner & Martin, 2009; Féret & Asner, 2014; Schäfer et al., 2016), 草原(Oldeland et al., 2010; Wang et al., 2016, 2018; Gholizadeh et al., 2020)均有报道.常用光谱多样性指数包括变异系数(CV)(Somers et al., 2015; Wang et al., 2016), 凸包体积(CHV)(Dahlin, 2016; Gholizadeh et al., 2018), 凸包面积(CHA)(Gholizadeh et al., 2018), 光谱角度制图(SAM)(Zhang et al., 2006; Gholizadeh et al., 2018), 光谱信息散度(SID)(Chang, 2000)等. ...
... ., 2018), 光谱角度制图(SAM)(Zhang et al., 2006; Gholizadeh et al., 2018), 光谱信息散度(SID)(Chang, 2000)等. ...
... ., 2018), 光谱信息散度(SID)(Chang, 2000)等. ...
... 凸包面积是一种新的光谱多样性指标(Deng et al., 2016; Gholizadeh et al., 2018).CHA是样方L的平均光谱和该样方内第V个像元的光谱所组成的二维空间中的凸包面积.如果一个像元的平均光谱和该区域的平均光谱相似或与其高度相关, 这些波段在图里的位置会近乎在一条直线上, 凸包面积趋于0.样方平均CHA的表达式如下: ...
... 本研究基于像元光谱反射率计算了变异系数和凸包面积两种光谱多样性指数, 结果发现两种指数均能很好地估算Shannon-Wiener多样性指数(p < 0.01).这一结果与之前的研究(Lucas & Carter, 2008; Somers et al., 2015; Gholizadeh et al., 2018)一致, 表明CV和CHA是反映α多样性的有用指标.基于波段选择的凸包面积最早应用于草地生物多样性监测(Gholizadeh et al., 2018), 但在森林中还没有进一步的应用.此外, 本研究发现基于影像像元计算的CHA对实测的Shannon-Wiener多样性指数估算精度最高, 进一步证实了Gholizadeh的研究结论, 该研究发现随着分辨率降低, CHA优于包括CV在内的所有其他指标.一般来说, 空间分辨率的降低会产生混合像元, 进一步导致光谱异质性(Rocchini, 2007; Xi et al., 2019).在所用影像都为中分辨率的情况下, CV的计算是用每个波段所有像元的变异系数之和除以波段数, 而CHA是先求出所有波段的变异再除以像元数.前者是整合所有波段值的空间变异, 可能反映所有物种或群落波谱变异的平均值, 而后者是每个波段空间变异的平均值, 可能反映所有物种或群落波谱变异的空间异质性, 更能体现物种或群落间的多样性. ...
... ., 2018), 但在森林中还没有进一步的应用.此外, 本研究发现基于影像像元计算的CHA对实测的Shannon-Wiener多样性指数估算精度最高, 进一步证实了Gholizadeh的研究结论, 该研究发现随着分辨率降低, CHA优于包括CV在内的所有其他指标.一般来说, 空间分辨率的降低会产生混合像元, 进一步导致光谱异质性(Rocchini, 2007; Xi et al., 2019).在所用影像都为中分辨率的情况下, CV的计算是用每个波段所有像元的变异系数之和除以波段数, 而CHA是先求出所有波段的变异再除以像元数.前者是整合所有波段值的空间变异, 可能反映所有物种或群落波谱变异的平均值, 而后者是每个波段空间变异的平均值, 可能反映所有物种或群落波谱变异的空间异质性, 更能体现物种或群落间的多样性. ...
Measuring and modelling biodiversity from space
1
2008
... 光谱变异假说是生物多样性直接遥感监测的主要理论基础, 即遥感图像光谱多样性与物种多样性有关.光谱多样性, 有时也被称为光学多样性(Palmer et al., 2002; Ustin & Gamon, 2010)、光谱异质性或光谱变异性(Rocchini et al., 2010), 表征光谱反射率的空间变化, 这种变化与植物多样性相关的植物光学性状的差异有关, 可以用来反映物种多样性(Gillespie et al., 2008; Nagendra & Rocchini, 2008).基于光谱变异假说的光谱多样性与物种多样性的研究已经有很多, 在温带森林(Laliberté et al., 2020), 亚热带森林(Kalacska et al., 2007), 热带森林(Asner & Martin, 2009; Féret & Asner, 2014; Schäfer et al., 2016), 草原(Oldeland et al., 2010; Wang et al., 2016, 2018; Gholizadeh et al., 2020)均有报道.常用光谱多样性指数包括变异系数(CV)(Somers et al., 2015; Wang et al., 2016), 凸包体积(CHV)(Dahlin, 2016; Gholizadeh et al., 2018), 凸包面积(CHA)(Gholizadeh et al., 2018), 光谱角度制图(SAM)(Zhang et al., 2006; Gholizadeh et al., 2018), 光谱信息散度(SID)(Chang, 2000)等. ...
Quantitative estimation of chlorophyll-a using reflectance spectra: experiments with autumn chestnut and maple leaves
1
1994
... Formula of calculating vegetation index
Table 2 | 植被指数 Vegetation index | 计算公式 Calculate formula | 参考文献 Reference |
| TCARI | 3[(R699.19 - R668.98) - 0.2(R699.19 - R550.67)(R699.19/R668.98)] | Kim et al., 1994 |
| OSAVI | (1 + 0.16)(R750 - R705)/(R750 + R705 + 0.16) | Wu et al., 2008 |
| OSAVI2 | (1 + 0.16)(R800 - R670)/(R800 + R670 + 0.16) | Rondeaux et al., 1996 |
| DATT | (R850 - R710)/(R850 - R680) | Datt, 1999 |
| DATT2 | R850/R710 | Datt, 1999 |
| Gitelson | 1/R700 | Gitelson et al., 1999 |
| SR1 | R750/R700 | Gitelson & Merzlyak, 1997 |
| SR2 | R700/R670 | McMurtrey III et al., 1994 |
| SR3 | R730/R706 | Zarco-Tejada et al., 2003 |
| SR4 | R675/R700 | Gitelson et al., 2003 |
| MSI | R1600/R819 | Hunt & Rock, 1989 |
| NDII | (R819 - R1649)/(R819 + R1649) | Hardisky et al., 1983 |
| CRI1 | 1/R510 - 1/R550 | Gitelson et al., 2002 |
| CRI2 | 1/R510 - 1/R700 | Gitelson et al., 2002 |
| ARI | 1/R550 - 1/R700 | Sims & Gamon, 2002 |
| PSRI | (R680 - R500)/R750 | Merzlyak et al., 1999 |
| NDVI | (R750.66 - R704.6)/(R750.66 + R704.6) | Gitelson & Merzlyak, 1994 |
| GNDVI | (R783 - R560)/(R783 + R560) | Rozenstein et al., 2019 |
| TNDVI | ((R842 - R665)/(R842 + R665) + 0.5)^0.5 | Rozenstein et al., 2019 |
| WDVI | R842 - R665 × 0.5 | Rozenstein et al., 2019 |
| NDI45 | (R705 - R665)/(R705 + R665) | Delegido et al., 2011 |
| SAVI | (1 + L) × (R799.09 - R680.045)/(R799.09 + R680.045 + L) (L = 0.5) | Huete, 1988 |
| SAVI2 | R799.09/(R680.045+ b/a) (a = 0.969 1, b = 0.084 726) | Major et al., 1990 |
| ARVI | RB = R680.045 - r(R444.5 - R680.045) (r = 1)
ARVI = (R799.09 - RB)/(R799.09 + RB) | Kaufman & Tanre, 1992 |
| SARVI | RB = R680.045 - r(R444.5 - R680.045) (r = 1, L = 0.5)
SARVI = (1 + L)(R799.09 - RB)/(R799.09 + RB + L) | Kaufman & Tanre, 1992 |
| EVI | G(R799.09 - R680.045)/(R799.09 + C1R680.045 - C2R444.5 + L)
(G = 2.5, C1 = 6, C2 = 7.5, L = 1) | Huete et al., 1997 |
| IRECI | (R783 - R665)/(R705/R740) | Frampton et al., 2013 |
| IPVI | R842/(R842 + R665) | Rozenstein et al., 2019 |
| PSSRA | R783/R665 | Rozenstein et al., 2019 |
| RVI | R842/R665 | Rozenstein et al., 2019 |
ARI, 花青素反射指数; ARVI, 耐大气植被指数; CRI, 类胡萝卜素反射指数; DATT, DATT植被指数; EVI, 增强型植被指数; Gitelson, Gitelson植被指数; GNDVI,绿色归一化差异植被指数; IPVI, 红外植被百分比指数; IRECI, 倒红边叶绿素指数; MSI, 水分胁迫指数; NDI45, 归一化差异指数; NDII, 归一化红外指数; NDVI, 归一化植被指数; OSAVI, 优化型土壤调节植被指数; PSRI, 植物衰老反射指数; PSSRA, 特征色素简单比值指数; RVI, 比值植被指数; SARVI, 土壤大气阻抗植被指数; SAVI, 土壤调节植被指数; SR, 比值植被指数; TCARI, 转换型叶绿素吸收植被指数; TNDVI, 转化后的归一化植被指数; WDVI, 加权差分植被指数.公式中的R及右下角数字代表位于该波长处的反射值. ...
The chlorophyll fluorescence ratio F735/F700 as an accurate measure of the chlorophyll content in plants
1
1999
... Formula of calculating vegetation index
Table 2 | 植被指数 Vegetation index | 计算公式 Calculate formula | 参考文献 Reference |
| TCARI | 3[(R699.19 - R668.98) - 0.2(R699.19 - R550.67)(R699.19/R668.98)] | Kim et al., 1994 |
| OSAVI | (1 + 0.16)(R750 - R705)/(R750 + R705 + 0.16) | Wu et al., 2008 |
| OSAVI2 | (1 + 0.16)(R800 - R670)/(R800 + R670 + 0.16) | Rondeaux et al., 1996 |
| DATT | (R850 - R710)/(R850 - R680) | Datt, 1999 |
| DATT2 | R850/R710 | Datt, 1999 |
| Gitelson | 1/R700 | Gitelson et al., 1999 |
| SR1 | R750/R700 | Gitelson & Merzlyak, 1997 |
| SR2 | R700/R670 | McMurtrey III et al., 1994 |
| SR3 | R730/R706 | Zarco-Tejada et al., 2003 |
| SR4 | R675/R700 | Gitelson et al., 2003 |
| MSI | R1600/R819 | Hunt & Rock, 1989 |
| NDII | (R819 - R1649)/(R819 + R1649) | Hardisky et al., 1983 |
| CRI1 | 1/R510 - 1/R550 | Gitelson et al., 2002 |
| CRI2 | 1/R510 - 1/R700 | Gitelson et al., 2002 |
| ARI | 1/R550 - 1/R700 | Sims & Gamon, 2002 |
| PSRI | (R680 - R500)/R750 | Merzlyak et al., 1999 |
| NDVI | (R750.66 - R704.6)/(R750.66 + R704.6) | Gitelson & Merzlyak, 1994 |
| GNDVI | (R783 - R560)/(R783 + R560) | Rozenstein et al., 2019 |
| TNDVI | ((R842 - R665)/(R842 + R665) + 0.5)^0.5 | Rozenstein et al., 2019 |
| WDVI | R842 - R665 × 0.5 | Rozenstein et al., 2019 |
| NDI45 | (R705 - R665)/(R705 + R665) | Delegido et al., 2011 |
| SAVI | (1 + L) × (R799.09 - R680.045)/(R799.09 + R680.045 + L) (L = 0.5) | Huete, 1988 |
| SAVI2 | R799.09/(R680.045+ b/a) (a = 0.969 1, b = 0.084 726) | Major et al., 1990 |
| ARVI | RB = R680.045 - r(R444.5 - R680.045) (r = 1)
ARVI = (R799.09 - RB)/(R799.09 + RB) | Kaufman & Tanre, 1992 |
| SARVI | RB = R680.045 - r(R444.5 - R680.045) (r = 1, L = 0.5)
SARVI = (1 + L)(R799.09 - RB)/(R799.09 + RB + L) | Kaufman & Tanre, 1992 |
| EVI | G(R799.09 - R680.045)/(R799.09 + C1R680.045 - C2R444.5 + L)
(G = 2.5, C1 = 6, C2 = 7.5, L = 1) | Huete et al., 1997 |
| IRECI | (R783 - R665)/(R705/R740) | Frampton et al., 2013 |
| IPVI | R842/(R842 + R665) | Rozenstein et al., 2019 |
| PSSRA | R783/R665 | Rozenstein et al., 2019 |
| RVI | R842/R665 | Rozenstein et al., 2019 |
ARI, 花青素反射指数; ARVI, 耐大气植被指数; CRI, 类胡萝卜素反射指数; DATT, DATT植被指数; EVI, 增强型植被指数; Gitelson, Gitelson植被指数; GNDVI,绿色归一化差异植被指数; IPVI, 红外植被百分比指数; IRECI, 倒红边叶绿素指数; MSI, 水分胁迫指数; NDI45, 归一化差异指数; NDII, 归一化红外指数; NDVI, 归一化植被指数; OSAVI, 优化型土壤调节植被指数; PSRI, 植物衰老反射指数; PSSRA, 特征色素简单比值指数; RVI, 比值植被指数; SARVI, 土壤大气阻抗植被指数; SAVI, 土壤调节植被指数; SR, 比值植被指数; TCARI, 转换型叶绿素吸收植被指数; TNDVI, 转化后的归一化植被指数; WDVI, 加权差分植被指数.公式中的R及右下角数字代表位于该波长处的反射值. ...
Relationships between leaf chlorophyll content and spectral reflectance and algorithms for non-destructive chlorophyll assessment in higher plant leaves
1
2003
... Formula of calculating vegetation index
Table 2 | 植被指数 Vegetation index | 计算公式 Calculate formula | 参考文献 Reference |
| TCARI | 3[(R699.19 - R668.98) - 0.2(R699.19 - R550.67)(R699.19/R668.98)] | Kim et al., 1994 |
| OSAVI | (1 + 0.16)(R750 - R705)/(R750 + R705 + 0.16) | Wu et al., 2008 |
| OSAVI2 | (1 + 0.16)(R800 - R670)/(R800 + R670 + 0.16) | Rondeaux et al., 1996 |
| DATT | (R850 - R710)/(R850 - R680) | Datt, 1999 |
| DATT2 | R850/R710 | Datt, 1999 |
| Gitelson | 1/R700 | Gitelson et al., 1999 |
| SR1 | R750/R700 | Gitelson & Merzlyak, 1997 |
| SR2 | R700/R670 | McMurtrey III et al., 1994 |
| SR3 | R730/R706 | Zarco-Tejada et al., 2003 |
| SR4 | R675/R700 | Gitelson et al., 2003 |
| MSI | R1600/R819 | Hunt & Rock, 1989 |
| NDII | (R819 - R1649)/(R819 + R1649) | Hardisky et al., 1983 |
| CRI1 | 1/R510 - 1/R550 | Gitelson et al., 2002 |
| CRI2 | 1/R510 - 1/R700 | Gitelson et al., 2002 |
| ARI | 1/R550 - 1/R700 | Sims & Gamon, 2002 |
| PSRI | (R680 - R500)/R750 | Merzlyak et al., 1999 |
| NDVI | (R750.66 - R704.6)/(R750.66 + R704.6) | Gitelson & Merzlyak, 1994 |
| GNDVI | (R783 - R560)/(R783 + R560) | Rozenstein et al., 2019 |
| TNDVI | ((R842 - R665)/(R842 + R665) + 0.5)^0.5 | Rozenstein et al., 2019 |
| WDVI | R842 - R665 × 0.5 | Rozenstein et al., 2019 |
| NDI45 | (R705 - R665)/(R705 + R665) | Delegido et al., 2011 |
| SAVI | (1 + L) × (R799.09 - R680.045)/(R799.09 + R680.045 + L) (L = 0.5) | Huete, 1988 |
| SAVI2 | R799.09/(R680.045+ b/a) (a = 0.969 1, b = 0.084 726) | Major et al., 1990 |
| ARVI | RB = R680.045 - r(R444.5 - R680.045) (r = 1)
ARVI = (R799.09 - RB)/(R799.09 + RB) | Kaufman & Tanre, 1992 |
| SARVI | RB = R680.045 - r(R444.5 - R680.045) (r = 1, L = 0.5)
SARVI = (1 + L)(R799.09 - RB)/(R799.09 + RB + L) | Kaufman & Tanre, 1992 |
| EVI | G(R799.09 - R680.045)/(R799.09 + C1R680.045 - C2R444.5 + L)
(G = 2.5, C1 = 6, C2 = 7.5, L = 1) | Huete et al., 1997 |
| IRECI | (R783 - R665)/(R705/R740) | Frampton et al., 2013 |
| IPVI | R842/(R842 + R665) | Rozenstein et al., 2019 |
| PSSRA | R783/R665 | Rozenstein et al., 2019 |
| RVI | R842/R665 | Rozenstein et al., 2019 |
ARI, 花青素反射指数; ARVI, 耐大气植被指数; CRI, 类胡萝卜素反射指数; DATT, DATT植被指数; EVI, 增强型植被指数; Gitelson, Gitelson植被指数; GNDVI,绿色归一化差异植被指数; IPVI, 红外植被百分比指数; IRECI, 倒红边叶绿素指数; MSI, 水分胁迫指数; NDI45, 归一化差异指数; NDII, 归一化红外指数; NDVI, 归一化植被指数; OSAVI, 优化型土壤调节植被指数; PSRI, 植物衰老反射指数; PSSRA, 特征色素简单比值指数; RVI, 比值植被指数; SARVI, 土壤大气阻抗植被指数; SAVI, 土壤调节植被指数; SR, 比值植被指数; TCARI, 转换型叶绿素吸收植被指数; TNDVI, 转化后的归一化植被指数; WDVI, 加权差分植被指数.公式中的R及右下角数字代表位于该波长处的反射值. ...
Remote estimation of chlorophyll content in higher plant leaves
1
1997
... Formula of calculating vegetation index
Table 2 | 植被指数 Vegetation index | 计算公式 Calculate formula | 参考文献 Reference |
| TCARI | 3[(R699.19 - R668.98) - 0.2(R699.19 - R550.67)(R699.19/R668.98)] | Kim et al., 1994 |
| OSAVI | (1 + 0.16)(R750 - R705)/(R750 + R705 + 0.16) | Wu et al., 2008 |
| OSAVI2 | (1 + 0.16)(R800 - R670)/(R800 + R670 + 0.16) | Rondeaux et al., 1996 |
| DATT | (R850 - R710)/(R850 - R680) | Datt, 1999 |
| DATT2 | R850/R710 | Datt, 1999 |
| Gitelson | 1/R700 | Gitelson et al., 1999 |
| SR1 | R750/R700 | Gitelson & Merzlyak, 1997 |
| SR2 | R700/R670 | McMurtrey III et al., 1994 |
| SR3 | R730/R706 | Zarco-Tejada et al., 2003 |
| SR4 | R675/R700 | Gitelson et al., 2003 |
| MSI | R1600/R819 | Hunt & Rock, 1989 |
| NDII | (R819 - R1649)/(R819 + R1649) | Hardisky et al., 1983 |
| CRI1 | 1/R510 - 1/R550 | Gitelson et al., 2002 |
| CRI2 | 1/R510 - 1/R700 | Gitelson et al., 2002 |
| ARI | 1/R550 - 1/R700 | Sims & Gamon, 2002 |
| PSRI | (R680 - R500)/R750 | Merzlyak et al., 1999 |
| NDVI | (R750.66 - R704.6)/(R750.66 + R704.6) | Gitelson & Merzlyak, 1994 |
| GNDVI | (R783 - R560)/(R783 + R560) | Rozenstein et al., 2019 |
| TNDVI | ((R842 - R665)/(R842 + R665) + 0.5)^0.5 | Rozenstein et al., 2019 |
| WDVI | R842 - R665 × 0.5 | Rozenstein et al., 2019 |
| NDI45 | (R705 - R665)/(R705 + R665) | Delegido et al., 2011 |
| SAVI | (1 + L) × (R799.09 - R680.045)/(R799.09 + R680.045 + L) (L = 0.5) | Huete, 1988 |
| SAVI2 | R799.09/(R680.045+ b/a) (a = 0.969 1, b = 0.084 726) | Major et al., 1990 |
| ARVI | RB = R680.045 - r(R444.5 - R680.045) (r = 1)
ARVI = (R799.09 - RB)/(R799.09 + RB) | Kaufman & Tanre, 1992 |
| SARVI | RB = R680.045 - r(R444.5 - R680.045) (r = 1, L = 0.5)
SARVI = (1 + L)(R799.09 - RB)/(R799.09 + RB + L) | Kaufman & Tanre, 1992 |
| EVI | G(R799.09 - R680.045)/(R799.09 + C1R680.045 - C2R444.5 + L)
(G = 2.5, C1 = 6, C2 = 7.5, L = 1) | Huete et al., 1997 |
| IRECI | (R783 - R665)/(R705/R740) | Frampton et al., 2013 |
| IPVI | R842/(R842 + R665) | Rozenstein et al., 2019 |
| PSSRA | R783/R665 | Rozenstein et al., 2019 |
| RVI | R842/R665 | Rozenstein et al., 2019 |
ARI, 花青素反射指数; ARVI, 耐大气植被指数; CRI, 类胡萝卜素反射指数; DATT, DATT植被指数; EVI, 增强型植被指数; Gitelson, Gitelson植被指数; GNDVI,绿色归一化差异植被指数; IPVI, 红外植被百分比指数; IRECI, 倒红边叶绿素指数; MSI, 水分胁迫指数; NDI45, 归一化差异指数; NDII, 归一化红外指数; NDVI, 归一化植被指数; OSAVI, 优化型土壤调节植被指数; PSRI, 植物衰老反射指数; PSSRA, 特征色素简单比值指数; RVI, 比值植被指数; SARVI, 土壤大气阻抗植被指数; SAVI, 土壤调节植被指数; SR, 比值植被指数; TCARI, 转换型叶绿素吸收植被指数; TNDVI, 转化后的归一化植被指数; WDVI, 加权差分植被指数.公式中的R及右下角数字代表位于该波长处的反射值. ...
Assessing carotenoid content in plant leaves with reflectance spectroscopy
2
2002
... Formula of calculating vegetation index
Table 2 | 植被指数 Vegetation index | 计算公式 Calculate formula | 参考文献 Reference |
| TCARI | 3[(R699.19 - R668.98) - 0.2(R699.19 - R550.67)(R699.19/R668.98)] | Kim et al., 1994 |
| OSAVI | (1 + 0.16)(R750 - R705)/(R750 + R705 + 0.16) | Wu et al., 2008 |
| OSAVI2 | (1 + 0.16)(R800 - R670)/(R800 + R670 + 0.16) | Rondeaux et al., 1996 |
| DATT | (R850 - R710)/(R850 - R680) | Datt, 1999 |
| DATT2 | R850/R710 | Datt, 1999 |
| Gitelson | 1/R700 | Gitelson et al., 1999 |
| SR1 | R750/R700 | Gitelson & Merzlyak, 1997 |
| SR2 | R700/R670 | McMurtrey III et al., 1994 |
| SR3 | R730/R706 | Zarco-Tejada et al., 2003 |
| SR4 | R675/R700 | Gitelson et al., 2003 |
| MSI | R1600/R819 | Hunt & Rock, 1989 |
| NDII | (R819 - R1649)/(R819 + R1649) | Hardisky et al., 1983 |
| CRI1 | 1/R510 - 1/R550 | Gitelson et al., 2002 |
| CRI2 | 1/R510 - 1/R700 | Gitelson et al., 2002 |
| ARI | 1/R550 - 1/R700 | Sims & Gamon, 2002 |
| PSRI | (R680 - R500)/R750 | Merzlyak et al., 1999 |
| NDVI | (R750.66 - R704.6)/(R750.66 + R704.6) | Gitelson & Merzlyak, 1994 |
| GNDVI | (R783 - R560)/(R783 + R560) | Rozenstein et al., 2019 |
| TNDVI | ((R842 - R665)/(R842 + R665) + 0.5)^0.5 | Rozenstein et al., 2019 |
| WDVI | R842 - R665 × 0.5 | Rozenstein et al., 2019 |
| NDI45 | (R705 - R665)/(R705 + R665) | Delegido et al., 2011 |
| SAVI | (1 + L) × (R799.09 - R680.045)/(R799.09 + R680.045 + L) (L = 0.5) | Huete, 1988 |
| SAVI2 | R799.09/(R680.045+ b/a) (a = 0.969 1, b = 0.084 726) | Major et al., 1990 |
| ARVI | RB = R680.045 - r(R444.5 - R680.045) (r = 1)
ARVI = (R799.09 - RB)/(R799.09 + RB) | Kaufman & Tanre, 1992 |
| SARVI | RB = R680.045 - r(R444.5 - R680.045) (r = 1, L = 0.5)
SARVI = (1 + L)(R799.09 - RB)/(R799.09 + RB + L) | Kaufman & Tanre, 1992 |
| EVI | G(R799.09 - R680.045)/(R799.09 + C1R680.045 - C2R444.5 + L)
(G = 2.5, C1 = 6, C2 = 7.5, L = 1) | Huete et al., 1997 |
| IRECI | (R783 - R665)/(R705/R740) | Frampton et al., 2013 |
| IPVI | R842/(R842 + R665) | Rozenstein et al., 2019 |
| PSSRA | R783/R665 | Rozenstein et al., 2019 |
| RVI | R842/R665 | Rozenstein et al., 2019 |
ARI, 花青素反射指数; ARVI, 耐大气植被指数; CRI, 类胡萝卜素反射指数; DATT, DATT植被指数; EVI, 增强型植被指数; Gitelson, Gitelson植被指数; GNDVI,绿色归一化差异植被指数; IPVI, 红外植被百分比指数; IRECI, 倒红边叶绿素指数; MSI, 水分胁迫指数; NDI45, 归一化差异指数; NDII, 归一化红外指数; NDVI, 归一化植被指数; OSAVI, 优化型土壤调节植被指数; PSRI, 植物衰老反射指数; PSSRA, 特征色素简单比值指数; RVI, 比值植被指数; SARVI, 土壤大气阻抗植被指数; SAVI, 土壤调节植被指数; SR, 比值植被指数; TCARI, 转换型叶绿素吸收植被指数; TNDVI, 转化后的归一化植被指数; WDVI, 加权差分植被指数.公式中的R及右下角数字代表位于该波长处的反射值. ...
... .,
2002 | ARI | 1/R550 - 1/R700 | Sims & Gamon, 2002 |
| PSRI | (R680 - R500)/R750 | Merzlyak et al., 1999 |
| NDVI | (R750.66 - R704.6)/(R750.66 + R704.6) | Gitelson & Merzlyak, 1994 |
| GNDVI | (R783 - R560)/(R783 + R560) | Rozenstein et al., 2019 |
| TNDVI | ((R842 - R665)/(R842 + R665) + 0.5)^0.5 | Rozenstein et al., 2019 |
| WDVI | R842 - R665 × 0.5 | Rozenstein et al., 2019 |
| NDI45 | (R705 - R665)/(R705 + R665) | Delegido et al., 2011 |
| SAVI | (1 + L) × (R799.09 - R680.045)/(R799.09 + R680.045 + L) (L = 0.5) | Huete, 1988 |
| SAVI2 | R799.09/(R680.045+ b/a) (a = 0.969 1, b = 0.084 726) | Major et al., 1990 |
| ARVI | RB = R680.045 - r(R444.5 - R680.045) (r = 1)
ARVI = (R799.09 - RB)/(R799.09 + RB) | Kaufman & Tanre, 1992 |
| SARVI | RB = R680.045 - r(R444.5 - R680.045) (r = 1, L = 0.5)
SARVI = (1 + L)(R799.09 - RB)/(R799.09 + RB + L) | Kaufman & Tanre, 1992 |
| EVI | G(R799.09 - R680.045)/(R799.09 + C1R680.045 - C2R444.5 + L)
(G = 2.5, C1 = 6, C2 = 7.5, L = 1) | Huete et al., 1997 |
| IRECI | (R783 - R665)/(R705/R740) | Frampton et al., 2013 |
| IPVI | R842/(R842 + R665) | Rozenstein et al., 2019 |
| PSSRA | R783/R665 | Rozenstein et al., 2019 |
| RVI | R842/R665 | Rozenstein et al., 2019 |
ARI, 花青素反射指数; ARVI, 耐大气植被指数; CRI, 类胡萝卜素反射指数; DATT, DATT植被指数; EVI, 增强型植被指数; Gitelson, Gitelson植被指数; GNDVI,绿色归一化差异植被指数; IPVI, 红外植被百分比指数; IRECI, 倒红边叶绿素指数; MSI, 水分胁迫指数; NDI45, 归一化差异指数; NDII, 归一化红外指数; NDVI, 归一化植被指数; OSAVI, 优化型土壤调节植被指数; PSRI, 植物衰老反射指数; PSSRA, 特征色素简单比值指数; RVI, 比值植被指数; SARVI, 土壤大气阻抗植被指数; SAVI, 土壤调节植被指数; SR, 比值植被指数; TCARI, 转换型叶绿素吸收植被指数; TNDVI, 转化后的归一化植被指数; WDVI, 加权差分植被指数.公式中的R及右下角数字代表位于该波长处的反射值. ...
Quantifying biodiversity: procedures and pitfalls in the measurement and comparison of species richness
1
2001
... 森林是陆地生态系统的重要组成部分, 占全球陆地面积的30%, 在维持生物多样性和生物圈功能方面发挥着重要作用(Pan et al., 2013; Harrison et al., 2014).然而, 由于人类活动和气候变化的影响, 生物多样性正在以一种前所未有的速度丧失(Ceballos et al., 2015).及时掌握森林生物多样性的现状、格局、变化趋势和受到的威胁, 是制定生物多样性保护政策和措施的前提.长久以来, 森林植物多样性监测依赖于大量的野外调查, 费时费力, 调查结果也受样地选择、调查方法、抽样调查的力度、参与调查人员的专业知识等诸多因素限制(Gotelli & Colwell, 2001; Graham & Hijmans, 2006).同时, 野外调查集中在物种和样地水平, 难以在景观、区域乃至全球尺度上实现对森林植物多样性在时空上的连续监测(Kerr & Ostrovsky, 2003; Nicholson et al., 2009; Levrel et al., 2010; Pereira et al., 2010). ...
A comparison of methods for mapping species ranges and species richness
1
2006
... 森林是陆地生态系统的重要组成部分, 占全球陆地面积的30%, 在维持生物多样性和生物圈功能方面发挥着重要作用(Pan et al., 2013; Harrison et al., 2014).然而, 由于人类活动和气候变化的影响, 生物多样性正在以一种前所未有的速度丧失(Ceballos et al., 2015).及时掌握森林生物多样性的现状、格局、变化趋势和受到的威胁, 是制定生物多样性保护政策和措施的前提.长久以来, 森林植物多样性监测依赖于大量的野外调查, 费时费力, 调查结果也受样地选择、调查方法、抽样调查的力度、参与调查人员的专业知识等诸多因素限制(Gotelli & Colwell, 2001; Graham & Hijmans, 2006).同时, 野外调查集中在物种和样地水平, 难以在景观、区域乃至全球尺度上实现对森林植物多样性在时空上的连续监测(Kerr & Ostrovsky, 2003; Nicholson et al., 2009; Levrel et al., 2010; Pereira et al., 2010). ...
Evaluating multi-sensors spectral and spatial resolutions for tree species diversity prediction
2
2021
... 除了基于光谱多样性的方法, 基于机器学习的方法在森林植被分类和植物多样性监测中也得到了广泛的关注.随机森林(Breiman, 2001)是一种广泛被用于预测的非参数的机器学习算法, 它不假设数据的正态分布, 具有对噪声不敏感、分类更快更稳定的特点(Clark & Roberts, 2012; Miao et al., 2012), 是用于森林多样性建模的最优方法之一(Mallinis et al., 2020; Gyamfi-Ampadu et al., 2021).随机森林里包括用于评估模型准确性的集成交叉验证, 能对重要变量进行排序, 并以非线性的方式处理交互数据.Erinjery等(2018)采用最大似然法和随机森林分类的方法, 基于Sentinel-2光谱波段及其衍生的NDVI和纹理、Sentinel-1 SAR波段及其纹理对高海拔热带雨林不同植被类型图进行了绘制, 分类精度可达75%以上.Mallinis等(2020)基于4种不同分辨率的卫星数据, 利用随机森林回归的方法对森林植物多样性进行了评估, 结果发现基于WorldView-2图像生成的模型精度最高, Shannon-Wiener多样性指数估算精度为0.44, Simpson多样性指数为0.37. ...
... 除了基于光谱多样性方法, 本研究也采用了机器学习的方法对森林植物多样性进行了估算, 结果发现基于所选特征指数的随机森林回归对Shannon- Wiener多样性指数有较好的反演结果(R2 = 0.79, p < 0.01), 而对其他多样性指数的估算效果较低.随机森林估算结果的准确性主要受两个方面因素的影响.一方面是受影像分辨率的影响, 影像分辨率不同对研究结果会产生一定影响.在草地生态系统中的大规模模拟研究表明, α多样性的估算精度随着空间分辨率的降低而下降, 最佳的估算精度是像元 大小与单个植株大小相接近时的精度(Wang et al., 2018).这是因为遥感反映的是面上的信息, 利用遥感数据计算的不是物种间的光谱变异, 而是用像元代表的群落间的光谱变异间接指示物种间的变异,其中存在一定的误差, 而将分辨率提升到单木尺度会提高估算精度.另一方面受输入特征变量的影响, 本研究在44个输入变量中通过十折交叉验证对变量进行了筛选, 最后挑选了使估算结果最好的6个特征变量, 去除了变量间共线性和冗余信息的干扰.在变量挑选时发现输入的两种光谱多样性指数的重要性排序明显高于其余的特征变量, 说明这两种指数可以作为随机森林估算植物多样性的重要指标, 间接证明了前面直接利用两种指标进行植物多样性估算的可行性和合理性.但是, 重要性排序中的CV的重要性程度略高于CHA, 这可能是因为CHA与其他植被指数间存在一定相关性, 会对重要性结果产生一定影响.此外, 在森林生态系统类型中, 森林的空间分布和结构参数也会影响估算结果(Marceau et al., 1994; Gholizadeh et al., 2019), 即使采用相同分辨率的影像, 在不同地区或不同森林类型中结果可能存在一定差异(Mallinis et al., 2020; Gyamfi-Ampadu et al., 2021). ...
The influence of soil-salinity, growth form, and leaf moisture on the spectral radiance of Spartina alterniflora canopies
1
1983
... Formula of calculating vegetation index
Table 2 | 植被指数 Vegetation index | 计算公式 Calculate formula | 参考文献 Reference |
| TCARI | 3[(R699.19 - R668.98) - 0.2(R699.19 - R550.67)(R699.19/R668.98)] | Kim et al., 1994 |
| OSAVI | (1 + 0.16)(R750 - R705)/(R750 + R705 + 0.16) | Wu et al., 2008 |
| OSAVI2 | (1 + 0.16)(R800 - R670)/(R800 + R670 + 0.16) | Rondeaux et al., 1996 |
| DATT | (R850 - R710)/(R850 - R680) | Datt, 1999 |
| DATT2 | R850/R710 | Datt, 1999 |
| Gitelson | 1/R700 | Gitelson et al., 1999 |
| SR1 | R750/R700 | Gitelson & Merzlyak, 1997 |
| SR2 | R700/R670 | McMurtrey III et al., 1994 |
| SR3 | R730/R706 | Zarco-Tejada et al., 2003 |
| SR4 | R675/R700 | Gitelson et al., 2003 |
| MSI | R1600/R819 | Hunt & Rock, 1989 |
| NDII | (R819 - R1649)/(R819 + R1649) | Hardisky et al., 1983 |
| CRI1 | 1/R510 - 1/R550 | Gitelson et al., 2002 |
| CRI2 | 1/R510 - 1/R700 | Gitelson et al., 2002 |
| ARI | 1/R550 - 1/R700 | Sims & Gamon, 2002 |
| PSRI | (R680 - R500)/R750 | Merzlyak et al., 1999 |
| NDVI | (R750.66 - R704.6)/(R750.66 + R704.6) | Gitelson & Merzlyak, 1994 |
| GNDVI | (R783 - R560)/(R783 + R560) | Rozenstein et al., 2019 |
| TNDVI | ((R842 - R665)/(R842 + R665) + 0.5)^0.5 | Rozenstein et al., 2019 |
| WDVI | R842 - R665 × 0.5 | Rozenstein et al., 2019 |
| NDI45 | (R705 - R665)/(R705 + R665) | Delegido et al., 2011 |
| SAVI | (1 + L) × (R799.09 - R680.045)/(R799.09 + R680.045 + L) (L = 0.5) | Huete, 1988 |
| SAVI2 | R799.09/(R680.045+ b/a) (a = 0.969 1, b = 0.084 726) | Major et al., 1990 |
| ARVI | RB = R680.045 - r(R444.5 - R680.045) (r = 1)
ARVI = (R799.09 - RB)/(R799.09 + RB) | Kaufman & Tanre, 1992 |
| SARVI | RB = R680.045 - r(R444.5 - R680.045) (r = 1, L = 0.5)
SARVI = (1 + L)(R799.09 - RB)/(R799.09 + RB + L) | Kaufman & Tanre, 1992 |
| EVI | G(R799.09 - R680.045)/(R799.09 + C1R680.045 - C2R444.5 + L)
(G = 2.5, C1 = 6, C2 = 7.5, L = 1) | Huete et al., 1997 |
| IRECI | (R783 - R665)/(R705/R740) | Frampton et al., 2013 |
| IPVI | R842/(R842 + R665) | Rozenstein et al., 2019 |
| PSSRA | R783/R665 | Rozenstein et al., 2019 |
| RVI | R842/R665 | Rozenstein et al., 2019 |
ARI, 花青素反射指数; ARVI, 耐大气植被指数; CRI, 类胡萝卜素反射指数; DATT, DATT植被指数; EVI, 增强型植被指数; Gitelson, Gitelson植被指数; GNDVI,绿色归一化差异植被指数; IPVI, 红外植被百分比指数; IRECI, 倒红边叶绿素指数; MSI, 水分胁迫指数; NDI45, 归一化差异指数; NDII, 归一化红外指数; NDVI, 归一化植被指数; OSAVI, 优化型土壤调节植被指数; PSRI, 植物衰老反射指数; PSSRA, 特征色素简单比值指数; RVI, 比值植被指数; SARVI, 土壤大气阻抗植被指数; SAVI, 土壤调节植被指数; SR, 比值植被指数; TCARI, 转换型叶绿素吸收植被指数; TNDVI, 转化后的归一化植被指数; WDVI, 加权差分植被指数.公式中的R及右下角数字代表位于该波长处的反射值. ...
Linkages between biodiversity attributes and ecosystem services: a systematic review
1
2014
... 森林是陆地生态系统的重要组成部分, 占全球陆地面积的30%, 在维持生物多样性和生物圈功能方面发挥着重要作用(Pan et al., 2013; Harrison et al., 2014).然而, 由于人类活动和气候变化的影响, 生物多样性正在以一种前所未有的速度丧失(Ceballos et al., 2015).及时掌握森林生物多样性的现状、格局、变化趋势和受到的威胁, 是制定生物多样性保护政策和措施的前提.长久以来, 森林植物多样性监测依赖于大量的野外调查, 费时费力, 调查结果也受样地选择、调查方法、抽样调查的力度、参与调查人员的专业知识等诸多因素限制(Gotelli & Colwell, 2001; Graham & Hijmans, 2006).同时, 野外调查集中在物种和样地水平, 难以在景观、区域乃至全球尺度上实现对森林植物多样性在时空上的连续监测(Kerr & Ostrovsky, 2003; Nicholson et al., 2009; Levrel et al., 2010; Pereira et al., 2010). ...
Towards scalable estimation of plant functional diversity from Sentinel-2: in-situ validation in a heterogeneous (semi-)natural landscape
1
2021
... 除了考虑与植物多样性的关系, 植物功能多样性也是生物多样性的重要组成部分, 它包括植物的化学、生理和形态结构的多样性, 反映了群落、景观、甚至大空间尺度内功能性状的变异性, 决定了生态系统的功能和稳定性(Tilman et al., 1997; Ruiz-Benito et al., 2014).利用卫星遥感影像和野外实测功能性状的关系建模, 反演植物功能多样性对实现全球生物多样性快速监测具有重要意义(Jetz et al., 2016).但由于计算植物功能多样性的可用区域很少且不可重复测量, 传统的计算植物功能多样性的方法不适合用于长期和大规模的监测.遥感反演功能多样性的原理是基于系统发育差异和资源限制导致的植物性状不同(Schweiger et al., 2018), 这些性状主要包括叶片氮浓度、叶片碳浓度、比叶面积、叶片干物质含量和叶面积等叶片性状, 以及株高、树冠横截面积和胸径等全株性状(Ma et al., 2019), 性状上的差异进而影响光谱反射率(Wang et al., 2018).已经有很多研究基于机载高光谱数据绘制高空间分辨率的植物功能多样性空间分布图(Asner et al., 2017; Schneider et al., 2017; Zheng et al., 2021), 但在更大的区域范围内由于获取数据难以实现且成本昂贵, 研究还较少.Sentinel-2号卫星等多光谱空间遥感的发展有利于克服高空间分辨率和监测范围的问题(Rossi et al., 2020; Hauser et al., 2021).目前相关的研究还较少且受很多因素影响, 比如野外数据和卫星影响时间不匹配, 物种的区域差异与方法的适用性等等, 这都有待进一步补充和验证, 可以考虑作为接下来的研究方向. ...
A soil-adjusted vegetation index (SAVI)
1
1988
... Formula of calculating vegetation index
Table 2 | 植被指数 Vegetation index | 计算公式 Calculate formula | 参考文献 Reference |
| TCARI | 3[(R699.19 - R668.98) - 0.2(R699.19 - R550.67)(R699.19/R668.98)] | Kim et al., 1994 |
| OSAVI | (1 + 0.16)(R750 - R705)/(R750 + R705 + 0.16) | Wu et al., 2008 |
| OSAVI2 | (1 + 0.16)(R800 - R670)/(R800 + R670 + 0.16) | Rondeaux et al., 1996 |
| DATT | (R850 - R710)/(R850 - R680) | Datt, 1999 |
| DATT2 | R850/R710 | Datt, 1999 |
| Gitelson | 1/R700 | Gitelson et al., 1999 |
| SR1 | R750/R700 | Gitelson & Merzlyak, 1997 |
| SR2 | R700/R670 | McMurtrey III et al., 1994 |
| SR3 | R730/R706 | Zarco-Tejada et al., 2003 |
| SR4 | R675/R700 | Gitelson et al., 2003 |
| MSI | R1600/R819 | Hunt & Rock, 1989 |
| NDII | (R819 - R1649)/(R819 + R1649) | Hardisky et al., 1983 |
| CRI1 | 1/R510 - 1/R550 | Gitelson et al., 2002 |
| CRI2 | 1/R510 - 1/R700 | Gitelson et al., 2002 |
| ARI | 1/R550 - 1/R700 | Sims & Gamon, 2002 |
| PSRI | (R680 - R500)/R750 | Merzlyak et al., 1999 |
| NDVI | (R750.66 - R704.6)/(R750.66 + R704.6) | Gitelson & Merzlyak, 1994 |
| GNDVI | (R783 - R560)/(R783 + R560) | Rozenstein et al., 2019 |
| TNDVI | ((R842 - R665)/(R842 + R665) + 0.5)^0.5 | Rozenstein et al., 2019 |
| WDVI | R842 - R665 × 0.5 | Rozenstein et al., 2019 |
| NDI45 | (R705 - R665)/(R705 + R665) | Delegido et al., 2011 |
| SAVI | (1 + L) × (R799.09 - R680.045)/(R799.09 + R680.045 + L) (L = 0.5) | Huete, 1988 |
| SAVI2 | R799.09/(R680.045+ b/a) (a = 0.969 1, b = 0.084 726) | Major et al., 1990 |
| ARVI | RB = R680.045 - r(R444.5 - R680.045) (r = 1)
ARVI = (R799.09 - RB)/(R799.09 + RB) | Kaufman & Tanre, 1992 |
| SARVI | RB = R680.045 - r(R444.5 - R680.045) (r = 1, L = 0.5)
SARVI = (1 + L)(R799.09 - RB)/(R799.09 + RB + L) | Kaufman & Tanre, 1992 |
| EVI | G(R799.09 - R680.045)/(R799.09 + C1R680.045 - C2R444.5 + L)
(G = 2.5, C1 = 6, C2 = 7.5, L = 1) | Huete et al., 1997 |
| IRECI | (R783 - R665)/(R705/R740) | Frampton et al., 2013 |
| IPVI | R842/(R842 + R665) | Rozenstein et al., 2019 |
| PSSRA | R783/R665 | Rozenstein et al., 2019 |
| RVI | R842/R665 | Rozenstein et al., 2019 |
ARI, 花青素反射指数; ARVI, 耐大气植被指数; CRI, 类胡萝卜素反射指数; DATT, DATT植被指数; EVI, 增强型植被指数; Gitelson, Gitelson植被指数; GNDVI,绿色归一化差异植被指数; IPVI, 红外植被百分比指数; IRECI, 倒红边叶绿素指数; MSI, 水分胁迫指数; NDI45, 归一化差异指数; NDII, 归一化红外指数; NDVI, 归一化植被指数; OSAVI, 优化型土壤调节植被指数; PSRI, 植物衰老反射指数; PSSRA, 特征色素简单比值指数; RVI, 比值植被指数; SARVI, 土壤大气阻抗植被指数; SAVI, 土壤调节植被指数; SR, 比值植被指数; TCARI, 转换型叶绿素吸收植被指数; TNDVI, 转化后的归一化植被指数; WDVI, 加权差分植被指数.公式中的R及右下角数字代表位于该波长处的反射值. ...
A comparison of vegetation indices over a global set of TM images for EOS-MODIS
1
1997
... Formula of calculating vegetation index
Table 2 | 植被指数 Vegetation index | 计算公式 Calculate formula | 参考文献 Reference |
| TCARI | 3[(R699.19 - R668.98) - 0.2(R699.19 - R550.67)(R699.19/R668.98)] | Kim et al., 1994 |
| OSAVI | (1 + 0.16)(R750 - R705)/(R750 + R705 + 0.16) | Wu et al., 2008 |
| OSAVI2 | (1 + 0.16)(R800 - R670)/(R800 + R670 + 0.16) | Rondeaux et al., 1996 |
| DATT | (R850 - R710)/(R850 - R680) | Datt, 1999 |
| DATT2 | R850/R710 | Datt, 1999 |
| Gitelson | 1/R700 | Gitelson et al., 1999 |
| SR1 | R750/R700 | Gitelson & Merzlyak, 1997 |
| SR2 | R700/R670 | McMurtrey III et al., 1994 |
| SR3 | R730/R706 | Zarco-Tejada et al., 2003 |
| SR4 | R675/R700 | Gitelson et al., 2003 |
| MSI | R1600/R819 | Hunt & Rock, 1989 |
| NDII | (R819 - R1649)/(R819 + R1649) | Hardisky et al., 1983 |
| CRI1 | 1/R510 - 1/R550 | Gitelson et al., 2002 |
| CRI2 | 1/R510 - 1/R700 | Gitelson et al., 2002 |
| ARI | 1/R550 - 1/R700 | Sims & Gamon, 2002 |
| PSRI | (R680 - R500)/R750 | Merzlyak et al., 1999 |
| NDVI | (R750.66 - R704.6)/(R750.66 + R704.6) | Gitelson & Merzlyak, 1994 |
| GNDVI | (R783 - R560)/(R783 + R560) | Rozenstein et al., 2019 |
| TNDVI | ((R842 - R665)/(R842 + R665) + 0.5)^0.5 | Rozenstein et al., 2019 |
| WDVI | R842 - R665 × 0.5 | Rozenstein et al., 2019 |
| NDI45 | (R705 - R665)/(R705 + R665) | Delegido et al., 2011 |
| SAVI | (1 + L) × (R799.09 - R680.045)/(R799.09 + R680.045 + L) (L = 0.5) | Huete, 1988 |
| SAVI2 | R799.09/(R680.045+ b/a) (a = 0.969 1, b = 0.084 726) | Major et al., 1990 |
| ARVI | RB = R680.045 - r(R444.5 - R680.045) (r = 1)
ARVI = (R799.09 - RB)/(R799.09 + RB) | Kaufman & Tanre, 1992 |
| SARVI | RB = R680.045 - r(R444.5 - R680.045) (r = 1, L = 0.5)
SARVI = (1 + L)(R799.09 - RB)/(R799.09 + RB + L) | Kaufman & Tanre, 1992 |
| EVI | G(R799.09 - R680.045)/(R799.09 + C1R680.045 - C2R444.5 + L)
(G = 2.5, C1 = 6, C2 = 7.5, L = 1) | Huete et al., 1997 |
| IRECI | (R783 - R665)/(R705/R740) | Frampton et al., 2013 |
| IPVI | R842/(R842 + R665) | Rozenstein et al., 2019 |
| PSSRA | R783/R665 | Rozenstein et al., 2019 |
| RVI | R842/R665 | Rozenstein et al., 2019 |
ARI, 花青素反射指数; ARVI, 耐大气植被指数; CRI, 类胡萝卜素反射指数; DATT, DATT植被指数; EVI, 增强型植被指数; Gitelson, Gitelson植被指数; GNDVI,绿色归一化差异植被指数; IPVI, 红外植被百分比指数; IRECI, 倒红边叶绿素指数; MSI, 水分胁迫指数; NDI45, 归一化差异指数; NDII, 归一化红外指数; NDVI, 归一化植被指数; OSAVI, 优化型土壤调节植被指数; PSRI, 植物衰老反射指数; PSSRA, 特征色素简单比值指数; RVI, 比值植被指数; SARVI, 土壤大气阻抗植被指数; SAVI, 土壤调节植被指数; SR, 比值植被指数; TCARI, 转换型叶绿素吸收植被指数; TNDVI, 转化后的归一化植被指数; WDVI, 加权差分植被指数.公式中的R及右下角数字代表位于该波长处的反射值. ...
Detection of changes in leaf water content using Near- and Middle-Infrared reflectances
1
1989
... Formula of calculating vegetation index
Table 2 | 植被指数 Vegetation index | 计算公式 Calculate formula | 参考文献 Reference |
| TCARI | 3[(R699.19 - R668.98) - 0.2(R699.19 - R550.67)(R699.19/R668.98)] | Kim et al., 1994 |
| OSAVI | (1 + 0.16)(R750 - R705)/(R750 + R705 + 0.16) | Wu et al., 2008 |
| OSAVI2 | (1 + 0.16)(R800 - R670)/(R800 + R670 + 0.16) | Rondeaux et al., 1996 |
| DATT | (R850 - R710)/(R850 - R680) | Datt, 1999 |
| DATT2 | R850/R710 | Datt, 1999 |
| Gitelson | 1/R700 | Gitelson et al., 1999 |
| SR1 | R750/R700 | Gitelson & Merzlyak, 1997 |
| SR2 | R700/R670 | McMurtrey III et al., 1994 |
| SR3 | R730/R706 | Zarco-Tejada et al., 2003 |
| SR4 | R675/R700 | Gitelson et al., 2003 |
| MSI | R1600/R819 | Hunt & Rock, 1989 |
| NDII | (R819 - R1649)/(R819 + R1649) | Hardisky et al., 1983 |
| CRI1 | 1/R510 - 1/R550 | Gitelson et al., 2002 |
| CRI2 | 1/R510 - 1/R700 | Gitelson et al., 2002 |
| ARI | 1/R550 - 1/R700 | Sims & Gamon, 2002 |
| PSRI | (R680 - R500)/R750 | Merzlyak et al., 1999 |
| NDVI | (R750.66 - R704.6)/(R750.66 + R704.6) | Gitelson & Merzlyak, 1994 |
| GNDVI | (R783 - R560)/(R783 + R560) | Rozenstein et al., 2019 |
| TNDVI | ((R842 - R665)/(R842 + R665) + 0.5)^0.5 | Rozenstein et al., 2019 |
| WDVI | R842 - R665 × 0.5 | Rozenstein et al., 2019 |
| NDI45 | (R705 - R665)/(R705 + R665) | Delegido et al., 2011 |
| SAVI | (1 + L) × (R799.09 - R680.045)/(R799.09 + R680.045 + L) (L = 0.5) | Huete, 1988 |
| SAVI2 | R799.09/(R680.045+ b/a) (a = 0.969 1, b = 0.084 726) | Major et al., 1990 |
| ARVI | RB = R680.045 - r(R444.5 - R680.045) (r = 1)
ARVI = (R799.09 - RB)/(R799.09 + RB) | Kaufman & Tanre, 1992 |
| SARVI | RB = R680.045 - r(R444.5 - R680.045) (r = 1, L = 0.5)
SARVI = (1 + L)(R799.09 - RB)/(R799.09 + RB + L) | Kaufman & Tanre, 1992 |
| EVI | G(R799.09 - R680.045)/(R799.09 + C1R680.045 - C2R444.5 + L)
(G = 2.5, C1 = 6, C2 = 7.5, L = 1) | Huete et al., 1997 |
| IRECI | (R783 - R665)/(R705/R740) | Frampton et al., 2013 |
| IPVI | R842/(R842 + R665) | Rozenstein et al., 2019 |
| PSSRA | R783/R665 | Rozenstein et al., 2019 |
| RVI | R842/R665 | Rozenstein et al., 2019 |
ARI, 花青素反射指数; ARVI, 耐大气植被指数; CRI, 类胡萝卜素反射指数; DATT, DATT植被指数; EVI, 增强型植被指数; Gitelson, Gitelson植被指数; GNDVI,绿色归一化差异植被指数; IPVI, 红外植被百分比指数; IRECI, 倒红边叶绿素指数; MSI, 水分胁迫指数; NDI45, 归一化差异指数; NDII, 归一化红外指数; NDVI, 归一化植被指数; OSAVI, 优化型土壤调节植被指数; PSRI, 植物衰老反射指数; PSSRA, 特征色素简单比值指数; RVI, 比值植被指数; SARVI, 土壤大气阻抗植被指数; SAVI, 土壤调节植被指数; SR, 比值植被指数; TCARI, 转换型叶绿素吸收植被指数; TNDVI, 转化后的归一化植被指数; WDVI, 加权差分植被指数.公式中的R及右下角数字代表位于该波长处的反射值. ...
Monitoring plant functional diversity from space
1
2016
... 除了考虑与植物多样性的关系, 植物功能多样性也是生物多样性的重要组成部分, 它包括植物的化学、生理和形态结构的多样性, 反映了群落、景观、甚至大空间尺度内功能性状的变异性, 决定了生态系统的功能和稳定性(Tilman et al., 1997; Ruiz-Benito et al., 2014).利用卫星遥感影像和野外实测功能性状的关系建模, 反演植物功能多样性对实现全球生物多样性快速监测具有重要意义(Jetz et al., 2016).但由于计算植物功能多样性的可用区域很少且不可重复测量, 传统的计算植物功能多样性的方法不适合用于长期和大规模的监测.遥感反演功能多样性的原理是基于系统发育差异和资源限制导致的植物性状不同(Schweiger et al., 2018), 这些性状主要包括叶片氮浓度、叶片碳浓度、比叶面积、叶片干物质含量和叶面积等叶片性状, 以及株高、树冠横截面积和胸径等全株性状(Ma et al., 2019), 性状上的差异进而影响光谱反射率(Wang et al., 2018).已经有很多研究基于机载高光谱数据绘制高空间分辨率的植物功能多样性空间分布图(Asner et al., 2017; Schneider et al., 2017; Zheng et al., 2021), 但在更大的区域范围内由于获取数据难以实现且成本昂贵, 研究还较少.Sentinel-2号卫星等多光谱空间遥感的发展有利于克服高空间分辨率和监测范围的问题(Rossi et al., 2020; Hauser et al., 2021).目前相关的研究还较少且受很多因素影响, 比如野外数据和卫星影响时间不匹配, 物种的区域差异与方法的适用性等等, 这都有待进一步补充和验证, 可以考虑作为接下来的研究方向. ...
Ecological fingerprinting of ecosystem succession: estimating secondary tropical dry forest structure and diversity using imaging spectroscopy
1
2007
... 光谱变异假说是生物多样性直接遥感监测的主要理论基础, 即遥感图像光谱多样性与物种多样性有关.光谱多样性, 有时也被称为光学多样性(Palmer et al., 2002; Ustin & Gamon, 2010)、光谱异质性或光谱变异性(Rocchini et al., 2010), 表征光谱反射率的空间变化, 这种变化与植物多样性相关的植物光学性状的差异有关, 可以用来反映物种多样性(Gillespie et al., 2008; Nagendra & Rocchini, 2008).基于光谱变异假说的光谱多样性与物种多样性的研究已经有很多, 在温带森林(Laliberté et al., 2020), 亚热带森林(Kalacska et al., 2007), 热带森林(Asner & Martin, 2009; Féret & Asner, 2014; Schäfer et al., 2016), 草原(Oldeland et al., 2010; Wang et al., 2016, 2018; Gholizadeh et al., 2020)均有报道.常用光谱多样性指数包括变异系数(CV)(Somers et al., 2015; Wang et al., 2016), 凸包体积(CHV)(Dahlin, 2016; Gholizadeh et al., 2018), 凸包面积(CHA)(Gholizadeh et al., 2018), 光谱角度制图(SAM)(Zhang et al., 2006; Gholizadeh et al., 2018), 光谱信息散度(SID)(Chang, 2000)等. ...
Atmospherically resistant vegetation index (ARVI) for EOS-MODIS
2
1992
... Formula of calculating vegetation index
Table 2 | 植被指数 Vegetation index | 计算公式 Calculate formula | 参考文献 Reference |
| TCARI | 3[(R699.19 - R668.98) - 0.2(R699.19 - R550.67)(R699.19/R668.98)] | Kim et al., 1994 |
| OSAVI | (1 + 0.16)(R750 - R705)/(R750 + R705 + 0.16) | Wu et al., 2008 |
| OSAVI2 | (1 + 0.16)(R800 - R670)/(R800 + R670 + 0.16) | Rondeaux et al., 1996 |
| DATT | (R850 - R710)/(R850 - R680) | Datt, 1999 |
| DATT2 | R850/R710 | Datt, 1999 |
| Gitelson | 1/R700 | Gitelson et al., 1999 |
| SR1 | R750/R700 | Gitelson & Merzlyak, 1997 |
| SR2 | R700/R670 | McMurtrey III et al., 1994 |
| SR3 | R730/R706 | Zarco-Tejada et al., 2003 |
| SR4 | R675/R700 | Gitelson et al., 2003 |
| MSI | R1600/R819 | Hunt & Rock, 1989 |
| NDII | (R819 - R1649)/(R819 + R1649) | Hardisky et al., 1983 |
| CRI1 | 1/R510 - 1/R550 | Gitelson et al., 2002 |
| CRI2 | 1/R510 - 1/R700 | Gitelson et al., 2002 |
| ARI | 1/R550 - 1/R700 | Sims & Gamon, 2002 |
| PSRI | (R680 - R500)/R750 | Merzlyak et al., 1999 |
| NDVI | (R750.66 - R704.6)/(R750.66 + R704.6) | Gitelson & Merzlyak, 1994 |
| GNDVI | (R783 - R560)/(R783 + R560) | Rozenstein et al., 2019 |
| TNDVI | ((R842 - R665)/(R842 + R665) + 0.5)^0.5 | Rozenstein et al., 2019 |
| WDVI | R842 - R665 × 0.5 | Rozenstein et al., 2019 |
| NDI45 | (R705 - R665)/(R705 + R665) | Delegido et al., 2011 |
| SAVI | (1 + L) × (R799.09 - R680.045)/(R799.09 + R680.045 + L) (L = 0.5) | Huete, 1988 |
| SAVI2 | R799.09/(R680.045+ b/a) (a = 0.969 1, b = 0.084 726) | Major et al., 1990 |
| ARVI | RB = R680.045 - r(R444.5 - R680.045) (r = 1)
ARVI = (R799.09 - RB)/(R799.09 + RB) | Kaufman & Tanre, 1992 |
| SARVI | RB = R680.045 - r(R444.5 - R680.045) (r = 1, L = 0.5)
SARVI = (1 + L)(R799.09 - RB)/(R799.09 + RB + L) | Kaufman & Tanre, 1992 |
| EVI | G(R799.09 - R680.045)/(R799.09 + C1R680.045 - C2R444.5 + L)
(G = 2.5, C1 = 6, C2 = 7.5, L = 1) | Huete et al., 1997 |
| IRECI | (R783 - R665)/(R705/R740) | Frampton et al., 2013 |
| IPVI | R842/(R842 + R665) | Rozenstein et al., 2019 |
| PSSRA | R783/R665 | Rozenstein et al., 2019 |
| RVI | R842/R665 | Rozenstein et al., 2019 |
ARI, 花青素反射指数; ARVI, 耐大气植被指数; CRI, 类胡萝卜素反射指数; DATT, DATT植被指数; EVI, 增强型植被指数; Gitelson, Gitelson植被指数; GNDVI,绿色归一化差异植被指数; IPVI, 红外植被百分比指数; IRECI, 倒红边叶绿素指数; MSI, 水分胁迫指数; NDI45, 归一化差异指数; NDII, 归一化红外指数; NDVI, 归一化植被指数; OSAVI, 优化型土壤调节植被指数; PSRI, 植物衰老反射指数; PSSRA, 特征色素简单比值指数; RVI, 比值植被指数; SARVI, 土壤大气阻抗植被指数; SAVI, 土壤调节植被指数; SR, 比值植被指数; TCARI, 转换型叶绿素吸收植被指数; TNDVI, 转化后的归一化植被指数; WDVI, 加权差分植被指数.公式中的R及右下角数字代表位于该波长处的反射值. ...
... Kaufman & Tanre,
1992 | EVI | G(R799.09 - R680.045)/(R799.09 + C1R680.045 - C2R444.5 + L)
(G = 2.5, C1 = 6, C2 = 7.5, L = 1) | Huete et al., 1997 |
| IRECI | (R783 - R665)/(R705/R740) | Frampton et al., 2013 |
| IPVI | R842/(R842 + R665) | Rozenstein et al., 2019 |
| PSSRA | R783/R665 | Rozenstein et al., 2019 |
| RVI | R842/R665 | Rozenstein et al., 2019 |
ARI, 花青素反射指数; ARVI, 耐大气植被指数; CRI, 类胡萝卜素反射指数; DATT, DATT植被指数; EVI, 增强型植被指数; Gitelson, Gitelson植被指数; GNDVI,绿色归一化差异植被指数; IPVI, 红外植被百分比指数; IRECI, 倒红边叶绿素指数; MSI, 水分胁迫指数; NDI45, 归一化差异指数; NDII, 归一化红外指数; NDVI, 归一化植被指数; OSAVI, 优化型土壤调节植被指数; PSRI, 植物衰老反射指数; PSSRA, 特征色素简单比值指数; RVI, 比值植被指数; SARVI, 土壤大气阻抗植被指数; SAVI, 土壤调节植被指数; SR, 比值植被指数; TCARI, 转换型叶绿素吸收植被指数; TNDVI, 转化后的归一化植被指数; WDVI, 加权差分植被指数.公式中的R及右下角数字代表位于该波长处的反射值. ...
Synergistic use of QuickBird multispectral imagery and LIDAR data for object-based forest species classification
1
2010
... 近年来, 随着遥感技术的迅速发展, 使得在大尺度、多时空上评估生物多样性成为可能.遥感数据具有覆盖范围广、可持续性强以及可重复的特点(Nagendra, 2001; Duro et al., 2007), 有助于迅速地揭示大面积生物多样性丢失状况, 对大尺度、长时间序列的生物多样性评估至关重要(Turner, 2014).生物多样性遥感监测方法可总结为直接法和间接法两种(Turner et al., 2003).直接法是利用高空间分辨率和高光谱分辨率的卫星传感器直接识别物种、种群或群落.Ke等(2010)利用QuickBird高分辨率多光谱数据和激光雷达数据, 通过图像分割和基于目标的分类方法对森林物种进行识别, 发现两种数据均有较好的结果, 但是结合两种数据源能获取更高的精度, Kappa系数最高可达91.6%.Cross等(2019)利用WorldView-3卫星影像对热带森林里的6个森林物种进行了分类, 分类准确率高达85.37%.间接法是通过遥感数据反演与生物多样性密切相关的指标或参数, 再与野外实测数据构建统计模型以反演生物多样性.植被指数、植物生化组分和植被结构等都可以作为植物多样性研究的相关指标.归一化植被指数(NDVI)经常被用来指示区域的物种多样性(Fairbanks & Mcgwire, 2004; Feeley et al., 2005), 而增强型植被指数(EVI)则可以更好地在植被茂密的地区代替NDVI (Waring et al., 2006).此外, 与光谱变异相关的叶片叶绿素、氮含量、色素、水分等生化组分的变化也可以用来估算森林物种多样性(Carlson et al., 2007). ...
From space to species: ecological applications for remote sensing
1
2003
... 森林是陆地生态系统的重要组成部分, 占全球陆地面积的30%, 在维持生物多样性和生物圈功能方面发挥着重要作用(Pan et al., 2013; Harrison et al., 2014).然而, 由于人类活动和气候变化的影响, 生物多样性正在以一种前所未有的速度丧失(Ceballos et al., 2015).及时掌握森林生物多样性的现状、格局、变化趋势和受到的威胁, 是制定生物多样性保护政策和措施的前提.长久以来, 森林植物多样性监测依赖于大量的野外调查, 费时费力, 调查结果也受样地选择、调查方法、抽样调查的力度、参与调查人员的专业知识等诸多因素限制(Gotelli & Colwell, 2001; Graham & Hijmans, 2006).同时, 野外调查集中在物种和样地水平, 难以在景观、区域乃至全球尺度上实现对森林植物多样性在时空上的连续监测(Kerr & Ostrovsky, 2003; Nicholson et al., 2009; Levrel et al., 2010; Pereira et al., 2010). ...
The use of high spectral resolution bands for estimating absorbed photosynthetically active radiation (a Par)
1
1994
... Formula of calculating vegetation index
Table 2 | 植被指数 Vegetation index | 计算公式 Calculate formula | 参考文献 Reference |
| TCARI | 3[(R699.19 - R668.98) - 0.2(R699.19 - R550.67)(R699.19/R668.98)] | Kim et al., 1994 |
| OSAVI | (1 + 0.16)(R750 - R705)/(R750 + R705 + 0.16) | Wu et al., 2008 |
| OSAVI2 | (1 + 0.16)(R800 - R670)/(R800 + R670 + 0.16) | Rondeaux et al., 1996 |
| DATT | (R850 - R710)/(R850 - R680) | Datt, 1999 |
| DATT2 | R850/R710 | Datt, 1999 |
| Gitelson | 1/R700 | Gitelson et al., 1999 |
| SR1 | R750/R700 | Gitelson & Merzlyak, 1997 |
| SR2 | R700/R670 | McMurtrey III et al., 1994 |
| SR3 | R730/R706 | Zarco-Tejada et al., 2003 |
| SR4 | R675/R700 | Gitelson et al., 2003 |
| MSI | R1600/R819 | Hunt & Rock, 1989 |
| NDII | (R819 - R1649)/(R819 + R1649) | Hardisky et al., 1983 |
| CRI1 | 1/R510 - 1/R550 | Gitelson et al., 2002 |
| CRI2 | 1/R510 - 1/R700 | Gitelson et al., 2002 |
| ARI | 1/R550 - 1/R700 | Sims & Gamon, 2002 |
| PSRI | (R680 - R500)/R750 | Merzlyak et al., 1999 |
| NDVI | (R750.66 - R704.6)/(R750.66 + R704.6) | Gitelson & Merzlyak, 1994 |
| GNDVI | (R783 - R560)/(R783 + R560) | Rozenstein et al., 2019 |
| TNDVI | ((R842 - R665)/(R842 + R665) + 0.5)^0.5 | Rozenstein et al., 2019 |
| WDVI | R842 - R665 × 0.5 | Rozenstein et al., 2019 |
| NDI45 | (R705 - R665)/(R705 + R665) | Delegido et al., 2011 |
| SAVI | (1 + L) × (R799.09 - R680.045)/(R799.09 + R680.045 + L) (L = 0.5) | Huete, 1988 |
| SAVI2 | R799.09/(R680.045+ b/a) (a = 0.969 1, b = 0.084 726) | Major et al., 1990 |
| ARVI | RB = R680.045 - r(R444.5 - R680.045) (r = 1)
ARVI = (R799.09 - RB)/(R799.09 + RB) | Kaufman & Tanre, 1992 |
| SARVI | RB = R680.045 - r(R444.5 - R680.045) (r = 1, L = 0.5)
SARVI = (1 + L)(R799.09 - RB)/(R799.09 + RB + L) | Kaufman & Tanre, 1992 |
| EVI | G(R799.09 - R680.045)/(R799.09 + C1R680.045 - C2R444.5 + L)
(G = 2.5, C1 = 6, C2 = 7.5, L = 1) | Huete et al., 1997 |
| IRECI | (R783 - R665)/(R705/R740) | Frampton et al., 2013 |
| IPVI | R842/(R842 + R665) | Rozenstein et al., 2019 |
| PSSRA | R783/R665 | Rozenstein et al., 2019 |
| RVI | R842/R665 | Rozenstein et al., 2019 |
ARI, 花青素反射指数; ARVI, 耐大气植被指数; CRI, 类胡萝卜素反射指数; DATT, DATT植被指数; EVI, 增强型植被指数; Gitelson, Gitelson植被指数; GNDVI,绿色归一化差异植被指数; IPVI, 红外植被百分比指数; IRECI, 倒红边叶绿素指数; MSI, 水分胁迫指数; NDI45, 归一化差异指数; NDII, 归一化红外指数; NDVI, 归一化植被指数; OSAVI, 优化型土壤调节植被指数; PSRI, 植物衰老反射指数; PSSRA, 特征色素简单比值指数; RVI, 比值植被指数; SARVI, 土壤大气阻抗植被指数; SAVI, 土壤调节植被指数; SR, 比值植被指数; TCARI, 转换型叶绿素吸收植被指数; TNDVI, 转化后的归一化植被指数; WDVI, 加权差分植被指数.公式中的R及右下角数字代表位于该波长处的反射值. ...
Partitioning plant spectral diversity into alpha and beta components
1
2020
... 光谱变异假说是生物多样性直接遥感监测的主要理论基础, 即遥感图像光谱多样性与物种多样性有关.光谱多样性, 有时也被称为光学多样性(Palmer et al., 2002; Ustin & Gamon, 2010)、光谱异质性或光谱变异性(Rocchini et al., 2010), 表征光谱反射率的空间变化, 这种变化与植物多样性相关的植物光学性状的差异有关, 可以用来反映物种多样性(Gillespie et al., 2008; Nagendra & Rocchini, 2008).基于光谱变异假说的光谱多样性与物种多样性的研究已经有很多, 在温带森林(Laliberté et al., 2020), 亚热带森林(Kalacska et al., 2007), 热带森林(Asner & Martin, 2009; Féret & Asner, 2014; Schäfer et al., 2016), 草原(Oldeland et al., 2010; Wang et al., 2016, 2018; Gholizadeh et al., 2020)均有报道.常用光谱多样性指数包括变异系数(CV)(Somers et al., 2015; Wang et al., 2016), 凸包体积(CHV)(Dahlin, 2016; Gholizadeh et al., 2018), 凸包面积(CHA)(Gholizadeh et al., 2018), 光谱角度制图(SAM)(Zhang et al., 2006; Gholizadeh et al., 2018), 光谱信息散度(SID)(Chang, 2000)等. ...
Balancing state and volunteer investment in biodiversity monitoring for the implementation of CBD indicators: a French example
1
2010
... 森林是陆地生态系统的重要组成部分, 占全球陆地面积的30%, 在维持生物多样性和生物圈功能方面发挥着重要作用(Pan et al., 2013; Harrison et al., 2014).然而, 由于人类活动和气候变化的影响, 生物多样性正在以一种前所未有的速度丧失(Ceballos et al., 2015).及时掌握森林生物多样性的现状、格局、变化趋势和受到的威胁, 是制定生物多样性保护政策和措施的前提.长久以来, 森林植物多样性监测依赖于大量的野外调查, 费时费力, 调查结果也受样地选择、调查方法、抽样调查的力度、参与调查人员的专业知识等诸多因素限制(Gotelli & Colwell, 2001; Graham & Hijmans, 2006).同时, 野外调查集中在物种和样地水平, 难以在景观、区域乃至全球尺度上实现对森林植物多样性在时空上的连续监测(Kerr & Ostrovsky, 2003; Nicholson et al., 2009; Levrel et al., 2010; Pereira et al., 2010). ...
The use of hyperspectral remote sensing to assess vascular plant species richness on Horn Island, Mississippi
1
2008
... 本研究基于像元光谱反射率计算了变异系数和凸包面积两种光谱多样性指数, 结果发现两种指数均能很好地估算Shannon-Wiener多样性指数(p < 0.01).这一结果与之前的研究(Lucas & Carter, 2008; Somers et al., 2015; Gholizadeh et al., 2018)一致, 表明CV和CHA是反映α多样性的有用指标.基于波段选择的凸包面积最早应用于草地生物多样性监测(Gholizadeh et al., 2018), 但在森林中还没有进一步的应用.此外, 本研究发现基于影像像元计算的CHA对实测的Shannon-Wiener多样性指数估算精度最高, 进一步证实了Gholizadeh的研究结论, 该研究发现随着分辨率降低, CHA优于包括CV在内的所有其他指标.一般来说, 空间分辨率的降低会产生混合像元, 进一步导致光谱异质性(Rocchini, 2007; Xi et al., 2019).在所用影像都为中分辨率的情况下, CV的计算是用每个波段所有像元的变异系数之和除以波段数, 而CHA是先求出所有波段的变异再除以像元数.前者是整合所有波段值的空间变异, 可能反映所有物种或群落波谱变异的平均值, 而后者是每个波段空间变异的平均值, 可能反映所有物种或群落波谱变异的空间异质性, 更能体现物种或群落间的多样性. ...
Inferring plant functional diversity from space: the potential of Sentinel-2
1
2019
... 除了考虑与植物多样性的关系, 植物功能多样性也是生物多样性的重要组成部分, 它包括植物的化学、生理和形态结构的多样性, 反映了群落、景观、甚至大空间尺度内功能性状的变异性, 决定了生态系统的功能和稳定性(Tilman et al., 1997; Ruiz-Benito et al., 2014).利用卫星遥感影像和野外实测功能性状的关系建模, 反演植物功能多样性对实现全球生物多样性快速监测具有重要意义(Jetz et al., 2016).但由于计算植物功能多样性的可用区域很少且不可重复测量, 传统的计算植物功能多样性的方法不适合用于长期和大规模的监测.遥感反演功能多样性的原理是基于系统发育差异和资源限制导致的植物性状不同(Schweiger et al., 2018), 这些性状主要包括叶片氮浓度、叶片碳浓度、比叶面积、叶片干物质含量和叶面积等叶片性状, 以及株高、树冠横截面积和胸径等全株性状(Ma et al., 2019), 性状上的差异进而影响光谱反射率(Wang et al., 2018).已经有很多研究基于机载高光谱数据绘制高空间分辨率的植物功能多样性空间分布图(Asner et al., 2017; Schneider et al., 2017; Zheng et al., 2021), 但在更大的区域范围内由于获取数据难以实现且成本昂贵, 研究还较少.Sentinel-2号卫星等多光谱空间遥感的发展有利于克服高空间分辨率和监测范围的问题(Rossi et al., 2020; Hauser et al., 2021).目前相关的研究还较少且受很多因素影响, 比如野外数据和卫星影响时间不匹配, 物种的区域差异与方法的适用性等等, 这都有待进一步补充和验证, 可以考虑作为接下来的研究方向. ...
Conflicts between biodiversity conservation and development in a biosphere reserve
1
2009
... 自然保护区可分为核心区、缓冲区和实验区3个功能区.核心区是指保护区内未经或很少经过人为干扰的区域, 保护效果最好, 在核心区外围可划分出一定面积的允许从事科研活动的缓冲区, 在缓冲区周围的为实验区, 为人类活动和规划发展的区域(Ma et al., 2009; Xu et al., 2016).合理的功能区划可以在促进生物多样性保护的同时为当地的经济文化发展作出贡献, 对整个自然保护区的长远发展有重要意义.本研究所选保护区的功能区划概况如图1所示. ...
A ratio vegetation index adjusted for soil brightness
1
1990
... Formula of calculating vegetation index
Table 2 | 植被指数 Vegetation index | 计算公式 Calculate formula | 参考文献 Reference |
| TCARI | 3[(R699.19 - R668.98) - 0.2(R699.19 - R550.67)(R699.19/R668.98)] | Kim et al., 1994 |
| OSAVI | (1 + 0.16)(R750 - R705)/(R750 + R705 + 0.16) | Wu et al., 2008 |
| OSAVI2 | (1 + 0.16)(R800 - R670)/(R800 + R670 + 0.16) | Rondeaux et al., 1996 |
| DATT | (R850 - R710)/(R850 - R680) | Datt, 1999 |
| DATT2 | R850/R710 | Datt, 1999 |
| Gitelson | 1/R700 | Gitelson et al., 1999 |
| SR1 | R750/R700 | Gitelson & Merzlyak, 1997 |
| SR2 | R700/R670 | McMurtrey III et al., 1994 |
| SR3 | R730/R706 | Zarco-Tejada et al., 2003 |
| SR4 | R675/R700 | Gitelson et al., 2003 |
| MSI | R1600/R819 | Hunt & Rock, 1989 |
| NDII | (R819 - R1649)/(R819 + R1649) | Hardisky et al., 1983 |
| CRI1 | 1/R510 - 1/R550 | Gitelson et al., 2002 |
| CRI2 | 1/R510 - 1/R700 | Gitelson et al., 2002 |
| ARI | 1/R550 - 1/R700 | Sims & Gamon, 2002 |
| PSRI | (R680 - R500)/R750 | Merzlyak et al., 1999 |
| NDVI | (R750.66 - R704.6)/(R750.66 + R704.6) | Gitelson & Merzlyak, 1994 |
| GNDVI | (R783 - R560)/(R783 + R560) | Rozenstein et al., 2019 |
| TNDVI | ((R842 - R665)/(R842 + R665) + 0.5)^0.5 | Rozenstein et al., 2019 |
| WDVI | R842 - R665 × 0.5 | Rozenstein et al., 2019 |
| NDI45 | (R705 - R665)/(R705 + R665) | Delegido et al., 2011 |
| SAVI | (1 + L) × (R799.09 - R680.045)/(R799.09 + R680.045 + L) (L = 0.5) | Huete, 1988 |
| SAVI2 | R799.09/(R680.045+ b/a) (a = 0.969 1, b = 0.084 726) | Major et al., 1990 |
| ARVI | RB = R680.045 - r(R444.5 - R680.045) (r = 1)
ARVI = (R799.09 - RB)/(R799.09 + RB) | Kaufman & Tanre, 1992 |
| SARVI | RB = R680.045 - r(R444.5 - R680.045) (r = 1, L = 0.5)
SARVI = (1 + L)(R799.09 - RB)/(R799.09 + RB + L) | Kaufman & Tanre, 1992 |
| EVI | G(R799.09 - R680.045)/(R799.09 + C1R680.045 - C2R444.5 + L)
(G = 2.5, C1 = 6, C2 = 7.5, L = 1) | Huete et al., 1997 |
| IRECI | (R783 - R665)/(R705/R740) | Frampton et al., 2013 |
| IPVI | R842/(R842 + R665) | Rozenstein et al., 2019 |
| PSSRA | R783/R665 | Rozenstein et al., 2019 |
| RVI | R842/R665 | Rozenstein et al., 2019 |
ARI, 花青素反射指数; ARVI, 耐大气植被指数; CRI, 类胡萝卜素反射指数; DATT, DATT植被指数; EVI, 增强型植被指数; Gitelson, Gitelson植被指数; GNDVI,绿色归一化差异植被指数; IPVI, 红外植被百分比指数; IRECI, 倒红边叶绿素指数; MSI, 水分胁迫指数; NDI45, 归一化差异指数; NDII, 归一化红外指数; NDVI, 归一化植被指数; OSAVI, 优化型土壤调节植被指数; PSRI, 植物衰老反射指数; PSSRA, 特征色素简单比值指数; RVI, 比值植被指数; SARVI, 土壤大气阻抗植被指数; SAVI, 土壤调节植被指数; SR, 比值植被指数; TCARI, 转换型叶绿素吸收植被指数; TNDVI, 转化后的归一化植被指数; WDVI, 加权差分植被指数.公式中的R及右下角数字代表位于该波长处的反射值. ...
A random forest modelling procedure for a multi-sensor assessment of tree species diversity
5
2020
... 除了基于光谱多样性的方法, 基于机器学习的方法在森林植被分类和植物多样性监测中也得到了广泛的关注.随机森林(Breiman, 2001)是一种广泛被用于预测的非参数的机器学习算法, 它不假设数据的正态分布, 具有对噪声不敏感、分类更快更稳定的特点(Clark & Roberts, 2012; Miao et al., 2012), 是用于森林多样性建模的最优方法之一(Mallinis et al., 2020; Gyamfi-Ampadu et al., 2021).随机森林里包括用于评估模型准确性的集成交叉验证, 能对重要变量进行排序, 并以非线性的方式处理交互数据.Erinjery等(2018)采用最大似然法和随机森林分类的方法, 基于Sentinel-2光谱波段及其衍生的NDVI和纹理、Sentinel-1 SAR波段及其纹理对高海拔热带雨林不同植被类型图进行了绘制, 分类精度可达75%以上.Mallinis等(2020)基于4种不同分辨率的卫星数据, 利用随机森林回归的方法对森林植物多样性进行了评估, 结果发现基于WorldView-2图像生成的模型精度最高, Shannon-Wiener多样性指数估算精度为0.44, Simpson多样性指数为0.37. ...
... )采用最大似然法和随机森林分类的方法, 基于Sentinel-2光谱波段及其衍生的NDVI和纹理、Sentinel-1 SAR波段及其纹理对高海拔热带雨林不同植被类型图进行了绘制, 分类精度可达75%以上.Mallinis等(2020)基于4种不同分辨率的卫星数据, 利用随机森林回归的方法对森林植物多样性进行了评估, 结果发现基于WorldView-2图像生成的模型精度最高, Shannon-Wiener多样性指数估算精度为0.44, Simpson多样性指数为0.37. ...
... 随机特征的选取是基于影像的光谱信息以及衍生的植被指数.本研究采用了前面计算的两种光谱多样性指数、Sentinel-2A影像的12个波段信息和30个与森林多样性相关的植被指数作为特征波段, 相关植被指数的计算公式如表2所示.计算样地内的光谱变异系数, 以作为森林植被多样性的度量(Torresani et al., 2019; Mallinis et al., 2020). ...
... 除了基于光谱多样性方法, 本研究也采用了机器学习的方法对森林植物多样性进行了估算, 结果发现基于所选特征指数的随机森林回归对Shannon- Wiener多样性指数有较好的反演结果(R2 = 0.79, p < 0.01), 而对其他多样性指数的估算效果较低.随机森林估算结果的准确性主要受两个方面因素的影响.一方面是受影像分辨率的影响, 影像分辨率不同对研究结果会产生一定影响.在草地生态系统中的大规模模拟研究表明, α多样性的估算精度随着空间分辨率的降低而下降, 最佳的估算精度是像元 大小与单个植株大小相接近时的精度(Wang et al., 2018).这是因为遥感反映的是面上的信息, 利用遥感数据计算的不是物种间的光谱变异, 而是用像元代表的群落间的光谱变异间接指示物种间的变异,其中存在一定的误差, 而将分辨率提升到单木尺度会提高估算精度.另一方面受输入特征变量的影响, 本研究在44个输入变量中通过十折交叉验证对变量进行了筛选, 最后挑选了使估算结果最好的6个特征变量, 去除了变量间共线性和冗余信息的干扰.在变量挑选时发现输入的两种光谱多样性指数的重要性排序明显高于其余的特征变量, 说明这两种指数可以作为随机森林估算植物多样性的重要指标, 间接证明了前面直接利用两种指标进行植物多样性估算的可行性和合理性.但是, 重要性排序中的CV的重要性程度略高于CHA, 这可能是因为CHA与其他植被指数间存在一定相关性, 会对重要性结果产生一定影响.此外, 在森林生态系统类型中, 森林的空间分布和结构参数也会影响估算结果(Marceau et al., 1994; Gholizadeh et al., 2019), 即使采用相同分辨率的影像, 在不同地区或不同森林类型中结果可能存在一定差异(Mallinis et al., 2020; Gyamfi-Ampadu et al., 2021). ...
... 本研究目前只是在温带森林中开展, 因为气候地理条件差异, 如果要将此方法应用在不同地区的不同类型的森林中, 还需要进行进一步的验证和评估.国外相关学者基于Sentinel-2A影像, 以地中海地区的落叶阔叶林和针阔混交林为研究对象, 利用随机森林回归方法对森林植物多样性进行评估, 结果发现估算的Shannon-Wiener多样性指数精度在0.29-0.31之间, 而Simpson多样性指数的估算精度可达0.31-0.37 (Chrysafis et al., 2020; Mallinis et al., 2020).本研究的结果与这些结论略有差异.本研究除了基于波段本身, 还加入了与植物多样性相关的指数作为随机森林的输入变量, 据此估算的Shannon-Wiener多样性指数精度较高, 但未发现光谱多样性与Simpson多样性指数有显著关系(R2 = 0.1), 这可能是受限于东北森林类型及其物种分布格局.今后的研究在应用到其他区域时, 可以在更大尺度上利用更多样方数据来进一步验证. ...
Remote sensing and the measurement of geographical entities in a forested environment. 2. The optimal spatial resolution
1
1994
... 除了基于光谱多样性方法, 本研究也采用了机器学习的方法对森林植物多样性进行了估算, 结果发现基于所选特征指数的随机森林回归对Shannon- Wiener多样性指数有较好的反演结果(R2 = 0.79, p < 0.01), 而对其他多样性指数的估算效果较低.随机森林估算结果的准确性主要受两个方面因素的影响.一方面是受影像分辨率的影响, 影像分辨率不同对研究结果会产生一定影响.在草地生态系统中的大规模模拟研究表明, α多样性的估算精度随着空间分辨率的降低而下降, 最佳的估算精度是像元 大小与单个植株大小相接近时的精度(Wang et al., 2018).这是因为遥感反映的是面上的信息, 利用遥感数据计算的不是物种间的光谱变异, 而是用像元代表的群落间的光谱变异间接指示物种间的变异,其中存在一定的误差, 而将分辨率提升到单木尺度会提高估算精度.另一方面受输入特征变量的影响, 本研究在44个输入变量中通过十折交叉验证对变量进行了筛选, 最后挑选了使估算结果最好的6个特征变量, 去除了变量间共线性和冗余信息的干扰.在变量挑选时发现输入的两种光谱多样性指数的重要性排序明显高于其余的特征变量, 说明这两种指数可以作为随机森林估算植物多样性的重要指标, 间接证明了前面直接利用两种指标进行植物多样性估算的可行性和合理性.但是, 重要性排序中的CV的重要性程度略高于CHA, 这可能是因为CHA与其他植被指数间存在一定相关性, 会对重要性结果产生一定影响.此外, 在森林生态系统类型中, 森林的空间分布和结构参数也会影响估算结果(Marceau et al., 1994; Gholizadeh et al., 2019), 即使采用相同分辨率的影像, 在不同地区或不同森林类型中结果可能存在一定差异(Mallinis et al., 2020; Gyamfi-Ampadu et al., 2021). ...
Distinguishing nitrogen fertilization levels in field corn (Zea mays L.) with actively induced fluorescence and passive reflectance measurements
1
1994
... Formula of calculating vegetation index
Table 2 | 植被指数 Vegetation index | 计算公式 Calculate formula | 参考文献 Reference |
| TCARI | 3[(R699.19 - R668.98) - 0.2(R699.19 - R550.67)(R699.19/R668.98)] | Kim et al., 1994 |
| OSAVI | (1 + 0.16)(R750 - R705)/(R750 + R705 + 0.16) | Wu et al., 2008 |
| OSAVI2 | (1 + 0.16)(R800 - R670)/(R800 + R670 + 0.16) | Rondeaux et al., 1996 |
| DATT | (R850 - R710)/(R850 - R680) | Datt, 1999 |
| DATT2 | R850/R710 | Datt, 1999 |
| Gitelson | 1/R700 | Gitelson et al., 1999 |
| SR1 | R750/R700 | Gitelson & Merzlyak, 1997 |
| SR2 | R700/R670 | McMurtrey III et al., 1994 |
| SR3 | R730/R706 | Zarco-Tejada et al., 2003 |
| SR4 | R675/R700 | Gitelson et al., 2003 |
| MSI | R1600/R819 | Hunt & Rock, 1989 |
| NDII | (R819 - R1649)/(R819 + R1649) | Hardisky et al., 1983 |
| CRI1 | 1/R510 - 1/R550 | Gitelson et al., 2002 |
| CRI2 | 1/R510 - 1/R700 | Gitelson et al., 2002 |
| ARI | 1/R550 - 1/R700 | Sims & Gamon, 2002 |
| PSRI | (R680 - R500)/R750 | Merzlyak et al., 1999 |
| NDVI | (R750.66 - R704.6)/(R750.66 + R704.6) | Gitelson & Merzlyak, 1994 |
| GNDVI | (R783 - R560)/(R783 + R560) | Rozenstein et al., 2019 |
| TNDVI | ((R842 - R665)/(R842 + R665) + 0.5)^0.5 | Rozenstein et al., 2019 |
| WDVI | R842 - R665 × 0.5 | Rozenstein et al., 2019 |
| NDI45 | (R705 - R665)/(R705 + R665) | Delegido et al., 2011 |
| SAVI | (1 + L) × (R799.09 - R680.045)/(R799.09 + R680.045 + L) (L = 0.5) | Huete, 1988 |
| SAVI2 | R799.09/(R680.045+ b/a) (a = 0.969 1, b = 0.084 726) | Major et al., 1990 |
| ARVI | RB = R680.045 - r(R444.5 - R680.045) (r = 1)
ARVI = (R799.09 - RB)/(R799.09 + RB) | Kaufman & Tanre, 1992 |
| SARVI | RB = R680.045 - r(R444.5 - R680.045) (r = 1, L = 0.5)
SARVI = (1 + L)(R799.09 - RB)/(R799.09 + RB + L) | Kaufman & Tanre, 1992 |
| EVI | G(R799.09 - R680.045)/(R799.09 + C1R680.045 - C2R444.5 + L)
(G = 2.5, C1 = 6, C2 = 7.5, L = 1) | Huete et al., 1997 |
| IRECI | (R783 - R665)/(R705/R740) | Frampton et al., 2013 |
| IPVI | R842/(R842 + R665) | Rozenstein et al., 2019 |
| PSSRA | R783/R665 | Rozenstein et al., 2019 |
| RVI | R842/R665 | Rozenstein et al., 2019 |
ARI, 花青素反射指数; ARVI, 耐大气植被指数; CRI, 类胡萝卜素反射指数; DATT, DATT植被指数; EVI, 增强型植被指数; Gitelson, Gitelson植被指数; GNDVI,绿色归一化差异植被指数; IPVI, 红外植被百分比指数; IRECI, 倒红边叶绿素指数; MSI, 水分胁迫指数; NDI45, 归一化差异指数; NDII, 归一化红外指数; NDVI, 归一化植被指数; OSAVI, 优化型土壤调节植被指数; PSRI, 植物衰老反射指数; PSSRA, 特征色素简单比值指数; RVI, 比值植被指数; SARVI, 土壤大气阻抗植被指数; SAVI, 土壤调节植被指数; SR, 比值植被指数; TCARI, 转换型叶绿素吸收植被指数; TNDVI, 转化后的归一化植被指数; WDVI, 加权差分植被指数.公式中的R及右下角数字代表位于该波长处的反射值. ...
Biodiversity assessment using hierarchical agglomerative clustering and spectral unmixing over hyperspectral images
2
2013
... 然而, 由于物种内的光谱变异会混淆物种间的光谱多样性, 进一步影响植物多样性的预测精度.聚类分析作为一种非监督分类绘制植物多样性图的有效方法, 可以基于聚类结果进一步计算光谱异质性, 能够在一定程度上减少物种内光谱变异(Medina et al., 2013; Féret & de Boissieu, 2020).目前使用非监督分类方法的森林植物多样性研究还较少.Féret和de Boissieu (2020)基于Sentinel-2光谱影像, 利用K均值聚类生成光谱物种图, 再以此绘制了亚马孙某片森林的α和β多样性.也有研究基于分辨率更高的高光谱影像, 通过不同聚类方法反演植物多样性.Medina等(2013)基于AISA机载高光谱数据, 利用光谱方差估算物种丰富度, 发现基于层次聚类得到的Shannon-Wiener多样性指数与野外数据之间的相关性是可变的, 甚至在某些情况下是负的, 但在聚类后进行光谱解混可以显著改善.Zhao等(2018)利用机载高光谱和激光雷达数据对神农架自然保护区森林冠层的单木进行分割, 利用自适应模糊C均值聚类方法, 估算了该区域的树种丰富度和Shannon-Wiener多样性指数(R2 = 0.83, 均方根误差(RMSE) = 0.25). ...
... 均值聚类生成光谱物种图, 再以此绘制了亚马孙某片森林的α和β多样性.也有研究基于分辨率更高的高光谱影像, 通过不同聚类方法反演植物多样性.Medina等(2013)基于AISA机载高光谱数据, 利用光谱方差估算物种丰富度, 发现基于层次聚类得到的Shannon-Wiener多样性指数与野外数据之间的相关性是可变的, 甚至在某些情况下是负的, 但在聚类后进行光谱解混可以显著改善.Zhao等(2018)利用机载高光谱和激光雷达数据对神农架自然保护区森林冠层的单木进行分割, 利用自适应模糊C均值聚类方法, 估算了该区域的树种丰富度和Shannon-Wiener多样性指数(R2 = 0.83, 均方根误差(RMSE) = 0.25). ...
Non-destructive optical detection of pigment changes during leaf senescence and fruit ripening
1
1999
... Formula of calculating vegetation index
Table 2 | 植被指数 Vegetation index | 计算公式 Calculate formula | 参考文献 Reference |
| TCARI | 3[(R699.19 - R668.98) - 0.2(R699.19 - R550.67)(R699.19/R668.98)] | Kim et al., 1994 |
| OSAVI | (1 + 0.16)(R750 - R705)/(R750 + R705 + 0.16) | Wu et al., 2008 |
| OSAVI2 | (1 + 0.16)(R800 - R670)/(R800 + R670 + 0.16) | Rondeaux et al., 1996 |
| DATT | (R850 - R710)/(R850 - R680) | Datt, 1999 |
| DATT2 | R850/R710 | Datt, 1999 |
| Gitelson | 1/R700 | Gitelson et al., 1999 |
| SR1 | R750/R700 | Gitelson & Merzlyak, 1997 |
| SR2 | R700/R670 | McMurtrey III et al., 1994 |
| SR3 | R730/R706 | Zarco-Tejada et al., 2003 |
| SR4 | R675/R700 | Gitelson et al., 2003 |
| MSI | R1600/R819 | Hunt & Rock, 1989 |
| NDII | (R819 - R1649)/(R819 + R1649) | Hardisky et al., 1983 |
| CRI1 | 1/R510 - 1/R550 | Gitelson et al., 2002 |
| CRI2 | 1/R510 - 1/R700 | Gitelson et al., 2002 |
| ARI | 1/R550 - 1/R700 | Sims & Gamon, 2002 |
| PSRI | (R680 - R500)/R750 | Merzlyak et al., 1999 |
| NDVI | (R750.66 - R704.6)/(R750.66 + R704.6) | Gitelson & Merzlyak, 1994 |
| GNDVI | (R783 - R560)/(R783 + R560) | Rozenstein et al., 2019 |
| TNDVI | ((R842 - R665)/(R842 + R665) + 0.5)^0.5 | Rozenstein et al., 2019 |
| WDVI | R842 - R665 × 0.5 | Rozenstein et al., 2019 |
| NDI45 | (R705 - R665)/(R705 + R665) | Delegido et al., 2011 |
| SAVI | (1 + L) × (R799.09 - R680.045)/(R799.09 + R680.045 + L) (L = 0.5) | Huete, 1988 |
| SAVI2 | R799.09/(R680.045+ b/a) (a = 0.969 1, b = 0.084 726) | Major et al., 1990 |
| ARVI | RB = R680.045 - r(R444.5 - R680.045) (r = 1)
ARVI = (R799.09 - RB)/(R799.09 + RB) | Kaufman & Tanre, 1992 |
| SARVI | RB = R680.045 - r(R444.5 - R680.045) (r = 1, L = 0.5)
SARVI = (1 + L)(R799.09 - RB)/(R799.09 + RB + L) | Kaufman & Tanre, 1992 |
| EVI | G(R799.09 - R680.045)/(R799.09 + C1R680.045 - C2R444.5 + L)
(G = 2.5, C1 = 6, C2 = 7.5, L = 1) | Huete et al., 1997 |
| IRECI | (R783 - R665)/(R705/R740) | Frampton et al., 2013 |
| IPVI | R842/(R842 + R665) | Rozenstein et al., 2019 |
| PSSRA | R783/R665 | Rozenstein et al., 2019 |
| RVI | R842/R665 | Rozenstein et al., 2019 |
ARI, 花青素反射指数; ARVI, 耐大气植被指数; CRI, 类胡萝卜素反射指数; DATT, DATT植被指数; EVI, 增强型植被指数; Gitelson, Gitelson植被指数; GNDVI,绿色归一化差异植被指数; IPVI, 红外植被百分比指数; IRECI, 倒红边叶绿素指数; MSI, 水分胁迫指数; NDI45, 归一化差异指数; NDII, 归一化红外指数; NDVI, 归一化植被指数; OSAVI, 优化型土壤调节植被指数; PSRI, 植物衰老反射指数; PSSRA, 特征色素简单比值指数; RVI, 比值植被指数; SARVI, 土壤大气阻抗植被指数; SAVI, 土壤调节植被指数; SR, 比值植被指数; TCARI, 转换型叶绿素吸收植被指数; TNDVI, 转化后的归一化植被指数; WDVI, 加权差分植被指数.公式中的R及右下角数字代表位于该波长处的反射值. ...
Applying tree-based ensemble algorithms to the classification of ecological zones using multi-temporal multi- source remote-sensing data
1
2012
... 除了基于光谱多样性的方法, 基于机器学习的方法在森林植被分类和植物多样性监测中也得到了广泛的关注.随机森林(Breiman, 2001)是一种广泛被用于预测的非参数的机器学习算法, 它不假设数据的正态分布, 具有对噪声不敏感、分类更快更稳定的特点(Clark & Roberts, 2012; Miao et al., 2012), 是用于森林多样性建模的最优方法之一(Mallinis et al., 2020; Gyamfi-Ampadu et al., 2021).随机森林里包括用于评估模型准确性的集成交叉验证, 能对重要变量进行排序, 并以非线性的方式处理交互数据.Erinjery等(2018)采用最大似然法和随机森林分类的方法, 基于Sentinel-2光谱波段及其衍生的NDVI和纹理、Sentinel-1 SAR波段及其纹理对高海拔热带雨林不同植被类型图进行了绘制, 分类精度可达75%以上.Mallinis等(2020)基于4种不同分辨率的卫星数据, 利用随机森林回归的方法对森林植物多样性进行了评估, 结果发现基于WorldView-2图像生成的模型精度最高, Shannon-Wiener多样性指数估算精度为0.44, Simpson多样性指数为0.37. ...
Using remote sensing to assess biodiversity
1
2001
... 近年来, 随着遥感技术的迅速发展, 使得在大尺度、多时空上评估生物多样性成为可能.遥感数据具有覆盖范围广、可持续性强以及可重复的特点(Nagendra, 2001; Duro et al., 2007), 有助于迅速地揭示大面积生物多样性丢失状况, 对大尺度、长时间序列的生物多样性评估至关重要(Turner, 2014).生物多样性遥感监测方法可总结为直接法和间接法两种(Turner et al., 2003).直接法是利用高空间分辨率和高光谱分辨率的卫星传感器直接识别物种、种群或群落.Ke等(2010)利用QuickBird高分辨率多光谱数据和激光雷达数据, 通过图像分割和基于目标的分类方法对森林物种进行识别, 发现两种数据均有较好的结果, 但是结合两种数据源能获取更高的精度, Kappa系数最高可达91.6%.Cross等(2019)利用WorldView-3卫星影像对热带森林里的6个森林物种进行了分类, 分类准确率高达85.37%.间接法是通过遥感数据反演与生物多样性密切相关的指标或参数, 再与野外实测数据构建统计模型以反演生物多样性.植被指数、植物生化组分和植被结构等都可以作为植物多样性研究的相关指标.归一化植被指数(NDVI)经常被用来指示区域的物种多样性(Fairbanks & Mcgwire, 2004; Feeley et al., 2005), 而增强型植被指数(EVI)则可以更好地在植被茂密的地区代替NDVI (Waring et al., 2006).此外, 与光谱变异相关的叶片叶绿素、氮含量、色素、水分等生化组分的变化也可以用来估算森林物种多样性(Carlson et al., 2007). ...
High resolution satellite imagery for tropical biodiversity studies: the devil is in the detail
1
2008
... 光谱变异假说是生物多样性直接遥感监测的主要理论基础, 即遥感图像光谱多样性与物种多样性有关.光谱多样性, 有时也被称为光学多样性(Palmer et al., 2002; Ustin & Gamon, 2010)、光谱异质性或光谱变异性(Rocchini et al., 2010), 表征光谱反射率的空间变化, 这种变化与植物多样性相关的植物光学性状的差异有关, 可以用来反映物种多样性(Gillespie et al., 2008; Nagendra & Rocchini, 2008).基于光谱变异假说的光谱多样性与物种多样性的研究已经有很多, 在温带森林(Laliberté et al., 2020), 亚热带森林(Kalacska et al., 2007), 热带森林(Asner & Martin, 2009; Féret & Asner, 2014; Schäfer et al., 2016), 草原(Oldeland et al., 2010; Wang et al., 2016, 2018; Gholizadeh et al., 2020)均有报道.常用光谱多样性指数包括变异系数(CV)(Somers et al., 2015; Wang et al., 2016), 凸包体积(CHV)(Dahlin, 2016; Gholizadeh et al., 2018), 凸包面积(CHA)(Gholizadeh et al., 2018), 光谱角度制图(SAM)(Zhang et al., 2006; Gholizadeh et al., 2018), 光谱信息散度(SID)(Chang, 2000)等. ...
Priority research areas for ecosystem services in a changing world
1
2009
... 森林是陆地生态系统的重要组成部分, 占全球陆地面积的30%, 在维持生物多样性和生物圈功能方面发挥着重要作用(Pan et al., 2013; Harrison et al., 2014).然而, 由于人类活动和气候变化的影响, 生物多样性正在以一种前所未有的速度丧失(Ceballos et al., 2015).及时掌握森林生物多样性的现状、格局、变化趋势和受到的威胁, 是制定生物多样性保护政策和措施的前提.长久以来, 森林植物多样性监测依赖于大量的野外调查, 费时费力, 调查结果也受样地选择、调查方法、抽样调查的力度、参与调查人员的专业知识等诸多因素限制(Gotelli & Colwell, 2001; Graham & Hijmans, 2006).同时, 野外调查集中在物种和样地水平, 难以在景观、区域乃至全球尺度上实现对森林植物多样性在时空上的连续监测(Kerr & Ostrovsky, 2003; Nicholson et al., 2009; Levrel et al., 2010; Pereira et al., 2010). ...
Does using species abundance data improve estimates of species diversity from remotely sensed spectral heterogeneity?
2
2010
... 光谱变异假说是生物多样性直接遥感监测的主要理论基础, 即遥感图像光谱多样性与物种多样性有关.光谱多样性, 有时也被称为光学多样性(Palmer et al., 2002; Ustin & Gamon, 2010)、光谱异质性或光谱变异性(Rocchini et al., 2010), 表征光谱反射率的空间变化, 这种变化与植物多样性相关的植物光学性状的差异有关, 可以用来反映物种多样性(Gillespie et al., 2008; Nagendra & Rocchini, 2008).基于光谱变异假说的光谱多样性与物种多样性的研究已经有很多, 在温带森林(Laliberté et al., 2020), 亚热带森林(Kalacska et al., 2007), 热带森林(Asner & Martin, 2009; Féret & Asner, 2014; Schäfer et al., 2016), 草原(Oldeland et al., 2010; Wang et al., 2016, 2018; Gholizadeh et al., 2020)均有报道.常用光谱多样性指数包括变异系数(CV)(Somers et al., 2015; Wang et al., 2016), 凸包体积(CHV)(Dahlin, 2016; Gholizadeh et al., 2018), 凸包面积(CHA)(Gholizadeh et al., 2018), 光谱角度制图(SAM)(Zhang et al., 2006; Gholizadeh et al., 2018), 光谱信息散度(SID)(Chang, 2000)等. ...
... 但是, 研究发现两种光谱多样性指数均不能估算Simpson多样性指数和物种丰富度.这主要是由于遥感估算多样性是基于面上的信息, 物种所占的面积比例对影像光谱的影响更大, 而非物种的个数.Shannon-Wiener多样性指数考虑了物种的数量和每个物种的相对丰度用以衡量异质性(Pielou, 1966), 所以估算精度较高, 而Simpson多样性指数则是反映群落中少数物种的优势度(Fauvel et al., 2020).此外, 多样性指数的估算比物种丰富度指数的估算更准确, 可能是因为丰富度仅基于物种的存在或缺失, 稀有物种的存在会影响物种丰富度, 但在影像上可能难以监测.在森林中稀有物种的冠幅占比较小, Sentinel-2A卫星的分辨率有限, 传感器很难检测到细微的单个物种变化, 而更多地指示像元内优势物种变异, 因此Shannon-Wiener多样性指数更适合区域尺度森林植物多样性的遥感估算(Oldeland et al., 2010). ...
Quantitative tools for perfecting species lists
1
2002
... 光谱变异假说是生物多样性直接遥感监测的主要理论基础, 即遥感图像光谱多样性与物种多样性有关.光谱多样性, 有时也被称为光学多样性(Palmer et al., 2002; Ustin & Gamon, 2010)、光谱异质性或光谱变异性(Rocchini et al., 2010), 表征光谱反射率的空间变化, 这种变化与植物多样性相关的植物光学性状的差异有关, 可以用来反映物种多样性(Gillespie et al., 2008; Nagendra & Rocchini, 2008).基于光谱变异假说的光谱多样性与物种多样性的研究已经有很多, 在温带森林(Laliberté et al., 2020), 亚热带森林(Kalacska et al., 2007), 热带森林(Asner & Martin, 2009; Féret & Asner, 2014; Schäfer et al., 2016), 草原(Oldeland et al., 2010; Wang et al., 2016, 2018; Gholizadeh et al., 2020)均有报道.常用光谱多样性指数包括变异系数(CV)(Somers et al., 2015; Wang et al., 2016), 凸包体积(CHV)(Dahlin, 2016; Gholizadeh et al., 2018), 凸包面积(CHA)(Gholizadeh et al., 2018), 光谱角度制图(SAM)(Zhang et al., 2006; Gholizadeh et al., 2018), 光谱信息散度(SID)(Chang, 2000)等. ...
The structure, distribution, and biomass of the world?s forests
1
2013
... 森林是陆地生态系统的重要组成部分, 占全球陆地面积的30%, 在维持生物多样性和生物圈功能方面发挥着重要作用(Pan et al., 2013; Harrison et al., 2014).然而, 由于人类活动和气候变化的影响, 生物多样性正在以一种前所未有的速度丧失(Ceballos et al., 2015).及时掌握森林生物多样性的现状、格局、变化趋势和受到的威胁, 是制定生物多样性保护政策和措施的前提.长久以来, 森林植物多样性监测依赖于大量的野外调查, 费时费力, 调查结果也受样地选择、调查方法、抽样调查的力度、参与调查人员的专业知识等诸多因素限制(Gotelli & Colwell, 2001; Graham & Hijmans, 2006).同时, 野外调查集中在物种和样地水平, 难以在景观、区域乃至全球尺度上实现对森林植物多样性在时空上的连续监测(Kerr & Ostrovsky, 2003; Nicholson et al., 2009; Levrel et al., 2010; Pereira et al., 2010). ...
Global biodiversity monitoring
1
2010
... 森林是陆地生态系统的重要组成部分, 占全球陆地面积的30%, 在维持生物多样性和生物圈功能方面发挥着重要作用(Pan et al., 2013; Harrison et al., 2014).然而, 由于人类活动和气候变化的影响, 生物多样性正在以一种前所未有的速度丧失(Ceballos et al., 2015).及时掌握森林生物多样性的现状、格局、变化趋势和受到的威胁, 是制定生物多样性保护政策和措施的前提.长久以来, 森林植物多样性监测依赖于大量的野外调查, 费时费力, 调查结果也受样地选择、调查方法、抽样调查的力度、参与调查人员的专业知识等诸多因素限制(Gotelli & Colwell, 2001; Graham & Hijmans, 2006).同时, 野外调查集中在物种和样地水平, 难以在景观、区域乃至全球尺度上实现对森林植物多样性在时空上的连续监测(Kerr & Ostrovsky, 2003; Nicholson et al., 2009; Levrel et al., 2010; Pereira et al., 2010). ...
The measurement of diversity in different types of biological collections
2
1966
... 式中, n为样方中的物种数, Pi为第i个物种的个体数占所有物种总个体数的比例(Pielou, 1966). ...
... 但是, 研究发现两种光谱多样性指数均不能估算Simpson多样性指数和物种丰富度.这主要是由于遥感估算多样性是基于面上的信息, 物种所占的面积比例对影像光谱的影响更大, 而非物种的个数.Shannon-Wiener多样性指数考虑了物种的数量和每个物种的相对丰度用以衡量异质性(Pielou, 1966), 所以估算精度较高, 而Simpson多样性指数则是反映群落中少数物种的优势度(Fauvel et al., 2020).此外, 多样性指数的估算比物种丰富度指数的估算更准确, 可能是因为丰富度仅基于物种的存在或缺失, 稀有物种的存在会影响物种丰富度, 但在影像上可能难以监测.在森林中稀有物种的冠幅占比较小, Sentinel-2A卫星的分辨率有限, 传感器很难检测到细微的单个物种变化, 而更多地指示像元内优势物种变异, 因此Shannon-Wiener多样性指数更适合区域尺度森林植物多样性的遥感估算(Oldeland et al., 2010). ...
Effects of spatial and spectral resolution in estimating ecosystem α-diversity by satellite imagery
1
2007
... 本研究基于像元光谱反射率计算了变异系数和凸包面积两种光谱多样性指数, 结果发现两种指数均能很好地估算Shannon-Wiener多样性指数(p < 0.01).这一结果与之前的研究(Lucas & Carter, 2008; Somers et al., 2015; Gholizadeh et al., 2018)一致, 表明CV和CHA是反映α多样性的有用指标.基于波段选择的凸包面积最早应用于草地生物多样性监测(Gholizadeh et al., 2018), 但在森林中还没有进一步的应用.此外, 本研究发现基于影像像元计算的CHA对实测的Shannon-Wiener多样性指数估算精度最高, 进一步证实了Gholizadeh的研究结论, 该研究发现随着分辨率降低, CHA优于包括CV在内的所有其他指标.一般来说, 空间分辨率的降低会产生混合像元, 进一步导致光谱异质性(Rocchini, 2007; Xi et al., 2019).在所用影像都为中分辨率的情况下, CV的计算是用每个波段所有像元的变异系数之和除以波段数, 而CHA是先求出所有波段的变异再除以像元数.前者是整合所有波段值的空间变异, 可能反映所有物种或群落波谱变异的平均值, 而后者是每个波段空间变异的平均值, 可能反映所有物种或群落波谱变异的空间异质性, 更能体现物种或群落间的多样性. ...
Remotely sensed spectral heterogeneity as a proxy of species diversity: recent advances and open challenges
1
2010
... 光谱变异假说是生物多样性直接遥感监测的主要理论基础, 即遥感图像光谱多样性与物种多样性有关.光谱多样性, 有时也被称为光学多样性(Palmer et al., 2002; Ustin & Gamon, 2010)、光谱异质性或光谱变异性(Rocchini et al., 2010), 表征光谱反射率的空间变化, 这种变化与植物多样性相关的植物光学性状的差异有关, 可以用来反映物种多样性(Gillespie et al., 2008; Nagendra & Rocchini, 2008).基于光谱变异假说的光谱多样性与物种多样性的研究已经有很多, 在温带森林(Laliberté et al., 2020), 亚热带森林(Kalacska et al., 2007), 热带森林(Asner & Martin, 2009; Féret & Asner, 2014; Schäfer et al., 2016), 草原(Oldeland et al., 2010; Wang et al., 2016, 2018; Gholizadeh et al., 2020)均有报道.常用光谱多样性指数包括变异系数(CV)(Somers et al., 2015; Wang et al., 2016), 凸包体积(CHV)(Dahlin, 2016; Gholizadeh et al., 2018), 凸包面积(CHA)(Gholizadeh et al., 2018), 光谱角度制图(SAM)(Zhang et al., 2006; Gholizadeh et al., 2018), 光谱信息散度(SID)(Chang, 2000)等. ...
Optimization of soil- adjusted vegetation indices
1
1996
... Formula of calculating vegetation index
Table 2 | 植被指数 Vegetation index | 计算公式 Calculate formula | 参考文献 Reference |
| TCARI | 3[(R699.19 - R668.98) - 0.2(R699.19 - R550.67)(R699.19/R668.98)] | Kim et al., 1994 |
| OSAVI | (1 + 0.16)(R750 - R705)/(R750 + R705 + 0.16) | Wu et al., 2008 |
| OSAVI2 | (1 + 0.16)(R800 - R670)/(R800 + R670 + 0.16) | Rondeaux et al., 1996 |
| DATT | (R850 - R710)/(R850 - R680) | Datt, 1999 |
| DATT2 | R850/R710 | Datt, 1999 |
| Gitelson | 1/R700 | Gitelson et al., 1999 |
| SR1 | R750/R700 | Gitelson & Merzlyak, 1997 |
| SR2 | R700/R670 | McMurtrey III et al., 1994 |
| SR3 | R730/R706 | Zarco-Tejada et al., 2003 |
| SR4 | R675/R700 | Gitelson et al., 2003 |
| MSI | R1600/R819 | Hunt & Rock, 1989 |
| NDII | (R819 - R1649)/(R819 + R1649) | Hardisky et al., 1983 |
| CRI1 | 1/R510 - 1/R550 | Gitelson et al., 2002 |
| CRI2 | 1/R510 - 1/R700 | Gitelson et al., 2002 |
| ARI | 1/R550 - 1/R700 | Sims & Gamon, 2002 |
| PSRI | (R680 - R500)/R750 | Merzlyak et al., 1999 |
| NDVI | (R750.66 - R704.6)/(R750.66 + R704.6) | Gitelson & Merzlyak, 1994 |
| GNDVI | (R783 - R560)/(R783 + R560) | Rozenstein et al., 2019 |
| TNDVI | ((R842 - R665)/(R842 + R665) + 0.5)^0.5 | Rozenstein et al., 2019 |
| WDVI | R842 - R665 × 0.5 | Rozenstein et al., 2019 |
| NDI45 | (R705 - R665)/(R705 + R665) | Delegido et al., 2011 |
| SAVI | (1 + L) × (R799.09 - R680.045)/(R799.09 + R680.045 + L) (L = 0.5) | Huete, 1988 |
| SAVI2 | R799.09/(R680.045+ b/a) (a = 0.969 1, b = 0.084 726) | Major et al., 1990 |
| ARVI | RB = R680.045 - r(R444.5 - R680.045) (r = 1)
ARVI = (R799.09 - RB)/(R799.09 + RB) | Kaufman & Tanre, 1992 |
| SARVI | RB = R680.045 - r(R444.5 - R680.045) (r = 1, L = 0.5)
SARVI = (1 + L)(R799.09 - RB)/(R799.09 + RB + L) | Kaufman & Tanre, 1992 |
| EVI | G(R799.09 - R680.045)/(R799.09 + C1R680.045 - C2R444.5 + L)
(G = 2.5, C1 = 6, C2 = 7.5, L = 1) | Huete et al., 1997 |
| IRECI | (R783 - R665)/(R705/R740) | Frampton et al., 2013 |
| IPVI | R842/(R842 + R665) | Rozenstein et al., 2019 |
| PSSRA | R783/R665 | Rozenstein et al., 2019 |
| RVI | R842/R665 | Rozenstein et al., 2019 |
ARI, 花青素反射指数; ARVI, 耐大气植被指数; CRI, 类胡萝卜素反射指数; DATT, DATT植被指数; EVI, 增强型植被指数; Gitelson, Gitelson植被指数; GNDVI,绿色归一化差异植被指数; IPVI, 红外植被百分比指数; IRECI, 倒红边叶绿素指数; MSI, 水分胁迫指数; NDI45, 归一化差异指数; NDII, 归一化红外指数; NDVI, 归一化植被指数; OSAVI, 优化型土壤调节植被指数; PSRI, 植物衰老反射指数; PSSRA, 特征色素简单比值指数; RVI, 比值植被指数; SARVI, 土壤大气阻抗植被指数; SAVI, 土壤调节植被指数; SR, 比值植被指数; TCARI, 转换型叶绿素吸收植被指数; TNDVI, 转化后的归一化植被指数; WDVI, 加权差分植被指数.公式中的R及右下角数字代表位于该波长处的反射值. ...
From local to regional: functional diversity in differently managed alpine grasslands
1
2020
... 除了考虑与植物多样性的关系, 植物功能多样性也是生物多样性的重要组成部分, 它包括植物的化学、生理和形态结构的多样性, 反映了群落、景观、甚至大空间尺度内功能性状的变异性, 决定了生态系统的功能和稳定性(Tilman et al., 1997; Ruiz-Benito et al., 2014).利用卫星遥感影像和野外实测功能性状的关系建模, 反演植物功能多样性对实现全球生物多样性快速监测具有重要意义(Jetz et al., 2016).但由于计算植物功能多样性的可用区域很少且不可重复测量, 传统的计算植物功能多样性的方法不适合用于长期和大规模的监测.遥感反演功能多样性的原理是基于系统发育差异和资源限制导致的植物性状不同(Schweiger et al., 2018), 这些性状主要包括叶片氮浓度、叶片碳浓度、比叶面积、叶片干物质含量和叶面积等叶片性状, 以及株高、树冠横截面积和胸径等全株性状(Ma et al., 2019), 性状上的差异进而影响光谱反射率(Wang et al., 2018).已经有很多研究基于机载高光谱数据绘制高空间分辨率的植物功能多样性空间分布图(Asner et al., 2017; Schneider et al., 2017; Zheng et al., 2021), 但在更大的区域范围内由于获取数据难以实现且成本昂贵, 研究还较少.Sentinel-2号卫星等多光谱空间遥感的发展有利于克服高空间分辨率和监测范围的问题(Rossi et al., 2020; Hauser et al., 2021).目前相关的研究还较少且受很多因素影响, 比如野外数据和卫星影响时间不匹配, 物种的区域差异与方法的适用性等等, 这都有待进一步补充和验证, 可以考虑作为接下来的研究方向. ...
Validation of the cotton crop coefficient estimation model based on Sentinel-2 imagery and eddy covariance measurements
6
2019
... Formula of calculating vegetation index
Table 2 | 植被指数 Vegetation index | 计算公式 Calculate formula | 参考文献 Reference |
| TCARI | 3[(R699.19 - R668.98) - 0.2(R699.19 - R550.67)(R699.19/R668.98)] | Kim et al., 1994 |
| OSAVI | (1 + 0.16)(R750 - R705)/(R750 + R705 + 0.16) | Wu et al., 2008 |
| OSAVI2 | (1 + 0.16)(R800 - R670)/(R800 + R670 + 0.16) | Rondeaux et al., 1996 |
| DATT | (R850 - R710)/(R850 - R680) | Datt, 1999 |
| DATT2 | R850/R710 | Datt, 1999 |
| Gitelson | 1/R700 | Gitelson et al., 1999 |
| SR1 | R750/R700 | Gitelson & Merzlyak, 1997 |
| SR2 | R700/R670 | McMurtrey III et al., 1994 |
| SR3 | R730/R706 | Zarco-Tejada et al., 2003 |
| SR4 | R675/R700 | Gitelson et al., 2003 |
| MSI | R1600/R819 | Hunt & Rock, 1989 |
| NDII | (R819 - R1649)/(R819 + R1649) | Hardisky et al., 1983 |
| CRI1 | 1/R510 - 1/R550 | Gitelson et al., 2002 |
| CRI2 | 1/R510 - 1/R700 | Gitelson et al., 2002 |
| ARI | 1/R550 - 1/R700 | Sims & Gamon, 2002 |
| PSRI | (R680 - R500)/R750 | Merzlyak et al., 1999 |
| NDVI | (R750.66 - R704.6)/(R750.66 + R704.6) | Gitelson & Merzlyak, 1994 |
| GNDVI | (R783 - R560)/(R783 + R560) | Rozenstein et al., 2019 |
| TNDVI | ((R842 - R665)/(R842 + R665) + 0.5)^0.5 | Rozenstein et al., 2019 |
| WDVI | R842 - R665 × 0.5 | Rozenstein et al., 2019 |
| NDI45 | (R705 - R665)/(R705 + R665) | Delegido et al., 2011 |
| SAVI | (1 + L) × (R799.09 - R680.045)/(R799.09 + R680.045 + L) (L = 0.5) | Huete, 1988 |
| SAVI2 | R799.09/(R680.045+ b/a) (a = 0.969 1, b = 0.084 726) | Major et al., 1990 |
| ARVI | RB = R680.045 - r(R444.5 - R680.045) (r = 1)
ARVI = (R799.09 - RB)/(R799.09 + RB) | Kaufman & Tanre, 1992 |
| SARVI | RB = R680.045 - r(R444.5 - R680.045) (r = 1, L = 0.5)
SARVI = (1 + L)(R799.09 - RB)/(R799.09 + RB + L) | Kaufman & Tanre, 1992 |
| EVI | G(R799.09 - R680.045)/(R799.09 + C1R680.045 - C2R444.5 + L)
(G = 2.5, C1 = 6, C2 = 7.5, L = 1) | Huete et al., 1997 |
| IRECI | (R783 - R665)/(R705/R740) | Frampton et al., 2013 |
| IPVI | R842/(R842 + R665) | Rozenstein et al., 2019 |
| PSSRA | R783/R665 | Rozenstein et al., 2019 |
| RVI | R842/R665 | Rozenstein et al., 2019 |
ARI, 花青素反射指数; ARVI, 耐大气植被指数; CRI, 类胡萝卜素反射指数; DATT, DATT植被指数; EVI, 增强型植被指数; Gitelson, Gitelson植被指数; GNDVI,绿色归一化差异植被指数; IPVI, 红外植被百分比指数; IRECI, 倒红边叶绿素指数; MSI, 水分胁迫指数; NDI45, 归一化差异指数; NDII, 归一化红外指数; NDVI, 归一化植被指数; OSAVI, 优化型土壤调节植被指数; PSRI, 植物衰老反射指数; PSSRA, 特征色素简单比值指数; RVI, 比值植被指数; SARVI, 土壤大气阻抗植被指数; SAVI, 土壤调节植被指数; SR, 比值植被指数; TCARI, 转换型叶绿素吸收植被指数; TNDVI, 转化后的归一化植被指数; WDVI, 加权差分植被指数.公式中的R及右下角数字代表位于该波长处的反射值. ...
... .,
2019 | WDVI | R842 - R665 × 0.5 | Rozenstein et al., 2019 |
| NDI45 | (R705 - R665)/(R705 + R665) | Delegido et al., 2011 |
| SAVI | (1 + L) × (R799.09 - R680.045)/(R799.09 + R680.045 + L) (L = 0.5) | Huete, 1988 |
| SAVI2 | R799.09/(R680.045+ b/a) (a = 0.969 1, b = 0.084 726) | Major et al., 1990 |
| ARVI | RB = R680.045 - r(R444.5 - R680.045) (r = 1)
ARVI = (R799.09 - RB)/(R799.09 + RB) | Kaufman & Tanre, 1992 |
| SARVI | RB = R680.045 - r(R444.5 - R680.045) (r = 1, L = 0.5)
SARVI = (1 + L)(R799.09 - RB)/(R799.09 + RB + L) | Kaufman & Tanre, 1992 |
| EVI | G(R799.09 - R680.045)/(R799.09 + C1R680.045 - C2R444.5 + L)
(G = 2.5, C1 = 6, C2 = 7.5, L = 1) | Huete et al., 1997 |
| IRECI | (R783 - R665)/(R705/R740) | Frampton et al., 2013 |
| IPVI | R842/(R842 + R665) | Rozenstein et al., 2019 |
| PSSRA | R783/R665 | Rozenstein et al., 2019 |
| RVI | R842/R665 | Rozenstein et al., 2019 |
ARI, 花青素反射指数; ARVI, 耐大气植被指数; CRI, 类胡萝卜素反射指数; DATT, DATT植被指数; EVI, 增强型植被指数; Gitelson, Gitelson植被指数; GNDVI,绿色归一化差异植被指数; IPVI, 红外植被百分比指数; IRECI, 倒红边叶绿素指数; MSI, 水分胁迫指数; NDI45, 归一化差异指数; NDII, 归一化红外指数; NDVI, 归一化植被指数; OSAVI, 优化型土壤调节植被指数; PSRI, 植物衰老反射指数; PSSRA, 特征色素简单比值指数; RVI, 比值植被指数; SARVI, 土壤大气阻抗植被指数; SAVI, 土壤调节植被指数; SR, 比值植被指数; TCARI, 转换型叶绿素吸收植被指数; TNDVI, 转化后的归一化植被指数; WDVI, 加权差分植被指数.公式中的R及右下角数字代表位于该波长处的反射值. ...
... .,
2019 | NDI45 | (R705 - R665)/(R705 + R665) | Delegido et al., 2011 |
| SAVI | (1 + L) × (R799.09 - R680.045)/(R799.09 + R680.045 + L) (L = 0.5) | Huete, 1988 |
| SAVI2 | R799.09/(R680.045+ b/a) (a = 0.969 1, b = 0.084 726) | Major et al., 1990 |
| ARVI | RB = R680.045 - r(R444.5 - R680.045) (r = 1)
ARVI = (R799.09 - RB)/(R799.09 + RB) | Kaufman & Tanre, 1992 |
| SARVI | RB = R680.045 - r(R444.5 - R680.045) (r = 1, L = 0.5)
SARVI = (1 + L)(R799.09 - RB)/(R799.09 + RB + L) | Kaufman & Tanre, 1992 |
| EVI | G(R799.09 - R680.045)/(R799.09 + C1R680.045 - C2R444.5 + L)
(G = 2.5, C1 = 6, C2 = 7.5, L = 1) | Huete et al., 1997 |
| IRECI | (R783 - R665)/(R705/R740) | Frampton et al., 2013 |
| IPVI | R842/(R842 + R665) | Rozenstein et al., 2019 |
| PSSRA | R783/R665 | Rozenstein et al., 2019 |
| RVI | R842/R665 | Rozenstein et al., 2019 |
ARI, 花青素反射指数; ARVI, 耐大气植被指数; CRI, 类胡萝卜素反射指数; DATT, DATT植被指数; EVI, 增强型植被指数; Gitelson, Gitelson植被指数; GNDVI,绿色归一化差异植被指数; IPVI, 红外植被百分比指数; IRECI, 倒红边叶绿素指数; MSI, 水分胁迫指数; NDI45, 归一化差异指数; NDII, 归一化红外指数; NDVI, 归一化植被指数; OSAVI, 优化型土壤调节植被指数; PSRI, 植物衰老反射指数; PSSRA, 特征色素简单比值指数; RVI, 比值植被指数; SARVI, 土壤大气阻抗植被指数; SAVI, 土壤调节植被指数; SR, 比值植被指数; TCARI, 转换型叶绿素吸收植被指数; TNDVI, 转化后的归一化植被指数; WDVI, 加权差分植被指数.公式中的R及右下角数字代表位于该波长处的反射值. ...
... .,
2019 | PSSRA | R783/R665 | Rozenstein et al., 2019 |
| RVI | R842/R665 | Rozenstein et al., 2019 |
ARI, 花青素反射指数; ARVI, 耐大气植被指数; CRI, 类胡萝卜素反射指数; DATT, DATT植被指数; EVI, 增强型植被指数; Gitelson, Gitelson植被指数; GNDVI,绿色归一化差异植被指数; IPVI, 红外植被百分比指数; IRECI, 倒红边叶绿素指数; MSI, 水分胁迫指数; NDI45, 归一化差异指数; NDII, 归一化红外指数; NDVI, 归一化植被指数; OSAVI, 优化型土壤调节植被指数; PSRI, 植物衰老反射指数; PSSRA, 特征色素简单比值指数; RVI, 比值植被指数; SARVI, 土壤大气阻抗植被指数; SAVI, 土壤调节植被指数; SR, 比值植被指数; TCARI, 转换型叶绿素吸收植被指数; TNDVI, 转化后的归一化植被指数; WDVI, 加权差分植被指数.公式中的R及右下角数字代表位于该波长处的反射值. ...
... .,
2019 | RVI | R842/R665 | Rozenstein et al., 2019 |
ARI, 花青素反射指数; ARVI, 耐大气植被指数; CRI, 类胡萝卜素反射指数; DATT, DATT植被指数; EVI, 增强型植被指数; Gitelson, Gitelson植被指数; GNDVI,绿色归一化差异植被指数; IPVI, 红外植被百分比指数; IRECI, 倒红边叶绿素指数; MSI, 水分胁迫指数; NDI45, 归一化差异指数; NDII, 归一化红外指数; NDVI, 归一化植被指数; OSAVI, 优化型土壤调节植被指数; PSRI, 植物衰老反射指数; PSSRA, 特征色素简单比值指数; RVI, 比值植被指数; SARVI, 土壤大气阻抗植被指数; SAVI, 土壤调节植被指数; SR, 比值植被指数; TCARI, 转换型叶绿素吸收植被指数; TNDVI, 转化后的归一化植被指数; WDVI, 加权差分植被指数.公式中的R及右下角数字代表位于该波长处的反射值. ...
... .,
2019 ARI, 花青素反射指数; ARVI, 耐大气植被指数; CRI, 类胡萝卜素反射指数; DATT, DATT植被指数; EVI, 增强型植被指数; Gitelson, Gitelson植被指数; GNDVI,绿色归一化差异植被指数; IPVI, 红外植被百分比指数; IRECI, 倒红边叶绿素指数; MSI, 水分胁迫指数; NDI45, 归一化差异指数; NDII, 归一化红外指数; NDVI, 归一化植被指数; OSAVI, 优化型土壤调节植被指数; PSRI, 植物衰老反射指数; PSSRA, 特征色素简单比值指数; RVI, 比值植被指数; SARVI, 土壤大气阻抗植被指数; SAVI, 土壤调节植被指数; SR, 比值植被指数; TCARI, 转换型叶绿素吸收植被指数; TNDVI, 转化后的归一化植被指数; WDVI, 加权差分植被指数.公式中的R及右下角数字代表位于该波长处的反射值. ...
Diversity increases carbon storage and tree productivity in Spanish forests
1
2014
... 除了考虑与植物多样性的关系, 植物功能多样性也是生物多样性的重要组成部分, 它包括植物的化学、生理和形态结构的多样性, 反映了群落、景观、甚至大空间尺度内功能性状的变异性, 决定了生态系统的功能和稳定性(Tilman et al., 1997; Ruiz-Benito et al., 2014).利用卫星遥感影像和野外实测功能性状的关系建模, 反演植物功能多样性对实现全球生物多样性快速监测具有重要意义(Jetz et al., 2016).但由于计算植物功能多样性的可用区域很少且不可重复测量, 传统的计算植物功能多样性的方法不适合用于长期和大规模的监测.遥感反演功能多样性的原理是基于系统发育差异和资源限制导致的植物性状不同(Schweiger et al., 2018), 这些性状主要包括叶片氮浓度、叶片碳浓度、比叶面积、叶片干物质含量和叶面积等叶片性状, 以及株高、树冠横截面积和胸径等全株性状(Ma et al., 2019), 性状上的差异进而影响光谱反射率(Wang et al., 2018).已经有很多研究基于机载高光谱数据绘制高空间分辨率的植物功能多样性空间分布图(Asner et al., 2017; Schneider et al., 2017; Zheng et al., 2021), 但在更大的区域范围内由于获取数据难以实现且成本昂贵, 研究还较少.Sentinel-2号卫星等多光谱空间遥感的发展有利于克服高空间分辨率和监测范围的问题(Rossi et al., 2020; Hauser et al., 2021).目前相关的研究还较少且受很多因素影响, 比如野外数据和卫星影响时间不匹配, 物种的区域差异与方法的适用性等等, 这都有待进一步补充和验证, 可以考虑作为接下来的研究方向. ...
Mapping tree species diversity of a tropical montane forest by unsupervised clustering of airborne imaging spectroscopy data
1
2016
... 光谱变异假说是生物多样性直接遥感监测的主要理论基础, 即遥感图像光谱多样性与物种多样性有关.光谱多样性, 有时也被称为光学多样性(Palmer et al., 2002; Ustin & Gamon, 2010)、光谱异质性或光谱变异性(Rocchini et al., 2010), 表征光谱反射率的空间变化, 这种变化与植物多样性相关的植物光学性状的差异有关, 可以用来反映物种多样性(Gillespie et al., 2008; Nagendra & Rocchini, 2008).基于光谱变异假说的光谱多样性与物种多样性的研究已经有很多, 在温带森林(Laliberté et al., 2020), 亚热带森林(Kalacska et al., 2007), 热带森林(Asner & Martin, 2009; Féret & Asner, 2014; Schäfer et al., 2016), 草原(Oldeland et al., 2010; Wang et al., 2016, 2018; Gholizadeh et al., 2020)均有报道.常用光谱多样性指数包括变异系数(CV)(Somers et al., 2015; Wang et al., 2016), 凸包体积(CHV)(Dahlin, 2016; Gholizadeh et al., 2018), 凸包面积(CHA)(Gholizadeh et al., 2018), 光谱角度制图(SAM)(Zhang et al., 2006; Gholizadeh et al., 2018), 光谱信息散度(SID)(Chang, 2000)等. ...
Mapping functional diversity from remotely sensed morphological and physiological forest traits
1
2017
... 除了考虑与植物多样性的关系, 植物功能多样性也是生物多样性的重要组成部分, 它包括植物的化学、生理和形态结构的多样性, 反映了群落、景观、甚至大空间尺度内功能性状的变异性, 决定了生态系统的功能和稳定性(Tilman et al., 1997; Ruiz-Benito et al., 2014).利用卫星遥感影像和野外实测功能性状的关系建模, 反演植物功能多样性对实现全球生物多样性快速监测具有重要意义(Jetz et al., 2016).但由于计算植物功能多样性的可用区域很少且不可重复测量, 传统的计算植物功能多样性的方法不适合用于长期和大规模的监测.遥感反演功能多样性的原理是基于系统发育差异和资源限制导致的植物性状不同(Schweiger et al., 2018), 这些性状主要包括叶片氮浓度、叶片碳浓度、比叶面积、叶片干物质含量和叶面积等叶片性状, 以及株高、树冠横截面积和胸径等全株性状(Ma et al., 2019), 性状上的差异进而影响光谱反射率(Wang et al., 2018).已经有很多研究基于机载高光谱数据绘制高空间分辨率的植物功能多样性空间分布图(Asner et al., 2017; Schneider et al., 2017; Zheng et al., 2021), 但在更大的区域范围内由于获取数据难以实现且成本昂贵, 研究还较少.Sentinel-2号卫星等多光谱空间遥感的发展有利于克服高空间分辨率和监测范围的问题(Rossi et al., 2020; Hauser et al., 2021).目前相关的研究还较少且受很多因素影响, 比如野外数据和卫星影响时间不匹配, 物种的区域差异与方法的适用性等等, 这都有待进一步补充和验证, 可以考虑作为接下来的研究方向. ...
Plant spectral diversity integrates functional and phylogenetic components of biodiversity and predicts ecosystem function
1
2018
... 除了考虑与植物多样性的关系, 植物功能多样性也是生物多样性的重要组成部分, 它包括植物的化学、生理和形态结构的多样性, 反映了群落、景观、甚至大空间尺度内功能性状的变异性, 决定了生态系统的功能和稳定性(Tilman et al., 1997; Ruiz-Benito et al., 2014).利用卫星遥感影像和野外实测功能性状的关系建模, 反演植物功能多样性对实现全球生物多样性快速监测具有重要意义(Jetz et al., 2016).但由于计算植物功能多样性的可用区域很少且不可重复测量, 传统的计算植物功能多样性的方法不适合用于长期和大规模的监测.遥感反演功能多样性的原理是基于系统发育差异和资源限制导致的植物性状不同(Schweiger et al., 2018), 这些性状主要包括叶片氮浓度、叶片碳浓度、比叶面积、叶片干物质含量和叶面积等叶片性状, 以及株高、树冠横截面积和胸径等全株性状(Ma et al., 2019), 性状上的差异进而影响光谱反射率(Wang et al., 2018).已经有很多研究基于机载高光谱数据绘制高空间分辨率的植物功能多样性空间分布图(Asner et al., 2017; Schneider et al., 2017; Zheng et al., 2021), 但在更大的区域范围内由于获取数据难以实现且成本昂贵, 研究还较少.Sentinel-2号卫星等多光谱空间遥感的发展有利于克服高空间分辨率和监测范围的问题(Rossi et al., 2020; Hauser et al., 2021).目前相关的研究还较少且受很多因素影响, 比如野外数据和卫星影响时间不匹配, 物种的区域差异与方法的适用性等等, 这都有待进一步补充和验证, 可以考虑作为接下来的研究方向. ...
Relationships between leaf pigment content and spectral reflectance across a wide range of species, leaf structures and developmental stages
1
2002
... Formula of calculating vegetation index
Table 2 | 植被指数 Vegetation index | 计算公式 Calculate formula | 参考文献 Reference |
| TCARI | 3[(R699.19 - R668.98) - 0.2(R699.19 - R550.67)(R699.19/R668.98)] | Kim et al., 1994 |
| OSAVI | (1 + 0.16)(R750 - R705)/(R750 + R705 + 0.16) | Wu et al., 2008 |
| OSAVI2 | (1 + 0.16)(R800 - R670)/(R800 + R670 + 0.16) | Rondeaux et al., 1996 |
| DATT | (R850 - R710)/(R850 - R680) | Datt, 1999 |
| DATT2 | R850/R710 | Datt, 1999 |
| Gitelson | 1/R700 | Gitelson et al., 1999 |
| SR1 | R750/R700 | Gitelson & Merzlyak, 1997 |
| SR2 | R700/R670 | McMurtrey III et al., 1994 |
| SR3 | R730/R706 | Zarco-Tejada et al., 2003 |
| SR4 | R675/R700 | Gitelson et al., 2003 |
| MSI | R1600/R819 | Hunt & Rock, 1989 |
| NDII | (R819 - R1649)/(R819 + R1649) | Hardisky et al., 1983 |
| CRI1 | 1/R510 - 1/R550 | Gitelson et al., 2002 |
| CRI2 | 1/R510 - 1/R700 | Gitelson et al., 2002 |
| ARI | 1/R550 - 1/R700 | Sims & Gamon, 2002 |
| PSRI | (R680 - R500)/R750 | Merzlyak et al., 1999 |
| NDVI | (R750.66 - R704.6)/(R750.66 + R704.6) | Gitelson & Merzlyak, 1994 |
| GNDVI | (R783 - R560)/(R783 + R560) | Rozenstein et al., 2019 |
| TNDVI | ((R842 - R665)/(R842 + R665) + 0.5)^0.5 | Rozenstein et al., 2019 |
| WDVI | R842 - R665 × 0.5 | Rozenstein et al., 2019 |
| NDI45 | (R705 - R665)/(R705 + R665) | Delegido et al., 2011 |
| SAVI | (1 + L) × (R799.09 - R680.045)/(R799.09 + R680.045 + L) (L = 0.5) | Huete, 1988 |
| SAVI2 | R799.09/(R680.045+ b/a) (a = 0.969 1, b = 0.084 726) | Major et al., 1990 |
| ARVI | RB = R680.045 - r(R444.5 - R680.045) (r = 1)
ARVI = (R799.09 - RB)/(R799.09 + RB) | Kaufman & Tanre, 1992 |
| SARVI | RB = R680.045 - r(R444.5 - R680.045) (r = 1, L = 0.5)
SARVI = (1 + L)(R799.09 - RB)/(R799.09 + RB + L) | Kaufman & Tanre, 1992 |
| EVI | G(R799.09 - R680.045)/(R799.09 + C1R680.045 - C2R444.5 + L)
(G = 2.5, C1 = 6, C2 = 7.5, L = 1) | Huete et al., 1997 |
| IRECI | (R783 - R665)/(R705/R740) | Frampton et al., 2013 |
| IPVI | R842/(R842 + R665) | Rozenstein et al., 2019 |
| PSSRA | R783/R665 | Rozenstein et al., 2019 |
| RVI | R842/R665 | Rozenstein et al., 2019 |
ARI, 花青素反射指数; ARVI, 耐大气植被指数; CRI, 类胡萝卜素反射指数; DATT, DATT植被指数; EVI, 增强型植被指数; Gitelson, Gitelson植被指数; GNDVI,绿色归一化差异植被指数; IPVI, 红外植被百分比指数; IRECI, 倒红边叶绿素指数; MSI, 水分胁迫指数; NDI45, 归一化差异指数; NDII, 归一化红外指数; NDVI, 归一化植被指数; OSAVI, 优化型土壤调节植被指数; PSRI, 植物衰老反射指数; PSSRA, 特征色素简单比值指数; RVI, 比值植被指数; SARVI, 土壤大气阻抗植被指数; SAVI, 土壤调节植被指数; SR, 比值植被指数; TCARI, 转换型叶绿素吸收植被指数; TNDVI, 转化后的归一化植被指数; WDVI, 加权差分植被指数.公式中的R及右下角数字代表位于该波长处的反射值. ...
Mesoscale assessment of changes in tropical tree species richness across a bioclimatic gradient in Panama using airborne imaging spectroscopy
2
2015
... 光谱变异假说是生物多样性直接遥感监测的主要理论基础, 即遥感图像光谱多样性与物种多样性有关.光谱多样性, 有时也被称为光学多样性(Palmer et al., 2002; Ustin & Gamon, 2010)、光谱异质性或光谱变异性(Rocchini et al., 2010), 表征光谱反射率的空间变化, 这种变化与植物多样性相关的植物光学性状的差异有关, 可以用来反映物种多样性(Gillespie et al., 2008; Nagendra & Rocchini, 2008).基于光谱变异假说的光谱多样性与物种多样性的研究已经有很多, 在温带森林(Laliberté et al., 2020), 亚热带森林(Kalacska et al., 2007), 热带森林(Asner & Martin, 2009; Féret & Asner, 2014; Schäfer et al., 2016), 草原(Oldeland et al., 2010; Wang et al., 2016, 2018; Gholizadeh et al., 2020)均有报道.常用光谱多样性指数包括变异系数(CV)(Somers et al., 2015; Wang et al., 2016), 凸包体积(CHV)(Dahlin, 2016; Gholizadeh et al., 2018), 凸包面积(CHA)(Gholizadeh et al., 2018), 光谱角度制图(SAM)(Zhang et al., 2006; Gholizadeh et al., 2018), 光谱信息散度(SID)(Chang, 2000)等. ...
... 本研究基于像元光谱反射率计算了变异系数和凸包面积两种光谱多样性指数, 结果发现两种指数均能很好地估算Shannon-Wiener多样性指数(p < 0.01).这一结果与之前的研究(Lucas & Carter, 2008; Somers et al., 2015; Gholizadeh et al., 2018)一致, 表明CV和CHA是反映α多样性的有用指标.基于波段选择的凸包面积最早应用于草地生物多样性监测(Gholizadeh et al., 2018), 但在森林中还没有进一步的应用.此外, 本研究发现基于影像像元计算的CHA对实测的Shannon-Wiener多样性指数估算精度最高, 进一步证实了Gholizadeh的研究结论, 该研究发现随着分辨率降低, CHA优于包括CV在内的所有其他指标.一般来说, 空间分辨率的降低会产生混合像元, 进一步导致光谱异质性(Rocchini, 2007; Xi et al., 2019).在所用影像都为中分辨率的情况下, CV的计算是用每个波段所有像元的变异系数之和除以波段数, 而CHA是先求出所有波段的变异再除以像元数.前者是整合所有波段值的空间变异, 可能反映所有物种或群落波谱变异的平均值, 而后者是每个波段空间变异的平均值, 可能反映所有物种或群落波谱变异的空间异质性, 更能体现物种或群落间的多样性. ...
The influence of functional diversity and composition on ecosystem processes
1
1997
... 除了考虑与植物多样性的关系, 植物功能多样性也是生物多样性的重要组成部分, 它包括植物的化学、生理和形态结构的多样性, 反映了群落、景观、甚至大空间尺度内功能性状的变异性, 决定了生态系统的功能和稳定性(Tilman et al., 1997; Ruiz-Benito et al., 2014).利用卫星遥感影像和野外实测功能性状的关系建模, 反演植物功能多样性对实现全球生物多样性快速监测具有重要意义(Jetz et al., 2016).但由于计算植物功能多样性的可用区域很少且不可重复测量, 传统的计算植物功能多样性的方法不适合用于长期和大规模的监测.遥感反演功能多样性的原理是基于系统发育差异和资源限制导致的植物性状不同(Schweiger et al., 2018), 这些性状主要包括叶片氮浓度、叶片碳浓度、比叶面积、叶片干物质含量和叶面积等叶片性状, 以及株高、树冠横截面积和胸径等全株性状(Ma et al., 2019), 性状上的差异进而影响光谱反射率(Wang et al., 2018).已经有很多研究基于机载高光谱数据绘制高空间分辨率的植物功能多样性空间分布图(Asner et al., 2017; Schneider et al., 2017; Zheng et al., 2021), 但在更大的区域范围内由于获取数据难以实现且成本昂贵, 研究还较少.Sentinel-2号卫星等多光谱空间遥感的发展有利于克服高空间分辨率和监测范围的问题(Rossi et al., 2020; Hauser et al., 2021).目前相关的研究还较少且受很多因素影响, 比如野外数据和卫星影响时间不匹配, 物种的区域差异与方法的适用性等等, 这都有待进一步补充和验证, 可以考虑作为接下来的研究方向. ...
Estimating tree species diversity from space in an alpine conifer forest: the Rao?s Q diversity index meets the spectral variation hypothesis
1
2019
... 随机特征的选取是基于影像的光谱信息以及衍生的植被指数.本研究采用了前面计算的两种光谱多样性指数、Sentinel-2A影像的12个波段信息和30个与森林多样性相关的植被指数作为特征波段, 相关植被指数的计算公式如表2所示.计算样地内的光谱变异系数, 以作为森林植被多样性的度量(Torresani et al., 2019; Mallinis et al., 2020). ...
Sensing biodiversity
1
2014
... 近年来, 随着遥感技术的迅速发展, 使得在大尺度、多时空上评估生物多样性成为可能.遥感数据具有覆盖范围广、可持续性强以及可重复的特点(Nagendra, 2001; Duro et al., 2007), 有助于迅速地揭示大面积生物多样性丢失状况, 对大尺度、长时间序列的生物多样性评估至关重要(Turner, 2014).生物多样性遥感监测方法可总结为直接法和间接法两种(Turner et al., 2003).直接法是利用高空间分辨率和高光谱分辨率的卫星传感器直接识别物种、种群或群落.Ke等(2010)利用QuickBird高分辨率多光谱数据和激光雷达数据, 通过图像分割和基于目标的分类方法对森林物种进行识别, 发现两种数据均有较好的结果, 但是结合两种数据源能获取更高的精度, Kappa系数最高可达91.6%.Cross等(2019)利用WorldView-3卫星影像对热带森林里的6个森林物种进行了分类, 分类准确率高达85.37%.间接法是通过遥感数据反演与生物多样性密切相关的指标或参数, 再与野外实测数据构建统计模型以反演生物多样性.植被指数、植物生化组分和植被结构等都可以作为植物多样性研究的相关指标.归一化植被指数(NDVI)经常被用来指示区域的物种多样性(Fairbanks & Mcgwire, 2004; Feeley et al., 2005), 而增强型植被指数(EVI)则可以更好地在植被茂密的地区代替NDVI (Waring et al., 2006).此外, 与光谱变异相关的叶片叶绿素、氮含量、色素、水分等生化组分的变化也可以用来估算森林物种多样性(Carlson et al., 2007). ...
Remote sensing for biodiversity science and conservation
1
2003
... 近年来, 随着遥感技术的迅速发展, 使得在大尺度、多时空上评估生物多样性成为可能.遥感数据具有覆盖范围广、可持续性强以及可重复的特点(Nagendra, 2001; Duro et al., 2007), 有助于迅速地揭示大面积生物多样性丢失状况, 对大尺度、长时间序列的生物多样性评估至关重要(Turner, 2014).生物多样性遥感监测方法可总结为直接法和间接法两种(Turner et al., 2003).直接法是利用高空间分辨率和高光谱分辨率的卫星传感器直接识别物种、种群或群落.Ke等(2010)利用QuickBird高分辨率多光谱数据和激光雷达数据, 通过图像分割和基于目标的分类方法对森林物种进行识别, 发现两种数据均有较好的结果, 但是结合两种数据源能获取更高的精度, Kappa系数最高可达91.6%.Cross等(2019)利用WorldView-3卫星影像对热带森林里的6个森林物种进行了分类, 分类准确率高达85.37%.间接法是通过遥感数据反演与生物多样性密切相关的指标或参数, 再与野外实测数据构建统计模型以反演生物多样性.植被指数、植物生化组分和植被结构等都可以作为植物多样性研究的相关指标.归一化植被指数(NDVI)经常被用来指示区域的物种多样性(Fairbanks & Mcgwire, 2004; Feeley et al., 2005), 而增强型植被指数(EVI)则可以更好地在植被茂密的地区代替NDVI (Waring et al., 2006).此外, 与光谱变异相关的叶片叶绿素、氮含量、色素、水分等生化组分的变化也可以用来估算森林物种多样性(Carlson et al., 2007). ...
Remote sensing of plant functional types
2
2010
... 光谱变异假说是生物多样性直接遥感监测的主要理论基础, 即遥感图像光谱多样性与物种多样性有关.光谱多样性, 有时也被称为光学多样性(Palmer et al., 2002; Ustin & Gamon, 2010)、光谱异质性或光谱变异性(Rocchini et al., 2010), 表征光谱反射率的空间变化, 这种变化与植物多样性相关的植物光学性状的差异有关, 可以用来反映物种多样性(Gillespie et al., 2008; Nagendra & Rocchini, 2008).基于光谱变异假说的光谱多样性与物种多样性的研究已经有很多, 在温带森林(Laliberté et al., 2020), 亚热带森林(Kalacska et al., 2007), 热带森林(Asner & Martin, 2009; Féret & Asner, 2014; Schäfer et al., 2016), 草原(Oldeland et al., 2010; Wang et al., 2016, 2018; Gholizadeh et al., 2020)均有报道.常用光谱多样性指数包括变异系数(CV)(Somers et al., 2015; Wang et al., 2016), 凸包体积(CHV)(Dahlin, 2016; Gholizadeh et al., 2018), 凸包面积(CHA)(Gholizadeh et al., 2018), 光谱角度制图(SAM)(Zhang et al., 2006; Gholizadeh et al., 2018), 光谱信息散度(SID)(Chang, 2000)等. ...
... 本研究利用biodivMapR软件包, 基于Sentinel- 2A卫星影像的多光谱信息, 根据每个像元反射率对应的光学特征区分物种(Ustin & Gamon, 2010).首先需要确定聚类窗口大小, 以窗口内能够计算多样性所需要的像元最少为原则, 综合考虑影像分辨率和现场调查的样地大小等因素, 通过测试3 × 3、5 × 5、7 × 7以及9 × 9等不同移动窗口(分辨率为10 m), 最终选取5 × 5的移动窗口为计算植物多样性最好的聚类窗口; 然后, 将预处理后的影像进行主成分分析, 选择2-6个能够突出植物属性、噪声较少的主成分, 再利用K均值聚类绘制波谱物种图, 最后基于每个光谱物种包含的像元数, 计算多样性指数. ...
Remote sensing of terrestrial plant biodiversity
1
2019
... 此外, 在所测试的两种方法中, 随机森林回归反演植物多样性的方法精度略高, 但该方法不能对超越训练数据集的范围进行估算, 而且它是一种黑箱的方法, 其内部的运行也无法控制.此外, 由于森林的复杂性和影像分辨率的限制, 目前的研究只是基于影像的光谱特征反演多样性, 而忽略了其他因素如叶片化学成分、植被结构参数、林下灌木或草本光谱的影响以及土壤反射率等的影响(Wang & Gamon, 2019), 方法上还有一定的局限性.如果要在全国范围内推广, 在后续研究中还需要考虑环境数据, 如地形、海拔、降水等环境因素的影响, 以进一步验证和完善方法, 为开展全国的森林健康评估提供较为全面可行的方法与参考. ...
Integrated analysis of productivity and biodiversity in a southern Alberta prairie
3
2016
... 光谱变异假说是生物多样性直接遥感监测的主要理论基础, 即遥感图像光谱多样性与物种多样性有关.光谱多样性, 有时也被称为光学多样性(Palmer et al., 2002; Ustin & Gamon, 2010)、光谱异质性或光谱变异性(Rocchini et al., 2010), 表征光谱反射率的空间变化, 这种变化与植物多样性相关的植物光学性状的差异有关, 可以用来反映物种多样性(Gillespie et al., 2008; Nagendra & Rocchini, 2008).基于光谱变异假说的光谱多样性与物种多样性的研究已经有很多, 在温带森林(Laliberté et al., 2020), 亚热带森林(Kalacska et al., 2007), 热带森林(Asner & Martin, 2009; Féret & Asner, 2014; Schäfer et al., 2016), 草原(Oldeland et al., 2010; Wang et al., 2016, 2018; Gholizadeh et al., 2020)均有报道.常用光谱多样性指数包括变异系数(CV)(Somers et al., 2015; Wang et al., 2016), 凸包体积(CHV)(Dahlin, 2016; Gholizadeh et al., 2018), 凸包面积(CHA)(Gholizadeh et al., 2018), 光谱角度制图(SAM)(Zhang et al., 2006; Gholizadeh et al., 2018), 光谱信息散度(SID)(Chang, 2000)等. ...
... ., 2016), 凸包体积(CHV)(Dahlin, 2016; Gholizadeh et al., 2018), 凸包面积(CHA)(Gholizadeh et al., 2018), 光谱角度制图(SAM)(Zhang et al., 2006; Gholizadeh et al., 2018), 光谱信息散度(SID)(Chang, 2000)等. ...
... 光谱变异系数是α多样性的一种常用度量(Wang et al., 2016).根据光谱变异假说, CV随着光谱变异性的增加而增加.本研究基于重采样后的Sentinel-2A卫星数据的12个波段计算了5 × 5移动窗口的变异系数.变异系数的计算公式如下: ...
Influence of species richness, evenness, and composition on optical diversity: a simulation study
3
2018
... 光谱变异假说是生物多样性直接遥感监测的主要理论基础, 即遥感图像光谱多样性与物种多样性有关.光谱多样性, 有时也被称为光学多样性(Palmer et al., 2002; Ustin & Gamon, 2010)、光谱异质性或光谱变异性(Rocchini et al., 2010), 表征光谱反射率的空间变化, 这种变化与植物多样性相关的植物光学性状的差异有关, 可以用来反映物种多样性(Gillespie et al., 2008; Nagendra & Rocchini, 2008).基于光谱变异假说的光谱多样性与物种多样性的研究已经有很多, 在温带森林(Laliberté et al., 2020), 亚热带森林(Kalacska et al., 2007), 热带森林(Asner & Martin, 2009; Féret & Asner, 2014; Schäfer et al., 2016), 草原(Oldeland et al., 2010; Wang et al., 2016, 2018; Gholizadeh et al., 2020)均有报道.常用光谱多样性指数包括变异系数(CV)(Somers et al., 2015; Wang et al., 2016), 凸包体积(CHV)(Dahlin, 2016; Gholizadeh et al., 2018), 凸包面积(CHA)(Gholizadeh et al., 2018), 光谱角度制图(SAM)(Zhang et al., 2006; Gholizadeh et al., 2018), 光谱信息散度(SID)(Chang, 2000)等. ...
... 除了基于光谱多样性方法, 本研究也采用了机器学习的方法对森林植物多样性进行了估算, 结果发现基于所选特征指数的随机森林回归对Shannon- Wiener多样性指数有较好的反演结果(R2 = 0.79, p < 0.01), 而对其他多样性指数的估算效果较低.随机森林估算结果的准确性主要受两个方面因素的影响.一方面是受影像分辨率的影响, 影像分辨率不同对研究结果会产生一定影响.在草地生态系统中的大规模模拟研究表明, α多样性的估算精度随着空间分辨率的降低而下降, 最佳的估算精度是像元 大小与单个植株大小相接近时的精度(Wang et al., 2018).这是因为遥感反映的是面上的信息, 利用遥感数据计算的不是物种间的光谱变异, 而是用像元代表的群落间的光谱变异间接指示物种间的变异,其中存在一定的误差, 而将分辨率提升到单木尺度会提高估算精度.另一方面受输入特征变量的影响, 本研究在44个输入变量中通过十折交叉验证对变量进行了筛选, 最后挑选了使估算结果最好的6个特征变量, 去除了变量间共线性和冗余信息的干扰.在变量挑选时发现输入的两种光谱多样性指数的重要性排序明显高于其余的特征变量, 说明这两种指数可以作为随机森林估算植物多样性的重要指标, 间接证明了前面直接利用两种指标进行植物多样性估算的可行性和合理性.但是, 重要性排序中的CV的重要性程度略高于CHA, 这可能是因为CHA与其他植被指数间存在一定相关性, 会对重要性结果产生一定影响.此外, 在森林生态系统类型中, 森林的空间分布和结构参数也会影响估算结果(Marceau et al., 1994; Gholizadeh et al., 2019), 即使采用相同分辨率的影像, 在不同地区或不同森林类型中结果可能存在一定差异(Mallinis et al., 2020; Gyamfi-Ampadu et al., 2021). ...
... 除了考虑与植物多样性的关系, 植物功能多样性也是生物多样性的重要组成部分, 它包括植物的化学、生理和形态结构的多样性, 反映了群落、景观、甚至大空间尺度内功能性状的变异性, 决定了生态系统的功能和稳定性(Tilman et al., 1997; Ruiz-Benito et al., 2014).利用卫星遥感影像和野外实测功能性状的关系建模, 反演植物功能多样性对实现全球生物多样性快速监测具有重要意义(Jetz et al., 2016).但由于计算植物功能多样性的可用区域很少且不可重复测量, 传统的计算植物功能多样性的方法不适合用于长期和大规模的监测.遥感反演功能多样性的原理是基于系统发育差异和资源限制导致的植物性状不同(Schweiger et al., 2018), 这些性状主要包括叶片氮浓度、叶片碳浓度、比叶面积、叶片干物质含量和叶面积等叶片性状, 以及株高、树冠横截面积和胸径等全株性状(Ma et al., 2019), 性状上的差异进而影响光谱反射率(Wang et al., 2018).已经有很多研究基于机载高光谱数据绘制高空间分辨率的植物功能多样性空间分布图(Asner et al., 2017; Schneider et al., 2017; Zheng et al., 2021), 但在更大的区域范围内由于获取数据难以实现且成本昂贵, 研究还较少.Sentinel-2号卫星等多光谱空间遥感的发展有利于克服高空间分辨率和监测范围的问题(Rossi et al., 2020; Hauser et al., 2021).目前相关的研究还较少且受很多因素影响, 比如野外数据和卫星影响时间不匹配, 物种的区域差异与方法的适用性等等, 这都有待进一步补充和验证, 可以考虑作为接下来的研究方向. ...
MODIS enhanced vegetation index predicts tree species richness across forested ecoregions in the contiguous USA.
1
2006
... 近年来, 随着遥感技术的迅速发展, 使得在大尺度、多时空上评估生物多样性成为可能.遥感数据具有覆盖范围广、可持续性强以及可重复的特点(Nagendra, 2001; Duro et al., 2007), 有助于迅速地揭示大面积生物多样性丢失状况, 对大尺度、长时间序列的生物多样性评估至关重要(Turner, 2014).生物多样性遥感监测方法可总结为直接法和间接法两种(Turner et al., 2003).直接法是利用高空间分辨率和高光谱分辨率的卫星传感器直接识别物种、种群或群落.Ke等(2010)利用QuickBird高分辨率多光谱数据和激光雷达数据, 通过图像分割和基于目标的分类方法对森林物种进行识别, 发现两种数据均有较好的结果, 但是结合两种数据源能获取更高的精度, Kappa系数最高可达91.6%.Cross等(2019)利用WorldView-3卫星影像对热带森林里的6个森林物种进行了分类, 分类准确率高达85.37%.间接法是通过遥感数据反演与生物多样性密切相关的指标或参数, 再与野外实测数据构建统计模型以反演生物多样性.植被指数、植物生化组分和植被结构等都可以作为植物多样性研究的相关指标.归一化植被指数(NDVI)经常被用来指示区域的物种多样性(Fairbanks & Mcgwire, 2004; Feeley et al., 2005), 而增强型植被指数(EVI)则可以更好地在植被茂密的地区代替NDVI (Waring et al., 2006).此外, 与光谱变异相关的叶片叶绿素、氮含量、色素、水分等生化组分的变化也可以用来估算森林物种多样性(Carlson et al., 2007). ...
Estimating chlorophyll content from hyperspectral vegetation indices: modeling and validation
1
2008
... Formula of calculating vegetation index
Table 2 | 植被指数 Vegetation index | 计算公式 Calculate formula | 参考文献 Reference |
| TCARI | 3[(R699.19 - R668.98) - 0.2(R699.19 - R550.67)(R699.19/R668.98)] | Kim et al., 1994 |
| OSAVI | (1 + 0.16)(R750 - R705)/(R750 + R705 + 0.16) | Wu et al., 2008 |
| OSAVI2 | (1 + 0.16)(R800 - R670)/(R800 + R670 + 0.16) | Rondeaux et al., 1996 |
| DATT | (R850 - R710)/(R850 - R680) | Datt, 1999 |
| DATT2 | R850/R710 | Datt, 1999 |
| Gitelson | 1/R700 | Gitelson et al., 1999 |
| SR1 | R750/R700 | Gitelson & Merzlyak, 1997 |
| SR2 | R700/R670 | McMurtrey III et al., 1994 |
| SR3 | R730/R706 | Zarco-Tejada et al., 2003 |
| SR4 | R675/R700 | Gitelson et al., 2003 |
| MSI | R1600/R819 | Hunt & Rock, 1989 |
| NDII | (R819 - R1649)/(R819 + R1649) | Hardisky et al., 1983 |
| CRI1 | 1/R510 - 1/R550 | Gitelson et al., 2002 |
| CRI2 | 1/R510 - 1/R700 | Gitelson et al., 2002 |
| ARI | 1/R550 - 1/R700 | Sims & Gamon, 2002 |
| PSRI | (R680 - R500)/R750 | Merzlyak et al., 1999 |
| NDVI | (R750.66 - R704.6)/(R750.66 + R704.6) | Gitelson & Merzlyak, 1994 |
| GNDVI | (R783 - R560)/(R783 + R560) | Rozenstein et al., 2019 |
| TNDVI | ((R842 - R665)/(R842 + R665) + 0.5)^0.5 | Rozenstein et al., 2019 |
| WDVI | R842 - R665 × 0.5 | Rozenstein et al., 2019 |
| NDI45 | (R705 - R665)/(R705 + R665) | Delegido et al., 2011 |
| SAVI | (1 + L) × (R799.09 - R680.045)/(R799.09 + R680.045 + L) (L = 0.5) | Huete, 1988 |
| SAVI2 | R799.09/(R680.045+ b/a) (a = 0.969 1, b = 0.084 726) | Major et al., 1990 |
| ARVI | RB = R680.045 - r(R444.5 - R680.045) (r = 1)
ARVI = (R799.09 - RB)/(R799.09 + RB) | Kaufman & Tanre, 1992 |
| SARVI | RB = R680.045 - r(R444.5 - R680.045) (r = 1, L = 0.5)
SARVI = (1 + L)(R799.09 - RB)/(R799.09 + RB + L) | Kaufman & Tanre, 1992 |
| EVI | G(R799.09 - R680.045)/(R799.09 + C1R680.045 - C2R444.5 + L)
(G = 2.5, C1 = 6, C2 = 7.5, L = 1) | Huete et al., 1997 |
| IRECI | (R783 - R665)/(R705/R740) | Frampton et al., 2013 |
| IPVI | R842/(R842 + R665) | Rozenstein et al., 2019 |
| PSSRA | R783/R665 | Rozenstein et al., 2019 |
| RVI | R842/R665 | Rozenstein et al., 2019 |
ARI, 花青素反射指数; ARVI, 耐大气植被指数; CRI, 类胡萝卜素反射指数; DATT, DATT植被指数; EVI, 增强型植被指数; Gitelson, Gitelson植被指数; GNDVI,绿色归一化差异植被指数; IPVI, 红外植被百分比指数; IRECI, 倒红边叶绿素指数; MSI, 水分胁迫指数; NDI45, 归一化差异指数; NDII, 归一化红外指数; NDVI, 归一化植被指数; OSAVI, 优化型土壤调节植被指数; PSRI, 植物衰老反射指数; PSSRA, 特征色素简单比值指数; RVI, 比值植被指数; SARVI, 土壤大气阻抗植被指数; SAVI, 土壤调节植被指数; SR, 比值植被指数; TCARI, 转换型叶绿素吸收植被指数; TNDVI, 转化后的归一化植被指数; WDVI, 加权差分植被指数.公式中的R及右下角数字代表位于该波长处的反射值. ...
Mapping tree species composition using OHS-1 hyperspectral data and deep learning algorithms in Changbai Mountains, northeast China
1
2019
... 本研究基于像元光谱反射率计算了变异系数和凸包面积两种光谱多样性指数, 结果发现两种指数均能很好地估算Shannon-Wiener多样性指数(p < 0.01).这一结果与之前的研究(Lucas & Carter, 2008; Somers et al., 2015; Gholizadeh et al., 2018)一致, 表明CV和CHA是反映α多样性的有用指标.基于波段选择的凸包面积最早应用于草地生物多样性监测(Gholizadeh et al., 2018), 但在森林中还没有进一步的应用.此外, 本研究发现基于影像像元计算的CHA对实测的Shannon-Wiener多样性指数估算精度最高, 进一步证实了Gholizadeh的研究结论, 该研究发现随着分辨率降低, CHA优于包括CV在内的所有其他指标.一般来说, 空间分辨率的降低会产生混合像元, 进一步导致光谱异质性(Rocchini, 2007; Xi et al., 2019).在所用影像都为中分辨率的情况下, CV的计算是用每个波段所有像元的变异系数之和除以波段数, 而CHA是先求出所有波段的变异再除以像元数.前者是整合所有波段值的空间变异, 可能反映所有物种或群落波谱变异的平均值, 而后者是每个波段空间变异的平均值, 可能反映所有物种或群落波谱变异的空间异质性, 更能体现物种或群落间的多样性. ...
The effectiveness of the zoning of China?s protected areas
1
2016
... 自然保护区可分为核心区、缓冲区和实验区3个功能区.核心区是指保护区内未经或很少经过人为干扰的区域, 保护效果最好, 在核心区外围可划分出一定面积的允许从事科研活动的缓冲区, 在缓冲区周围的为实验区, 为人类活动和规划发展的区域(Ma et al., 2009; Xu et al., 2016).合理的功能区划可以在促进生物多样性保护的同时为当地的经济文化发展作出贡献, 对整个自然保护区的长远发展有重要意义.本研究所选保护区的功能区划概况如图1所示. ...
利用聚类算法监测森林乔木物种多样性
2
2020
... 基于聚类方法的估算结果略低于基于像元光谱多样性方法, 这可能是受影像分辨率的限制.影像的分辨率对估算生物多样性有直接的影响, 分类的精度主要依赖于种间的光谱变异性(Zhang et al., 2006).现有学者利用无人机和激光雷达数据, 将分辨率提高到单木水平, 通过单木分割并结合了植物叶片的生化组分以及结构参数等特征, 大大提高了分类精度(董文雪等, 2018; Zhao et al., 2018; 衣海燕等, 2020).在预测试的时候本研究也尝试其他聚类方法, 自定义模糊C均值聚类可以根据聚类有效性函数自动获取聚类数目, 解决了在物种数量未知时的初始值选择的问题(Zhao et al., 2018; 衣海燕等, 2020), 可以较好地解决遥感信息的不确定性及多解性.但与前人的研究结果相比, 本研究使用该方法得到的结果精度并不高, 这也主要是受空间分辨率的限制, 不能从单木尺度进行聚类. ...
... ; 衣海燕等, 2020), 可以较好地解决遥感信息的不确定性及多解性.但与前人的研究结果相比, 本研究使用该方法得到的结果精度并不高, 这也主要是受空间分辨率的限制, 不能从单木尺度进行聚类. ...
Steady-state chlorophyll a fluorescence detection from canopy derivative reflectance and double-peak red-edge effects
1
2003
... Formula of calculating vegetation index
Table 2 | 植被指数 Vegetation index | 计算公式 Calculate formula | 参考文献 Reference |
| TCARI | 3[(R699.19 - R668.98) - 0.2(R699.19 - R550.67)(R699.19/R668.98)] | Kim et al., 1994 |
| OSAVI | (1 + 0.16)(R750 - R705)/(R750 + R705 + 0.16) | Wu et al., 2008 |
| OSAVI2 | (1 + 0.16)(R800 - R670)/(R800 + R670 + 0.16) | Rondeaux et al., 1996 |
| DATT | (R850 - R710)/(R850 - R680) | Datt, 1999 |
| DATT2 | R850/R710 | Datt, 1999 |
| Gitelson | 1/R700 | Gitelson et al., 1999 |
| SR1 | R750/R700 | Gitelson & Merzlyak, 1997 |
| SR2 | R700/R670 | McMurtrey III et al., 1994 |
| SR3 | R730/R706 | Zarco-Tejada et al., 2003 |
| SR4 | R675/R700 | Gitelson et al., 2003 |
| MSI | R1600/R819 | Hunt & Rock, 1989 |
| NDII | (R819 - R1649)/(R819 + R1649) | Hardisky et al., 1983 |
| CRI1 | 1/R510 - 1/R550 | Gitelson et al., 2002 |
| CRI2 | 1/R510 - 1/R700 | Gitelson et al., 2002 |
| ARI | 1/R550 - 1/R700 | Sims & Gamon, 2002 |
| PSRI | (R680 - R500)/R750 | Merzlyak et al., 1999 |
| NDVI | (R750.66 - R704.6)/(R750.66 + R704.6) | Gitelson & Merzlyak, 1994 |
| GNDVI | (R783 - R560)/(R783 + R560) | Rozenstein et al., 2019 |
| TNDVI | ((R842 - R665)/(R842 + R665) + 0.5)^0.5 | Rozenstein et al., 2019 |
| WDVI | R842 - R665 × 0.5 | Rozenstein et al., 2019 |
| NDI45 | (R705 - R665)/(R705 + R665) | Delegido et al., 2011 |
| SAVI | (1 + L) × (R799.09 - R680.045)/(R799.09 + R680.045 + L) (L = 0.5) | Huete, 1988 |
| SAVI2 | R799.09/(R680.045+ b/a) (a = 0.969 1, b = 0.084 726) | Major et al., 1990 |
| ARVI | RB = R680.045 - r(R444.5 - R680.045) (r = 1)
ARVI = (R799.09 - RB)/(R799.09 + RB) | Kaufman & Tanre, 1992 |
| SARVI | RB = R680.045 - r(R444.5 - R680.045) (r = 1, L = 0.5)
SARVI = (1 + L)(R799.09 - RB)/(R799.09 + RB + L) | Kaufman & Tanre, 1992 |
| EVI | G(R799.09 - R680.045)/(R799.09 + C1R680.045 - C2R444.5 + L)
(G = 2.5, C1 = 6, C2 = 7.5, L = 1) | Huete et al., 1997 |
| IRECI | (R783 - R665)/(R705/R740) | Frampton et al., 2013 |
| IPVI | R842/(R842 + R665) | Rozenstein et al., 2019 |
| PSSRA | R783/R665 | Rozenstein et al., 2019 |
| RVI | R842/R665 | Rozenstein et al., 2019 |
ARI, 花青素反射指数; ARVI, 耐大气植被指数; CRI, 类胡萝卜素反射指数; DATT, DATT植被指数; EVI, 增强型植被指数; Gitelson, Gitelson植被指数; GNDVI,绿色归一化差异植被指数; IPVI, 红外植被百分比指数; IRECI, 倒红边叶绿素指数; MSI, 水分胁迫指数; NDI45, 归一化差异指数; NDII, 归一化红外指数; NDVI, 归一化植被指数; OSAVI, 优化型土壤调节植被指数; PSRI, 植物衰老反射指数; PSSRA, 特征色素简单比值指数; RVI, 比值植被指数; SARVI, 土壤大气阻抗植被指数; SAVI, 土壤调节植被指数; SR, 比值植被指数; TCARI, 转换型叶绿素吸收植被指数; TNDVI, 转化后的归一化植被指数; WDVI, 加权差分植被指数.公式中的R及右下角数字代表位于该波长处的反射值. ...
Intra- and inter-class spectral variability of tropical tree species at La Selva, Costa Rica: implications for species identification using HYDICE imagery
2
2006
... 光谱变异假说是生物多样性直接遥感监测的主要理论基础, 即遥感图像光谱多样性与物种多样性有关.光谱多样性, 有时也被称为光学多样性(Palmer et al., 2002; Ustin & Gamon, 2010)、光谱异质性或光谱变异性(Rocchini et al., 2010), 表征光谱反射率的空间变化, 这种变化与植物多样性相关的植物光学性状的差异有关, 可以用来反映物种多样性(Gillespie et al., 2008; Nagendra & Rocchini, 2008).基于光谱变异假说的光谱多样性与物种多样性的研究已经有很多, 在温带森林(Laliberté et al., 2020), 亚热带森林(Kalacska et al., 2007), 热带森林(Asner & Martin, 2009; Féret & Asner, 2014; Schäfer et al., 2016), 草原(Oldeland et al., 2010; Wang et al., 2016, 2018; Gholizadeh et al., 2020)均有报道.常用光谱多样性指数包括变异系数(CV)(Somers et al., 2015; Wang et al., 2016), 凸包体积(CHV)(Dahlin, 2016; Gholizadeh et al., 2018), 凸包面积(CHA)(Gholizadeh et al., 2018), 光谱角度制图(SAM)(Zhang et al., 2006; Gholizadeh et al., 2018), 光谱信息散度(SID)(Chang, 2000)等. ...
... 基于聚类方法的估算结果略低于基于像元光谱多样性方法, 这可能是受影像分辨率的限制.影像的分辨率对估算生物多样性有直接的影响, 分类的精度主要依赖于种间的光谱变异性(Zhang et al., 2006).现有学者利用无人机和激光雷达数据, 将分辨率提高到单木水平, 通过单木分割并结合了植物叶片的生化组分以及结构参数等特征, 大大提高了分类精度(董文雪等, 2018; Zhao et al., 2018; 衣海燕等, 2020).在预测试的时候本研究也尝试其他聚类方法, 自定义模糊C均值聚类可以根据聚类有效性函数自动获取聚类数目, 解决了在物种数量未知时的初始值选择的问题(Zhao et al., 2018; 衣海燕等, 2020), 可以较好地解决遥感信息的不确定性及多解性.但与前人的研究结果相比, 本研究使用该方法得到的结果精度并不高, 这也主要是受空间分辨率的限制, 不能从单木尺度进行聚类. ...
Forest species diversity mapping using airborne LiDAR and hyperspectral data in a subtropical forest in China
3
2018
... 然而, 由于物种内的光谱变异会混淆物种间的光谱多样性, 进一步影响植物多样性的预测精度.聚类分析作为一种非监督分类绘制植物多样性图的有效方法, 可以基于聚类结果进一步计算光谱异质性, 能够在一定程度上减少物种内光谱变异(Medina et al., 2013; Féret & de Boissieu, 2020).目前使用非监督分类方法的森林植物多样性研究还较少.Féret和de Boissieu (2020)基于Sentinel-2光谱影像, 利用K均值聚类生成光谱物种图, 再以此绘制了亚马孙某片森林的α和β多样性.也有研究基于分辨率更高的高光谱影像, 通过不同聚类方法反演植物多样性.Medina等(2013)基于AISA机载高光谱数据, 利用光谱方差估算物种丰富度, 发现基于层次聚类得到的Shannon-Wiener多样性指数与野外数据之间的相关性是可变的, 甚至在某些情况下是负的, 但在聚类后进行光谱解混可以显著改善.Zhao等(2018)利用机载高光谱和激光雷达数据对神农架自然保护区森林冠层的单木进行分割, 利用自适应模糊C均值聚类方法, 估算了该区域的树种丰富度和Shannon-Wiener多样性指数(R2 = 0.83, 均方根误差(RMSE) = 0.25). ...
... 基于聚类方法的估算结果略低于基于像元光谱多样性方法, 这可能是受影像分辨率的限制.影像的分辨率对估算生物多样性有直接的影响, 分类的精度主要依赖于种间的光谱变异性(Zhang et al., 2006).现有学者利用无人机和激光雷达数据, 将分辨率提高到单木水平, 通过单木分割并结合了植物叶片的生化组分以及结构参数等特征, 大大提高了分类精度(董文雪等, 2018; Zhao et al., 2018; 衣海燕等, 2020).在预测试的时候本研究也尝试其他聚类方法, 自定义模糊C均值聚类可以根据聚类有效性函数自动获取聚类数目, 解决了在物种数量未知时的初始值选择的问题(Zhao et al., 2018; 衣海燕等, 2020), 可以较好地解决遥感信息的不确定性及多解性.但与前人的研究结果相比, 本研究使用该方法得到的结果精度并不高, 这也主要是受空间分辨率的限制, 不能从单木尺度进行聚类. ...
... ., 2018; 衣海燕等, 2020), 可以较好地解决遥感信息的不确定性及多解性.但与前人的研究结果相比, 本研究使用该方法得到的结果精度并不高, 这也主要是受空间分辨率的限制, 不能从单木尺度进行聚类. ...
Mapping functional diversity using individual tree-based morphological and physiological traits in a subtropical forest
1
2021
... 除了考虑与植物多样性的关系, 植物功能多样性也是生物多样性的重要组成部分, 它包括植物的化学、生理和形态结构的多样性, 反映了群落、景观、甚至大空间尺度内功能性状的变异性, 决定了生态系统的功能和稳定性(Tilman et al., 1997; Ruiz-Benito et al., 2014).利用卫星遥感影像和野外实测功能性状的关系建模, 反演植物功能多样性对实现全球生物多样性快速监测具有重要意义(Jetz et al., 2016).但由于计算植物功能多样性的可用区域很少且不可重复测量, 传统的计算植物功能多样性的方法不适合用于长期和大规模的监测.遥感反演功能多样性的原理是基于系统发育差异和资源限制导致的植物性状不同(Schweiger et al., 2018), 这些性状主要包括叶片氮浓度、叶片碳浓度、比叶面积、叶片干物质含量和叶面积等叶片性状, 以及株高、树冠横截面积和胸径等全株性状(Ma et al., 2019), 性状上的差异进而影响光谱反射率(Wang et al., 2018).已经有很多研究基于机载高光谱数据绘制高空间分辨率的植物功能多样性空间分布图(Asner et al., 2017; Schneider et al., 2017; Zheng et al., 2021), 但在更大的区域范围内由于获取数据难以实现且成本昂贵, 研究还较少.Sentinel-2号卫星等多光谱空间遥感的发展有利于克服高空间分辨率和监测范围的问题(Rossi et al., 2020; Hauser et al., 2021).目前相关的研究还较少且受很多因素影响, 比如野外数据和卫星影响时间不匹配, 物种的区域差异与方法的适用性等等, 这都有待进一步补充和验证, 可以考虑作为接下来的研究方向. ...


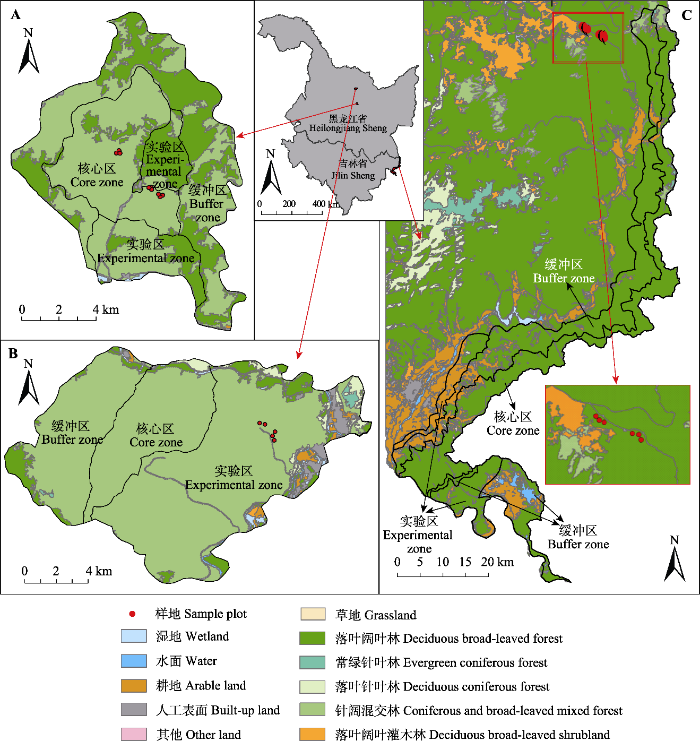
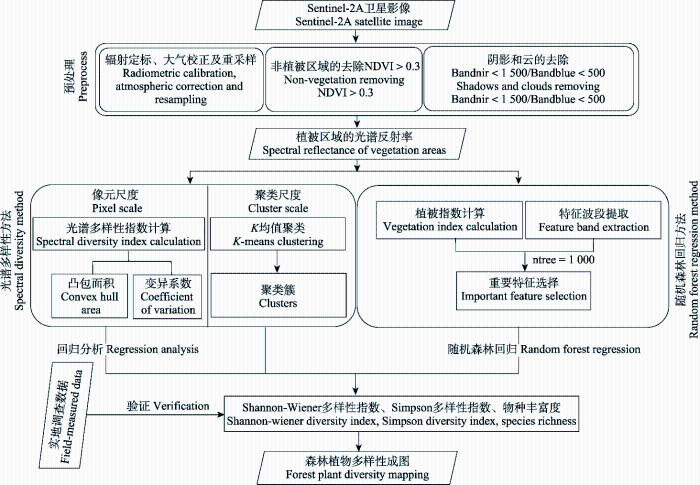
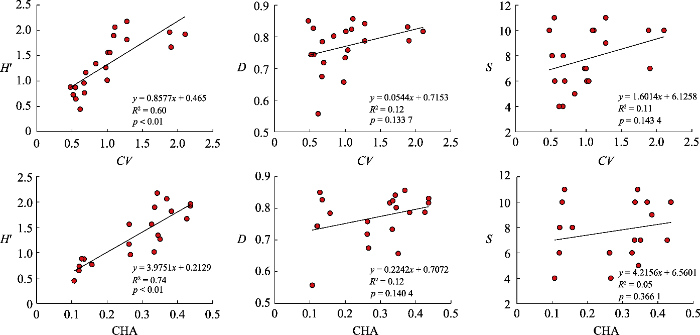
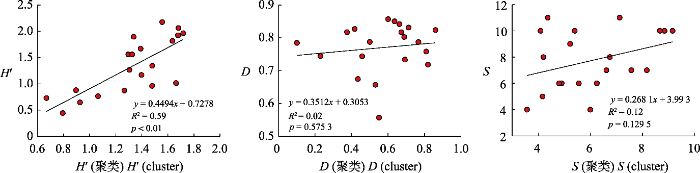
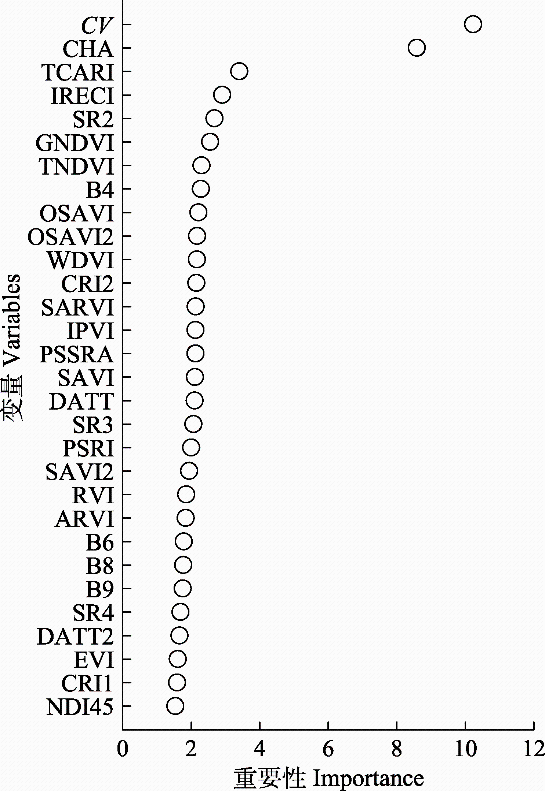
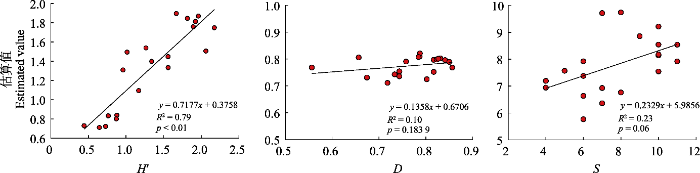
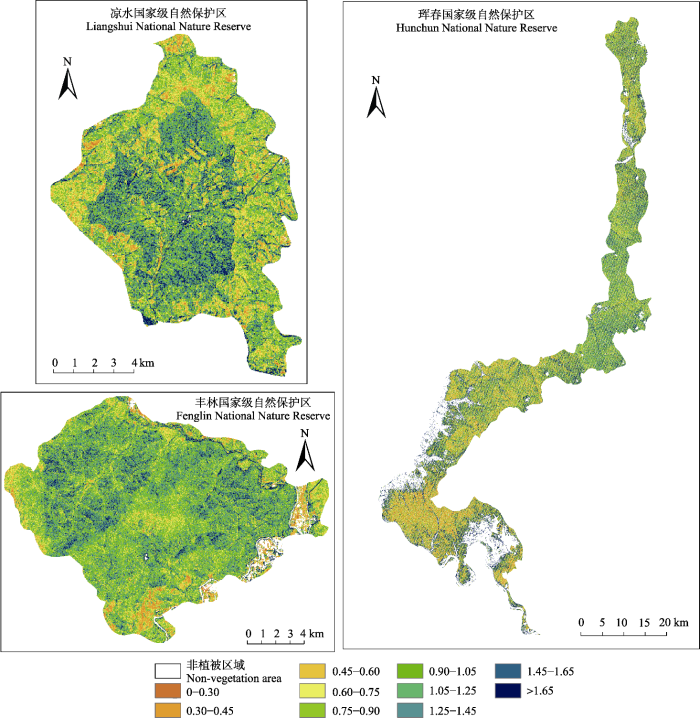

