


植被物候作为全球气候变化一个非常敏感的指示器(Schwartz, 1998; 葛全胜等, 2010; Piao et al., 2019), 植被物候动态与生长季长度的改变直接相关, 通过生长季的变化等一系列物候相的改变而影响到地球表面与大气之间的能量、水分以及碳交换过程(Piao et al., 2008; Richardson et al., 2010; Visser, 2016), 从而调节生态系统碳平衡(Richardson et al., 2013; Xie et al., 2015; Tang et al., 2016)。而这一系列的生态系统循环过程的改变, 必然反作用于气候, 从而调节气候变化的过程。因此物候动态研究成为近年来陆地生态系统与气候变化研究中非常重要的一个环节(Fu et al., 2018; Stucky et al., 2018)。
长期的物候观测数据在记录植被物候多年变化趋势的同时, 也反映了植被春季发芽展叶等物候现象的发生日期与气温的年际变化存在非常明显的相关关系(Kramer et al., 2000; Bigler & Vitasse, 2019)。大尺度上植被物候与气候变化的关系通过诸多研究手段得以证实, 一些基于模型预测的研究充分证实了气温对植被各个物候期的重要作用(Fu et al., 2012), 说明温度在区域或全球尺度上对植被春季物候具有直接的影响。基于遥感的大尺度物候学研究也发现植被春季活跃生长的开始日期与早春温度存在显著的相关关系, Myneni等早在1997年利用卫星数据评估了北半球中高纬度地区植被春季物候开始日期与气候的关系, 提出温度升高是导致北半球植被春季物候提前的驱动因子, 这一观点在随后的大尺度物候研究中不断地得到证实(Nezlin et al., 2005; Jeong et al., 2011)。随着研究的深入, 发现温度对物候的影响在时间和空间上都存在差异。一些研究指出, 植被物候变化与气候变化并不完全同步(Piao et al., 2006; Misra et al., 2021), 证实温度对年内不同物候阶段的影响存在差别; 在年际尺度上, 气候变暖对植被春季物候的作用在逐步减弱(Fu et al., 2015b), 这一改变打破了长期以来植被春季萌发持续提前的特征, 温度对生态系统春季碳吸收的调控作用也在相应地减弱(Piao et al., 2017)。空间上, 温度对植被春季物候的调节作用与区域水热状况相关, 较为湿润地区的温度对春季物候的作用显著高于受到水分胁迫的干旱半干旱地区(Cong et al., 2012); 而对于海拔变化明显的高原和山地地区, 温度随着海拔高度的变化也制约着植被春季物候的各个过程(Piao et al., 2011)。
早春温度对春季植物萌发调节作用的时空差异性受到了生态学界的关注, 植被春季物候的温度敏感性因此逐渐得到生态学家的重视, 近年来温度升高影响植被春季物候开始日期的研究大量展开。诸如长期观测记录分析、局部的增温实验, 以及大尺度的模型模拟等研究广泛开展(Menzel et al., 2006; Zhu et al., 2017)。增温实验将相对较长时期的气候变暖过程缩微到较短的过程中, 而短期的增温实验能否真实反映生态系统应对长期的全球变化的过程和效应? 这一问题尚待深入探讨。Wolkovich等(2012)通过计算增温实验站点和长期观测站点两种手段对应的植被物候的温度敏感性, 得出增温实验低估了植被物候对气候变暖的响应幅度。而Cong等(2019)基于这些站点的坐标提取卫星数据, 利用统一方法计算温度敏感性, 得到了相同的对比结果, 说明空间上植被物候温度敏感性的差异不一定是由于方法的不同而产生。随着植被类型、局地气候等因素的改变, 植物本身功能性状的自我调节作用, 可能导致物候的温度敏感性存在空间异质性。本研究利用大尺度卫星数据, 采用5种方法提取植被春季物候信息, 在前期针对物候与气候初步研究(丛楠和沈妙根, 2016)基础上, 结合CRU和CRUNCEP气象数据进一步对北半球植被春季物候与早春温度、降水、辐射的关系进行探讨, 同时计算研究区植被春季物候的温度敏感性, 并分析气候与植被物候温度敏感性的交互关系, 以探索植被物候温度敏感性的制约因素。
1 材料和方法
本研究为更好地延续以前工作, 使结果具有延续性和可比性, 选取的数据集和分析方法与以前研究(丛楠和沈妙根, 2016)重叠部分保持一致。
1.1 北半球中高纬度地区格网数据集
1.1.1 归一化植被指数数据
归一化植被指数(NDVI)是目前应用较为广泛的卫星植被产品, 该指数利用植被特征光谱中的特征波段, 选取植被高反射的近红外波段和深度吸收的红光波段的电磁波谱值, 二者之差和之和的比值为NDVI。
式中, Rnir为近红外波段的光谱反射率, Rr为可见光红光波段的光谱反射率。通过比值运算, 将NDVI归一化到-1-1之间, 使数据产品统一化, 从而方便进行植被特征的时空比较等研究。
本研究选用美国全球地学模拟与制图实验室(Global Inventory Modeling and Mapping Studies)的GIMMS3g NDVI产品, 数据集从1981年开始稳定提供全球每月2景NDVI产品, 空间分辨率(1/12)°。该产品的传感器AVHRR搭载于美国著名气象卫星NOAA上, 是迄今为止可提供时间序列最长的卫星数据产品。为解决内在和外在的噪声导致的数据失真问题(Tucker et al., 1985), AVHRR GIMMS3g NDVI数据经过多次辐射校正, 保证了NDVI数据的产品质量(Tucker et al., 2005)。为保证与前述研究的接续, 本研究仍然选取1982-2009年30年数据开展北半球中高纬度地区(30° N以北地区)植被物候温度敏感性分析(丛楠和沈妙根, 2016)。
1.1.2 气象数据和植被类型数据
本研究仍然利用CRU和CRUNCEP两套气象数据集, 空间分辨率均为0.5° × 0.5°。其中温度和降水数据来自CRU数据集, 该数据集提供月尺度数据; 辐射数据来自CRUNCEP数据集, 为6 h的入射短波辐射数据, 我们在数据预处理中将其合成为月尺度数据, 与CRU温度降水数据的时间分辨率相匹配。
植被类型数据仍然采用MODIS全球植被分类产品, 本数据使用国际地圈生物圈计划(IGBP)的分类标准(Sulla-Menashe et al., 2019), 包括11个植被类型, 本研究区域内包括落叶针叶林、落叶阔叶林、灌丛植被、草地和农作物等5种植被类型。鉴于几个格网数据集空间分辨率不同, 本研究将分辨率进行重采样, 统一为(1/12)°分辨率的格网数据。
1.2 研究方法
1.2.1 基于卫星数据的植被春季物候日期提取方法
由于目前还没有全球统一的物候计算方法(White et al., 2009), 本研究采用5种遥感方法提取北半球植被春季物候信息, 并利用平均值进行分析。利用NDVI提取物候信息一般分为两步: 首先将NDVI曲线通过滤波去除噪音, 重构分辨率符合研究需求的时间序列; 接下来选取合适的动态或静态阈值, 逐年得到植被像元的物候期。本研究采用的方法分别为Gauss-Midpoint、Spline-Midpoint、HANTS-Maximum、Polyfit-Maximum、Timesat-SG。5种方法采用的滤波方式及阈值确定方式见表1, 具体方法阐述详见丛楠和沈妙根(2016)。5种方法均以多年平均NDVI时间序列为基础, 得到各自方法参考的物候时期和对应的NDVI阈值。与前述研究一致, 我们将5种方法的结果进行平均, 得到的平均物候日期用于本研究的分析。
表1 植被物候提取方法核心计算公式
Table 1
| 方法名称 Name of method | 滤波核心公式 Core formula for filtering | 阈值确定方式 Threshold algorithm |
|---|---|---|
| Gauss-Midpoint | ||
| Spline-Midpoint | ||
| HANTS-Maximum | ||
| Polyfit-Maximum | ||
| Timesat-SG |
a, b, c, d, 曲线重构计算中的拟合系数; Ci, 窗口中第i个点的拟合系数; e, 自然常数; j, 数据列表中原始坐标的运转指数; m, 窗口半径, 即窗口样本量= 2m + 1; max, min, 分别表示变量的最大值和最小值; N, 回旋整数; t, 待拟合的时间段; xt, 第t个样本值; φ, 拟合的归一化植被指数(NDVI)时间序列中最大值的相位; ω, 所需的拟合频度。
a, b, c, d, the coefficients of curve fitting; Ci, the coefficient of i-th in the fitting window; e, natural constant; j, the running index of the original coordinate in data list; m, radius of fitting window, number of sample = 2m + 1; max, min, the maximum and minimum values of variables; N, the integer of cyclotron; t, the period for fitting; xt, the value of t-th sample; φ, the maximum phase position in fitted normalized difference vegetation index (NDVI) time-series; ω, the frequency of fitting.
1.2.2 植被物候温度敏感性提取及分析方法
根据北半球整体植被和每种植被类型春季物候开始的平均日期, 选择5月为起始月份, 以月为时间步长, 逐步向前分段推演计算不同累积时间段的平均温度和累积降水量, 前溯到上一年11月份, 即秋天结束为止。对物候及温度时间序列去趋势处理后, 利用Pearson相关性分析, 找到相关系数绝对值最大(即相关性最好)的时间范围, 通过去相关后的线性回归计算植被物候在这个最优时间范围的敏感性, 并结合统计学方法分析植被春季物候温度敏感性的特征及影响因素。同样地, 在空间逐像元分析上, 以像元为单位, 首先确定每个像元多年平均的NDVI曲线, 得到每个像元多年平均物候开始日期, 以此平均物候日期确定每个像元生长季开始所在月份, 逐像元重复上述推演计算至前一年11月份, 得到30年来空间上逐像元的最优时间段的植被春季物候的温度敏感性。
2 结果
2.1 北半球气候对植被春季物候的“滞后”效应
2.1.1 北半球植被春季物候开始日期与生长季前期气候的关系
图1A是研究区所有植被春季物候开始的综合物候时期与温度和降水的相关关系。图中可见, 植被多年春季物候开始的日期与温度和降水量都呈现负相关关系, 即温度和降水量对植被春季物候开始都起着促进作用, 但与温度的相关性显著强于与降水量的相关性。植被平均春季物候开始时间与5月当月温度的关系不及与生长开始前期的温度强烈, 植被春季物候开始日期与气温在物候发生前第4个月(5)之间的相关关系最为显著, 即与当年1月的平均温度相关性最大, 随后与前一年冬天(11、12月)的平均温度的相关性开始减弱, 但仍然呈现负相关关系。而春季物候开始的日期与每个阶段的累积降水的相关关系没有明显变化, 相关系数曲线非常平直。
图1

图1
北半球中高纬度地区植被春季物候开始日期与不同时间段温度和降水量的相关系数(平均值±标准差)。从平均生长日期所在的5月份为基础, 以月为单位, 向前推算。例如, 1表示物候发生当月5月, 2表示物候发生前1个月即4月份, 依次类推, 至前一年11月份(7)。
Fig. 1
Correlation coefficients of spring green-up dates with temperature and precipitation for different vegetation types in different periods in mid- to high-latitude regions of Northern Hemisphere (mean ± SD). The calculation was made backward by one-month starting from May as the average start season. E.g., the value 1 on the x-axis indicates the start month of phenological event (May in this study), and 2 the preceding month (April in this study). All way backward to November of the previous year (7).
不同植被类型由于生长环境以及本身生物特性的不同, 其对温度和水分的需求各不相同, 因此, 本研究进一步探讨了不同植被类型与温度和降水量的相关关系。由图1B可见, 落叶针叶林春季物候的开始日期与开始前第3个月(4), 即2月的平均温度的负相关性最强, 以2月为界, 从当月温度开始, 随着时间向前累加, 这一相关性由弱到强, 再逐步减弱; 与降水量的负相关性在各个时间段上基本一致, 几乎没有变化。落叶阔叶林春季物候与当月温度的负相关性最差, 随着时间向前推移, 相关性逐渐增大, 到春季物候发生前第4个月, 即当年1月份负相关性达到最大, 至前一年11、12月, 与温度的负相关性转而减弱; 与降水量则主要表现为不显著的负相关关系, 其中与生长开始前第1个月(2), 即4月份的负相关关系最大, 其余时间段相关系数非常低(图1C)。灌丛植被春季物候与温度和降水都表现为负相关关系, 与春季物候开始前第1个月的平均温度负相关性最强(图1D)。草地春季物候与温度呈负相关关系, 最大相关出现在开始前第4个月(5), 从春季物候开始前1-4个月之间, 负相关性比较平稳相差不大, 但与降水量则主要表现为不显著的正相关关系(图1E)。同样地, 农作物春季物候与温度呈负相关关系, 最大的相关性出现在开始前第4个月(5), 与降水量主要表现为不显著的负相关关系(图1F)。值得注意的是, 所有植被类型春季物候与温度的相关性都高于与降水的相关性; 除草地外, 所有植被类型与温度和降水都呈现负相关关系, 即生长季之前的温度和降水的增加对植被开始萌发起到促进的作用。草地主要分布在干旱半干旱地区, 这一区域土壤径流相对较大, 降水向土壤水的转化率较低(潘瑞炽和董愚得, 1999), 虽然在空间尺度上发现降水的增加对草地春季物候的开始起到促进作用, 但从长时期的时间尺度上看, 降水并没有直接作用于草地春季物候开始的生理活动中。因此本研究应该根据不同的植被以及像元选择相关性最大的时间段来具体分析对温度的反馈作用。
2.1.2 北半球植被春季物候开始日期与生长季前期温度的关系空间分布特征
本研究利用5种方法平均的结果计算每个像元春季物候开始日期与春季物候开始之前不同时间段温度的相关系数, 统计相关性最大的时间段的像元个数, 并以百分比的方式投影到图中, 以观察这一“滞后”效应在地域上的分异特征(图2)。图2A表示植被春季物候开始日期与温度相关性最大的时间段, 以多年平均的春季物候开始的日期作为基准, 依次向前每次累加一个月的温度并计算这一时间段的平均温度值, 向前累加温度到前一年的冬天(11月)为止, 从最大相关系数观察区域早春温度的“滞后”效应。整体来说, 大多数植被像元春季物候开始日期与当月和春季物候发生之前一个月的平均温度相关性最强(图2B), 与当月温度关系最好的像元占26%, 而与之前一个月的关系最好的像元比例最大, 约28%, 之后随着时间不断向前推移, 最大相关像元的百分比逐渐减小, 说明植被春季物候开始前一个月以及当月的温度对植被的物候活动影响最大。从空间分布上看, 欧洲西部地区植被主要受春季物候开始前一个月的平均温度影响最大; 而亚洲高纬度地区温度对植被物候活动的“滞后”效应也比较早, 主要为春季物候开始前一个月, 而到俄罗斯北部, 随着纬度升高, 植被受当月温度的影响最大; 欧亚大陆中部地区温度的“滞后”时长主要为当月到生长季前4个月不等。北美东部高纬地区植被春季物候开始主要受当月和之前一个月温度的影响, 向中部地区“滞后”时长增大, 到西部山区, 这一“滞后”效应重新减小至当月和提前一个月为主(图2A)。
图2

图2
北半球中高纬度地区植被春季物候的温度“滞后”效应统计。时间段数字表示植被春季物候所在月份的前(n-1)个月的时间段, 例如, 1表示春季物候发生的当月, 2表示植被物候发生前1个月, 即当月和物候发生前1个月时间段的月平均温度。
Fig. 2
The “lag effect” of mean temperature on spring green-up onset in mid- to high-latitude regions of Northern Hemisphere. The values for period show the month(s) precede the average start of season. E.g. value 1 represents the month of start of spring, and 2 the preceding month before the start of month, calculated as the average temperature between the month of phenological event and the preceding month.
2.2 多气象因子对植被春季物候开始日期的综合影响
本研究分别计算了1982-2009年植被春季物候开始的日期与生长季初期温度、降水和辐射的相关系数, 探讨空间上植被春季物候开始在不同地区受气候因子的综合影响(图3)。图中显示, 绝大部分地区植被春季物候开始日期受生长季初期温度的调控, 北美大陆东北部、欧洲地区以及欧亚大陆中部地区像元普遍与温度的相关性最大, 亚洲东部中国等植被春季物候开始日期仍然与温度的相关性最大, 但地区内部像元的一致性较弱。加拿大东部地区、俄罗斯东北部区域植被春季物候与降水的关系最为明显, 但这有可能是由于温度和降水的协同变异导致的, 简单的线性统计方法有可能没有完全区分开植被春季物候的驱动因子, 有待于进一步详细研究。加拿大中北部地区和亚欧大陆蒙古及周边区域, 植被春季物候的开始日期主要与辐射能量表现出相关关系。其余地区, 诸如北美大陆西部山区、亚欧大陆南部地区以及西北欧挪威瑞典等地区植被春季物候受多种因素互相调节, 且区域内部异质性较大, 像元与气象因子最大相关没有比较明显的一致性。说明研究区植被春季物候开始的驱动因子因植被类型和分布区域的雨热条件的不同而不同, 但生长季初期温度对北半球中高纬地区的植被来说, 仍然起到主要的驱动作用。
图3

图3
北半球中高纬度地区植被春季物候开始日期与温度(T)、降水(P)和辐射(R)的相关关系。
Fig. 3
Correlations of green-up with temperature (T), precipitation (P) and radiation (R) in mid- to high-latitude regions of Northern Hemisphere.
2.3 植被春季物候温度敏感性空间分布特征
根据前述研究方法, 逐像元计算得到了植被春季物候的温度敏感性。由于农作物的生长受到人为因素的影响远高于温度的作用, 因此, 图4植被春季物候的温度敏感性分布图去除了农作物像元。图上可见, 研究区91.3%植被像元的温度敏感性表现为负值, 即温度升高对植被春季物候开始的日期起到促进的作用。欧洲西南部较湿润地区和北美西部较湿润山区像元的温度敏感性最大, 温度每升高1 ℃, 植被春季物候开始日期提前了5天左右。其次, 欧洲中部低纬度地区、亚洲中部青藏高原以及北美东部中纬度地区植被的温度敏感性也较高, 提前速率在3-5 d·℃-1。其余地区的温度敏感性略低, 同时30° N附近有小面积地区温度敏感性为正值。从图4可见, 温度升高对植被春季物候的开始以促进为主, 因此, 在接下来的敏感性研究中, 只关注温度对植被春季物候的促进作用(负相关的温度敏感性)。
图4

图4
北半球中高纬度地区植被春季物候开始日期的温度敏感性空间分布图。
Fig. 4
Spatial pattern of temperature sensitivity for dates of vegetation spring green-up in mid- to high-latitude regions of Northern Hemisphere.
2.4 植被春季物候温度敏感性与气候因子的关系
2.4.1 植被春季物候温度敏感性与温度波动的关系
我们之前的研究已经指出早春温度对北半球植被春季物候开始日期具有显著的影响, 但温度的作用存在空间异质性, 环境背景影响因素较多, 单一温度因子除了随着纬度和海拔的变化而产生差异外, 温度的年际波动是反映区域环境严酷程度的一个重要指标, 因此, 本研究利用温度标准差指示区域温度波动性大小, 并沿梯度统计植被春季物候的温度敏感性, 从而探索温度敏感性在不同地区的差别。我们计算了研究区这28年的温度标准差, 以此界定这一时间段内区域温度变化的剧烈程度, 本研究分别统计了年平均温度和3-5月早春温度的标准差(图5)。图中按温度标准差的梯度统计的植被春季物候温度敏感性可见, 研究区相同间隔内, 年平均温度标准差对应的物候温度敏感性低于早春平均温度标准差对应的温度敏感性, 说明多年平均温度波动的剧烈性低于春季平均温度的波动, 即植被春季物候的主要响应温度时间段可能集中于早春时间段。值得注意的是, 将温度敏感性分别对年平均温度标准差和初春平均温度标准差进行皮尔森相关性分析, 结果表明植被春季物候开始日期的温度敏感性与两个温度标准差都呈现显著负相关关系, 而与春季平均温度的标准差相关系数更大, 可以推断春季生长季初期的温度变异程度对植被春季物候开始的作用更加重要, 而近30年来春季温度的波动更大, 暗示对植被温度敏感性会有比较明显的影响。但植被春季物候开始日期的温度敏感性表现出一致的分布特征, 即温度标准差越小的区域, 植被生长的温度敏感性越大。
图5

图5
北半球中高纬度地区植被春季物候开始日期的温度敏感性(平均值±标准差)沿多年温度标准差梯度的分布。
Fig. 5
Distribution of temperature sensitivity (mean ± SD) in vegetation spring phenology along gradient of standard deviation for temperature in mid- to high-latitude regions of Northern Hemisphere.
2.4.2 植被春季物候温度敏感性与降水的关系
本研究分别计算了多年平均的年降水量和3-5月春季降水量, 以及前一年11月开始至生长季初期5月之间的降水量, 并与对应的植被生长的温度敏感性进行Pearson相关分析, 发现每个阶段降水量都与温度敏感性呈显著相关关系, 降水对植被温度敏感性起到促进作用, 但前一年冬季到生长季早春这一时期平均累积降水量相关性最大, 因此本研究着重统计这一时期降水量梯度的温度敏感性分布特征。整体说来, 植被温度敏感性在各个降水量水平都表现为负值, 即植被春季物候与早春温度在各个降水量水平上都表现为负相关关系(图6)。说明降水对植被的温度敏感性起到促进作用, 然而, 温度敏感性的变化不存在一个线性的变化趋势, 但在不同的降水量区段具有一定的分布规律。在相对干旱的区域, 前一年冬季11月到当年5月的累积降水量从0到500 mm, 植被生长的温度敏感性呈显著的线性增强的趋势, 从-2 d·℃-1增强至-4.5 d·℃-1; 之后到800 mm之间, 植被温度敏感性维持在这一数值; 降水量从800 mm到1 400 mm之间植被的温度敏感性略减弱至-4 d·℃-1, 同时温度敏感性波动不大; 随着降水量的增加(1 400-1 700 mm), 温度敏感性绝对值又表现为线性增加趋势; 随后又开始线性减小。在极端湿润地区(>1 700 mm), 降水量增加对温度敏感性起到抑制作用。
图6

图6
北半球中高纬度地区植被温度敏感性沿降水量梯度分布特征(平均值±标准差)。
Fig. 6
Distribution of temperature sensitivity of vegetation phenology along precipitation gradient in mid- to high-latitude regions of Northern Hemisphere (mean ± SD).
2.4.3 植被春季物候温度敏感性与辐射的关系
图7
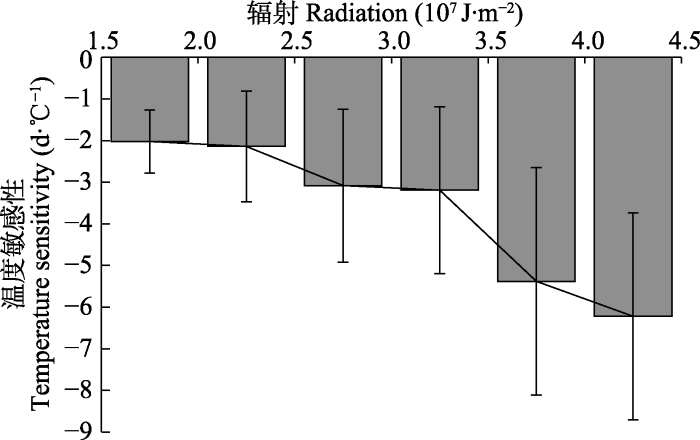
图7
北半球中高纬度地区植被春季物候温度敏感性沿辐射梯度分布特征(平均值±标准差)。
Fig. 7
Distribution of temperature sensitivity of vegetation phenology along radiation gradient in mid- to high-latitude regions of Northern Hemisphere (mean ± SD).
3 讨论和结论
3.1 早春温度对植被春季物候的滞后作用与气候效应的复杂性
温带植被春季物候是植物打破冬眠开始萌发的过程事件, 这一过程随着冬去春来温度逐渐升高达到热量的累积, 从而触发物候事件的发生(Fu et al., 2015a; Cong et al., 2017)。因此, 在这一过程温度对植被春季萌发的作用是持续进行的而非瞬时效应, 从对植物休眠的状态的激发到开花展叶的触发, 先期积累已经直接或间接地对春季物候的发生起到作用, 早春的温度对植被春季物候存在滞后效应。不同植被其自身生理特征和组织结构不同, 触发其萌发的条件需求也各不相同, 温度的滞后效应各不相同; 与此同时, 单一像元和植被类型的区域综合所对应的尺度也不相同, 关于温度滞后效应的长度不具备可比性, 两个尺度所对应的生态系统问题也应分开讨论。因此, 我们在植被物候的驱动机制以及植被生长季与气候变化研究中, 应从不同尺度不同角度充分考虑温度的过程效应。
同时, 近年来的研究指出, 植被春季物候的动态并非由温度单因子所主导, 复杂的气象因素组合, 特别是温度与降水的交互作用是植被春季物候的主要影响因素(Fu et al., 2014; Cong et al., 2021)。生长季初期温度对植被春季物候起着至关重要的作用, 但是气候系统是多项气象因子相互制约相互调控的, 植被生长不是仅温度达到临界值即可开始, 充足的水分和光照同样是必不可少的条件(潘瑞炽和董愚得, 1999)。不同地区由于其气候条件的不同, 对植被生长的主导因子不一定都是温度。例如, 干旱半干旱地区, 植被经常受到水分的胁迫, 温度的升高导致蒸腾作用加剧造成该区域水分的大量流失, 此时温度对植被生长不仅没有起到促进作用, 反而抑制了植被生长, 水分的丰富程度便成为部分干旱半干旱地区的植被生长能否开始的主导因子。而在北半球高纬度地区, 如俄罗斯、加拿大等国家境内, 植被长期处于低温环境中, 对春季萌发的温度需求较低, 在早春温度达到需求, 水分的丰富即触发植物萌发。因此在这些高纬度地区降水的主导因素可能源于温度降水的协同作用。因此, 在多元气象因子综合效应分析中, 除温度作为主导因子外, 降水和辐射在一些区域上同样成为春季物候的主导因子(图3)。
3.2 植被春季物候温度敏感性的时空异质性
在温度波动较小的地区, 植被生活的环境相对稳定, 对环境的变化适应性有可能弱于生活在环境相对恶劣区域的植被(Wang et al., 2014), 因此, 当全球温度骤然升高时, 温度变化相对较小地区的植被可能因自我调节能力较差而对温度升高的反应相对比较强烈, 即温度敏感性可能更大; 温度常年波动较大的区域则反之, 这一区域植被拥有相对较强的适应能力, 对温度迅速上升的反应相对稳定, 即温度敏感性较小。同样地, 环境水分对植被物候的温度敏感性也存在影响, 之前对中国北温带地区植被春季物候开始的温度敏感性的研究发现, 春季累积降水量对植被物候的温度敏感性具有促进作用(Cong et al., 2013), Kariyeva等(2012)基于NDVI对中亚地区植被物候的研究也指出, 冬季降水格局是这一区域植被物候的驱动因子之一。我们的研究结果也发现降水在极端干旱和极端湿润地区对温度敏感性具有抑制作用,
在证实了水热条件对植被春季物候相互作用的同时, 本研究也指出了降水与辐射对其的相互作用。在干旱地区, 植被生长以及春季物候的开始日期往往受到水分胁迫的作用, 在这一区域, 随着降水量的增加, 水分的胁迫作用逐渐减弱, 温度对植被物候的调节作用逐渐得以显现, 因此降水对植被物候的温度敏感性表现出促进作用。到湿润地区, 降水不再成为植被生长和物候的胁迫因子, 植被物候的温度敏感性能够以最大表现形式出现, 因此在没有水分胁迫的地区, 降水对植被物候温度敏感性的调节作用不再显著(图6)。同时, 有效辐射对物候温度敏感性的促进作用, 可以解释在极端湿润地区, 物候温度敏感性受到抑制(图7)。在极端湿润地区, 降水过多可能导致云层覆盖时间增长, 从而抑制了地面植被接收到的有效辐射量, 有效辐射的减少减弱了植被物候的温度敏感性, 也间接地说明降水过度增加减弱了物候的温度敏感性。这种现象的具体作用机制, 降水对温度敏感性开始抑制的临界值等问题, 在我们未来的研究中将深入地研究和思考。
3.3 结论与不足
本研究在利用5种方法从卫星植被指数数据中提取植被春季物候的基础上, 进一步分析了1982- 2009年北半球中高纬地区植被春季物候与气候因子的关系, 发现温度是北半球植被春季物候动态的主要影响因子, 但早春温度对植被春季物候的作用是一个过程效应, 且存在滞后效应, 大部分地区温度对物候的促进作用大比例集中在物候开始前一个月和物候发生当月。植被春季物候的温度敏感性存在空间异质性, 随着植被类型与局地环境背景的不同而不同, 降水和辐射对植被温度敏感性的作用呈现相互制约的关系。
本研究为以前研究的延续性工作, 因此为进一步认识前期成果, 本次研究在数据方法和时间序列的选择上与之前保持一致。随着卫星数据的不断更新, 我们已经可以获取更长的时间序列, 在未来研究中, 我们将加长时间长度分析, 探讨植被物候的动态变化。随着对物候和植被生态系统的深入认识, 分析气象因素对物候的作用也更加细致, 已有研究表明白天温度对物候的作用比夜间温度更重要(Piao et al., 2015; Fu et al., 2016), 在部分地区的积温和冷激效应对植被春季物候的开始作用不容忽视(Fu et al., 2015a)。本研究只使用了平均温度来接续以前研究, 没有进一步细化温度分量, 在未来的工作中将进一步加强, 从而深入了解植被物候对气候的响应机制。
责任编委: 唐志尧 编辑: 赵 航
参考文献
Daily maximum temperatures induce lagged effects on leaf unfolding in temperate woody species across large elevational gradients
Unsynchronized driving mechanisms of spring and autumn phenology over Northern Hemisphere grasslands
DOI:10.3389/ffgc.2020.610162 [本文引用: 1]
Spring vegetation green- up date in China inferred from SPOT NDVI data: a multiple model analysis
DOI:10.1016/j.agrformet.2012.06.009 URL [本文引用: 1]
Variation of satellite-based spring vegetation phenology and the relationship with climate in the Northern Hemisphere over 1982 to 2009
DOI:10.13287/j.1001-9332.201609.028
PMID:29732834
[本文引用: 4]

In-depth understanding the variation of vegetation spring phenology is important and nece-ssary for estimation and prediction of ecosystem response to climate change. Satellite-based estimation is one of the important methods for detecting the vegetation spring phenology in Northern Hemisphere. However, there are still many uncertainties among different remote sensing models. In this study, we employed NDVI satellite product from 1982 to 2009 to estimate vegetation green-up onset dates in spring across Northern Hemisphere, and further analyzed the phenology spatio-temporal variation and the relationship with climate. Results showed that spatial mean spring phenology significantly advanced by (4.0±0.8) days during this period in the Northern Hemisphere, while spring phenology advanced much faster in Eurasia (0.22±0.04 d·a) than in North America (0.03±0.02 d·a). Moreover, phenology of different vegetation types changed inconstantly during the period. All five methods consistently indicated that grassland significantly advanced, while forests didn't advance robustly among methods. In addition, the interannual change of spring phenology was mainly driven by spring temperature. The spring phenology advanced (3.2±0.5) days with 1 ℃ increase in temperature. On the contrary, we did not find significant relationship between vegetation spring phenology and spring accumulative precipitation across the Northern Hemisphere (P>0.05) in this study.
1982-2009年基于卫星数据的北半球中高纬地区植被春季物候动态及其与气候的关系
Little change in heat requirement for vegetation green-up on the Tibetan Plateau over the warming period of 1998-2012
Spatial sampling inconsistency leads to differences in phenological sensitivity to warming between natural and experiment sites
DOI:10.1016/j.scib.2019.05.001 URL [本文引用: 1]
Changes in satellite-derived spring vegetation green-up date and its linkage to climate in China from 1982 to 2010: a multimethod analysis
DOI:10.1111/gcb.12077
PMID:23504844
[本文引用: 1]
The change in spring phenology is recognized to exert a major influence on carbon balance dynamics in temperate ecosystems. Over the past several decades, several studies focused on shifts in spring phenology; however, large uncertainties still exist, and one understudied source could be the method implemented in retrieving satellite-derived spring phenology. To account for this potential uncertainty, we conducted a multimethod investigation to quantify changes in vegetation green-up date from 1982 to 2010 over temperate China, and to characterize climatic controls on spring phenology. Over temperate China, the five methods estimated that the vegetation green-up onset date advanced, on average, at a rate of 1.3 ± 0.6 days per decade (ranging from 0.4 to 1.9 days per decade) over the last 29 years. Moreover, the sign of the trends in vegetation green-up date derived from the five methods were broadly consistent spatially and for different vegetation types, but with large differences in the magnitude of the trend. The large intermethod variance was notably observed in arid and semiarid vegetation types. Our results also showed that change in vegetation green-up date is more closely correlated with temperature than with precipitation. However, the temperature sensitivity of spring vegetation green-up date became higher as precipitation increased, implying that precipitation is an important regulator of the response of vegetation spring phenology to change in temperature. This intricate linkage between spring phenology and precipitation must be taken into account in current phenological models which are mostly driven by temperature.© 2012 Blackwell Publishing Ltd.
Bayesian comparison of six different temperature- based budburst models for four temperate tree species
DOI:10.1016/j.ecolmodel.2012.01.010 URL [本文引用: 1]
Three times greater weight of daytime than of night-time temperature on leaf unfolding phenology in temperate trees
DOI:10.1111/nph.14073 URL [本文引用: 1]
Larger temperature response of autumn leaf senescence than spring leaf-out phenology
DOI:10.1111/gcb.14021 URL [本文引用: 1]
Increased heat requirement for leaf flushing in temperate woody species over 1980-2012: effects of chilling, precipitation and insolation
DOI:10.1111/gcb.12863 URL [本文引用: 2]
Unexpected role of winter precipitation in determining heat requirement for spring vegetation green-up at northern middle and high latitudes
DOI:10.1111/gcb.12610 URL [本文引用: 1]
Declining global warming effects on the phenology of spring leaf unfolding
DOI:10.1038/nature15402 URL [本文引用: 2]
The progress of phenology studies and challenges to modern phenology research in China
物候学研究进展及中国现代物候学面临的挑战
Phenology shifts at start vs. end of growing season in temperate vegetation over the Northern Hemisphere for the period 1982-2008
Impacts of climate gradients on the vegetation phenology of major land use types in Central Asia (1981-2008)
DOI:10.1007/s11707-012-0315-1 URL [本文引用: 1]
The importance of phenology for the evaluation of impact of climate change on growth of boreal, temperate and Mediterranean forests ecosystems: an overview
An overview is presented of the phenological models relevant for boreal coniferous, temperate-zone deciduous and Mediterranean coniferous forest ecosystems. The phenology of the boreal forests is mainly driven by temperature, affecting the timing of the start of the growing season and thereby its duration, and the level of frost hardiness and thereby the reduction of foliage area and photosynthetic capacity by severe frost events. The phenology of temperate-zone forests is also mainly driven by temperature. Since temperate-zone forests are mostly mixed-species deciduous forests, differences in phenological response may affect competition between tree species. The phenology of Mediterranean coniferous forests is mainly driven by water availability, affecting the development of leaf area, rather than the timing of phenological events. These phenological models were subsequently coupled to the process-based forest model FORGRO to evaluate the effect of different climate change scenarios on growth. The results indicate that the phenology of each of the forest types significantly affects the growth response to a given climate change scenario. The absolute responses presented in this study should, however, be used with caution as there are still uncertainties in the phenological models, the growth models, the parameter values obtained and the climate change scenarios used. Future research should attempt to reduce these uncertainties. It is recommended that phenological models that describe the mechanisms by which seasonality in climatic drivers affects the phenological aspects of trees should be developed and carefully tested. Only by using such models may we make an assessment of the impact of climate change on the functioning and productivity of different forest ecosystems.
European phenological response to climate change matches the warming pattern
DOI:10.1111/j.1365-2486.2006.01193.x URL [本文引用: 1]
Ground and satellite phenology in alpine forests are becoming more heterogeneous across higher elevations with warming
DOI:10.1016/j.agrformet.2021.108383 URL [本文引用: 1]
Increased plant growth in the northern high latitudes from 1981 to 1991
DOI:10.1038/386698a0 URL
Inter-annual variability and interaction of remote-sensed vegetation index and atmospheric precipitation in the Aral Sea region
DOI:10.1016/j.jaridenv.2005.01.015 URL [本文引用: 1]
Net carbon dioxide losses of northern ecosystems in response to autumn warming
DOI:10.1038/nature06444 URL [本文引用: 1]
Altitude and temperature dependence of change in the spring vegetation green-up date from 1982 to 2006 in the Qinghai-Xizang Plateau
DOI:10.1016/j.agrformet.2011.06.016 URL [本文引用: 1]
Variations in satellite-derived phenology in China’s temperate vegetation
DOI:10.1111/j.1365-2486.2006.01123.x URL [本文引用: 1]
Plant phenology and global climate change: current progresses and challenges
DOI:10.1111/gcb.14619 URL [本文引用: 1]
Weakening temperature control on the interannual variations of spring carbon uptake across northern lands
DOI:10.1038/nclimate3277 URL [本文引用: 2]
Leaf onset in the northern hemisphere triggered by daytime temperature
DOI:10.1038/ncomms7911 [本文引用: 1]
Influence of spring and autumn phenological transitions on forest ecosystem productivity
DOI:10.1098/rstb.2010.0102 URL [本文引用: 1]
Climate change, phenology, and phenological control of vegetation feedbacks to the climate system
DOI:10.1016/j.agrformet.2012.09.012 URL [本文引用: 1]
The plant phenology ontology: a new informatics resource for large-scale integration of plant phenology data
DOI:10.3389/fpls.2018.00517
PMID:29765382
[本文引用: 1]
Plant phenology - the timing of plant life-cycle events, such as flowering or leafing out - plays a fundamental role in the functioning of terrestrial ecosystems, including human agricultural systems. Because plant phenology is often linked with climatic variables, there is widespread interest in developing a deeper understanding of global plant phenology patterns and trends. Although phenology data from around the world are currently available, truly global analyses of plant phenology have so far been difficult because the organizations producing large-scale phenology data are using non-standardized terminologies and metrics during data collection and data processing. To address this problem, we have developed the Plant Phenology Ontology (PPO). The PPO provides the standardized vocabulary and semantic framework that is needed for large-scale integration of heterogeneous plant phenology data. Here, we describe the PPO, and we also report preliminary results of using the PPO and a new data processing pipeline to build a large dataset of phenology information from North America and Europe.
Hierarchical mapping of annual global land cover 2001 to present: the MODIS Collection 6 Land Cover product
DOI:10.1016/j.rse.2018.12.013
[本文引用: 1]
Land cover and land use maps provide an important basis for characterizing the ecological state and biophysical properties of Earth's land areas. The Collection 5 MODIS Global Land Cover Type product, initially released in 2010, was produced at annual time steps and has been widely used in the land science community. In this paper we describe refinements and improvements, in both the algorithm and the resulting map data sets, that have been implemented in the MODIS Collection 6 Global land Cover Type product. Unlike the Collection 5 product, which was based on the 17-class International Geosphere-Biosphere Programme (IGBP) legend, the Collection 6 algorithm uses a hierarchical classification model where the classes included in each level of the hierarchy reflect structured distinctions between land cover properties. The resulting suite of nested classifications is combined to create eight distinct classification schemes including the five legacy schemes included in Collection 5, and three new legends based on the FAO-Land Cover Classification System (LEGS) that distinguish between land cover, land use, and surface hydrologic state. The Collection 6 algorithm also incorporates a state-space multitemporal modeling framework based on hidden Markov models that reduce spurious land cover changes introduced by classification uncertainty in individual years. Among other changes, relative to Collection 5, the Collection 6 product includes less area mapped as forests, open shrublands, and cropland/natural vegetation mosaics, and more area mapped as woodlands and grasslands. Accuracy assessment indicates that the Collection 6 product has an overall accuracy of 73.6% for the primary LCCS layer and that the amount of spurious land cover change has been substantially reduced in Collection 6 relative to Collection 5 (1.6% in C6 and 11.4% in C5).
Emerging opportunities and challenges in phenology: a review
DOI:10.1002/ecs2.1436 [本文引用: 1]
An extended AVHRR 8-km NDVI dataset compatible with MODIS and SPOT vegetation NDVI data
DOI:10.1080/01431160500168686 URL [本文引用: 1]
African land-cover classification using satellite data
Data from the advanced very-high-resolution radiometer sensor on the National Oceanic and Atmospheric Administration's operational series of meteorological satellites were used to classify land cover and monitor vegetation dynamics for Africa over a 19-month period. There was a correspondence between seasonal variations in the density and extent of green-leaf vegetation and the patterns of rainfall associated with the movement of the Intertropical Convergence Zone. Regional variations, such as the 1983 drought in the Sahel of westem Africa, were observed. Integration of the weekly satellite data with respect to time for a 12-month period produced a remotely sensed estimate of primary production based upon the density and duration of green-leaf biomass. Eight of the 21-day composited data sets covering an 11-month period were used to produce a general land-cover classification that corresponded well with those of existing maps.
Phenology: interactions of climate change and species
DOI:10.1038/nature18905 URL [本文引用: 1]
The influence of local spring temperature variance on temperature sensitivity of spring phenology
DOI:10.1111/gcb.12509
PMID:24357518
[本文引用: 1]
The impact of climate warming on the advancement of plant spring phenology has been heavily investigated over the last decade and there exists great variability among plants in their phenological sensitivity to temperature. However, few studies have explicitly linked phenological sensitivity to local climate variance. Here, we set out to test the hypothesis that the strength of phenological sensitivity declines with increased local spring temperature variance, by synthesizing results across ground observations. We assemble ground-based long-term (20-50 years) spring phenology database (PEP725 database) and the corresponding climate dataset. We find a prevalent decline in the strength of phenological sensitivity with increasing local spring temperature variance at the species level from ground observations. It suggests that plants might be less likely to track climatic warming at locations with larger local spring temperature variance. This might be related to the possibility that the frost risk could be higher in a larger local spring temperature variance and plants adapt to avoid this risk by relying more on other cues (e.g., high chill requirements, photoperiod) for spring phenology, thus suppressing phenological responses to spring warming. This study illuminates that local spring temperature variance is an understudied source in the study of phenological sensitivity and highlight the necessity of incorporating this factor to improve the predictability of plant responses to anthropogenic climate change in future studies. © 2013 John Wiley & Sons Ltd.
Has the advancing onset of spring vegetation greenup slowed down or changed abruptly over the last three decades
DOI:10.1111/geb.12289 URL [本文引用: 1]
Intercomparison, interpretation, and assessment of spring phenology in North America estimated from remote sensing for 1982-2006
Warming experiments underpredict plant phenological responsed to climate change
DOI:10.1038/nature11014 URL [本文引用: 2]
Deciduous forest responses to temperature, precipitation, and drought imply complex climate change impacts
Divergent shifts and responses of plant autumn phenology to climate change on the Qinghai-Tibetan Plateau
DOI:10.1016/j.agrformet.2017.03.013 URL [本文引用: 1]
