


水与水循环在森林生态系统中发挥着至关重要的作用(李菊等, 2006; 卢琼等, 2020)。水循环驱动着森林中的能量流动与物质循环(李玉山, 2001; 刘玉莉等, 2014; 张晓娟等, 2015; Jung, 2021), 因此水与水循环一直被广泛关注。森林生态系统中参与水循环的一个关键参数是水汽通量(Jung, 2021), 其是森林中潜热传导的载体, 起到了维持森林中水量平衡的作用(刘辉志等, 2006; 牛晓栋等, 2016)。森林中水汽通量主要是指林内地表土壤的水分蒸发、林内植被的蒸腾以及林内植被茎干截流蒸发的总和(刘玉莉等, 2014; 牛晓栋等, 2016; 翁闻畅等, 2020)。针阔混交林是陆地上最为广泛和重要的生态系统(黄钰辉等, 2017), 而水汽通量又是研究森林植被水量平衡的重要指标、生态系统能量闭合的影响因素、影响研究区气候的重要因子(徐少君等, 2012)。
涡度相关技术(吴家兵等, 2005; Allen et al., 2011; Liu et al., 2021)是一种可以长期连续地对地表和大气间的CO2、H2O和热量通量进行观测的微气象技术。由于该技术对生态系统的干扰性小, 观测数据准确, 所以已经成为国际通量观测网(FLUXNET)的标准方法(尹茜茜等, 2020; Zhang & Yuan, 2020)。中国也利用涡度相关技术建设了中国陆地生态系统通量观测网(ChinaFLUX)(李正泉等, 2004; 于贵瑞等, 2014)进行观测研究。全国建立了多个基于涡度相关技术的通量观测站点(Yu et al., 2016), 其中很大部分都是对碳通量(王倩等, 2019)和能量通量的观测研究, 关于针阔混交林生态系统水汽通量较少有深入讨论和研究(Rannik et al., 2002; 李菊等, 2006; 翁闻畅等, 2020)。
本研究以重庆市缙云山国家级定位观测研究站内的典型针阔混交林生态系统为研究对象。该地区具有中亚热带季风湿润性气候特征。利用2019-2020年在通量塔观测的水汽通量数据, 我们对该生态系统的能量闭合与贡献足迹进行分析, 探究了涡度相关法对该研究区的适用性, 并且对水汽通量的变化特征及环境因子进行分析, 为研究针阔混交林生态系统的水量收支平衡、气候变化提供数据支撑, 同时给当地森林生态可持续经营管理提供理论依据。
1 材料和方法
1.1 研究区概况
研究区位于重庆北碚区嘉陵江旁的缙云山森林生态系统观测研究站内(106.28°-106.40° E, 29.68°- 29.87° N), 占地面积76 km2。年降水量约为1 611.8 mm, 年蒸发量约为777.1 mm, 年平均气温13.6 ℃, 年日照时间比较低, 为1 293 h, 地属中亚热带季风性气候。一年当中平均有89天属于雾天(张璇, 2019), 降水主要集中在5-10月, 占年降水量的80%以上。其中最热月份为7-8月, 最高气温一般超过35 ℃, 蒸腾量大, 降水量比较少; 冬季降水明显较少, 1月为最冷月份, 平均气温3.1 ℃。自然植被类型以常绿阔叶林、针阔混交林、暖性针叶林、竹林为主, 其中研究区样地为针阔混交林, 植被种类丰富, 主要为马尾松(Pinus massoniana)、杉木(Cunninghamia lanceolata)、四川大头茶(Gordonia acuminata)、四川山矾(Symplocos setchuensis)等。
1.2 通量塔仪器配置
通量观测塔位于研究区样地西北侧大概50 m, 塔高35 m, 分为上下两层, 均安装有相应观测仪器。主要包括开路式涡度监测系统和微气象观测系统两部分。开路式涡度监测系统安装在通量塔33 m处, 主要仪器包括: 开路红外CO2/H2O气体分析仪Li-7500 (LI-COR, Lincoln, USA)和三维超声风速仪CAST-3 (Gill, Lymington, UK), 仪器采样频率为10 Hz, 数据采集器CR3000 (Campbell, Logan, USA), 采集数据时储存并计算30 min通量数据平均值。
微气象观测系统主要仪器包括: 安装于通量塔25 m和33 m处的大气温湿度传感器HMP60 (Vaisala, Helsinki, Finland), 翻斗式雨量计TR-525M (Campbell, Logan, USA), 光合有效辐射传感器LI-190SB (LI-COR, Lincoln, USA), 35 m处还安装有净辐射仪NR01 (Hukseflux, Delft, the Netherlands)、风速风向仪03002 (RM Young, Traverse, USA)。微气象观测系统仪器采样频率也为10 Hz, 使用前均进行了标定, 利用数据采集器CR3000储存并计算温度、降水量、净辐射和风速等气象因子的30 min平均值。
1.3 计算公式
涡度相关法是目前对陆地生态系统与大气间物质与能量交换进行直接观测的通用标准方法。主要是通过测定大气中湍流运动产生的风速脉动和物理量脉动的协方差来测定物质或能量的通量。其中水汽通量计算公式(李菊等, 2006)为:
式中, E (mmol·m-2·s-1)代表水汽通量, ρ为干空气密度, q为比湿, ω为垂直风速; 上划线代表一定时段的平均; 撇号表示脉动。规定若水汽从大气进入生态系统, 则值为负; 若气体从生态系统进入大气, 则值为正(李菊等, 2006)。
由于森林生态系统中Fs和Q所占比例很少, 且部分数据获取难度较大, 所以主要用潜热和显热通量之和(LE + H)与对应的可用能量通量(Rn - G)来计算能量闭合。
1.4 数据处理
数据处理采用Eddy Pro 7.1.6软件对10 Hz的30 min平均值通量原始数据进行处理。
坐标旋转校正, 由于研究区地形复杂属于森林山地, 所以2次和3次坐标旋转不能满足该研究区对垂直风速的要求, 因此采用平面拟合法进行校正(Wilson et al., 2002)。
本研究中摩擦风速(u*)的临界值无法固定, 而是利用Moving Point Test动态估计的(Papale et al., 2006)。
通量数值校正, 主要是WPL校正、频率响应校正、夜间通量校正。
数据分析和制图均基于SPSS 20.0、MATLAB、Tovi和Excel 2013软件完成。
2 结果和分析
2.1 能量闭合与通量足迹分析
2.1.1 能量闭合分析
图1
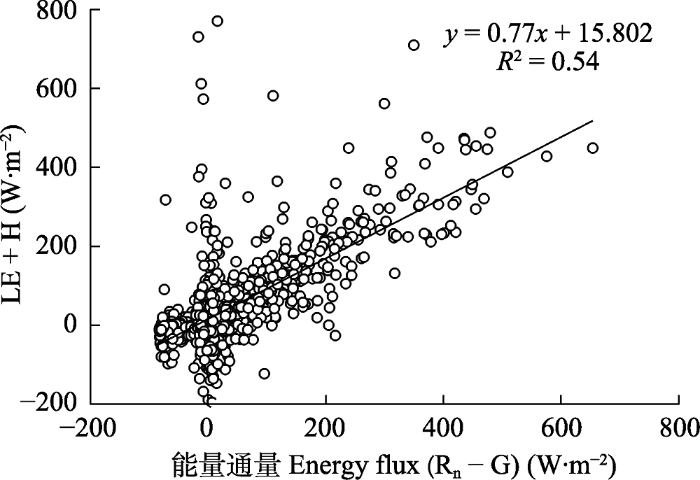
图1
重庆缙云山针阔混交林生态系统的能量闭合状况分析。G, 地表土壤热通量; H, 显热通量; LE, 潜热通量; Rn, 太阳净辐射。
Fig. 1
Energy closure analysis in a conifer-broadleaf mixed forest ecosystem at our study site in Jinyun Mountain, Chongqing. G, soil heat flux; H, sensible heat flux; LE, latent heat flux; Rn, net radiation.
2.1.2 通量足迹分析
通过涡度协方差数据分析软件(Tovi)对2019-2020年观测到的逐日30 min通量数据按照季节尺度进行处理分析, 得到春季(3-5月)、夏季(6-8月)、秋季(9-11月)和冬季(12-2月)通量足迹图(图2)。图中有色区域为通量贡献区, 其中红色代表通量数据采集最密集的区域, 为通量主要贡献区, 闭合线圈代表累计通量数据贡献区的范围, 图2中各季节通量数据贡献区基本集中在东北侧。夏季和秋季的高亮区域在西南-东北方向都能观测到通量足迹, 这是因为此时段风向波动较大, 通量数据贡献区范围变化较大; 而其他季节高亮区域主要集中在东北侧, 风向比较稳定, 通量数据贡献区范围变化较小。对全年风速风向变化进行的分析(图3)显示, 全年主风向以东北风向为主, 这与季节通量数据高贡献区方向相吻合。说明研究区数据来源可信。
图2
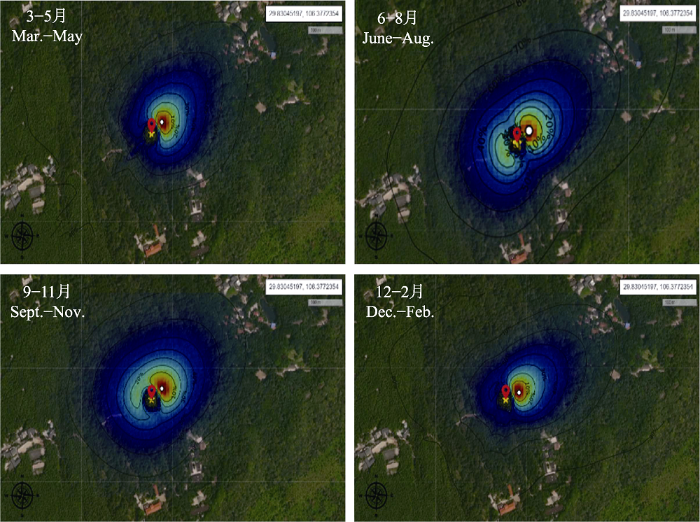
图2
2019-2020年重庆缙云山针阔混交林生态系统季节尺度的通量足迹图。
Fig. 2
Footprints of energy fluxes in a conifer-broadleaf mixed forest ecosystem in Jinyun Mountain, Chongqing, at four seasons during study period (2019-2020).
图3
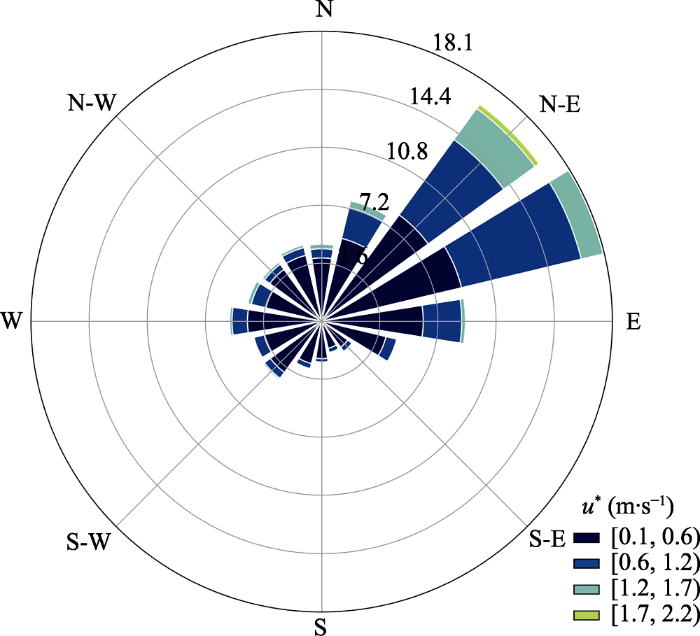
图3
重庆缙云山针阔混交林生态系统的全年风玫瑰图。N、E、S、W代表北方、东方、南方、西方4个方向。各圆环数值为某风向出现的次数占全年总观测次数的百分比(%)。u*, 摩擦风速。
Fig. 3
Wind rose diagram in a conifer-broadleaf mixed forest ecosystem in Jinyun Mountain, Chongqing. N, E, S, W is north, east, south and west. The value of each circle is the percentage (%) of the number of occurrences of a certain wind direction in the total number of observations throughout the year. u*, friction wind speed.
表1列出了通量数据贡献区平均距离, 该研究区通量数据贡献峰值距离通量塔平均82.21 m, 变异系数(CV)为2.38%。其中10%、30%、50%、70%和90%累计贡献区距离通量塔分别为27.37、69.58、110.50、153.90和229.63 m, CV分别为6.42%、3.68%、1.86%、1.42%和1.65%。90%累计贡献区距离最大, 10%累计贡献区距离最小, 贡献区距离均在正常范围内, 且不同月份间相差不大。
表1 重庆缙云山针阔混交林生态系统通量贡献区距离
Table 1
| 月份 Month | 通量贡献峰值距离 x_ peak (m) | 10%累积通量贡献的上风向距离 x_10% (m) | 30%累积通量贡献的上风向距离 x_30% (m) | 50%累积通量贡献的上风向距离 x_50% (m) | 70%累积通量贡献的上风向距离 x_70% (m) | 90%累积通量贡献的上风向距离 x_90% (m) |
|---|---|---|---|---|---|---|
| 1 | 79.40 | 24.45 | 66.90 | 110.25 | 149.57 | 229.57 |
| 2 | 79.57 | 24.92 | 69.06 | 110.64 | 152.73 | 228.86 |
| 3 | 84.63 | 29.05 | 72.34 | 110.32 | 154.73 | 231.81 |
| 4 | 83.44 | 28.64 | 71.32 | 108.77 | 152.55 | 228.55 |
| 5 | 85.51 | 29.35 | 73.10 | 111.48 | 156.35 | 224.24 |
| 6 | 80.69 | 27.70 | 68.97 | 105.19 | 151.53 | 229.02 |
| 7 | 84.39 | 28.97 | 72.14 | 110.01 | 154.30 | 231.16 |
| 8 | 83.02 | 29.87 | 69.39 | 113.44 | 155.11 | 238.37 |
| 9 | 82.44 | 27.27 | 67.91 | 113.56 | 155.25 | 227.61 |
| 10 | 82.01 | 25.72 | 69.55 | 110.87 | 151.65 | 229.24 |
| 11 | 81.29 | 26.50 | 63.50 | 110.85 | 155.83 | 223.50 |
| 12 | 80.12 | 26.01 | 70.80 | 110.58 | 157.22 | 233.62 |
| 平均值 Average | 82.21 | 27.37 | 69.58 | 110.50 | 153.90 | 229.63 |
| 变异系数 CV (%) | 2.38 | 6.42 | 3.68 | 1.86 | 1.42 | 1.65 |
CV, coefficient of variation; x_, upwind distance of cumulative flux contribution; x_peak, peak distance of flux contribution.
2.2 全年水汽通量各月日平均值变化特征
利用针阔混交林2019-2020年水汽通量数据得到逐日30 min的水汽通量数据, 在此基础上计算了逐月的水汽通量的平均日变化趋势(图4), 可以看出水汽通量基本为正值, 说明水汽由生态系统输向大气, 即缙云山针阔混交林是一个水汽源。总体日变化趋势曲线呈单峰形, 凌晨和夜间水汽流通量值稳定, 基本接近于0, 1、2、11和12月比较明显。从7:00-8:00水汽通量值上升, 12:00-14:00达到一天内的峰值, 6、7、8月比较明显, 一些月份还存在双峰变化趋势, 紧接着水汽通量逐渐下降, 18:00-19:00水汽通量值逐渐趋近于0, 之后数值浮动基本保持平稳。各月水汽通量最大值在1.960-6.623 mmol·m-2·s-1之间, 且不同的季节月份差异明显, 植被蒸散时间基本集中在7:00-19:00之间。8月的平均水汽通量值最大(6.623 mmol·m-2·s-1), 2月的平均水汽通量值最小(1.960 mmol·m-2·s-1)。各月水汽通量最小值在-0.001-0.623 mmol·m-2·s-1之间, 基本出现在凌晨或夜间。8月的平均水汽通量值(0.623 mmol·m-2·s-1)高于其他月份, 12月平均水汽通量值(-0.001 mmol·m-2·s-1)低于其他月份。
图4
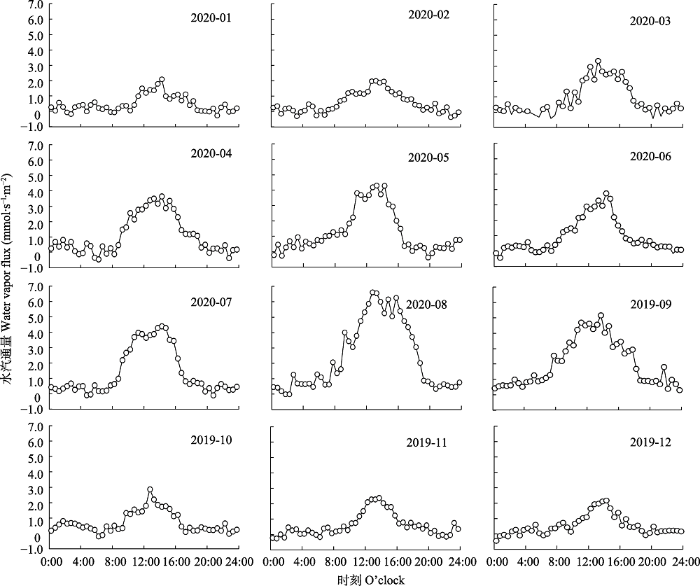
图4
2019-2020年重庆缙云山针阔混交林生态系统的各月水汽通量日平均值变化分布。
Fig. 4
Mean diurnal changes of monthly water vapor fluxes in a conifer-broadleaf mixed forest ecosystem in Jinyun Mountain, Chongqing, during study period (2019-2020).
2.3 全年水汽通量季节变化特征
对缙云山针阔混交林的水汽通量数据按照季节尺度分析变化趋势(图5)。从图5中可以看出缙云山针阔混交林水汽通量季节尺度的日变化趋势明显并呈单峰曲线。其中夏季的水汽通量变化规律性较强, 夏季平均水汽通量峰值为4.620 mmol·m-2·s-1, 其中最大值出现在14:00左右, 有双峰变化趋势; 春季和秋季水汽通量变化趋势相似, 春季平均水汽通量峰值为3.713 mmol·m-2·s-1, 秋季平均水汽通量峰值为3.151 mmol·m-2·s-1, 且春季的白天水汽通量曲线波动较多; 冬季水汽通量日变化趋势最低, 平均水汽通量峰值为2.077 mmol·m-2·s-1, 全年水汽通量受季节变化影响比较大, 不同季节平均水汽通量峰值排列: 夏季>春季>秋季>冬季。水汽输送时长为夏季(13.5 h) >春季(12 h) >秋季(11.5 h) >冬季(10 h)。夏季雨水较多, 植物生长旺盛, 地表蒸发和植被蒸腾都比较多, 所以平均水汽通量值大于其他季节。
图5
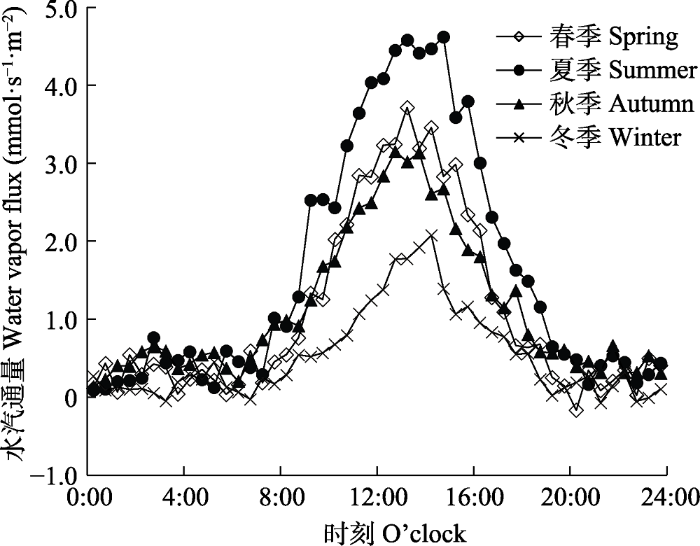
图5
2019-2020年重庆缙云山针阔混交林生态系统的水汽通量各季节平均日变化特征。
Fig. 5
Mean diurnal changes of quarterly water vapor fluxes in a conifer-broadleaf mixed forest ecosystem in Jinyun Mountain, Chongqing, during study period (2019-2020).
2.4 降水量和蒸散量的特征
根据2019年9月到2020年8月缙云山针阔混交林各月的降水量, 计算各月蒸散量总和。从图6中可以看出, 针阔混交林生态系统各月蒸散量变化有单峰趋势, 与气温季节变化相符合。1、3、4、9和12月的蒸散量与降水量相差不多, 个别月份降水量低于蒸散量, 1月份的降水量(21.45 mm)和蒸散量(32.12 mm)都最低, 2月的降水量比蒸散量高, 因为降水增大了空气和土壤湿度, 降低了温度, 所以蒸散量较低。5月开始进入雨季, 降水量最大(285.23 mm), 蒸散量也比较高, 5-8月降水量远大于其他月份。7月蒸散量最高(118.98 mm), 降水多的月份蒸散量也比较高。
图6
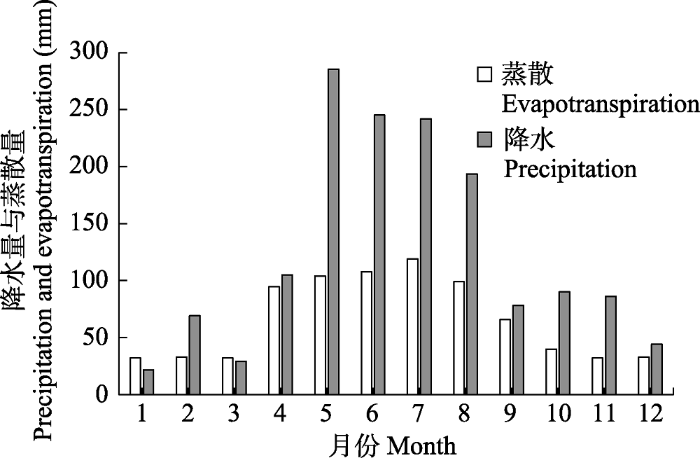
图6
2019-2020年重庆缙云山针阔混交林生态系统的降水量和蒸散量的对比。
Fig. 6
Contrasts between precipitation and evapotranspiration in a conifer-broadleaf mixed forest ecosystem in Jinyun Mountain, Chongqing, during study period (2019-2020).
结合表2得出降水量与蒸散量受季节影响明显, 缙云山针阔混交林各季节降水量对比表现为夏季>春季>秋季>冬季; 夏季降水量最高(680.52 mm), 占全年总降水量(1 489.18 mm)的46%, 其次就是春季, 降水量419.57 mm, 占全年降水量的28%; 秋季和冬季降水量分别是254.38和134.71 mm, 占全年降水量的17%和9%。各季节蒸散量表现为夏季>春季>秋季>冬季; 夏天蒸散量最大(325.53 mm), 占全年蒸散量(792.40 mm)的41%, 因为处于雨季, 降水量较多, 蒸散量也比较高; 春季和秋季蒸散量分别是230.96和137.77 mm, 占全年蒸散量的29%和17%; 冬季的蒸散量最小(98.14 mm), 占全年蒸散量的13%。下文将综合几个相近纬度不同生态系统的蒸散量与降水量进行对比, 并在讨论中展开说明。
表2 重庆缙云山针阔混交林生态系统样地各季度降水量与蒸散量及其所占比例
Table 2
| 季节 Season | 月份 Month | 降水 Precipitation | 蒸散 Evapotranspiration | ||
|---|---|---|---|---|---|
| 降水量 Precipitation (mm) | 比例 Proportion (%) | 蒸散量 Evapotranspiration (mm) | 比例 Proportion (%) | ||
| 春季 Spring | 3, 4, 5 | 419.57 | 28 | 230.96 | 29 |
| 夏季 Summer | 6, 7, 8 | 680.52 | 46 | 325.53 | 41 |
| 秋季 Autumn | 9, 10, 11 | 254.38 | 17 | 137.77 | 17 |
| 冬季 Winter | 12, 1, 2 | 134.71 | 9 | 98.14 | 13 |
| 全年 Full year | 1-12 | 1 489.18 | 100 | 792.40 | 100 |
2.5 环境因子对针阔混交林水汽通量的影响
2.5.1 净辐射与水汽通量
Rn是影响水汽通量变化的主要环境因子, 按照季节尺度对缙云山针阔混交林生态系统水汽通量与Rn的相关性进行了分析(图7)。通过分析发现, 水汽通量与Rn成正相关关系, 且不同季节相关性也有所不同。其中, 夏季的水汽通量与Rn的相关性最佳, R2为0.85; 其次是春季, R2为0.73; 秋季和冬季的水汽通量与Rn相应均较低, R2分别为0.23和0.14。夏季的水汽通量与Rn相关性高于其他季节, 是因为植物正处于生长季, 植物生理和化学活动旺盛, 叶面积指数大, 植物叶片蒸腾比较强。另外, 夏季降水量充足, Rn高会导致气温升高, 促进地表水分蒸发。冬季相关性低的原因是冬季的水汽通量普遍偏低, Rn与气温也低, 降水量少, 植物的蒸腾量与地表水分蒸发量也比较少。
图7
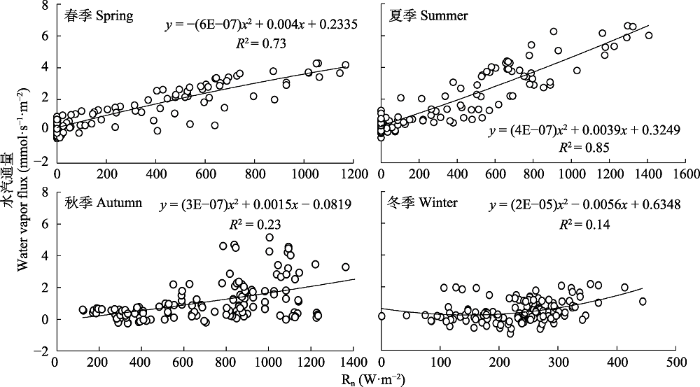
图7
重庆缙云山针阔混交林生态系统各季度水汽通量对净辐射(Rn)的拟合曲线。
重庆缙云山针阔混交林生态系统各季度水汽通量对净辐射(Rn)的拟合曲线。
Fig. 7
Fitting curves of water vapor fluxes to net radiations (Rn) within a conifer-broadleaf mixed forest ecosystem in Jinyun Mountain, Chongqing.
2.5.2 气温与水汽通量
不同季节气温有所不同, 气温直接受辐射影响, 气温升高可以促进植物叶片蒸腾量和地表水分蒸发量。另外气温变化可以间接影响其他环境因子, 对水汽传输造成影响, 从而影响水汽通量的变化(李菊等, 2006)。所以气温和水汽通量的相关关系与Rn相似。利用2019年9月到2020年8月水汽通量数据, 按照季节尺度与气温进行相关性拟合分析(图8)。结果显示, 缙云山针阔混交林生态系统的水汽通量与气温呈正相关关系。夏季的R2最高(0.60), 其次是秋季(0.45)和春季(0.44), 两季的相关性基本一致, 冬季的水汽通量与气温相关性较差, R2为0.25。夏季的水汽通量与气温相关性最好, 因为夏季气温高使植物叶片蒸腾量和地表水分蒸发量增加, 水汽通量值较大。春季和秋季气温要低于夏季且昼夜温差变化较大, 气候变化复杂, 影响了水汽通量值。所以春秋两季的水汽通量与气温拟合相关性低于夏季。冬季气温与水汽通量相关性较差, 因为冬天气温低, 降水较少, 影响水汽通量变化的因素较多, 所以拟合相关性差。
图8
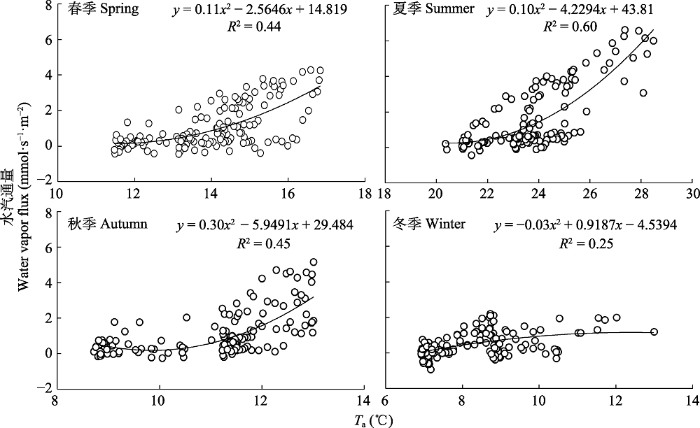
图8
重庆缙云山针阔混交林生态系统各季度水汽通量对气温(Ta)的拟合曲线。
重庆缙云山针阔混交林生态系统各季度水汽通量对气温(Ta)的拟合曲线。
Fig. 8
Fitting curves of water vapor fluxes to air temperatures (Ta) within a conifer-broadleaf mixed forest ecosystem in Jinyun Mountain, Chongqing.
2.5.3 饱和水汽压差与水汽通量
图9
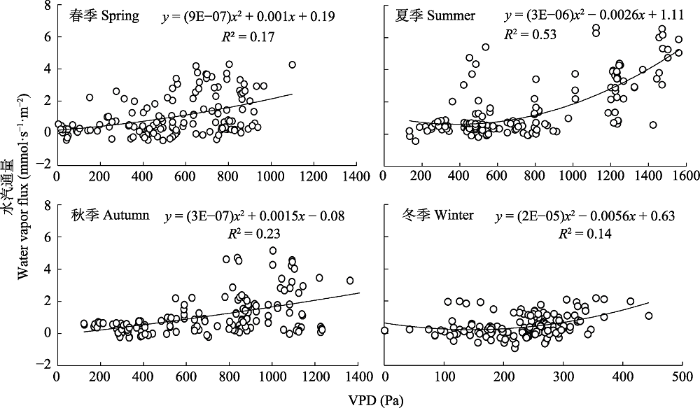
图9
重庆缙云山针阔混交林生态系统各季节水汽通量与饱和水汽压差(VPD)的拟合曲线。
Fig. 9
Fitting curves of water vapor fluxes to vapor pressure deficits (VPD) within a conifer-broadleaf mixed forest ecosystem in Jinyun Mountain, Chongqing.
2.5.4 风速(Ws)与水汽通量
Ws对水汽通量的影响比较复杂, 与Ws的强弱、周围环境状况和当时的气候状况有很大关系。针阔混交林生态系统各季节水汽通量与Ws呈负相关关系(图10), 水汽通量值随着Ws增大而逐渐减少, 并且Ws小于1 m·s-1时, 各季节均没有水汽值, Ws 1-2 m·s-1时, 各季节水汽通量值最佳。夏季拟合的相关性最佳, R2为0.61, 因为夏季气温高, 降水充足, 微风能够促进植被叶片蒸腾和地表水分蒸发。冬季拟合相关性最差, R2为0.24。因为冬季气温低, 降水量少, 影响水汽通量因素较多, Ws对水汽影响较小, 所以相关性比较差。水汽通量主要集中在Ws 1-3 m·s-1内, Ws超过3 m·s-1, 水汽通量值基本趋于0。
图10
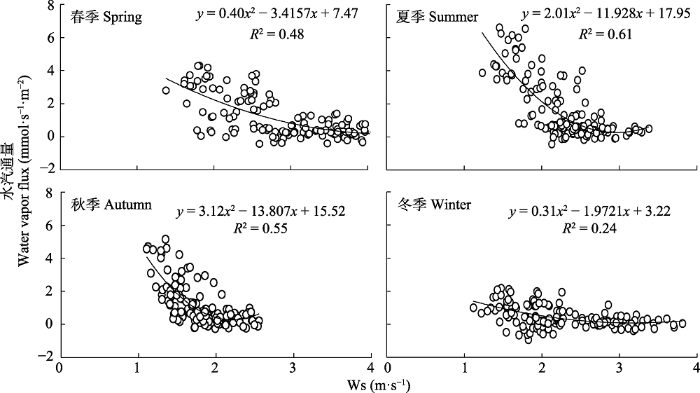
图10
重庆缙云山针阔混交林生态系统各季度水汽通量对风速(Ws)的拟合曲线。
Fig. 10
Fitting curves of water vapor fluxes to wind speed (Ws) within a conifer-broadleaf mixed forest ecosystem in Jinyun Mountain, Chongqing.
3 讨论
3.1 涡度相关技术在缙云山针阔混交林生态系统的数据质量和适用性
能量闭合、通量足迹分析和风玫瑰图可以用来讨论涡度相关技术在缙云山针阔混交林生态系统的有效性和适用性。从能量闭合率来看, 该研究区能量闭合率为0.76, 处于国际通量网站点的平均闭合率0.55-0.99 (Wilson et al., 2002)、ChinaFLUX站点的平均闭合率0.49-0.81 (李正泉等, 2004)和涡度相关系统对山区林地通量观测的能量闭合率0.70-0.90 (Wilson et al., 2002; Kumagai et al., 2005)范围之内, 且处于偏上的水平。本研究的能量闭合率大于太湖生态系统的能量闭合率0.59 (王伟等, 2017), 九寨沟针阔叶混交林生态系统能量闭合率0.71 (李桐等, 2018), 常绿落叶阔叶混交林生态系统的能量闭合率0.69 (方成圆等, 2016)。说明研究区能量闭合较高, 涡度相关技术适用于研究区, 且数据质量较好, 可信度较高。从图2和图3可以看出, 研究区全年主风向以东北风为主, 与千烟洲人工林(李菊等, 2006)相似。全年尺度上通量贡献来源基本不变, 风向稳定。相比于农田生态系统, 森林山地生态系统的通量贡献区偏小, 是因为森林山地下垫面不平整, 附近的大气在摩擦作用下产生环流, 导致通量贡献区偏小(周成等, 2006; 吴东星等, 2017; 刘璇等, 2019)。综合图1-3来看, 涡度相关技术在研究区的适用性强。
3.2 缙云山针阔混交林生态系统水汽通量变化特征
针阔混交林全年水汽日变化特征基本为单峰型曲线, 与其他研究(李菊等, 2006; 刘玉莉等, 2014; 张璇, 2019; 耿思文等, 2021)得出的结果一致。夜间稳定在0, 是因为夜晚为林内温度最低时刻, Rn也比较低, 地表蒸发和植物蒸腾作用比较弱; 12:00-14:00达到峰值, 该时间段温度较高, Rn强, 植物蒸腾和地表蒸发比较多, 水汽通量也最大; 18:00-19:00水汽通量值又逐渐趋近于0。这与刘玉莉等(2014)、牛晓栋等(2016)、李菊等(2006)、张娜等(2010)和张晓娟(2016)等的不同生态系统的日变化研究结果一致。各月水汽通量平均日变化范围在-0.001-6.623 mmol·m-2·s-1, 与神农架大九湖泥炭生态系统(彭凤姣等, 2017)相似。一些月份在午间出现双峰趋势(牛晓栋等, 2016), 这是植物的“光合午休”造成的。因为当天中午光照强度过大, 温度升高, 植物蒸腾失水较多, 导致植物叶片被迫关闭气孔, 水汽通量值降低(高冠龙等, 2020)。从季节尺度来看, 夏季温度高, 植物生理活动最活跃, 蒸腾和蒸发较多, 水汽通量也较高(李菊等, 2006); 春秋两季水汽通量日变化大致相同, 均低于夏季, 春季是植物生长活动最为强烈的时候, 所以叶片蒸腾比较强, 但温度较低, Rn较低; 秋季温度降低, 植物生理和化学活动减弱, 蒸腾也开始减少, 秋季水汽通量日变化较低。冬季温度为一年中最低, Rn也是一年中最低, 降水较少, 植物蒸腾和地表蒸发很少, 所以水汽通量为全年最低(张娜等, 2010; 刘玉莉等, 2014)。
3.3 缙云山针阔混交林生态系统蒸散发和降水量特征
缙云山针阔混交林生态系统年降水量1 489.18 mm, 蒸散总量为792.40 mm, 针阔混交林生态系统年蒸散量占同期降水量的53.21%, 针阔混交林植被覆盖度高, 一定程度减少了地表水分蒸发, 保持水分在林中循环。与相似纬度且气候类型接近的不同生态系统站点对比, 结果(表3)显示, 湖南桃源水稻农田、广东鼎湖山常绿阔叶林、江西千烟洲人工针叶林、江苏天目湖毛竹(Phyllostachys edulis)林生态系统和福建云霄红树林生态系统的全年蒸散量分别占全年降水量的65.21%、55.94%、51.46%、48.30%和69.08%。不同生态系统年蒸散总量差异较大, 针阔混交林生态系统年蒸散总量高于江西千烟洲人工林生态系统(李菊等, 2006)和江苏天目湖毛竹林生态系统(Tang et al., 2014), 仅次于广东鼎湖山常绿阔叶林生态系统(张娜等, 2010), 远低于福建云霄红树林湿地生态系统(林珮文, 2019)和湖南桃源水稻农田生态系统(尹春梅等, 2020)。因为福建云霄红树林湿地和湖南桃源水稻农田生态系统长期处于湿润或积水状态, 植被覆盖度低, 水分蒸散占比高。不同生态系统年蒸腾总量为湿地>常绿阔叶林>针阔混交林>农田>毛竹林>人工针叶林, 与郭瑞萍和莫兴国(2007)以及彭凤姣等(2017)的结论相似, 即湿地>森林>农田。
表3 不同生态系统植被蒸散量对比
Table 3
| 站点 Site | 生态类型 Ecosystem type | 观测年份 Observation year | 降水量 Precipitation (mm) | 蒸发量 Evaporation (mm) | 文献 Reference |
|---|---|---|---|---|---|
| 湖南桃源 Taoyuan, Hunan | 水稻田 Rice field | 2014 | 1 150.00 | 705.00 | Yin et al., 2020 |
| 广东鼎湖山 Dinghushan, Guangdong | 常绿阔叶林 Evergreen broad-leaved forest | 2009 | 1 716.00 | 960.00 | Zhang et al., 2010 |
| 江西千烟洲 Qianyanzhou, Jiangxi | 人工针叶林 Artificial coniferous forest | 2004 | 1 323.60 | 736.10 | Li et al., 2006 |
| 江苏天目湖 Tianmuhu, Jiangsu | 毛竹林 Bamboo forest | 2013 | 1 543.10 | 745.30 | Tang et al., 2014 |
| 福建云霄 Yunxiao, Fujian | 红树林湿地 Mangrove wetland | 2008 | 1 714.50 | 1 184.40 | Lin, 2019 |
| 重庆缙云山 Jinyunshan, Chongqing | 针阔混交林 Conifer-broadleaf mixed forest | 2019-2020 | 1 489.18 | 792.40 | 本研究 This study |
3.4 环境因子对水汽通量的影响
缙云山针阔混交林水汽通量与Rn正相关, 夏季相关性最佳, 其次是春季和秋季, 冬季在四季中相关系数最小。在其他生态系统水汽通量与Rn相关关系的研究中, 天目山常绿阔叶林是夏季的相关系数(R2 = 0.50)最大(方成圆等, 2016), 江西千烟洲是晴天的相关系数(R2 = 0.55)最大(李菊等, 2006), 安吉毛竹林是夏季的相关系数(R2 = 0.61)最大(刘玉莉等, 2014), 海南橡树林雨季(5-10月)的相关系数(R2 = 0.76)最大(张晓娟等, 2015), 神农架大九湖泥炭湿地夏季的相关系数(R2 = 0.83)最大(翁闻畅等, 2020); 水汽通量与Rn相关系数也是夏季最高(R2 = 0.85), 高于其他生态系统水汽通量与Rn相关系数。缙云山针阔混交林R2最低是0.14, 高于天目山常绿阔叶林(0.13)、安吉毛竹林(0.05)和太湖源雷竹林(P. violascens)(0.02); 低于海南橡胶林(0.30)、神农架大九湖泥炭湿地(0.45)。所有台站的最低R2均出现在冬季, 因为冬季水汽通量普遍偏低, 外界气温低, 降水量也较少, 植物生理活动几乎停止, 植物蒸腾和地表水分蒸发也比较少。夏季雨水充足, 气温较高, Rn也高, 植物叶片蒸腾旺盛, 地表水分蒸发增多, 所以夏季的水汽通量与Rn的相关性要好于其他季节。
缙云山针阔混交林水汽通量与VPD正相关, 研究区的夏季R2最大, 为0.53, 水汽通量与VPD有显著相关性且大于海南橡胶林(0.36)(张晓娟等, 2015)、安吉毛竹林(0.31)(刘玉莉等, 2014)和神农架大九湖泥炭湿地(0.41)(翁闻畅等, 2020)等地区。原因有两方面, 一是针阔混交林植被叶片蒸腾作用与VPD成正比, 从而叶片蒸腾也与VPD正比(Anthoni et al., 1999); 二是地表水分蒸发与VPD成正比, VPD越大, 蒸发作用也就越强。夏季气温高, 降水多, 正是针阔混交林旺盛生长季, 需水量高, 外界大气水汽压差越大, 叶片蒸腾量和地表蒸发也越高, 相关性也就越好。
4 结论
缙云山2019年9月到2020年8月针阔混交林生态系统水汽通量变化特征为: 平均日变化范围为-0.001-6.623 mmol·m-2·s-1, 研究期内水汽通量基本为正值, 说明该生态系统为水汽源。水汽通量在各月日均变化上有明显的单峰趋势, 7:00-8:00水汽通量值逐渐上升, 12:00-14:00达到峰值, 18:00-19:00水汽通量值趋近于0; 8月水汽通量值最大(6.623 mmol·m-2·s-1), 12月最小(-0.001 mmol·m-2·s-1)。在季节尺度上水汽通量也呈现单峰趋势, 夏季水汽通量变化特征最明显, 冬季水汽通量变化最差。
针阔混交林研究期内蒸散总量(792.40 mm)占降水总量(1 489.18 mm)的53.21%, 夏季蒸散量(325.53 mm)和降水量(680.52 mm)最高, 占全年蒸散量和降水量的41%和46%。在季节尺度降水量和蒸散量均表现为: 夏季>春季>秋季>冬季, 与不同生态系统站点对比中得出湿地>森林>农田的结论。
缙云山针阔混交林生态系统水汽通量与Rn、气温和VPD环境因子正相关, Ws与水汽通量负相关, 均为夏季的R2最高, 分别为0.85、0.60、0.53和0.61。因为夏季是针阔混交林生长季, 气温高, 降水多, 促进植物叶片蒸腾和地表水分蒸发。VPD对水汽通量相关性稍低, 这与缙云山常年雾天较多, 湿度较大有关, Ws对水汽影响受其他因子干扰较多, 综合来看, Rn、气温是影响水汽通量的主要气象因子。
参考文献
Evapotranspiration information reporting: I. factors governing measurement accuracy
DOI:10.1016/j.agwat.2010.12.015 URL [本文引用: 1]
Carbon and water vapor exchange of an open-canopied ponderosa pine ecosystem
DOI:10.1016/S0168-1923(99)00029-5 URL [本文引用: 1]
Energy flux and balance analysis of evergreen and deciduous broad-leaved mixed forest in Tianmu Mountain during growing season
天目山常绿、落叶阔叶混交林生长季能量通量及平衡分析
Stomatal and no-stomatal limitations to photosynthesis of Populus euphratica leaves under natural conditions
自然条件下胡杨叶片光合作用的气孔、非气孔限制
Effects of meteorological factors on daytime transpiration of citrus trees
气象因素对柑桔树植株日间蒸腾作用的影响研究
Water vapor flux exchange of rubber forest stand in Hainan Danzhou and its response to environmental factors
海南儋州地区橡胶林生态系统水汽通量变化特征及其对环境因子的响应
Differences of evapotranspiration on forest, grassland and farmland
森林、草地和农田典型植被蒸散量的差异
Carbon storage of young conifer and broadleaf mixed forest on a Cunninghamia lanceolata site in south subtropics
南亚热带杉木林皆伐迹地幼龄针阔混交林生态系统碳储量
Vapor flux on bumpy surfaces: condensation and transpiration on leaves
DOI:10.1021/acs.langmuir.1c00473 URL [本文引用: 3]
A simple two-dimensional parameterisation for Flux Footprint Prediction (FFP)
DOI:10.5194/gmd-8-3695-2015 URL [本文引用: 1]
Effects of tree-to-tree and radial variations on sap flow estimates of transpiration in Japanese cedar
DOI:10.1016/j.agrformet.2005.11.007 URL [本文引用: 2]
Studies on water vapor flux characteristic and the relationship with environment factors over a planted coniferous forest in Qianyanzhou station
DOI:10.1016/S1872-2032(06)60040-1 URL [本文引用: 14]
千烟洲人工林水汽通量特征及其与环境因子的关系
Characteristics of energy balance in a mixed forest in Jiuzhaigou Valley
九寨沟针阔混交林能量平衡特征
Effects of forest on water circle on the Loess Plateau
黄土高原森林植被对陆地水循环影响的研究
Evaluation of energy balance closure of ChinaFLUX observation network
中国通量观测网络(ChinaFLUX)能量平衡闭合状况的评价
Seasonal and diurnal variations of the exchange of water vapor and CO2 between the land surface and atmosphere in the semi-arid area
半干旱地区地气界面水汽和二氧化碳通量的日变化及季节变化
Energy flux variation characteristics and closure degree in larch forest
兴安落叶松林能量通量变化特征及闭合度研究
Water vapor flux variation characteristic and the relationship with its environment factors in Phyllostachys edulis forest in Anji
安吉毛竹林水汽通量变化特征及其与环境因子的关系
Eddy covariance measurements of ozone flux above and below a southern subtropical forest canopy
DOI:10.1016/j.scitotenv.2021.148338 URL [本文引用: 1]
Analysis and evolution study to national water cycle flux
全国水循环通量解析及其演进研究
Water vapor flux features of an evergreen and deciduous broadleaf mixed forest in Mount Tianmu area
天目山常绿落叶阔叶混交林生态系统水汽通量特征
Towards a standardized processing of net ecosystem exchange measured with eddy covariance technique: algorithms and uncertainty estimation
DOI:10.5194/bg-3-571-2006 URL [本文引用: 1]
Characteristics of water vapor flux and their ecological significance in the peat wetlands of Dajiuhu, Shennongjia
神农架大九湖泥炭湿地水汽通量特征及生态意义
Fluxes of carbon dioxide and water vapour over Scots pine forest and clearing
DOI:10.1016/S0168-1923(02)00022-9 URL [本文引用: 1]
How is water-use efficiency of terrestrial ecosystems distributed and changing on Earth?
DOI:10.1038/srep07483
PMID:25500908
[本文引用: 2]

A better understanding of ecosystem water-use efficiency (WUE) will help us improve ecosystem management for mitigation as well as adaption to global hydrological change. Here, long-term flux tower observations of productivity and evapotranspiration allow us to detect a consistent latitudinal trend in WUE, rising from the subtropics to the northern high-latitudes. The trend peaks at approximately 51 degrees N, and then declines toward higher latitudes. These ground-based observations are consistent with global-scale estimates of WUE. Global analysis of WUE reveals existence of strong regional variations that correspond to global climate patterns. The latitudinal trends of global WUE for Earth's major plant functional types reveal two peaks in the Northern Hemisphere not detected by ground-based measurements. One peak is located at 20 degrees similar to 30 degrees N and the other extends a little farther north than 51 degrees N. Finally, long-term spatiotemporal trend analysis using satellite-based remote sensing data reveals that land-cover and land-use change in recent years has led to a decline in global WUE. Our study provides a new framework for global research on the interactions between carbon and water cycles as well as responses to natural and human impacts.
Characteristics of carbon fluxes and their response to environmental factors in ecosystems of mixed coniferous and broad-leaved forests in Jinyun Mountain
缙云山针阔混交林碳通量变化特征及影响因子研究
Mechanistic analysis of the observed energy imbalance of Lake Taihu
太湖生态系统能量闭合特征及其影响因素
Water vapor flux characteristics and their relationship with environmental factors in the subalpine peat wetlands of Dajiuhu, Shennongjia
神农架大九湖亚高山泥炭湿地水汽通量特征及其与相关环境因子的关系
Energy balance closure at FLUXNET sites
DOI:10.1016/S0168-1923(02)00109-0 URL [本文引用: 4]
Flux footprint of winter wheat farmland ecosystem in the North China Plain
DOI:10.13287/j.1001-9332.201711.029
[本文引用: 1]
The flux data of winter wheat farmland ecosystem observed by eddy covariance system in the North China Plain from 2013 to 2014 were used to combine with the footprint model FSAM. The temporal and spatial distributions of footprint of winter wheat farmland ecosystem in the North China Plain were analyzed. The differences of footprint distribution in different atmospheric stratification and growing seasons were contrastively studied. The results indicated that in the predominant wind direction, the source areas of stable atmospheric stratification were larger than unstable atmospheric stratification during the growing season of winter wheat. When the wind direction was between 0°-90°, the source area of stable atmospheric stratification was about 17.8 m longer than unstable atmospheric stratification in initial growing season. The source area of stable atmospheric stratification was about 11 m longer than unstable atmospheric stratification in late growing season. The location of the maximum flux footprint in initial growing season was 15 m (stable atmospheric stratification) and 12.4 m (unstable atmospheric stratification) further away from the observing tower than late growing season, respectively. Meanwhile, the location of the maximum flux footprint in stable atmospheric stratification was 5 m (initial growing season) and 2.4 m (late growing season) further away from the observing tower than unstable atmospheric stratification, respectively. When the wind direction was non-dominant between 90°-180°, the location of the maximum flux footprint in diffe-rent growing seasons and atmospheric stratification were 67.8 and 53.4, 47.0 and 30.8 m away from the observing tower, respectively. When the wind direction was between 270°-360°, the location of the maximum flux footprint in different growing seasons and atmospheric stratification were 58.8 and 42.0, 41.1 and 33.1 m away from the observing tower, respectively. The flux information was mainly from the northeast, southwest and southeast, which accounted for 35.4%, 32.5% and 19.4% of the whole gro-wing season scale, respectively. The major changes of flux footprint in the whole gro-wing season of winter wheat were observed from 16.0 to 173.8 m in the northeast and from 14.7 to 209 m in the southwest. The flux information was all from the farmland ecosystem. The characteristics of diurnal variations of flux footprint in two typical dates were obvious. The source area changed with atmospheric stratification and wind direction. The flux information was all from farmland ecosystem at night, while little flux information was from residential area and orchard at daytime. The quantitative results of this study could provide basis for the research of flux footprint in farmland ecosystem.
华北平原冬小麦农田生态系统通量贡献区
DOI:10.13287/j.1001-9332.201711.029
[本文引用: 1]
利用2013—2014年涡度相关系统观测的华北平原冬小麦农田生态系统通量数据,结合通量贡献区模型FSAM,分析华北平原冬小麦农田生态系统通量贡献区的时空分布特点,对比研究不同大气稳定层结条件和生长期内通量贡献区的分布差异.结果表明: 在主风风向上,冬小麦整个生育期内大气稳定条件下的通量贡献区范围大于不稳定条件下的贡献区范围.在0°~90°主风风向上,生长初期稳定条件下通量贡献区范围比不稳定条件下大17.8 m左右,生长末期稳定条件下的通量贡献区范围比不稳定条件下大11 m左右.生长初期的通量贡献最大值点位置比生长末期距观测点位置远15 m(大气稳定条件)和12.4 m(大气不稳定条件);通量贡献最大值点在稳定条件下比不稳定条件下距观测点位置远5 m(生长初期)和2.4 m(生长末期).在非主风风向上,当风向为90°~180°时,生长初期和生长末期不同大气条件下的最大通量值分别位于距观测点的67.8、53.4和47.0、30.8 m.当风向为270°~360°时,生长初期和生长末期不同大气条件下的最大通量值位于距观测点的58.8、42和41.1、33.1 m.在整个生育期尺度上,观测塔的通量信息主要来自东北、西南和东南方向,其所占比例分别为35.4%、32.5%和19.4%.冬小麦整个生育期内通量贡献区的主要变化发生在观测点东北方向16.0~173.8 m和西南方向14.7~209 m,通量信息全部来源于农田生态系统.两个典型日期的通量贡献区日变化特征明显,通量贡献区范围随大气稳定条件和风向改变而发生变化.夜晚通量信息全部来源于农田生态系统,白天少部分通量信息来源于居民区和果园.本文的定量化结果可为农田生态系统通量贡献区的研究提供依据.
Comparison of eddy covariance and BREB methods in determining forest evapotranspiration-Case study on broad-leaved Korean pine forest in Changbai Mountain
涡动相关法与波文比-能量平衡法测算森林蒸散的比较研究--以长白山阔叶红松林为例
Spatial distribution of vegetation and carbon density in Jinyun Mountain Nature Reserve based on RS/GIS
DOI:10.5846/stxb201108021134 URL [本文引用: 1]
基于RS/GIS的重庆缙云山自然保护区植被及碳储量密度空间分布研究
Comparison of the gap filling methods of evapotranspiration measured by eddy covariance system
涡动相关仪观测蒸散量的插补方法比较
DOI:10.11867/j.issn.1001-8166.2009.04.0372
[本文引用: 1]
涡动相关仪在长时间连续观测中,观测数据会有不同程度的缺失。应用6种不同的插补方法(平均昼夜变化法MDV,非线性回归方法NLR,动态线性回归方法DLR,查表法LUT,FAO-PM方法,HANTS方法)对北京密云站2007年涡动相关仪观测蒸散量数据进行了插补。结果表明: LUT方法在不同数据缺失时均得到较好结果(均方差小于8 W/m<sup>2</sup>);MDV和NLR方法更适合于短时间数据缺失的插补; DLR和FAO-PM方法在观测数据出现连续波动时插补结果较差。由LUT、DLR、NLR、HANTS、FAO-PM方法得到的年蒸散量分别为395.8 mm、409.9 mm、393.5 mm、390.7 mm、399.4 mm,差异在2.3~19.2 mm之间变化。对比分析了LUT方法得到的年蒸散量(潜热通量)与净辐射、降水量以及LAS观测潜热通量间的变化规律,表明插补结果合理。
A temperature prediction correction method for calculating surface soil heat flux based on soil temperature and humidity data
一种基于土壤温湿资料计算地表土壤热通量的温度预报校正法
A long-term monitoring dataset of soil moisture content under differe utilization modes of red soil slope land in Taoyuan Agroecology Research Station, 2004-2014
2004-2014年桃源站红壤坡地不同利用方式下土壤含水量长期监测数据集
Interannual variability of gross primary productivity at global FLUXNET sites and its driving factors
全球FLUXNET站点总初级生产力的年际变化及其主导因子解析
Construction and progress of Chinese terrestrial ecosystem carbon, nitrogen and water fluxes coordinated observation
DOI:10.1007/s11442-016-1300-5
[本文引用: 1]
Eddy Covariance technique (EC) achieves the direct measurement on ecosystem carbon, nitrogen and water fluxes, and it provides scientific data for accurately assessing ecosystem functions in mitigating global climate change. This paper briefly reviewed the construction and development of Chinese terrestrial ecosystem flux observation and research network (ChinaFLUX), and systematically introduced the design principle and technology of the terrestrial ecosystem carbon, nitrogen and water fluxes coordinated observation system of ChinaFLUX. In addition, this paper summarized the main progress of ChinaFLUX in the ecosystem carbon, nitrogen and water exchange and environmental controlling mechanisms, the spatial pattern of carbon, nitrogen and water fluxes and biogeographical mechanisms, and the regional terrestrial ecosystem carbon budget assessment. Finally, the prospects and emphases of the terrestrial ecosystem carbon, nitrogen and water fluxes coordinated observation of ChinaFLUX are put forward to provide theoretical references for the development of flux observation and research in China.
Progresses and prospects of Chinese terrestrial ecosystem flux observant and research network (ChinaFLUX)
中国陆地生态系统通量观测研究网络(ChinaFLUX)的主要进展及发展展望
DOI:10.11820/dlkxjz.2014.07.005
[本文引用: 1]
基于微气象学理论的涡度相关通量观测技术实现了对生态系统尺度的生产力、能量平衡和温室气体交换等功能和过程的直接测定,特别是全球尺度通量塔观测网络的联合观测是实现从生态现象观察和生态要素观测跨越到全球尺度生态系统功能状态变化观测的重大突破。本文回顾了中国陆地生态系统通量观测研究网络(ChinaFLUX)的创建及发展历程,系统介绍了ChinaFLUX的科学目标和设计理念、观测技术体系、观测数据的标准化处理及长期积累;综合评述了ChinaFLUX在陆地生态系统碳—氮—水的收支评估和交换过程的环境响应、碳通量时空格局及其形成机制等方面所取得的主要研究进展。最后,在探讨未来全球尺度通量塔观测网络发展趋势的基础上,提出了ChinaFLUX的主要发展方向、关键科学问题与未来工作重点,为中国通量观测研究事业的进一步发展提供理论参考。
Rapid reduction in ecosystem productivity caused by flash droughts based on decade-long FLUXNET observations
DOI:10.5194/hess-24-5579-2020 URL [本文引用: 1]
Nutrient characteristics in incident rainfall, throughfall, and stemflow in monsoon evergreen broad-leaved forest at Dinghushan
鼎湖山季风常绿阔叶林大气降雨、穿透雨和树干流的养分特征
Water vapor flux exchange and its environmental factors in a tropical rubber plantation ecosystem in Hainan Island
海南岛橡胶林生态系统水汽通量及其影响因子研究
