


蒸散发是陆地生态系统水循环的核心, 是驱动生态系统变化的关键过程。蒸散发与生态系统之间强烈的相互反馈作用使得蒸散发对气候变化的响应成为全球生态系统研究的热点问题。蒸散发是一个涉及大气、土壤、植被等并且与天气、气候密切相关的复杂过程(邓兴耀等, 2017; 张明明, 2019; 田晓辉等, 2020), 对生态系统水热平衡和水循环有重要作用(Wever et al., 2002)。在干旱生态系统中, 蒸散发是最主要的水分耗散(邓兴耀等, 2017), 有研究表明全球约60%的年降水量通过蒸散发形式返回大气(de Dios et al., 2015), 这一过程通过对降雨和潜热通量的响应, 间接影响地面温度, 对区域气候特征起到重要的调节作用(Ainsworth & Rogers, 2007; Li et al., 2007; 祁栋林等, 2015)。蒸散发的观测研究成为国内外气象、地学、水文学界学者关心的焦点问题之一(彭焕华等, 2016; 沈振西和付刚, 2016; 吴方涛等, 2018)。目前, 对蒸散发测定和估算的方法较多, 针对蒸散发获取的精确性、地区适用性问题, 国内外学者在测量、估算方法上做了大量尝试和改进(王飞宇等, 2017; 牛忠恩等, 2019; 李霞等, 2020; 刘小华等, 2020; 邱丽莎等, 2020)。青藏高原地处我国西北干旱半干旱地区, 精确测定和估算该地区沼泽湿地的蒸散发有助于科学了解青藏高原高寒沼泽湿地生态系统的水循环特征及其影响因子, 对评价青藏高原生物地球化学循环对全球变化的响应和反馈具有重要的科学意义。经过20多年的发展, 涡动相关法以物理学基础坚实、测量精度高、不破坏下垫面的优点, 自20世纪80年代开始, 被广泛应用于测量大气与地表的物质和能量交换(温学发等, 2004; 刘晨峰等, 2009; 陈世苹等, 2020)。
蒸散发与气象因子之间关系复杂呈非线性, 并且在通量观测过程中, 由于仪器故障、天气状况、大气稳定度和供电系统故障等因素, 会产生数据缺失。据统计, 在欧洲通量网和美洲通量网的观测中, 蒸散发数据的平均缺失率高达31% (Falge et al., 2001), 给通量塔数据的应用带来困难。因此, 如何有效地对涡度相关仪的蒸散发数据进行插补, 以获得较为完整、可靠的数据集, 成为当前亟待解决的问题。通过对观测数据的分析, 缺失数据可以分为短时间缺失(30 min)和长时间缺失(日缺失)。短时间数据缺失对现有的数据插补方法比较友好, 但是针对长时间数据缺失, 传统的插补方法在分析这些数据时遭到挑战, 插补精度有限。机器学习算法越来越多地运用于各个生产行业, 其原理是利用已有的数据训练出相应模型, 并通过模型对实际指标进行评估。它的存在使得许多分析预测类的研究在大大降低了实际测量成本的前提下还能得到准确的结果。针对上述蒸散发不确定性的研究现状, 本研究基于涡度相关系统观测的蒸散发通量数据进行机器学习算法(多元线性回归、决策树、随机森林、支持向量回归、多层感知机)训练(李严明, 2019), 使用交叉验证进行随机森林算法超参数调优, 找出对于蒸散发具有较高精度的插补方法, 以期更有利于此方法在生态学中的广泛应用。
1 材料和方法
1.1 研究区概况与数据来源
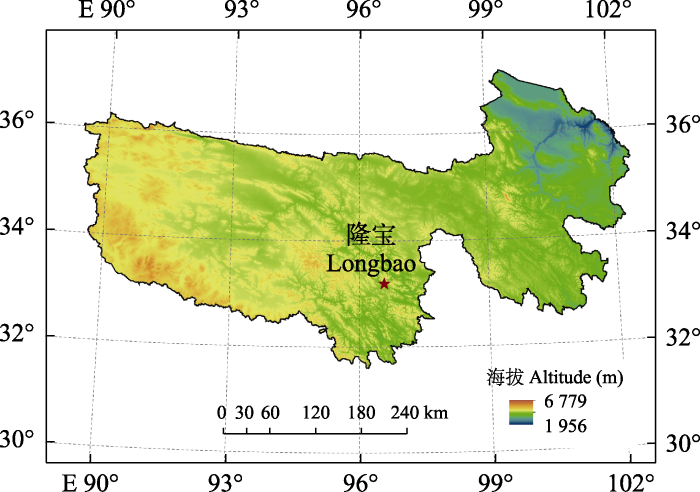
试验地位于中国气象局青海高寒生态气象野外科学试验基地隆宝试验站(简称隆宝站) (图1)。隆宝站位于青海省玉树州玉树市西北部的隆宝湿地自然保护区内, 海拔4 167 m, 位于96.55° E, 33.2° N, 年平均气温-0.4 ℃, 年降水量731 mm, 下垫面植被类型为典型的高寒湿地。样地植物群落建群种为莎草科植物, 主要牧草种类有西藏嵩草(Kobresia tibetica)、高山嵩草(K. pygmaea)、矮生嵩草(K. humilis), 样地土壤类型以高寒沼泽土为主。隆宝试验站始建于2011年, 其微气象观测系统于2011年建站完成后投入使用, 涡度通量观测设备于2018年7月建成并投入使用。在隆宝站固定样方建立了2.5 m高观测塔, 并安装一套开路式涡度相关系统(LI-7500A, LICOR, Logan, USA), 数据采集器采样频率为10 Hz, 收集并储存30 min通量数据平均值。同时, 在涡度相关系统附近安装了一套自动气象站用于气象环境因子的同步测定, 主要观测项目包括太阳总辐射、光合有效辐射、空气温湿度、风速、风向、土壤温度和降水量等。
图1
本研究选取隆宝站2019年1-10月涡度相关系统所观测的原始数据(其他观测时段缺测), 并使用EddyPro 6.0软件进行了蒸散发通量的计算, 在计算过程中同时进行了坐标旋转、WPL校正、光谱校正、时间滞后补偿、质量控制等(得到采样周期为30 min的通量数据产品, 并对通量数据产品进行了初步的质量控制)。在通量观测过程中, 由于仪器故障、天气状况、大气稳定度和供电系统故障等因素, 会产生观测数据缺失, 本研究采用站点30 min的有效气象因子和蒸散发观测值研究机器学习算法的插补效果。将每月30 min气象因子净辐射(W·m-2)、气温(℃)、相对湿度(%)、土壤热通量(W·m-2)、风速(m·s-1)、土壤含水率(%)作为输入变量, 相应月份的30 min蒸散发观测值作为输出变量, 并将每月观测值的70%作为训练集, 30%作为测试集, 按月单独进行训练, 采用机器学习回归算法插补缺失或丢弃的数据以获得完整通量时间序列。
1.2 研究方法
1.2.1 多元线性回归算法
多元线性回归(MLR)目的是在已有数据集上通过2个或2个以上自变量构建线性模型来拟合该数据集特征向量的各个分量之间的关系, 找到一条直线或者一个超平面来实现预测值和真实值之间的误差最小化。线性模型的目标函数(损失函数)表示为:
1.2.2 决策回归树算法
1.2.3 随机森林算法
1.2.4 支持向量回归算法
1.2.5 多层感知机算法
2 结果和分析
2.1 蒸散发通量观测数据缺省状况
本研究地点是以高寒沼泽湿地为下垫面的隆宝试验站, 其2019年1-10月(11、12月缺测)蒸散发通量观测数据缺失状况如表1所示, 2019年数据平均缺失率为17%。其中, 6月缺失情况最严重(27%), 其次为5月和9月(25%), 3月缺失率最低(7%)。
表1 隆宝高寒沼泽湿地蒸散发通量观测数据缺失统计表
Table 1
| 月份 Month | ||||||||||
|---|---|---|---|---|---|---|---|---|---|---|
| 1 | 2 | 3 | 4 | 5 | 6 | 7 | 8 | 9 | 10 | |
| 有效记录 Active record | 1 206 | 1 206 | 1 382 | 1 309 | 1 110 | 1 057 | 1 152 | 1 282 | 1 075 | 936 |
| 缺失数据 Missing data | 282 | 138 | 106 | 131 | 378 | 383 | 336 | 206 | 365 | 240 |
| 缺失率 Absence rate (%) | 19 | 10 | 7 | 9 | 25 | 27 | 23 | 14 | 25 | 20 |
2.2 蒸散发与气象因子的相关性分析
蒸散发的大小受到气候、土地类型、植被状况等因素的共同影响。环境因子对蒸散发的影响程度相对最大, 为探讨蒸散发对各环境因子的敏感程度, 确定所选气象因子对于蒸散发插补的有效性, 选取每月输入气象因子和蒸散发的30 min数据进行相关性分析。结果如表2所示, 研究区蒸散发与所选气象因子存在显著相关关系, 相关性大小关系为: 净辐射>土壤热通量>相对湿度>气温>风速>土壤温度>土壤含水率。
表2 隆宝高寒沼泽湿地蒸散发与气象因子间的相关性
Table 2
| 气象因子 Meteorological factor | 月份 Month | 平均 Mean | |||||||||
|---|---|---|---|---|---|---|---|---|---|---|---|
| 1 | 2 | 3 | 4 | 5 | 6 | 7 | 8 | 9 | 10 | ||
| 净辐射 Net radiation | 0.80 | 0.83 | 0.69 | 0.72 | 0.77 | 0.76 | 0.79 | 0.83 | 0.81 | 0.69 | 0.769 |
| 土壤热通量 Soil heat flux | 0.74 | 0.43 | 0.54 | 0.86 | 0.84 | 0.87 | 0.84 | 0.84 | 0.84 | 0.85 | 0.765 |
| 相对湿度 Relative humidity | -0.62 | -0.68 | -0.69 | -0.74 | -0.71 | -0.75 | -0.78 | -0.80 | -0.78 | -0.72 | -0.727 |
| 气温 Air temperature | 0.63 | 0.64 | 0.56 | 0.75 | 0.73 | 0.69 | 0.77 | 0.78 | 0.66 | 0.69 | 0.690 |
| 风速 Wind velocity | 0.74 | 0.74 | 0.71 | 0.61 | 0.59 | 0.43 | 0.39 | 0.29 | 0.46 | 0.63 | 0.559 |
| 土壤温度 Soil temperature (5 cm) | 0.29 | 0.07 | 0.35 | 0.60 | 0.52 | 0.53 | 0.55 | 0.46 | 0.41 | 0.48 | 0.426 |
| 土壤温度 Soil temperature (10 cm) | -0.12 | 0.12 | 0.13 | 0.04 | -0.07 | -0.01 | 0 | 0.21 | 0.13 | 0.15 | 0.058 |
| 土壤温度 Soil temperature (20 cm) | -0.37 | 0 | 0.11 | -0.21 | -0.22 | -0.13 | -0.34 | -0.20 | 0 | 0.03 | -0.133 |
| 土壤温度 Soil temperature (30 cm) | -0.32 | 0.10 | 0.12 | 0.13 | -0.08 | -0.03 | -0.10 | -0.04 | 0.09 | 0.12 | -0.001 |
| 土壤温度 Soil temperature (40 cm) | 0 | -0.06 | 0.14 | 0.10 | 0.08 | 0.10 | 0.15 | 0.08 | 0.12 | 0.18 | 0.089 |
| 土壤含水率 Soil moisture content (5 cm) | 0.26 | 0.08 | 0.11 | -0.08 | 0.30 | 0.22 | 0.04 | 0.36 | 0.40 | 0.33 | 0.202 |
| 土壤含水率 Soil moisture content (10 cm) | -0.24 | 0 | 0.04 | 0.07 | 0.04 | -0.08 | -0.23 | -0.03 | -0.10 | 0.11 | -0.042 |
| 土壤含水率 Soil moisture content (20 cm) | -0.24 | 0.10 | 0.07 | 0.12 | 0.05 | -0.01 | -0.14 | -0.08 | -0.11 | 0.10 | -0.014 |
| 土壤含水率 Soil moisture content (30 cm) | -0.02 | -0.10 | 0.09 | 0.15 | -0.02 | 0.03 | -0.15 | -0.02 | -0.09 | 0.11 | -0.002 |
| 土壤含水率 Soil moisture content (40 cm) | -0.03 | 0.04 | 0.10 | 0.15 | -0.02 | 0 | 0 | 0 | -0.05 | 0.15 | 0.034 |
2.3 不同气象因子输入组合下各模型算法精度对比
表3 隆宝高寒沼泽湿地不同气象因子的模型参数组合
Table 3
| 模型特征组合 Model feature combination | 输入特征 Input characteristic | 特征个数 Feature number |
|---|---|---|
| 组合1 Combination 1 | Rn、Sg、RH、T、WS | 5 |
| 组合2 Combination 2 | Rn、Sg、RH、T、WS、ST_5 cm | 6 |
| 组合3 Combination 3 | Rn、Sg、RH、T、WS、SV_5 cm | 6 |
| 组合4 Combination 4 | Rn、Sg、RH、T、WS、ST_5 cm、SV_5 cm | 7 |
| 组合5 Combination 5 | Rn、Sg、RH、T、WS、ST_5 cm、ST_10 cm、ST_20 cm、ST_30 cm、ST_40 cm | 10 |
| 组合6 Combination 6 | Rn、Sg、RH、T、WS、SV_5 cm、SV_10 cm、SV_20 cm、SV_30 cm、SV_40 cm | 10 |
| 组合7 Combination 7 | Rn、Sg、RH、T、WS、ST_5 cm-ST_40 cm、SV_5 cm-SV_40 cm | 15 |
RH, 相对湿度; Rn, 净辐射; Sg, 土壤热通量; ST_5 cm, 土壤温度(5 cm); ST_10 cm, 土壤温度(10 cm); ST_20 cm, 土壤温度(20 cm); ST_30 cm, 土壤温度(30 cm); ST_40 cm, 土壤温度(40 cm); SV_5 cm, 土壤含水率(5 cm); SV_10 cm, 土壤含水率(10 cm); SV_20 cm, 土壤含水率(20 cm); SV_30 cm, 土壤含水率(30 cm); SV_40 cm, 土壤含水率(40 cm); T, 气温; WS, 风速。
RH, relative humidity; Rn, net radiation; Sg, soil heat flux; ST_5 cm, soil temperature (5 cm); ST_10 cm, soil temperature (10 cm); ST_20 cm, soil temperature (20 cm); ST_30 cm, soil temperature (30 cm); ST_40 cm, soil temperature (40 cm); SV_5 cm, soil moisture content (5 cm); SV_10 cm, soil moisture content (10 cm); SV_20 cm, soil moisture content (20 cm); SV_30 cm, soil moisture content (30 cm); SV_40 cm, soil moisture content (40 cm); T, air temperature; WS, wind velocity.
表4 隆宝高寒沼泽湿地不同气象因子组合下的模型精度
Table 4
| 模型特征组合 Model feature combination | MLR | CART | RF | SVR | MLP | R2平均 Mean of R2 | |||||
|---|---|---|---|---|---|---|---|---|---|---|---|
| R2 | RMSE | R2 | RMSE | R2 | RMSE | R2 | RMSE | R2 | RMSE | ||
| 组合1 Combination 1 | 0.81 | 0.041 | 0.72 | 0.051 | 0.85 | 0.039 | 0.77 | 0.056 | 0.80 | 0.053 | 0.79 |
| 组合2 Combination 2 | 0.80 | 0.043 | 0.72 | 0.052 | 0.82 | 0.041 | 0.68 | 0.063 | 0.69 | 0.062 | 0.74 |
| 组合3 Combination 3 | 0.82 | 0.041 | 0.72 | 0.052 | 0.83 | 0.040 | 0.72 | 0.073 | 0.58 | 0.063 | 0.73 |
| 组合4 Combination 4 | 0.80 | 0.042 | 0.72 | 0.052 | 0.83 | 0.041 | 0.69 | 0.079 | 0.66 | 0.066 | 0.74 |
| 组合5 Combination 5 | 0.77 | 0.063 | 0.68 | 0.057 | 0.82 | 0.042 | 0.78 | 0.072 | 0.55 | 0.129 | 0.72 |
| 组合6 Combination 6 | 0.71 | 0.045 | 0.71 | 0.043 | 0.82 | 0.031 | 0.69 | 0.093 | 0.36 | 0.136 | 0.66 |
| 组合7 Combination 7 | 0.57 | 0.223 | 0.71 | 0.044 | 0.83 | 0.033 | 0.35 | 0.118 | 0.41 | 0.117 | 0.57 |
| 平均 Mean | 0.75 | 0.071 | 0.71 | 0.050 | 0.83 | 0.038 | 0.67 | 0.079 | 0.58 | 0.089 | 0.71 |
CART, 决策树; MLP, 多层感知机; MLR, 多元线性回归; R2, 决定系数; RF, 随机森林; RMSE, 均方根误差; SVR, 支持向量回归。组合同
CART, classification and regression tree; MLP, multilayer perceptron; MLR, multiple linear regression; R2, coefficient of determination; RF, random forest; RMSE, root mean square error; SVR, support vector regression. Combinations see
由表4可见, 7种组合的5类机器学习算法模型的决定系数(R2)变化范围为0.58-0.83, 均方根误差(RMSE)变化范围为0.038-0.089 mm·30 min-1, 组合1的输入因子为表2中相关系数绝对值≥0.5的气象因子, 即净辐射、土壤热通量、相对湿度、气温、风速, 5种算法模型的R2最大为随机森林算法, 最小为多层感知机算法, 王升等(2017)研究表明, 随着气象因子的增加, 机器学习算法模型模拟精度随之提高, 由此, 增加额外的气象因子形成组合2-7。结果(表4)表明, 当分别加入和同时加入土壤温度(5 cm)和土壤含水率时(5 cm), R2平均值由0.79分别降低到0.74、0.73、0.74; 当分别加入4层土壤温度和土壤含水率时, R2平均值也分别降低到0.72和0.66; 最后加入所有气象因子, 特征个数达到15项时, R2平均值达到最低, 为0.57。这说明算法模型中输入因子并非越多越好, 不同气象因子对蒸散发的重要性不同, 利用算法模型中重要性估计方法, 可以得出主要影响蒸散发的气象因子, 图2给出了5个气象因子重要性排序(土壤温度和土壤含水率重要性几乎为0, 图中未作显示), 相对重要性从大到小依次为: 土壤热通量、净辐射、气温、风速、相对湿度, 土壤热通量和净辐射对蒸散发的影响较大, 这与蒸散发与气象因子的相关性结论基本一致, 表明光照类因素和土壤通量是影响隆宝地区蒸散发最为关键的因素。相比其他生态系统, 高寒沼泽湿地下垫面水分比较充足, 地表层土壤水分基本处于饱和状态, 对自然降水的敏感性较弱, 从而导致土壤水分对蒸散发的影响相对较弱。
图2
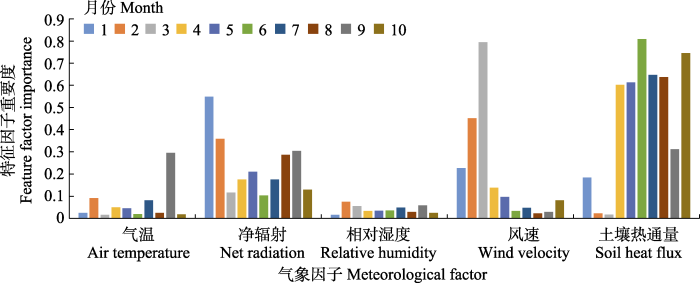
图2
隆宝高寒沼泽湿地影响蒸散发的气象因子重要性排序。
Fig. 2
Ranking of meteorological factors affecting evapotranspiration in Longbao alpine marshes wetland.
从表4可以看出, 随机森林算法在不同气象因子组合下的插补表现最优, 也是最为稳定的算法模型, 输入特征个数从5到15, 算法模型的R2介于0.82-0.85之间, RMSE介于0.031-0.041, 在5个算法模型中R2始终保持在最高值, RMSE在最低值, 精度和稳定性最佳, 针对7种组合, 组合1效果最优。
2.4 随机森林回归模型插补结果分析
2.4.1 模型参数调优
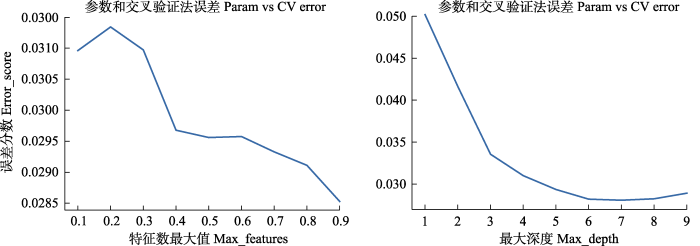
由不同气象因子输入组合下各模型算法精度对比得知, 随机森林算法精度最高, 由此选用随机森林算法, 利用组合1进行蒸散值的插补, 为了提高随机森林回归模型插补精度, 用交叉验证法(GridSearchCV), 寻找最优超参数。GridSearchCV缩减了超参数值的空间, 只搜索人为重要的超参数和有限的固定值, 同时结合交叉验证的方式来搜索最优超参数。max_features是构建随机森林最优模型时, 允许每个随机森林的子树可以利用变量(特征)数的百分比。max_depth是随机森林子树最大深度, 如果模型样本量多, 特征也多的情况下, 推荐限制最大深度; 若样本量少或者特征少, 则不限制最大深度。当参数max_features为0.9, max_depth为6时, 误差error_score达到最低(0.3左右), 此时, GridSearchCV返回的最优分数为0.90 (图3)。
图3
2.4.2 插补结果分析
表5 隆宝高寒沼泽湿地月蒸散发(mm)插补前后统计表
Table 5
| 月份 Month | 总计 Sum | ||||||||||
|---|---|---|---|---|---|---|---|---|---|---|---|
| 1 | 2 | 3 | 4 | 5 | 6 | 7 | 8 | 9 | 10 | ||
| 插补前 Before interpolation | 23.69 | 30.66 | 60.86 | 122.21 | 128.86 | 131.13 | 141.09 | 160.42 | 104.60 | 62.36 | 965.88 |
| 插补后 After interpolation | 24.57 | 31.21 | 62.48 | 127.17 | 145.49 | 157.33 | 162.69 | 168.41 | 119.45 | 70.97 | 1 069.77 |
图4
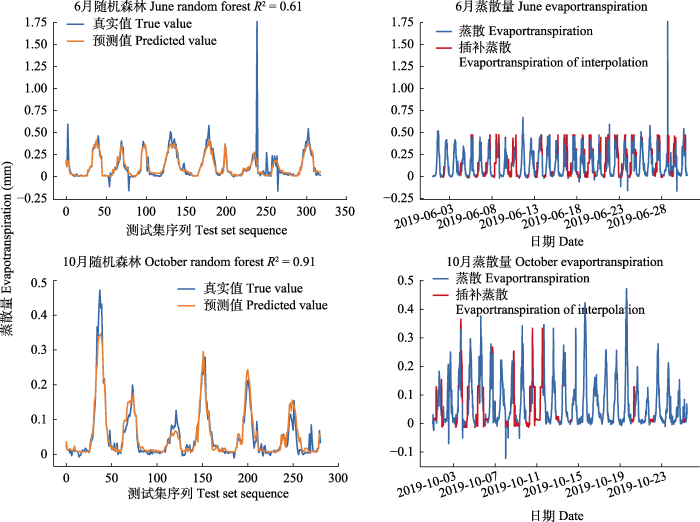
图4
隆宝高寒沼泽湿地蒸散发插补效果。
Fig. 4
Evaporation interpolation effect in Longbao alpine marshes wetland.
图5
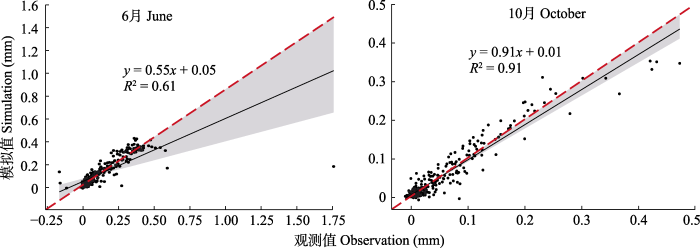
图5
隆宝高寒沼泽湿地蒸散发随机森林插补精度验证图。
Fig. 5
Evaporation random forest interpolation accuracy verification diagram in Longbao alpine marshes wetland.
图6可以看出, 净辐射、土壤热通量、气温与蒸散发日尺度变化趋势基本一致, 呈正相关关系; 风速、相对湿度与蒸散发变化趋势相反, 呈负相关关系。日蒸散发主要集中在生长季, 日最大值为8.77 mm·d-1, 出现在7月9日, 日最小值为0.21 mm·d-1, 出现在1月30日, 3月和4月的日蒸散发增加较多, 8月份达到最大值, 9月份开始减少。净辐射和气温变化呈先增加后减小的趋势, 净辐射下降幅度与升高幅度相差不大。气温最低为-15.42 ℃, 出现在1月17日, 最高温为13.72 ℃, 出现在8月20日。风速整体呈减小的趋势, 减小幅度不大。3月的日风速波动相对较大, 6-10月风速呈比较小的波动状态, 大小为1.59-1.85 m·s-1之间。在生长季初期, 风速较大, 蒸散发却比较小; 在生长季中期, 风速和蒸散发呈现相反趋势, 即风速较小, 蒸散发较大。大部分时间蒸散发和相对湿度的变化相反, 呈显著负相关关系, 即随着相对湿度降低, 蒸散发升高, 从5月开始, 相对湿度保持在较高水平, 均值达到71.47%。
图6
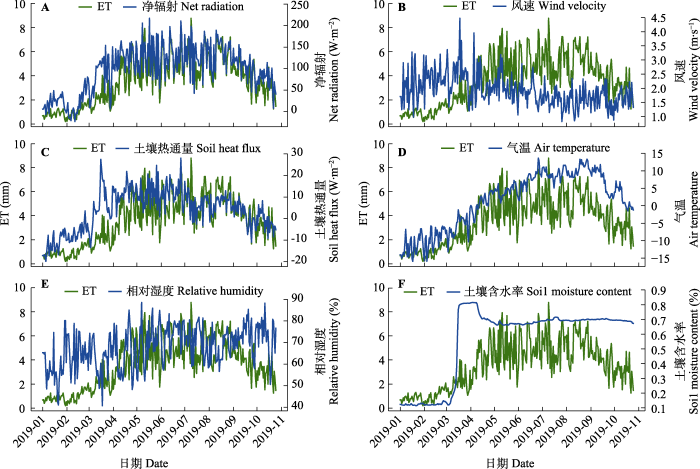
图6
隆宝高寒沼泽湿地插补完整蒸散发(ET)与气象因子日变化趋势图。
Fig. 6
Daily variation trend of evaportranspiration (ET) and meteorological factors in Longbao alpine marshes wetland.
3 讨论
蒸散发的形成与气候条件和环境因素密不可分, 是联系气候、水、热和碳循环的关键生态水文过程, 不同地区的植被蒸散发变化特征和影响因素有很大差异, 因此, 揭示植被蒸散发特征及其影响因子对研究气候变化对水文循环的影响有实践意义。本研究结果表明, 隆宝高寒沼泽湿地蒸散发主要集中在生长季, 日最大值为8.77 mm·d-1, 出现在7月9日, 日最小值为0.21 mm·d-1, 出现在1月30日, 3月和4月日蒸散发增加较多, 8月份达到最大值, 9月份开始减少。蒸散发峰值出现在返青后约2个月(8月), 与植被生长峰值相对应, 这与祁栋林等(2015)、邓兴耀等(2017)的研究结果一致。随机森林特征重要性排序中, 土壤热通量排序第一, 可能原因是隆宝为沼泽湿地, 下垫面水分比较充足, 地气通量交换作用显著, 由此土壤热通量对模型拟合结果的贡献较大。另外, 机器学习模型训练中输入特征增加土壤含水率和饱和水气压差后, R2降低, 模型模拟精度降低, 考虑其原因, 可能是相比其他生态系统, 沼泽湿地下垫面水分比较充足, 从而导致蒸散发对水分条件的敏感度降低。由此可以得出, 不同下垫面的植被蒸散发特征及影响因子差异显著, 深入了解不同生态系统蒸散的变化特征和影响因子对地表水量和水循环研究具有实践意义。
4 结论
随机森林是一种流行的机器学习算法, 它可以预测包含多个高阶交互项的数据, 对噪声有很强的耐受性, 并能很好地抵抗过度拟合和欠拟合。模型也易于训练, 可以处理大量混合类型数据, 并提供评估可变重要性分数的方法。本研究选取青藏高原玉树隆宝地区高寒沼泽湿地为观测研究站, 以实际蒸散发为研究对象, 利用多种机器学习算法进行蒸散发拟合插补研究, 找出对于蒸散发具有较高精度的插补方法, 以期更有利于此方法在生态学中的广泛应用。主要的研究结论为:
(1)研究区蒸散发与所选气象因子存在显著相关关系, 相关性大小关系为: 净辐射>土壤热通量>相对湿度>气温>风速>土壤温度>土壤含水率。
(2)依据随机森林模型中重要性估计方法, 高寒沼泽湿地影响蒸散发的气象因子相对重要性由大到小依次为: 土壤热通量、净辐射、气温、风速、相对湿度, 土壤热通量对蒸散发的影响最大, 其次为净辐射, 说明下垫面为高寒沼泽湿地时, 土壤热通量是影响蒸散发过程的关键因子。而光照类因素也成为影响隆宝地区蒸散发的关键因素。
(3) 7种组合的5类机器学习算法模型的R2变化范围为0.58-0.83, RMSE变化范围为0.038-0.089 mm·30 min-1。5种算法模型的R2最大为随机森林算法, 最小为多层感知机算法。随机森林算法在不同气象因子组合下的插补表现最优, 在5个算法模型中拟合精度始终保持在最高值, RMSE在最低值, 精度和稳定性最佳。针对7种不同气象因子组合, 组合1的随机森林效果最优。利用交叉验证法(GridSearchCV)搜索最优超参数, 返回的最优参数max_features为0.9, max_depth为6, 最优分数达到0.90。
参考文献
The response of photosynthesis and stomatal conductance to rising [CO2]: mechanisms and environmental interactions
Eddy covariance technique and its applications in flux observations of terrestrial ecosystems
DOI:10.17521/cjpe.2019.0351 URL [本文引用: 1]
涡度相关技术及其在陆地生态系统通量研究中的应用
DOI:10.17521/cjpe.2019.0351
[本文引用: 1]

通量观测是定量描述土壤-植被-大气间物质循环和能量交换过程的基础。涡度相关技术作为直接测量植被冠层与大气间能量与物质交换通量的技术手段, 已经逐步发展成为国际通用的通量观测标准方法。随着涡度相关技术在全球碳水循环研究中的广泛应用, 长期连续的通量观测正在为准确评价生态系统碳固持能力、水分和能量平衡状况、生态系统对全球气候变化的反馈作用、区域和全球尺度模型的优化与验证、极端事件对生态系统结构与功能影响等方面的研究提供重要数据支撑和机制理解途径。通过站点尺度通量长期动态观测, 明确了不同气候区和植被类型生态系统碳水通量强度基线及其季节与年际变异特征。通过多站点联网观测, 在区域和全球尺度研究生态系统碳通量空间变异特征, 揭示了区域尺度上温度和降水对生态系统碳通量空间格局的生物地理学控制机制。该文概括地介绍了涡度相关技术的基本原理、假设与系统构成, 总结了涡度通量长期联网观测在陆地生态系统碳水通量研究中的主要应用, 并对通量研究发展前景进行了展望。
Processes driving nocturnal transpiration and implications for estimating land evapotranspiration
DOI:10.1038/srep10975
PMID:26074373
[本文引用: 1]
Evapotranspiration is a major component of the water cycle, yet only daytime transpiration is currently considered in Earth system and agricultural sciences. This contrasts with physiological studies where 25% or more of water losses have been reported to occur occurring overnight at leaf and plant scales. This gap probably arose from limitations in techniques to measure nocturnal water fluxes at ecosystem scales, a gap we bridge here by using lysimeters under controlled environmental conditions. The magnitude of the nocturnal water losses (12-23% of daytime water losses) in rowcrop monocultures of bean (annual herb) and cotton (woody shrub) would be globally an order of magnitude higher than documented responses of global evapotranspiration to climate change (51-98 vs. 7-8 mm yr(-1)). Contrary to daytime responses and to conventional wisdom, nocturnal transpiration was not affected by previous radiation loads or carbon uptake, and showed a temporal pattern independent of vapour pressure deficit or temperature, because of endogenous controls on stomatal conductance via circadian regulation. Our results have important implications from largescale ecosystem modelling to crop production: homeostatic water losses justify simple empirical predictive functions, and circadian controls show a fine-tune control that minimizes water loss while potentially increasing posterior carbon uptake.
Temporal-spatial dynamic change characteristics of evapotranspiration in arid region of northwest China
中国西北干旱区蒸散发时空动态特征
Gap filling strategies for long term energy flux data sets
DOI:10.1016/S0168-1923(00)00235-5 URL [本文引用: 1]
Evapotranspiration from a Mongolian steppe under grazing and its environmental constraints
DOI:10.1016/j.jhydrol.2006.07.021 URL [本文引用: 1]
Crop coefficient simulation and evapotranspiration estimation of dune and meadow in a semiarid area
半干旱区沙丘、草甸作物系数模拟及蒸散发估算
Wheat Yield Forecasting: a Machine Learning Approach Based on Meteorological Factors
基于机器学习的气象因素对小麦产量影响的分析预测
Quantifying evapotranspiration and biophysical regulations of a poplar plantation assessed by eddy covariance and sap-flow methods
DOI:10.3773/j.issn.1005-264x.2009.04.009
[本文引用: 1]
<EM>Aims</EM> Using field data from an eddy-covariance (EC) flux tower and sap-flow sensors installed in a poplar (<EM>Populus euramericana</EM>) plantation, we investigated the magnitudes and changes of evapotranspiration (<EM>ET</EM>) under different soil moisture and climatic conditions. Our objectives were to quantify the energy partitioning and energy balance, explore the dynamic process and regulatory mechanisms on<EM> ET</EM>, and understand primary biophysical regulations, especially soil moisture. <BR><EM>Methods</EM> An open path EC system, sap-flow sensors, soil water balance monitoring system, and microclimatic station were installed to record various components of energy fluxes and water budget at an 11-year-old poplar plantation in Daxing District, Beijing, China. We used data collected at 30-min intervals in the growing season of 2006 in this study. <BR><EM>Important findings</EM> The overall energy closure of the study site was high (86%) during the growing season, but with notable dependence on soil water conditions. The ratio between sensible heat and net radiation (<EM>Hs</EM>:<EM>Rn</EM>) was much higher during dry conditions than that during moist conditions. With dry soils, net radiation and soil physical properties played important roles in transpiration, which was less than evaporation prior to rain events. In contrast, transpiration exceeded evaporation when the soil water content in the deep layers was more abundant following rain events. The total <EM>ET</EM> rates quantified by the soil water balance and sap-flow methods were comparable and lower than that determined by the EC method. The ratio between transpiration and <EM>ET</EM> appeared to be more dependent on net radiation and vapor pressure deficit <EM>(VPD</EM>) during wet periods than that during dry periods. <BR>
基于涡度相关法和树干液流法评价杨树人工林生态系统蒸发散及其环境响应
DOI:10.3773/j.issn.1005-264x.2009.04.009
[本文引用: 1]
运用涡度相关(Eddy covariance)开路系统、树干液流(Sap flow)、土壤水分以及微气象观测系统, 于2006年生长季(5~10月)对北京大兴区永定河沿河沙地杨树(Populus euramericana)人工林生态系统的水量和能量平衡进行了连续测定; 分析了该系统能量平衡闭合水平及其组分分配特征, 不同水分条件下蒸发散及其各组分变化过程和分配特征, 以及影响蒸发散的主要环境因子; 并对组分求和法、土壤水分平衡法与涡度相关法测得该生态系统生长季蒸发散总量的结果进行了对比。结果表明: 生长季内该生态系统的能量闭合水平较高, 能量平衡各组分在不同土壤水分环境条件下所占比例变化较大; 在水分充足的条件下, 潜热通量在可利用能量分配过程中占优势, 显热通量在水分胁迫条件下占可提供能量的比例比潜热通量大。雨季到来之前, 土壤蒸发与植被蒸腾强度相差较小; 进入雨季后, 土壤深层水分得到补偿, 植被蒸腾显著增强而土壤蒸发强度减弱。涡度相关法所得的总蒸发散量与基于树干液流法等组分求和法得到的蒸发散结果较接近, 分别为513和492 mm。土壤水分平衡法的观测结果略高于前二者的观测结果, 雨季研究界面以下的土体也有水分交换是该方法高估蒸发散的主要原因。与环境因子的响应关系表明, 蒸发散以及蒸腾的变化过程对净辐射的响应程度比对饱和水汽压差高; 水分条件较好情况下, 蒸发散以及蒸腾的变化过程与水汽压差关系不明显, 说明水分充足时, 水汽压差不是蒸散强弱的限制因子。
Gap filling method for evapotranspiration based on machine learning
基于机器学习的蒸散量插补方法
Applicability of four kinds of artificial intelligent models on prediction of reference crop evapotranspiration in Jiangxi Province
4种人工智能模型在江西省参考作物蒸散量计算中的适用性
Extreme summer high-temperature changes in Central Asia based on interpolated data from random forest
基于随机森林插值的中亚夏季极端高温变化特征
The spatial-temporal patterns of evapotranspiration and its influencing factors in Chinese terrestrial ecosystem from 2000 to 2015
2000-2015年中国陆地生态系统蒸散时空变化及其影响因素
Daily variation of evapotranspiration rate of alpine grassland and analysis of its environmental factors in upper reach of Heihe River
黑河上游高寒草地蒸散发日变化及其影响因子分析
Study on changing characteristics and impact factor of evaporation over three-river source area in recent 50 years
近50 a三江源地区蒸发量的变化特征及其影响因子分析
Spatiotemporal variations of evapotranspiration and influence factors in Qilian Mountain from 2000 to 2018
2000-2018年祁连山蒸散发时空变化及影响因素
Relationships between water use efficiency and environmental temperature and humidity in an alpine meadow in the northern Tibet
藏北高原高寒草甸水分利用效率与环境温湿度的关系
DOI:10.16258/j.cnki.1674-5906.2016.08.001 [本文引用: 1]
Evapotranspiration characteristics of degraded meadow and effects of freeze-thaw changes in the Three-River Source Region
三江源区退化高寒草甸蒸散特征及冻融变化对其的影响
Simulation of spatio-temporal changes in evapotranspiration in typical mountains
DOI:10.18402/resci.2017.02.10
[本文引用: 1]
Based on a new land surface model CLM_CERES,spatio-temporal changes in evapotranspiration(ET)in three typical mountains of China (Taihang Mountain,Hengduan Mountain,and Qiangui Karst Mountain) in baseline of 1951-2005 and estimation period of 2006-2060 were simulated. The CLM_CERES model was constructed by considering the scheme of water exploitation and utilization,and coupled with the crop growth and development model CERES. This new land surface model was driven by the atmosphere external forcing data of multi-model ensemble data of CMIP5. The simulated results were validated with a data-driven estimate of global land evapotranspiration (MTE data)derived from observations from a global network of micrometeorological tower sites(FLUXNET). The results showed that ET simulated by CLM_CERES was consistent with the MTE data among all three regions at a monthly scale (R2= 0.76~0.88). From 1951 to 2060,the total ET increased significantly with linear trends of 0.981 and 0.757 mm/a (P < 0.001)over Taihang Mountain and Hengduan Mountain,of which vegetation ET dominated. However,the total ET increased insignificantly over Qiangui Karst Mountain,of which soil evaporation dominated. Intra-annual variation of ET in all three regions from 1951 to 2060 showed unimodal curves with a peak region from May to September. The spatial distribution of ET was mainly influenced by climate change and topographic factors over Taihang Mountain and Hengduan Mountain. The spatial distribution of ET over Qiangui Karst Mountain was more complex due to the particularity of dualistic structure between surface and ground water.
典型山地蒸散发时空变化模拟研究
DOI:10.18402/resci.2017.02.10
[本文引用: 1]
基于考虑了水资源开采利用方案和农作物生长的新型陆面模式CLM_CERES,利用CMIP5多模式集合数据集驱动该模式,使用基于全球通量观测网络(FLUXNET)的地表蒸散发估算数据(“MTE”数据)对模拟结果进行验证,系统分析了中国典型山地(太行山地、横断山地、黔桂喀斯特山地)基准期(1951-2005年)和预估期(2006-2060年)蒸散量时空变化。结果显示:三个区域CLM_CERES模拟蒸散量与MTE数据在月尺度上均具有较好的相关性,相关性均在0.76~0.88之间。1951-2060年太行山地和横断山地总蒸散量呈显著增加趋势,增幅分别为0.9806和0.7569mm/a(P<0.001),以植被蒸散为主,黔桂喀斯特山地总蒸散量无显著增加趋势,以土壤蒸发为主;三个区域蒸散量的季节变化均呈现单峰曲线,峰值位于5-9月。太行山地和横断山地蒸散量的空间分布主要受气候和地形影响,黔桂喀斯特山地受其特殊的地表、地下水二元结构影响,对蒸散量的响应机制相对复杂。
Simulation of reference evapotranspiration based on random forest method
基于随机森林算法的参考作物蒸发蒸腾量模拟计算
Uncertainties in long-term studies of net ecosystem CO2 exchange with the atmosphere based on eddy covariance technique
基于涡度相关技术估算植被/大气间净CO2交换量中的不确定性
DOI:10.11867/j.issn.1001-8166.2004.04.0658
[本文引用: 1]
近年来,涡度相关技术的进步使陆地生态系统CO2通量的长期和连续观测成为可能。目前,涡度相关技术是全球通量观测网络(FLUXNET)测定植被/大气间CO2通量的主要技术手段,但绝大部分CO2通量观测站点都处于非典型的理想条件下,不能完全满足涡度相关技术的基本假设条件,从而导致基于涡度相关技术估算植被/大气间净生态系统CO2交换量的不确定性。系统介绍了涡度相关技术的基本假设,基本理论公式和误差的类型与特征等理论问题,重点阐述了通量测定中仪器本身的物理限制、二维和三维的气流运动、数据处理的方法和夜间通量的低估等不确定性的主要来源,并据此对通量观测研究中需要优先考虑的问题提出一些建议。研究认为数据质量控制与分析以及误差评价是不同通量站点间的结果比较和全球尺度综合分析的过程中需重点考虑的问题。
Seasonal and interannual variation in evapotranspiration, energy balance and surface conductance in a northern temperate grassland
DOI:10.1016/S0168-1923(02)00041-2 URL [本文引用: 1]
Water use efficiency of alpine wetland ecosystem
高寒湿地生态系统水分利用效率研究
Remote sensing estimation of rice yield based on random forest regression method
基于随机森林回归方法的水稻产量遥感估算
The basic principle of random forest and its applications in ecology: a case study of Pinus yunnanensis
随机森林算法基本思想及其在生态学中的应用——以云南松分布模拟为例
Analysis of the Temporal and Spatial Variation of Evapotranspiration and Its Driving Factors in Arid and Semi-arid Region of China from 2000 to 2015
2000-2015年中国干旱半干区蒸散发时空变化及其影响因素分析
