


草地约占全球陆地面积的40%, 是陆地生态系统的重要组成部分(White et al., 2000)。全球草地的植被和土壤碳储量分别约为63 Pg和423 Pg (1 Pg = 1015 g), 草地碳库相当于全球陆地生态系统碳库的15%-17% (Yang et al., 2022)。其中, 土壤是草地碳库的主体, 在陆地碳循环中发挥着重要作用(Bai & Cotrufo, 2022)。然而, 目前关于草地土壤碳源汇特征的认识仍存在较大不确定性, 不同地球系统模型对21世纪内草地土壤碳库变化的预测结果介于-20 Pg至37 Pg之间(Todd-Brown et al., 2014)。究其原因, 对关键土壤碳过程(如土壤有机碳(OC)分解)以及土壤碳库的刻画不够准确可能是导致模型预测结果存在不确定性的重要因素(Luo et al., 2016)。特别是, 土壤碳模型通常将土壤划分为具有不同滞留时间的概念库(Davidson & Janssens, 2006; Lugato et al., 2021), 这些库很难与实测碳组分直接关联, 进而限制了模型参数化。因此, 解析草地土壤有机碳组分含量和分解速率的空间格局及其影响因素, 将有助于土壤碳模型改进和模型参数化, 从而提高对草地生态系统碳动态的预测能力。
鉴于土壤碳组分在理解与预测土壤碳动态中的重要作用, 现有研究通过密度和/或粒径分级方法获取来源、组成以及稳定机制存在差异的碳组分(Six et al., 2000; Lavallee et al., 2020)。其中, 基于团聚体粒径的分级方法可以量化土壤碳在不同团粒结构中的分配(Doetterl et al., 2015), 进而更好地反映团聚体对有机碳的物理保护作用。团聚体通过隔离底物和微生物、限制氧气扩散等途径减弱微生物对有机碳的利用(Six et al., 2002; 周正虎等, 2022)。通常来讲, 和大团聚体(>250 μm)相比, 微团聚体(53-250 μm)对土壤有机碳的物理保护作用更强; 粉粒和黏粒组分(<53 μm)中的有机碳则主要受矿物吸附作用而维持稳定(Six et al., 2002; Dungait et al., 2012)。利用团聚体分级方法, Doetterl等(2015)分析了智利和南极半岛天然草地和灌丛生态系统24个样地土壤有机碳及其组分的影响因素。Fang等(2019)基于同样的方法解析了青藏高原高寒草地土壤碳组分含量的空间格局及其驱动因素。上述研究均发现土壤碳组分含量存在明显的空间变异。同时, 除以往普遍关注的气候因素外, 地球化学要素如铁铝氧化物含量等对区域尺度土壤碳储量和碳组分的影响不容忽视(Doetterl et al., 2015; Fang et al., 2019)。尽管如此, 来自其他草地生态系统, 如我国内蒙古温带草地的研究主要关注整土有机碳含量的空间分布(陈庆美等, 2003; Shi et al., 2012; Kou et al., 2018), 不同土壤碳组分含量的空间格局尚不清楚。因此, 基于统一的分级方法解析其他草地生态系统土壤碳组分含量的空间格局及其影响因素十分必要。
土壤有机碳分解导致的CO2排放是陆地生态系统碳循环的重要组成部分(Friedlingstein et al., 2020)。和土壤碳组分相比, 草地生态系统土壤有机碳分解的空间格局及其影响因素得到更多关注。Colman和Schimel (2013)对北美、波多黎各岛和夏威夷群岛84个样地(包括31个草地)的表层矿质土壤进行室内培养, 发现土壤碳分解速率在空间上存在较大变异, 进一步分析发现微生物生物量、气候和土壤质地等是碳分解速率的主要影响因素。不同草地类型的土壤碳分解速率同样可能存在差异。例如, 来自青藏高原的一项室内培养结果表明, 高寒草原的土壤有机碳分解速率低于高寒草甸, 底物属性和环境变量共同解释了高寒草原土壤碳分解空间变异的52% (Ding et al., 2016)。内蒙古草原土壤的室内培养结果则表明土壤有机碳分解速率在荒漠草原、典型草原和草甸草原间无显著差异(Cao et al., 2019)。基于上述研究, 气候和土壤变量等均会影响草地生态系统土壤有机碳分解。除了上述变量, 近年来越来越多的研究表明矿物保护在抑制土壤有机碳分解、维持土壤碳稳定性中发挥重要作用(Lehmann & Kleber, 2015; Qin et al., 2021)。然而, 当前关于矿物保护对草原生态系统土壤有机碳分解速率影响的研究仍较为匮乏。因此, 解析矿物保护与区域尺度土壤有机碳分解速率的关系并量化矿物保护相对于其他因素的重要性将有助于深入理解与预测草地生态系统土壤碳分解过程。
1 材料和方法
1.1 研究区域概况和样品采集
研究区域位于内蒙古高原, 介于39.2°-49.6° N, 107.9°-120.1° E之间。该区域降水量呈现从西南向东北递增的趋势, 年降水量范围为193-415 mm; 气温呈现自西南向东北递减的趋势, 年平均气温范围为-2.1-7.6 ℃。内蒙古高原从西南向东北分布着荒漠草原、典型草原和草甸草原(中国科学院中国植被图编辑委员会, 2001), 主要优势物种分别为多年生矮小草本植物如小针茅(Stipa klemenzii)、短花针茅(Stipa breviflora); 典型旱生性多年生草本植物如大针茅(Stipa grandis)、克氏针茅(Stipa krylovii); 多年生旱生和中旱生植物如贝加尔针茅(Stipa baicalensis)、羊草(Leymus chinensis) (马文红等, 2008; Ma et al., 2010)。相应地, 3种草地类型对应的土壤类型为棕钙土、栗钙土和黑钙土(马文红等, 2008)。研究区域的土壤质地主要隶属砂土+壤质砂土、壤土、砂质黏土+粉质黏土等(内蒙古自治区土壤普查办公室和内蒙古自治区土壤肥料工作站, 1994)。
于2015年7-8月在内蒙古高原温带草地分布区调查了76处样地(Kou et al., 2018)。在每个样地设置一个10 m × 10 m的大样方, 并在大样方四个角和中心位置分别设置1个1 m × 1 m的小样方。首先调查每个小样方的植物群落并收获植物地上部分。然后, 选取沿对角线的3个小样方, 用直径5 cm土钻采集不同层次(0-10、10-20、20-30和30-50 cm)的土壤样品, 每个小样方中沿其对角线采集3钻并混合均匀。所有植物和土壤样品运回实验室。土壤样品过2 mm筛除去粗根系和石块, 分为两部分储存: 一部分样品自然风干, 用于测定土壤理化性质; 另一部分样品保存于-20 ℃, 用于室内培养实验。需要说明的是, 本研究主要关注表层(0-10 cm)土壤。同时, 考虑到实验成本, 从中选取38个均匀分布的样地(其中10个来自荒漠草原, 20个来自典型草原, 8个来自草甸草原), 并将3个小样方的土壤样品等质量混合均匀用于后续所有实验。
1.2 样品测定与数据获取
为了揭示内蒙古温带草地土壤有机碳及其组分含量的空间格局, 采用湿筛法进行土壤分级(Elliott et al., 1991)。首先将30 g风干土壤样品于去离子水中浸泡5 min。然后让土壤样品依次通过250 μm和53 μm筛, 分离得到250-2 000 μm、53-250 μm、<53 μm (粉粒和黏粒)三级组分。在前两级组分中加入5 g·L-1的六偏磷酸钠溶液, 充分振荡并过筛去除沙粒, 分别得到大团聚体(250-2 000 μm)和微团聚体(53-250 μm)。分级的质量回收率为(98.0 ± 0.9)%。用重铬酸钾氧化-外加热法测定整土及不同组分的有机碳含量(鲍士旦, 2000), 并用各组分中的总有机碳量除以用于分级的土壤质量, 得到大团聚体碳、微团聚体碳和粉粒黏粒碳含量。
为了解析土壤有机碳分解速率的空间格局, 开展为期38天的室内培养实验。称取25-30 g鲜土于250 mL棕色玻璃瓶中, 调节土壤含水量至60%田间持水量并在整个培养过程中保持水分恒定(Chen et al., 2016)。将样品放入恒温恒湿箱(BPS−250CA, 上海一恒科学仪器有限公司, 上海)中, 于15 ℃条件下预培养7天(使微生物恢复活性与稳定), 正式培养38天。分别于第1、2、3、4、5、7、10、17、24、31和38天测定土壤有机碳的分解速率。每次测定时, 依据给定时间内培养瓶中CO2浓度累积量计算得到分解速率, CO2浓度采用红外气体分析仪(EGM-5, PP Systems, Haverhill, USA)测定。计算38天培养过程中的平均碳分解速率, 并将其标准化至单位质量土壤有机碳以减小不同样地间有机碳含量差异对碳分解速率的影响(Doetterl et al., 2015; Qin et al., 2021), 从而更好地反映土壤碳的可分解性。
本研究关注了气候、土壤、植物和矿物变量等潜在影响有机碳含量和碳分解速率的4类因素。对于气候因素, 首先从国家气象科学数据中心获取1980-2015年气象站的年平均气温(MAT)和年降水量(MAP)资料; 然后通过克里格差值法(Krige, 1951)将获取的MAT和MAP数据由样地尺度转换到区域尺度; 最后, 根据野外记录的经纬度提取各样地的MAT和MAP数据, 并计算35年平均值用于后续分析。此外, 从CGIAR-CSI Global Aridity and PET数据库获取各样地的干旱指数(AI, 即降水量与潜在蒸散量的比值, 值越低表示越干旱) (Zomer et al., 2008)。对于土壤变量, 依据电位法采用2.5:1的水土质量比(Qin et al., 2021), 用pH计测定土壤pH。对于植物变量, 将采集的植物样品于65 ℃下烘干至恒质量, 称量地上生物量(AGB)。为解析矿物保护的作用, 测定土壤中弱结晶态铁铝氧化物(Feo + Alo)、有机络合态铁铝氧化物(Fep + Alp)、交换性Ca2+ (CaExch)含量和黏粒粉粒含量。(Feo + Alo)和(Fep + Alp)分别采用0.2 mol·L-1的草酸-草酸铵溶液和0.1 mol·L-1的焦磷酸钠溶液浸提(Gentsch et al., 2015)。参照全国农业技术推广服务中心(2006)报道的方法测定CaExch含量: 首先用70%的乙醇溶液洗去土壤中易溶氯化物和硫酸盐等, 然后用0.1 mol·L-1氯化铵-70%乙醇交换液提取, 获得CaExch待测液。铁、铝、钙元素含量均使用电感耦合等离子体发射光谱仪(ICP-OES; iCAP 6300, Thermo Scientific, Waltham, USA)测定。使用激光粒度分析仪(Malvern Masterizer 2000, Malvern, Worcestershire, UK)测定土壤质地, 并计算黏粒和粉粒含量。
1.3 数据处理
首先, 采用单因素方差分析和最小显著差异法比较3种草地类型间土壤有机碳、碳组分含量和有机碳标准化的碳分解速率的差异, 以及不同碳组分有机碳含量的差异, 显著性水平为0.05。然后, 利用普通最小二乘回归分析探究土壤有机碳组分含量和分解速率与气候、土壤、植物和矿物变量之间的关系。为保证回归模型残差正态性, 对土壤有机碳、大团聚体碳、微团聚体碳、粉粒黏粒碳和有机碳标准化的碳分解速率log10 (lg)转化。最后, 使用方差分解(R软件“MuMIn”程序包)评估4类因素对土壤有机碳组分含量和分解速率影响的相对重要性。详细步骤如下: (1)构建一个包括所有变量的全模型, 基于修正的赤池信息量准则(AICc, ΔAICc < 2) (Burnham & Anderson, 2002), 通过“MuMIn”包中的“dredge”功能来确定最佳预测变量。在分析前, 保证所有变量的方差膨胀因子小于10以避免各变量之间的高共线性(Were et al., 2015), 同时所有变量都经过标准化处理(Z-score)。(2)当多个模型满足上述要求时, 计算模型的平均值, 获得参数估计的绝对值。(3)估计各类因素(即气候、土壤、植物和矿物4类因素)对土壤有机碳组分含量和有机碳标准化碳分解速率影响的相对重要性, 即计算同类因素参数估计的绝对值之和与所有参数估计的绝对值之和比值(Le Provost et al., 2020)。所有统计分析均在R 4.2.0软件中完成。
2 结果
2.1 土壤有机碳组分含量和分解速率的空间格局及其在不同草地类型间的差异
土壤有机碳组分含量和有机碳标准化的碳分解速率均呈现明显的空间分布规律(图1, 图2)。自西南向东北, 土壤有机碳及各组分碳含量呈增加趋势。其中, 土壤有机碳含量的分布范围介于3.9-46.9 g·kg-1之间, 平均值为(15.6 ± 1.7) g·kg-1 (平均值±标准误, 下同) (图1A)。大团聚体、微团聚体和粉粒黏粒组分中的有机碳含量分别占土壤总有机碳含量的43.2%、36.8%和20.0%, 对应的碳含量分别介于0.9-19.8 g·kg-1、0.8-10.6 g·kg-1和0.3-7.9 g·kg-1之间(图1B-1D)。进一步分析发现, 大团聚体碳含量((5.0 ± 0.7) g·kg-1)和微团聚体碳含量((4.1 ± 0.4) g·kg-1)无显著差异, 二者均显著高于粉粒黏粒碳含量((2.1 ± 0.3) g·kg-1) (图3)。同时, 不同草地类型土壤有机碳及其组分含量存在显著差异: 草甸草原中土壤有机碳、大团聚体碳、微团聚体碳和粉粒黏粒碳含量均最高, 其次为典型草原和荒漠草原(图1)。
图1
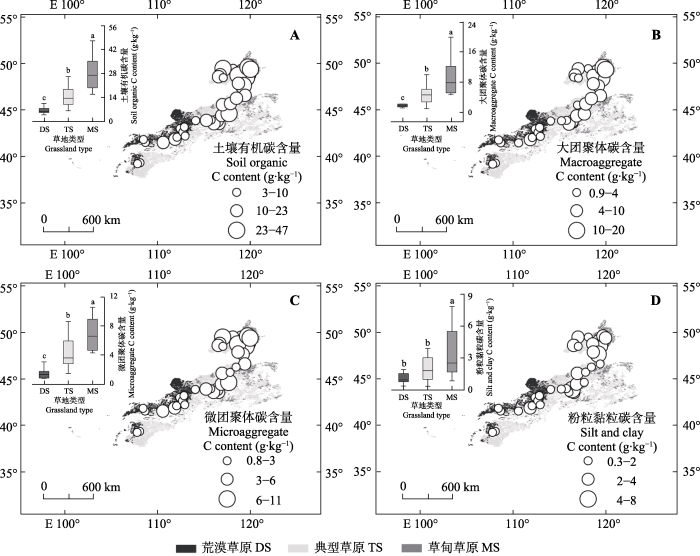
图1
内蒙古温带草地土壤有机碳含量(A)及碳组分含量(B-D)的空间格局。植被类型图基于1:1 000 000中国植被图(中国科学院中国植被图编辑委员会, 2001)绘制。箱线图中的线、底边和顶边以及误差棒分别表示一组数据的中位值、25百分位数和75百分位数以及标准差。不同小写字母表示不同草地类型存在显著差异(p < 0.05)。
Fig. 1
Spatial distributions of total soil organic carbon (C) content (A) and in three fractions content (B-D) in temperate grasslands of Nei Mongol. The vegetation map was obtained from China’s vegetation atlas with a scale of 1:1 000 000 (The Editorial Committee of Vegetation Map of China, Chinese Academy of Sciences, 2001). The lines, lower and upper boundaries, and bars in the boxes show median values, 25th and 75th percentiles, and standard deviations of all data, respectively. Different lowercase letters denote significant differences among different grassland types (p < 0.05). DS, desert steppe; MS, meadow steppe; TS, typical steppe.
图2
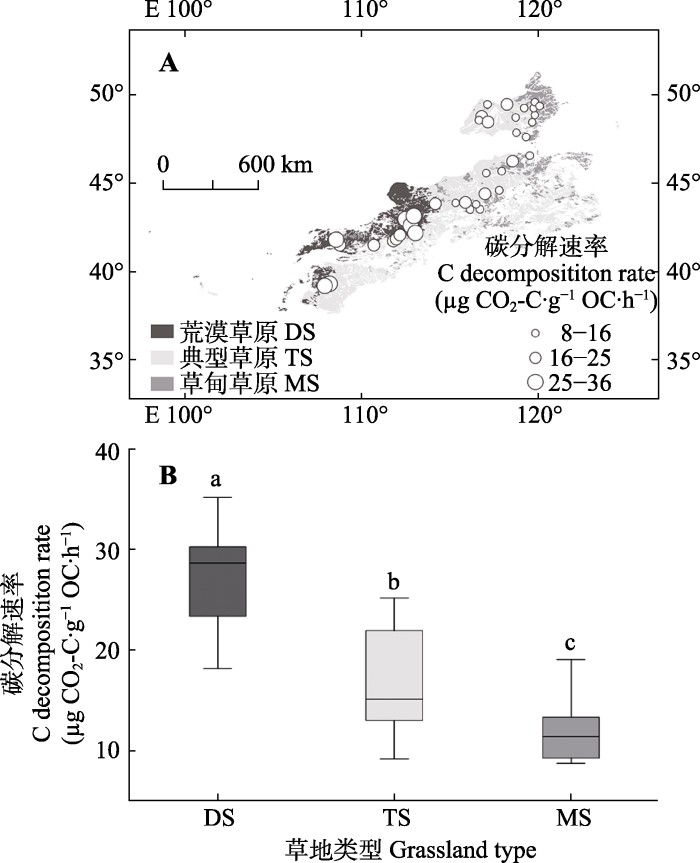
图2
内蒙古温带草地有机碳(OC)标准化碳分解速率的空间格局(A)及不同草地类型间土壤碳分解速率的差异(B)。植被类型图基于1:1 000 000中国植被图(中国科学院中国植被图编辑委员会, 2001)绘制。箱线图中的线、底边和顶边以及误差棒分别表示一组数据的中位值、25百分位数和75百分位数以及标准差。不同小写字母表示不同草地类型存在显著差异(p < 0.05)。
Fig. 2
Spatial distribution of soil carbon (C) decomposition rate standardized by soil organic C (OC) in temperate grasslands of Nei Mongol (A), and comparison of soil C decomposition rate among different grassland types (B). The vegetation map was obtained from China’s vegetation atlas with a scale of 1:1 000 000 (The Editorial Committee of Vegetation Map of China, Chinese Academy of Sciences, 2001). The lines, lower and upper boundaries, and bars in the boxes show median values, 25th and 75th percentiles, and standard deviations of all data, respectively. Different lowercase letters denote significant differences among different grassland types (p < 0.05). DS, desert steppe; MS, meadow steppe; TS, typical steppe.
图3
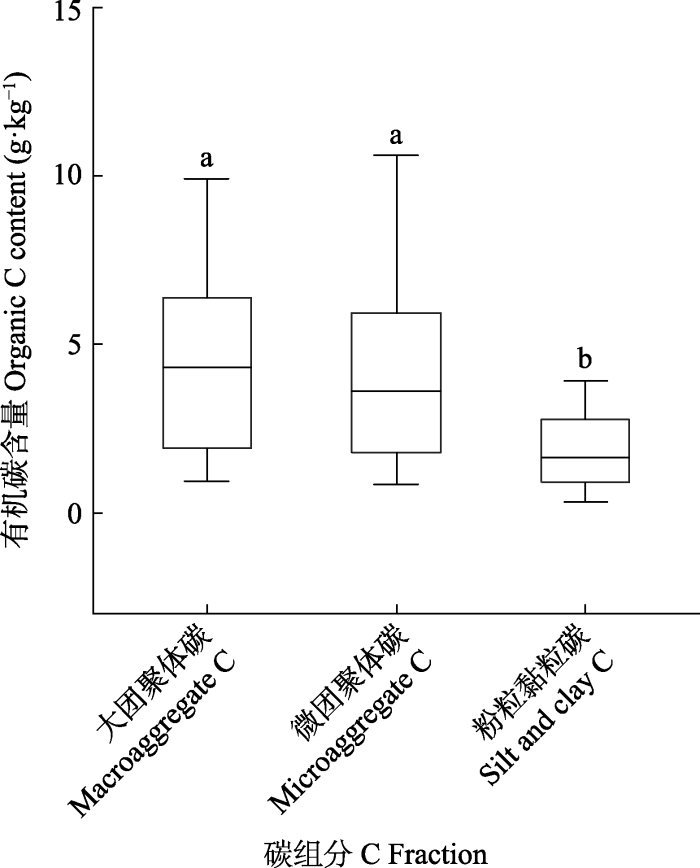
图3
内蒙古温带草地不同碳组分有机碳含量的差异。箱线图中的线、底边和顶边以及误差棒分别表示一组数据的中位值、25百分位数和75百分位数以及标准差。不同小写字母表示不同草地类型碳组分存在显著差异(p < 0.05)。
Fig. 3
Comparison of organic carbon (C) contents among different soil aggregate fractions in temperate grasslands of Nei Mongol. The lines, lower and upper boundaries, and bars in the boxes show median values, 25th and 75th percentiles, and standard deviations of all data, respectively. Different lowercase letters denote significant differences of C fractions among different grassland types (p < 0.05).
2.2 土壤有机碳组分含量的影响因素
整土和不同组分有机碳含量与气候、土壤、植物和矿物变量均显著相关(p < 0.05), Pearson相关系数(r)的绝对值介于0.3-0.8 (图4)。整土和不同组分有机碳含量与MAT和pH呈显著负相关关系, 与MAP、AI、AGB、(Feo + Alo)含量、(Fep + Alp)含量、CaExch含量、(Clay + silt)含量呈显著正相关关系(图4)。方差分解的结果显示, 矿物和气候2类因素对土壤有机碳含量空间变异的总解释率为89%。其中气候和矿物因素分别贡献土壤有机碳含量总解释率的51.6%和48.4% (图5A)。不同组分有机碳含量的影响因素存在差异: 气候、矿物、土壤和植物共同解释大团聚体碳空间变异的80%, 4类因素的相对贡献分别为38.4%、35.9%、21.9%和3.9% (图5B)。对于微团聚体碳组分而言, 气候、矿物和土壤3类因素共同解释微团聚体碳空间变异的84%, 3类因素分别贡献总变异的63.9%、32.6%和3.5% (图5C)。此外, 矿物、气候和土壤共同解释粉粒黏粒碳空间变异的49%, 三者的相对贡献分别为58.3%、35.0%和6.7% (图5D)。
图4
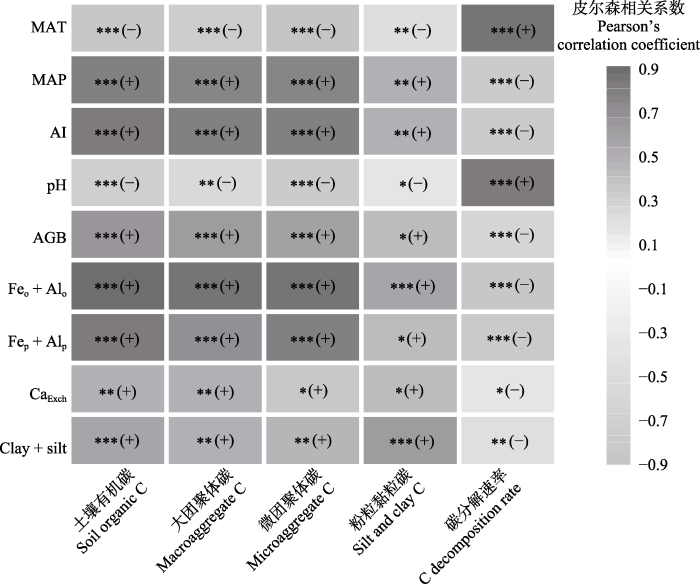
图4
内蒙古温带草地土壤有机碳含量、碳组分含量、碳分解速率与气候、土壤、植物和矿物变量的相关性。土壤有机碳、大团聚体碳、微团聚体碳、粉粒黏粒碳含量和有机碳标准化的碳分解速率数据经过了lg转化。括号中的“+”和“-”分别代表正相关关系和负相关关系。AGB, 地上生物量; AI, 干旱指数; CaExch, 交换性钙; Clay + silt, 黏粒和粉粒含量; Feo + Alo, 弱结晶态铁铝氧化物; Fep + Alp, 有机络合态铁铝氧化物; MAP, 年降水量; MAT, 年平均气温。*, p < 0.05; **, p < 0.01; ***, p < 0.001。
Fig. 4
Correlations of total soil organic carbon (C) content, C content in different aggregate fractions and C decomposition rate with climatic, edaphic, plant and mineral variables in temperate grasslands of Nei Mongol. Soil organic C, macroaggregate C, microaggregate C, silt and clay C, and C decomposition rate standardized by SOC are lg transformed. The “+” and “-” in parentheses represent positive and negative correlations, respectively. AGB, aboveground biomass; AI, aridity index; CaExch, exchangeable Ca2+; Clay + silt, clay and silt content; Feo + Alo, poorly crystalline Fe/Al oxide; Fep + Alp, organically complexed Fe/Al oxide; MAP, mean annual precipitation; MAT, mean annual air temperature. *, p < 0.05; **, p < 0.01; ***, p < 0.001.
图5
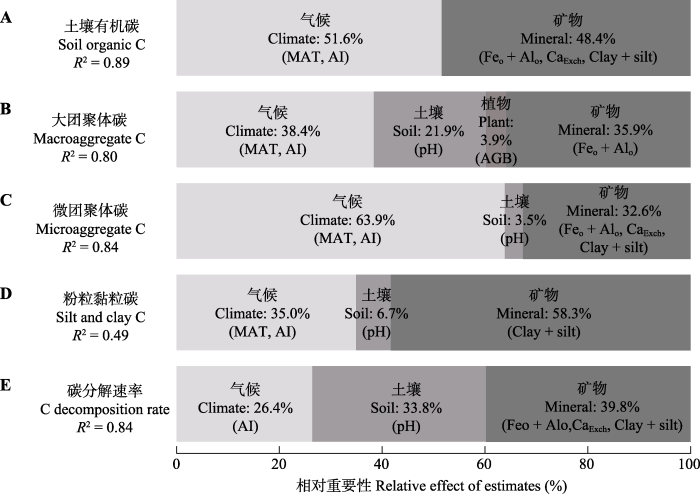
图5
气候、土壤、植物和矿物变量对内蒙古温带草地土壤有机碳含量(A)、碳组分含量(B-D)和碳分解速率(E)影响的相对重要性。土壤有机碳、大团聚体碳、微团聚体碳、粉粒黏粒碳含量和有机碳标准化的碳分解速率数据经过了lg转化。AGB, 地上生物量; AI, 干旱指数; CaExch, 交换性钙含量; Clay + silt, 黏粒和粉粒含量; Feo + Alo, 弱结晶态铁铝氧化物含量; MAP, 年降水量; MAT, 年平均气温。
Fig. 5
Relative effects of climatic, edaphic, plant and mineral variables on soil organic carbon (C) content (A), aggregate C fractions content (B-D), and C decomposition rate (E) in temperate grasslands of Nei Mongol. Soil organic C, macroaggregate C, microaggregate C, silt and clay C contents, and C decomposition rate standardized by SOC are lg transformed. AGB, aboveground biomass; AI, aridity index; CaExch, exchangeable Ca2+ content; Clay + silt, clay and silt content; Feo + Alo, poorly crystalline Fe/Al oxide content; MAP, mean annual precipitation; MAT, mean annual air temperature.
2.3 土壤碳分解速率的影响因素
普通最小二乘回归分析的结果显示, 随MAT和pH增加, 有机碳标准化的碳分解速率显著增加。而随MAP、AI、AGB、(Feo + Alo)含量、(Fep + Alp)含量、CaExch含量和(Clay + silt)含量增加, 土壤碳分解速率显著降低(p < 0.05) (图4)。进一步基于方差分解分析的结果表明矿物、土壤和气候因素对有机碳标准化碳分解速率的空间变异具有较高解释率(R2 = 0.84) (图5E)。其中, 矿物变量((Feo + Alo)含量、CaExch含量、(Clay + silt)含量)贡献总解释率的39.8%, 土壤pH贡献总解释率的33.8%, 气候因素即AI的解释率占总解释率的26.4% (图5E)。
3 讨论
3.1 不同草地类型土壤有机碳组分含量和分解速率的差异
本研究揭示了内蒙古温带草地表层土壤有机碳组分含量和分解速率的空间格局, 发现碳组分含量和有机碳标准化的碳分解速率均呈现明显的空间分布规律。土壤有机碳和各碳组分的含量均呈现自西南向东北增加的空间分布特征, 即草甸草原最高, 典型草原次之, 荒漠草原最低(图1)。有机碳标准化的碳分解速率则呈现相反的变化趋势(图2)。不同草地类型土壤有机碳含量的差异可能与土壤碳输入和输出过程有关。一方面, 不同草地类型的土壤碳输入量存在差异。内蒙古温带草地的113个地面数据表明, 草甸草原中植被地上生物量与地下生物量显著高于典型草原, 且二者均显著高于荒漠草原(马文红等, 2008)。鉴于植物地上和地下部分是土壤有机碳的主要来源(周正虎等, 2022), 土壤有机碳含量和植物生物量呈现出相同的变化规律。另一方面, 土壤有机碳分解速率会影响不同草地类型的土壤碳输出过程。通过计算单位质量土壤有机碳的碳分解速率, 本研究发现荒漠草原、典型草原、草甸草原的碳分解速率依次降低(图2B)。此外, 通过指数拟合累积碳释放量(Ccum)与培养时间(t)的关系(Ccum(t) = C0 × (1 - e-kt), k为分解速率常数)得到有机碳潜在矿化量(C0) (Rey & Jarvis, 2006), 发现荒漠草原的有机碳潜在矿化量最大(显著高于典型草原和草甸草原)。同时, 有机碳潜在矿化量与有机碳标准化的碳分解速率呈显著正相关关系(r = 0.91, p < 0.001), 共同表明荒漠草原中的土壤碳具有较强的可分解性。本研究发现, 由草甸草原到典型草原到荒漠草原, (Feo + Alo)含量((4.2 ± 1.6) g·kg-1 vs (3.1 ± 1.3) g·kg-1 vs (1.8 ± 0.4) g·kg-1)以及土壤粉粒和黏粒含量((29.8 ± 12.8)% vs (20.8 ± 9.3)% vs (19.2 ± 8.6)%)均呈现逐渐降低的趋势, 表明矿物保护作用对碳分解的抑制作用逐渐减弱。碳可分解性高可能促进土壤碳输出过程, 进而降低土壤碳含量。综上, 不同草地类型间土壤碳组分的差异取决于植物输入量和土壤有机碳可分解性的差异。
3.2 土壤有机碳及其组分含量的影响因素
本研究结果表明, 气候和矿物是内蒙古温带草地土壤有机碳和碳组分含量空间变异的主要影响因素(图4, 图5), 但两者在不同组分中的相对重要性存在差异。微团聚体碳组分含量的空间变异主要受气候因素影响, 而粉粒黏粒碳组分含量主要受矿物影响。除此之外, 土壤和植物因素解释了大团聚体碳含量的部分空间变异。不同碳组分含量影响因素的差异可能与其有机碳来源不同有关。大团聚体中的碳主要来源于植物残体(Six et al., 2002), 因此与其他组分相比, 大团聚体碳组分更易受植物因素的影响。随植物地上生物量增加, 植物向土壤的碳输入增加(周正虎等, 2022), 进而提高大团聚体碳含量(图4)。气候和土壤属性则可能通过影响植物生长间接影响大团聚体碳含量。一方面, 在干旱半干旱区, 植物生长普遍受到水分限制(Li et al., 2020)。张存厚等(2013)在内蒙古草原生态系统中的研究发现, 随MAP增加, 地上净初级生产力显著提高。因此, 土壤水分限制减弱(即AI增大)导致植物地上生物量增加, 进而促进大团聚体碳累积。另一方面, 研究区域的土壤多呈中性或碱性(pH介于6.0-8.9, 平均值为7.6 ± 1.0), 因而pH增加意味着土壤盐碱化程度升高, 可能降低植被生产力(Zhuang et al., 2022), 进而减小大团聚体碳含量。与此推论一致, 本研究中土壤pH和地上生物量呈显著负相关关系(r = -0.54, p < 0.001)。
与大团聚体碳组分不同, 微团聚体碳主要来源于半分解的植物残体, 并受到团聚体的物理保护(von Lützow et al., 2006)。来自内蒙古草地生态系统的研究表明, 降水是影响土壤团聚体形成的重要因素(王甜等, 2017)。降水量增加有利于地上和地下生物量的升高, 进而使得土壤碳输入增加, 促进土壤团聚体形成, 增强团聚体对有机碳的保护作用(王甜等, 2017)。与此推论一致, 本研究中微团聚体碳含量和MAP呈显著正相关关系(r = 0.72, p < 0.001)。与降水的促进作用相反, 微团聚体碳含量和MAT呈显著负相关关系(图4)。这可能是因为在本研究区域, 气温随降水量增加而降低, 而降水量是干旱半干旱区植物生长等过程的关键限制因素。
与大团聚体碳和微团聚体碳相比, 粉粒黏粒碳组分含量受矿物的影响较大。这主要是因为粉粒黏粒组分中的碳多为微生物来源, 易与土壤矿物结合(Ni et al., 2020)。土壤矿物含量增加可提供更多吸附位点, 有利于形成有机-矿物复合体(von Lützow et al., 2006), 进而促进粉粒黏粒碳的积累。除吸附有机碳形成化学保护外, 土壤细颗粒如粉粒和黏粒含量增加可提高土壤持水保肥能力, 促进植被生产力进而增加土壤碳输入(Yang et al., 2008), 因此矿物对总土壤有机碳积累同样具有十分重要的作用。来自青藏高原高寒草地的研究同样表明矿物因素是土壤有机碳及其组分(特别是细颗粒组分)含量空间变异的关键驱动因素(Fang et al., 2019), 本研究结果与之一致。
3.3 土壤碳分解速率的影响因素
本研究结果显示, 矿物、土壤和气候因素共同驱动土壤碳分解的空间变异。近年来, 越来越多的研究强调矿物保护在调控土壤碳稳定性和碳分解中的重要作用(Qin et al., 2021; 周正虎等, 2022)。矿物-有机碳结合是一种重要的土壤碳稳定机制, 主要包括活性铁铝氧化物与有机碳的配位体交换作用(Oades, 1988)以及多价阳离子桥(尤其是Ca2+)对层状硅酸盐和有机质的结合作用(Rowley et al., 2018)。矿物保护主要通过以下两条途径抑制土壤碳分解: 首先, 矿物吸附限制有机碳在土壤溶液中的扩散, 使微生物难以接触和利用底物, 进而抑制土壤碳分解(Rowley et al., 2018); 其次, 矿物可与土壤有机碳分解相关的胞外酶结合并导致其失活, 从而抑制微生物分解作用(Zimmerman & Ahn, 2011)。除矿物因素外, 随土壤pH升高, 有机碳标准化的碳分解速率显著增加(图4)。pH可能通过影响矿物含量间接影响土壤碳分解(Ye et al., 2022)。随pH升高, (Feo + Alo)含量显著降低(R2 = 0.38, p < 0.001), 可能减弱铁铝氧化物对有机碳的保护作用, 进而导致较高的土壤碳分解速率。此外, 有机碳标准化的碳分解速率与AI显著负相关(图4)。降水可能通过影响土壤团聚体形成间接影响碳分解速率。如上所述, 降水增加有利于土壤团聚体形成, 进而增强团聚体保护作用, 限制微生物与土壤有机碳和氧气接触(Six et al., 2002), 抑制土壤碳分解过程。
4 结论
基于样带调查和室内培养相结合的手段, 本研究揭示了内蒙古温带草地土壤有机碳组分含量和分解速率的空间格局及其驱动因素。结果发现, 土壤有机碳组分含量和碳分解速率分别呈现从西南向东北递增和递减的趋势。进一步分析发现气候和矿物因素是驱动土壤有机碳组分含量和分解速率空间变异的主要因素。此外, 不同碳组分的影响因素存在差异, 随土壤碳颗粒粒径减小, 矿物因素的相对重要性增强, 意味着矿物保护对于维持土壤碳长期固存起着重要作用。上述发现意味着地球系统模型中应区分不同碳组分的影响因素, 特别是考虑矿物对惰性碳组分和碳分解的影响, 进而更准确地预测土壤碳-气候反馈关系。
致谢
本研究得到了内蒙古大学马文红教授在野外考察工作中给予的大力帮助, 同时也感谢中国科学院植物研究所内蒙古温带草地考察队成员帮助采集土壤样品。
参考文献
Grassland soil carbon sequestration: current understanding, challenges, and solutions
DOI:10.1126/science.abo2380
PMID:35926033
[本文引用: 1]

Grasslands store approximately one third of the global terrestrial carbon stocks and can act as an important soil carbon sink. Recent studies show that plant diversity increases soil organic carbon (SOC) storage by elevating carbon inputs to belowground biomass and promoting microbial necromass contribution to SOC storage. Climate change affects grassland SOC storage by modifying the processes of plant carbon inputs and microbial catabolism and anabolism. Improved grazing management and biodiversity restoration can provide low-cost and/or high-carbon-gain options for natural climate solutions in global grasslands. The achievable SOC sequestration potential in global grasslands is 2.3 to 7.3 billion tons of carbon dioxide equivalents per year (COe year) for biodiversity restoration, 148 to 699 megatons of COe year for improved grazing management, and 147 megatons of COe year for sown legumes in pasturelands.
Soil microbial metabolic quotient in Inner Mongolian grasslands: patterns and influence factors
DOI:10.1007/s11769-019-1084-5 [本文引用: 1]
Determinants of carbon release from the active layer and permafrost deposits on the Tibetan Plateau
The sign and magnitude of permafrost carbon (C)-climate feedback are highly uncertain due to the limited understanding of the decomposability of thawing permafrost and relevant mechanistic controls over C release. Here, by combining aerobic incubation with biomarker analysis and a three-pool model, we reveal that C quality (represented by a higher amount of fast cycling C but a lower amount of recalcitrant C compounds) and normalized CO2-C release in permafrost deposits were similar or even higher than those in the active layer, demonstrating a high vulnerability of C in Tibetan upland permafrost. We also illustrate that C quality exerts the most control over CO2-C release from the active layer, whereas soil microbial abundance is more directly associated with CO2-C release after permafrost thaw. Taken together, our findings highlight the importance of incorporating microbial properties into Earth System Models when predicting permafrost C dynamics under a changing environment.
Spatial characteristics of soil organic carbon and nitrogen in Inner Mongolia
Studies on the amount and spatial distribution of soil organic carbon/nitrogen in Inner Mongolia and their relationship to main climate factors showed that the content of soil organic carbon and nitrogen was 3.24~43.24 kg·m<sup>-3</sup> and 269.56~3085.60 g·m<sup>-3</sup>,respectively, and the C/N ratio was about 4.46~17.13. The correlation between soil organic carbon/nitrogen and temperature was negative, and R was 0.557 and 0.460,respectively.Soil organic carbon/nitrogen had a weak positive correlation to precipitation, and Rwas 0.285 and 0.203. Soil organic carbon and nitrogen appeared a reducing trend with increasing temperature and decreasing precipitation from northeast to southwest.
内蒙古自治区土壤有机碳、氮蓄积量的空间特征
采用全国策二次土壤普查中内蒙古自治区的典型土种剖面资料,在剖面深度的基础上,用地统计学和地理信息系统(GIS)方法,分别按土壤类型和土地覆被类型计算了土壤有机碳、氮密度,分析了内蒙古自治区土壤有机碳、氮蓄积量的空间分布特征,探讨了土壤有机碳、氮蓄积量与主要气候要素的关系.结果表明,内蒙古自治区土壤有机碳密度处于3.24—43.24kg·m^-3之间,土壤有机氮密度处于269.56—3085.60g·m^-3之间,土壤碳、氮比(C/N)大致在4.46—17.13之间.土壤有机碳、氮密度与温度呈负相关,相关系数分别为0.557和0.460(n=245);与年均降水量呈正相关,但相关性不是很强,相关系数分别为0.285和0.203.从内蒙古自治区东北地区到西南地区,土壤有机碳、氮蓄积量随着温度递升和降水量递减呈现降低的趋势。
Drivers of microbial respiration and net N mineralization at the continental scale
DOI:10.1016/j.soilbio.2013.01.003 URL [本文引用: 1]
Temperature sensitivity of soil carbon decomposition and feedbacks to climate change
DOI:10.1038/nature04514 [本文引用: 1]
Linking temperature sensitivity of soil CO2 release to substrate, environmental, and microbial properties across alpine ecosystems
Soil carbon storage controlled by interactions between geochemistry and climate
DOI:10.1038/NGEO2516
[本文引用: 4]
Doetterl, Sebastian; Boeckx, Pascal Univ Ghent, Isotope Biosci Lab, B-9000 Ghent, Belgium. Doetterl, Sebastian Univ Augsburg, Dept Geog, D-86159 Augsburg, Germany. Stevens, Antoine; Van Oost, Kristof Catholic Univ Louvain, George Lemaitre Ctr Earth & Climate Res, Earth & Life Inst, B-1348 Louvain, Belgium. Stevens, Antoine; Six, Johan ETH, Dept Environm Syst Sci, CH-8092 Zurich, Switzerland. Merckx, Roel Katholieke Univ Leuven, Dept Earth & Environm Sci, B-3001 Heverlee, Belgium. Casanova Pinto, Manuel Univ Chile, Dept Ingn & Suelos, Santiago 8820808, Chile. Casanova-Katny, Angelica Univ Santiago Chile, Fac Quim & Farm, Santiago 8820808, Chile. Munoz, Cristina; Zagal Venegas, Erick Univ Concepcion, Dept Ciencias Suelo & Recursos Nat, Chillan 3812120, Chile. Boudin, Mathieu Royal Inst Cultural Heritage, B-1000 Brussels, Belgium.
Soil organic matter turnover is governed by accessibility not recalcitrance
DOI:10.1111/gcb.2012.18.issue-6 URL [本文引用: 1]
Organic matter contained in soil aggregates from a tropical chronosequence: correction for sand and light fraction
DOI:10.1016/0167-8809(91)90127-J URL [本文引用: 1]
How many areas of grasslands are there in China?
我国草地面积有多大?
Al/Fe mineral controls on soil organic carbon stock across Tibetan alpine grasslands
DOI:10.1029/2018JG004782
[本文引用: 3]
Adequate understanding of the controlling factors of soil carbon (C) stock is crucial for improving the predictability of Earth System Models in exploring terrestrial C-climate feedback. Current studies, however, mainly focus on climatic and edaphic variables and rarely explore the effects of mineral protection in regulating soil organic carbon (SOC) stock over broad geographic scale. Particularly, the relative importance of mineral protection compared with other factors is unclear. Based on large-scale soil inventory, here we filled this knowledge gap by exploring the effects of Al/Fe-(hydr) oxides on SOC and three C fractions across Tibetan alpine grasslands via linear regression, partial correlation, and variance partitioning analyses, and also by comparing the degree of mineral protection in alpine grasslands with other ecosystems. Our results showed that SOC and C fractions across Tibetan alpine grasslands were regulated by Al/Fe-(hydr) oxides, with the incorporation of mineral variables increasing the explained variations by 10.1% for SOC content, 13.4% for coarse particulate organic matter, 12.6% for microaggregate associated C, and 21.9% for silt and clay associated C. Moreover, the contribution of mineral effects exceeded that of climatic and edaphic factors, particularly in the silt and clay associated C fraction. In addition, about 15.812.0% of SOC pools were associated with Fe, which was equal to or higher than those in temperate and tropical-subtropical ecosystems. Taken together, these results demonstrate the significant role of Al/Fe minerals in the stabilization of SOC across Tibetan alpine grasslands, highlighting the importance of incorporating C-mineral interactions into ESMs for better understanding the terrestrial C-climate feedback.
Global carbon budget 2020
DOI:10.5194/essd-12-3269-2020
URL
[本文引用: 1]
. Accurate assessment of anthropogenic carbon dioxide (CO2) emissions and\ntheir redistribution among the atmosphere, ocean, and terrestrial biosphere\nin a changing climate – the “global carbon budget” – is important to\nbetter understand the global carbon cycle, support the development of\nclimate policies, and project future climate change. Here we describe and\nsynthesize data sets and methodology to quantify the five major components\nof the global carbon budget and their uncertainties. Fossil CO2\nemissions (EFOS) are based on energy statistics and cement production\ndata, while emissions from land-use change (ELUC), mainly\ndeforestation, are based on land use and land-use change data and\nbookkeeping models. Atmospheric CO2 concentration is measured directly\nand its growth rate (GATM) is computed from the annual changes in\nconcentration. The ocean CO2 sink (SOCEAN) and terrestrial\nCO2 sink (SLAND) are estimated with global process models\nconstrained by observations. The resulting carbon budget imbalance\n(BIM), the difference between the estimated total emissions and the\nestimated changes in the atmosphere, ocean, and terrestrial biosphere, is a\nmeasure of imperfect data and understanding of the contemporary carbon\ncycle. All uncertainties are reported as ±1σ. For the last\ndecade available (2010–2019), EFOS was 9.6 ± 0.5 GtC yr−1 excluding the cement carbonation sink (9.4 ± 0.5 GtC yr−1 when the cement carbonation sink is included), and\nELUC was 1.6 ± 0.7 GtC yr−1. For the same decade, GATM was 5.1 ± 0.02 GtC yr−1 (2.4 ± 0.01 ppm yr−1), SOCEAN 2.5 ± 0.6 GtC yr−1, and SLAND 3.4 ± 0.9 GtC yr−1, with a budget\nimbalance BIM of −0.1 GtC yr−1 indicating a near balance between\nestimated sources and sinks over the last decade. For the year 2019 alone, the\ngrowth in EFOS was only about 0.1 % with fossil emissions increasing\nto 9.9 ± 0.5 GtC yr−1 excluding the cement carbonation sink (9.7 ± 0.5 GtC yr−1 when cement carbonation sink is included), and ELUC was 1.8 ± 0.7 GtC yr−1, for total anthropogenic CO2 emissions of 11.5 ± 0.9 GtC yr−1 (42.2 ± 3.3 GtCO2). Also for 2019, GATM was\n5.4 ± 0.2 GtC yr−1 (2.5 ± 0.1 ppm yr−1), SOCEAN\nwas 2.6 ± 0.6 GtC yr−1, and SLAND was 3.1 ± 1.2 GtC yr−1, with a BIM of 0.3 GtC. The global atmospheric CO2\nconcentration reached 409.85 ± 0.1 ppm averaged over 2019. Preliminary\ndata for 2020, accounting for the COVID-19-induced changes in emissions,\nsuggest a decrease in EFOS relative to 2019 of about −7 % (median\nestimate) based on individual estimates from four studies of −6 %, −7 %,\n−7 % (−3 % to −11 %), and −13 %. Overall, the mean and trend in the\ncomponents of the global carbon budget are consistently estimated over the\nperiod 1959–2019, but discrepancies of up to 1 GtC yr−1 persist for the\nrepresentation of semi-decadal variability in CO2 fluxes. Comparison of\nestimates from diverse approaches and observations shows (1) no consensus\nin the mean and trend in land-use change emissions over the last decade, (2)\na persistent low agreement between the different methods on the magnitude of\nthe land CO2 flux in the northern extra-tropics, and (3) an apparent\ndiscrepancy between the different methods for the ocean sink outside the\ntropics, particularly in the Southern Ocean. This living data update\ndocuments changes in the methods and data sets used in this new global\ncarbon budget and the progress in understanding of the global carbon cycle\ncompared with previous publications of this data set (Friedlingstein et al.,\n2019; Le Quéré et al., 2018b, a, 2016, 2015b, a, 2014,\n2013). The data presented in this work are available at https://doi.org/10.18160/gcp-2020 (Friedlingstein et al., 2020).\n
Storage and transformation of organic matter fractions in cryoturbated permafrost soils across the Siberian Arctic
DOI:10.5194/bg-12-4525-2015
URL
[本文引用: 1]
. In permafrost soils, the temperature regime and the resulting cryogenic processes are important determinants of the storage of organic carbon (OC) and its small-scale spatial variability. For cryoturbated soils, there is a lack of research assessing pedon-scale heterogeneity in OC stocks and the transformation of functionally different organic matter (OM) fractions, such as particulate and mineral-associated OM. Therefore, pedons of 28 Turbels were sampled in 5 m wide soil trenches across the Siberian Arctic to calculate OC and total nitrogen (TN) stocks based on digital profile mapping. Density fractionation of soil samples was performed to distinguish between particulate OM (light fraction, LF, < 1.6 g cm−3), mineral associated OM (heavy fraction, HF, > 1.6 g cm−3), and a mobilizable dissolved pool (mobilizable fraction, MoF). Across all investigated soil profiles, the total OC storage was 20.2 ± 8.0 kg m−2 (mean ± SD) to 100 cm soil depth. Fifty-four percent of this OC was located in the horizons of the active layer (annual summer thawing layer), showing evidence of cryoturbation, and another 35 % was present in the upper permafrost. The HF-OC dominated the overall OC stocks (55 %), followed by LF-OC (19 % in mineral and 13 % in organic horizons). During fractionation, approximately 13 % of the OC was released as MoF, which likely represents a readily bioavailable OM pool. Cryogenic activity in combination with cold and wet conditions was the principle mechanism through which large OC stocks were sequestered in the subsoil (16.4 ± 8.1 kg m−2; all mineral B, C, and permafrost horizons). Approximately 22 % of the subsoil OC stock can be attributed to LF material subducted by cryoturbation, whereas migration of soluble OM along freezing gradients appeared to be the principle source of the dominant HF (63 %) in the subsoil. Despite the unfavourable abiotic conditions, low C / N ratios and high δ13C values indicated substantial microbial OM transformation in the subsoil, but this was not reflected in altered LF and HF pool sizes. Partial least-squares regression analyses suggest that OC accumulates in the HF fraction due to co-precipitation with multivalent cations (Al, Fe) and association with poorly crystalline iron oxides and clay minerals. Our data show that, across all permafrost pedons, the mineral-associated OM represents the dominant OM fraction, suggesting that the HF-OC is the OM pool in permafrost soils on which changing soil conditions will have the largest impact.\n
Dryland soils in northern China sequester carbon during the early 2000s warming hiatus period
DOI:10.1111/fec.2018.32.issue-6 URL [本文引用: 2]
A statistical approach to some basic mine valuation problems on the Witwatersrand
Conceptualizing soil organic matter into particulate and mineral-associated forms to address global change in the 21st century
DOI:10.1111/gcb.14859
PMID:31587451
[本文引用: 1]
Managing soil organic matter (SOM) stocks to address global change challenges requires well-substantiated knowledge of SOM behavior that can be clearly communicated between scientists, management practitioners, and policy makers. However, SOM is incredibly complex and requires separation into multiple components with contrasting behavior in order to study and predict its dynamics. Numerous diverse SOM separation schemes are currently used, making cross-study comparisons difficult and hindering broad-scale generalizations. Here, we recommend separating SOM into particulate (POM) and mineral-associated (MAOM) forms, two SOM components that are fundamentally different in terms of their formation, persistence, and functioning. We provide evidence of their highly contrasting physical and chemical properties, mean residence times in soil, and responses to land use change, plant litter inputs, warming, CO enrichment, and N fertilization. Conceptualizing SOM into POM versus MAOM is a feasible, well-supported, and useful framework that will allow scientists to move beyond studies of bulk SOM, but also use a consistent separation scheme across studies. Ultimately, we propose the POM versus MAOM framework as the best way forward to understand and predict broad-scale SOM dynamics in the context of global change challenges and provide necessary recommendations to managers and policy makers.© 2019 John Wiley & Sons Ltd.
Land-use history impacts functional diversity across multiple trophic groups
DOI:10.1073/pnas.1910023117
PMID:31907310
[本文引用: 1]
Land-use change is a major driver of biodiversity loss worldwide. Although biodiversity often shows a delayed response to land-use change, previous studies have typically focused on a narrow range of current landscape factors and have largely ignored the role of land-use history in shaping plant and animal communities and their functional characteristics. Here, we used a unique database of 220,000 land-use records to investigate how 20-y of land-use changes have affected functional diversity across multiple trophic groups (primary producers, mutualists, herbivores, invertebrate predators, and vertebrate predators) in 75 grassland fields with a broad range of land-use histories. The effects of land-use history on multitrophic trait diversity were as strong as other drivers known to impact biodiversity, e.g., grassland management and current landscape composition. The diversity of animal mobility and resource-acquisition traits was lower in landscapes where much of the land had been historically converted from grassland to crop. In contrast, functional biodiversity was higher in landscapes containing old permanent grasslands, most likely because they offer a stable and high-quality habitat refuge for species with low mobility and specialized feeding niches. Our study shows that grassland-to-crop conversion has long-lasting impacts on the functional biodiversity of agricultural ecosystems. Accordingly, land-use legacy effects must be considered in conservation programs aiming to protect agricultural biodiversity. In particular, the retention of permanent grassland sanctuaries within intensive landscapes may offset ecological debts.
The contentious nature of soil organic matter
DOI:10.1038/nature16069 [本文引用: 1]
Deepened winter snow cover enhances net ecosystem exchange and stabilizes plant community composition and productivity in a temperate grassland
DOI:10.1111/gcb.15051
PMID:32107822
[本文引用: 1]
Global warming has greatly altered winter snowfall patterns, and there is a trend towards increasing winter snow in semi-arid regions in China. Winter snowfall is an important source of water during early spring in these water-limited ecosystems, and it can also affect nutrient supply. However, we know little about how changes in winter snowfall will affect ecosystem productivity and plant community structure during the growing season. Here, we conducted a 5-year winter snow manipulation experiment in a temperate grassland in Inner Mongolia. We measured ecosystem carbon flux from 2014 to 2018 and plant biomass and species composition from 2015 to 2018. We found that soil moisture increased under deepened winter snow in early growing season, particularly in deeper soil layers. Deepened snow increased the net ecosystem exchange of CO (NEE) and reduced intra- and inter-annual variation in NEE. Deepened snow did not affect aboveground plant biomass (AGB) but significantly increased root biomass. This suggested that the enhanced NEE was allocated to the belowground, which improved water acquisition and thus contributed to greater stability in NEE in deep-snow plots. Interestingly, the AGB of grasses in the control plots declined over time, resulting in a shift towards a forb-dominated system. Similar declines in grass AGB were also observed at three other locations in the region over the same time frame and are attributed to 4 years of below-average precipitation during the growing season. By contrast, grass AGB was stabilized under deepened winter snow and plant community composition remained unchanged. Hence, our study demonstrates that increased winter snowfall may stabilize arid grassland systems by reducing resource competition, promoting coexistence between plant functional groups, which ultimately mitigates the impacts of chronic drought during the growing season.© 2020 John Wiley & Sons Ltd.
Different climate sensitivity of particulate and mineral-associated soil organic matter
DOI:10.1038/s41561-021-00744-x [本文引用: 1]
Toward more realistic projections of soil carbon dynamics by earth system models
DOI:10.1002/gbc.v30.1 URL [本文引用: 1]
Environmental factors covary with plant diversity-productivity relationships among Chinese grassland sites
DOI:10.1111/geb.2010.19.issue-2 URL [本文引用: 1]
Above and belowground biomass in relation to environmental factors in temperate grasslands, Inner Mongolia
内蒙古温带草地生物量及其与环境因子的关系
A quantitative assessment of amino sugars in soil profiles
The retention of organic matter in soils
DOI:10.1007/BF02180317 URL [本文引用: 1]
Temperature sensitivity of permafrost carbon release mediated by mineral and microbial properties
Large-scale evidence reveals that mineral and microbial properties mediate permafrost C release and its temperature response.
Modelling the effect of temperature on carbon mineralization rates across a network of European forest sites (FORCAST)
DOI:10.1111/gcb.2006.12.issue-10 URL [本文引用: 1]
Calcium- mediated stabilisation of soil organic carbon
DOI:10.1007/s10533-017-0410-1 [本文引用: 2]
Organic and inorganic carbon in the topsoil of the Mongolian and Tibetan grasslands: pattern, control and implications
DOI:10.5194/bg-9-2287-2012
URL
[本文引用: 1]
. Soil carbon (C) is the largest C pool in the terrestrial biosphere and includes both inorganic and organic components. Studying patterns and controls of soil C help us to understand and estimate potential responses of soil C to global change in the future. Here we analyzed topsoil data of 81 sites obtained from a regional survey across grasslands in the Inner Mongolia and on the Tibetan Plateau during 2006–2007, attempting to find the patterns and controls of soil inorganic carbon (SIC) and soil organic carbon (SOC). The averages of inorganic and organic carbon in the topsoil (0–20 cm) across the study region were 0.38% and 3.63%, ranging between 0.00–2.92% and 0.32–26.17% respectively. Both SIC and SOC in the Tibetan grasslands (0.51% and 5.24% respectively) were higher than those in the Inner Mongolian grasslands (0.21% and 1.61%). Regression tree analyses showed that the spatial pattern of SIC and SOC were controlled by different factors. Chemical and physical processes of soil formation drive the spatial pattern of SIC, while biotic processes drive the spatial pattern of SOC. SIC was controlled by soil acidification and other processes depending on soil pH. Vegetation type is the most important variable driving the spatial pattern of SOC. According to our models, given the acidification rate in Chinese grassland soils in the future is the same as that in Chinese cropland soils during the past two decades: 0.27 and 0.48 units per 20 yr in the Inner Mongolian grasslands and the Tibetan grasslands respectively, it will lead to a 30% and 53% decrease in SIC in the Inner Mongolian grasslands and the Tibetan grasslands respectively. However, negative relationship between soil pH and SOC suggests that acidification will inhibit decomposition of SOC, thus will not lead to a significant general loss of carbon from soils in these regions.\n
Stabilization mechanisms of soil organic matter: implications for C-saturation of soils
DOI:10.1023/A:1016125726789 URL [本文引用: 4]
Soil macroaggregate turnover and microaggregate formation: a mechanism for C sequestration under no-tillage agriculture
DOI:10.1016/S0038-0717(00)00179-6 URL [本文引用: 1]
Changes in soil organic carbon storage predicted by Earth system models during the 21st century
DOI:10.5194/bg-11-2341-2014
URL
[本文引用: 1]
. Soil is currently thought to be a sink for carbon; however, the response of this sink to increasing levels of atmospheric carbon dioxide and climate change is uncertain. In this study, we analyzed soil organic carbon (SOC) changes from 11 Earth system models (ESMs) contributing simulations to the Coupled Model Intercomparison Project Phase 5 (CMIP5). We used a reduced complexity model based on temperature and moisture sensitivities to analyze the drivers of SOC change for the historical and high radiative forcing (RCP 8.5) scenarios between 1850 and 2100. ESM estimates of SOC changed over the 21st century (2090–2099 minus 1997–2006) ranging from a loss of 72 Pg C to a gain of 253 Pg C with a multi-model mean gain of 65 Pg C. Many ESMs simulated large changes in high-latitude SOC that ranged from losses of 37 Pg C to gains of 146 Pg C with a multi-model mean gain of 39 Pg C across tundra and boreal biomes. All ESMs showed cumulative increases in global NPP (11 to 59%) and decreases in SOC turnover times (15 to 28%) over the 21st century. Most of the model-to-model variation in SOC change was explained by initial SOC stocks combined with the relative changes in soil inputs and decomposition rates (R2 = 0.89, p < 0.01). Between models, increases in decomposition rate were well explained by a combination of initial decomposition rate, ESM-specific Q10-factors, and changes in soil temperature (R2 = 0.80, p < 0.01). All SOC changes depended on sustained increases in NPP with global change (primarily driven by increasing CO2). Many ESMs simulated large accumulations of SOC in high-latitude biomes that are not consistent with empirical studies. Most ESMs poorly represented permafrost dynamics and omitted potential constraints on SOC storage, such as priming effects, nutrient availability, mineral surface stabilization, and aggregate formation. Future models that represent these constraints are likely to estimate smaller increases in SOC storage over the 21st century.\n
Stabilization of organic matter in temperate soils: mechanisms and their relevance under different soil conditions—A review
DOI:10.1111/ejs.2006.57.issue-4 URL [本文引用: 2]
Allocation of mass and stability of soil aggregate in different types of Nei Mongol grasslands
DOI:10.17521/cjpe.2017.0220
[本文引用: 2]
<p><b><i>Aims </i></b>Soil aggregate is an important component of soil structure, playing an important role in the physical and biological protection mechanism of soil organic carbon (SOC) through isolating SOC from microorganisms. As far as we know, there are few studies, however, on exploring the spatial distribution of soil aggregate at the regional scale. Our objective was to investigate the mass allocation and stability of soil aggregate in different types of Nei Mongol grasslands.<br> <b><i>Methods </i></b>We have established 78 sites with a size of 10 m × 10 m across the transect of Nei Mongol grasslands and collected soil samples from different soil depth up to 1 m. We used wet sieving method to separate different sizes of aggregate partition and used mean mass diameter (<i>MMD</i>) and geometric mean diameter (<i>GMD</i>) in order to evaluate the stability of soil aggregate. The two-way ANOVA was used to test the difference of mass percentage and stability of soil aggregate in different grassland types and soil depths. In addition, a linear regression analysis was used to analyze the correlations of mass percentage and stability of soil aggregate with both mean annual precipitation (<i>MAP</i>) and mean annual temperature (<i>MAT</i>).<br> <b><i>Important findings</i></b> The results showed that the mass percentages of soil aggregate were highest in meadow steppe, while almost equal in typical steppe and desert steppe. However, no significant patterns were found along the soil depth. The mass percentage of soil aggregate fractions were positively correlated with MAP in all soil layers, but negatively correlated with <i>MAT</i> except the layer of 70-100 cm. For the stability of soil aggregate, at 0-10 and 10-20 cm, <i>MMD</i> and <i>GMD</i> of meadow steppe were significantly greater than those of typical and desert steppes, whereas no significant differences among three grassland types were found for other soil layers. Besides, <i>MMD</i> and<i> GMD</i> in meadow steppe and typical steppe gradually decreased along the soil depth.</p>
内蒙古不同类型草原土壤团聚体含量的分配及其稳定性
DOI:10.17521/cjpe.2017.0220
[本文引用: 2]
土壤团聚体是土壤结构的重要组成部分, 是土壤保护其有机碳的一种重要物理与生物机制, 但迄今为止对其空间格局分布的研究较少。该文研究了我国内蒙古3种草原类型(草甸草原、典型草原、荒漠草原)不同土层深度的土壤团聚体质量百分比及其稳定性的分布规律。结果显示: 土壤团聚体的质量百分比在3种草原类型各个土层深度的分布均呈现草甸草原>典型草原=荒漠草原的趋势, 而沿土层深度3种草原类型的土壤团聚体的质量百分比含量并未呈现显著规律。各层的土壤团聚体质量百分比均与年降水量呈显著正相关关系; 除70-100 cm土层外, 其与年平均气温均呈负相关关系。对土壤团聚体稳定性而言, 在0-10 cm和10-20 cm两个土层深度, 草甸草原土壤团聚体的平均质量直径与几何平均直径显著大于典型草原和荒漠草原, 而在其他土层, 3种草原类型间无显著差异。随着土层深度的增加, 草甸草原和典型草原土壤团聚体的平均质量直径与几何平均直径均呈现逐渐降低的趋势。该文对于理解内蒙古不同类型草原土壤有机碳的稳定性和保护机制具有重要意义。
A comparative assessment of support vector regression, artificial neural networks, and random forests for predicting and mapping soil organic carbon stocks across an Afromontane landscape
DOI:10.1016/j.ecolind.2014.12.028 URL [本文引用: 1]
Pilot Analysis of Global Ecosystems: Grassland Ecosystems
Soil carbon stock and its changes in northern China’s grasslands from 1980s to 2000s
DOI:10.1111/gcb.2010.16.issue-11 URL [本文引用: 1]
Storage, patterns and controls of soil organic carbon in the Tibetan grasslands
DOI:10.1111/gcb.2008.14.issue-7 URL [本文引用: 1]
Terrestrial carbon sinks in China and around the world and their contribution to carbon neutrality
DOI:10.1007/s11427-021-2045-5 [本文引用: 1]
Association of organic carbon with reactive iron oxides driven by soil pH at the global scale
Response of meadow steppe ANPP to climate change in Hulunbeir, Inner Mongolia—A simulation study
呼伦贝尔草甸草原地上净初级生产力对气候变化响应的模拟
DOI:10.11686/cyxb20130306
[本文引用: 1]
利用内蒙古呼伦贝尔草原额尔古纳右旗牧业气象试验站1994-2009年牧草生长季逐月实测资料,对CENTURY模型进行检验,模拟了呼伦贝尔草甸草原1961-2010年间地上净初级生产力(ANPP)动态,并与26个气象因子进行相关性分析。模型检验结果显示,生长季内逐月地上生物量模拟值与观测值之间的相关系数为R<sup>2</sup>=0.53,斜率b=0.94,误差平方根值为72.07 g/m<sup>2</sup>,平均绝对百分比误差为38.02%。检验结果表明,CENTURY模型能够成功地模拟这类草原的季节动态和年际变化。在过去的50年中,呼伦贝尔草甸草原温度增加,降水略增,ANPP增加。相关分析表明,ANPP与生长季降水量(r=0.372)呈极显著正相关;与年平均最低气温、年平均地面气温、年平均气温、7月降水量呈显著正相关;与年平均风速(r=-0.382)呈极显著负相关;与其他气象因子无显著的相关关系。应用区域气候模式系统PRECIS输出的2021-2050年气候情景数据分析得出,在SRES B2、A2和A1B情景下,未来呼伦贝尔草甸草原平均最高气温和最低气温都将呈显著升高趋势,降水量略增,ANPP虽然在年际间存在波动,但总体呈明显增加态势,分别较基准时段增加了67.14%,69.65%和76.58%,增加速率分别为16.51,17.34和16.42 g/(m<sup>2</sup>·10 a)。在3种情景下,未来气候变化均会对呼伦贝尔草甸草原群落生产力产生显著的正面影响。
Soil organic carbon stabilization and formation: mechanism and model
土壤有机碳的稳定和形成: 机制和模型
Unequal weakening of urbanization and soil salinization on vegetation production capacity
Climate change mitigation: a spatial analysis of global land suitability for clean development mechanism afforestation and reforestation
DOI:10.1016/j.agee.2008.01.014 URL [本文引用: 1]
