
植物生态学报 ›› 2022, Vol. 46 ›› Issue (4): 383-393.DOI: 10.17521/cjpe.2021.0219 cstr: 32100.14.cjpe.2021.0219
熊博文, 李桐, 黄樱, 鄢春华*( ), 邱国玉*()
收稿日期:2021-06-08
接受日期:2021-07-05
出版日期:2022-04-20
发布日期:2021-08-02
作者简介:(qiugy@pkusz.edu.cn)基金资助:
XIONG Bo-Wen, LI Tong, HUANG Ying, YAN Chun-Hua*(), QIU Guo-Yu*()
Received:2021-06-08
Accepted:2021-07-05
Online:2022-04-20
Published:2021-08-02
Supported by:摘要:
参考温度的参数化过程一直是三温模型反演蒸散发及其蒸发、蒸腾组分的关键和难点。该研究基于典型城市草坪的波文比与热红外观测数据, 对三温模型植被蒸腾子模型中涉及的输入变量进行敏感性分析和误差分析, 确定对三温模型反演植被蒸腾精度最为关键的变量, 而后量化和对比输入变量参数化方法对三温模型计算草坪蒸腾的影响, 由此确定最佳的参考温度取值。结果表明: 1)参考叶片温度选择为整个纸片温度的最大值时反演效果最好(R2 = 0.91, 均方根误差(RMSE) = 0.078 mm·h-1); 2)采用植被冠层温度的最大值为参考温度时, 直接假定了植被最高温度冠层蒸腾为0 (实际存在一定的蒸腾速率), 所以容易低估实际蒸腾量, 造成三温模型反演精度略低于取值参考叶片温度最大值的方法, 但反演效果仍然较好(R2 = 0.87, RMSE = 0.080 mm·h-1)。因此, 考虑到参考叶片设置的局限性, 如果在实际应用中无法或者没有实际测量参考叶片温度时, 使用植被最大温度为参考温度也可达到较好的反演效果。
熊博文, 李桐, 黄樱, 鄢春华, 邱国玉. 不同参考温度取值对三温模型反演植被蒸腾精度的影响. 植物生态学报, 2022, 46(4): 383-393. DOI: 10.17521/cjpe.2021.0219
XIONG Bo-Wen, LI Tong, HUANG Ying, YAN Chun-Hua, QIU Guo-Yu. Effects of different reference temperature values on the accuracy of vegetation transpiration estimation by three-temperature model. Chinese Journal of Plant Ecology, 2022, 46(4): 383-393. DOI: 10.17521/cjpe.2021.0219
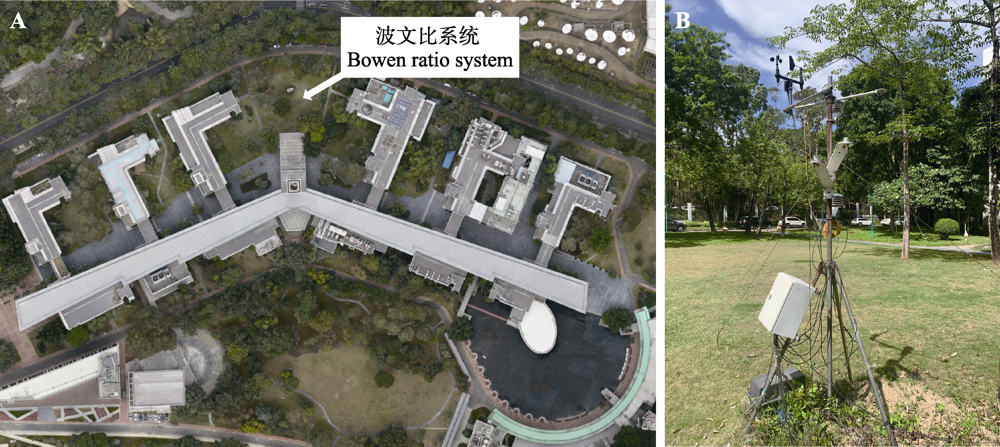
图1 研究区概况。A, 北京大学深圳研究生院校园。B, 波文比系统。
Fig. 1 Study area. A, Peking University Shenzhen Graduate School campus. B, Bowen ratio system.
| 气象要素 Meteorological factor | 仪器型号 Instrument model | 安装高度 Height (m) | 测量精度 Measuring accuracy |
|---|---|---|---|
| 气温和相对湿度 Air temperature and relative humidity | 225-050YA, Novalynx, Grass Valley, USA | 2.0, 1.5 | ±3%, ±0.6 ℃ |
| 风速与风向 Wind speed and direction | 200-WS-02, Novalynx, Grass Valley, USA | 2.0 | ±0.2 m∙s-1, ±3° |
| 太阳辐射 Solar radiation | PYP-PA, Apogee, Santa Monica, USA | 2.0 | 10-40 μV·W-1·m-2 |
| 有效光合辐射 Photosynthetic active radiation | QSOA-S, Apogee, Santa Monica, USA | 2.0 | <3% |
| 太阳净辐射 Net solar radiation | 240-100, Novalynx, Grass Valley, USA | 2.0 | <4% |
| 土壤热通量 Soil heat flux | HFP01, Hukseflux, Center Moriche, USA | -0.05, -0.02 | 50 μV·W-1·m-2 |
表1 波文比系统气象观测传感器信息
Table 1 Sensor information of meteorological measurements at the Bowen ratio system
| 气象要素 Meteorological factor | 仪器型号 Instrument model | 安装高度 Height (m) | 测量精度 Measuring accuracy |
|---|---|---|---|
| 气温和相对湿度 Air temperature and relative humidity | 225-050YA, Novalynx, Grass Valley, USA | 2.0, 1.5 | ±3%, ±0.6 ℃ |
| 风速与风向 Wind speed and direction | 200-WS-02, Novalynx, Grass Valley, USA | 2.0 | ±0.2 m∙s-1, ±3° |
| 太阳辐射 Solar radiation | PYP-PA, Apogee, Santa Monica, USA | 2.0 | 10-40 μV·W-1·m-2 |
| 有效光合辐射 Photosynthetic active radiation | QSOA-S, Apogee, Santa Monica, USA | 2.0 | <3% |
| 太阳净辐射 Net solar radiation | 240-100, Novalynx, Grass Valley, USA | 2.0 | <4% |
| 土壤热通量 Soil heat flux | HFP01, Hukseflux, Center Moriche, USA | -0.05, -0.02 | 50 μV·W-1·m-2 |
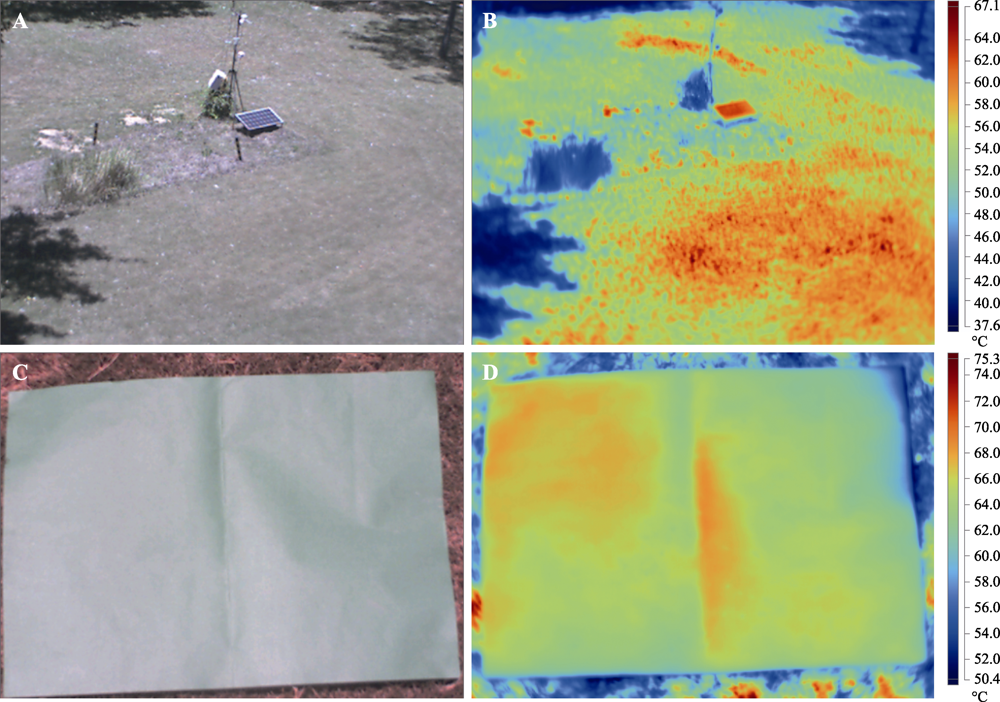
图2 草坪和参考叶片的可见光与热红外图像。A, 草坪可见光图像。B, 草坪热红外图像。C, 参考叶片可见光图像。D, 参考叶片热红外图像。
Fig. 2 Visible light and thermal infrared images of the lawn and the reference leaf. A, Visible images of the lawn. B, Thermal infrared images of the lawn. C, Visible images of the reference leaf. D, Thermal infrared images of the reference leaf.
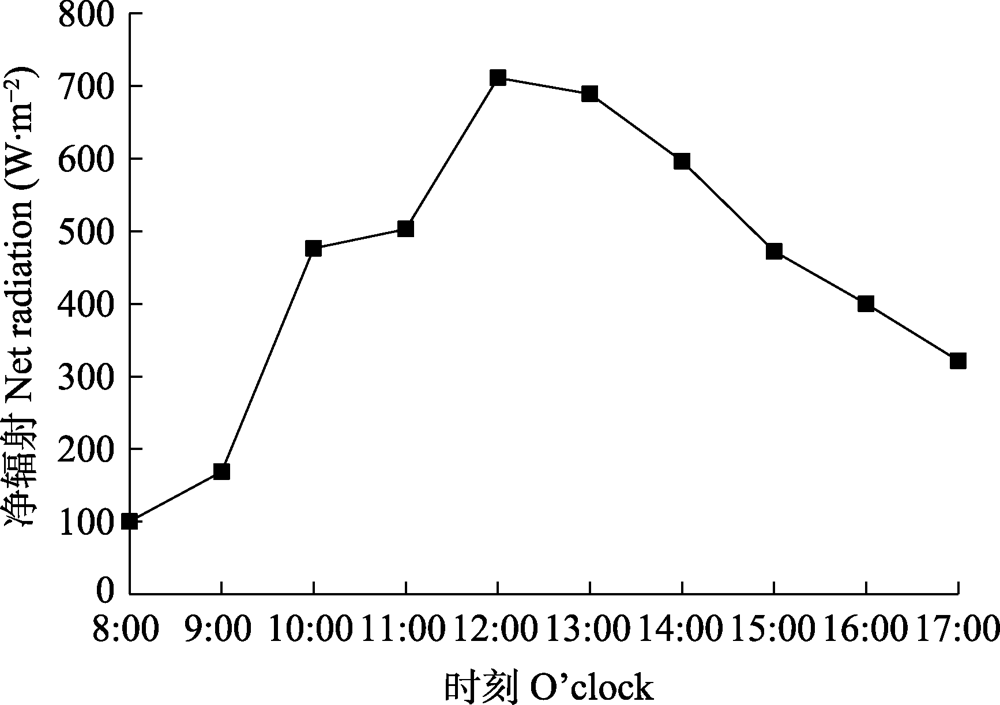
图3 净辐射的日间变化。
Fig. 3 Diurnal variation of the net radiation.
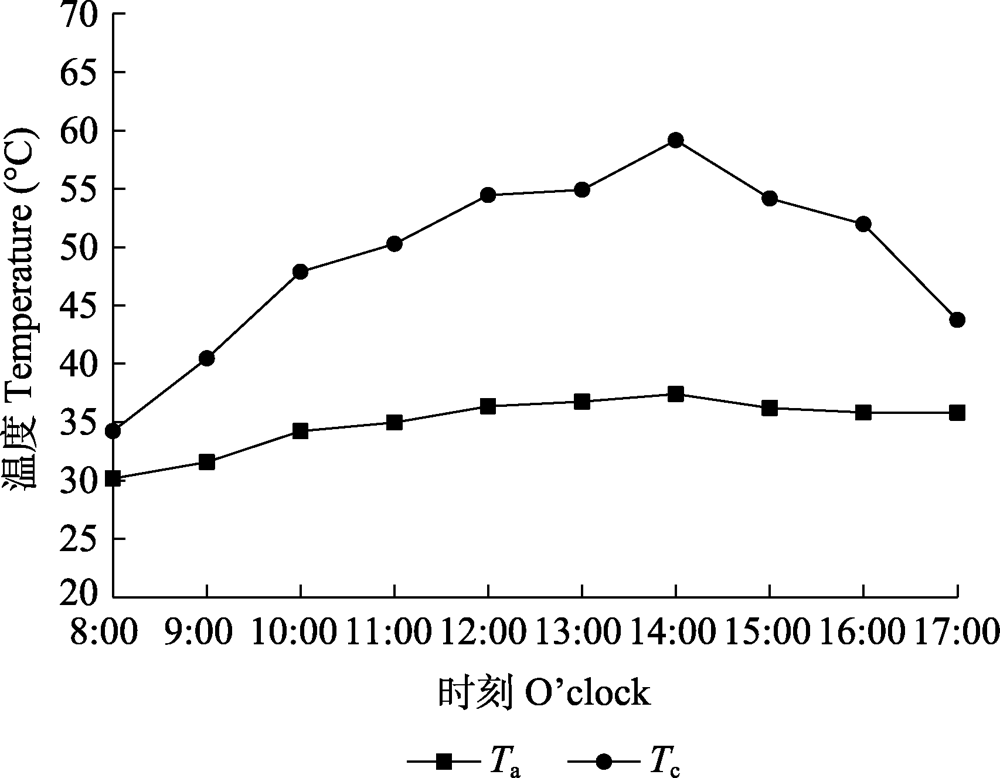
图4 气温(Ta)和植被表面温度(Tc)的日间变化。
Fig. 4 Diurnal variation of the air temperature (Ta) and vegetation canopy temperature (Tc).
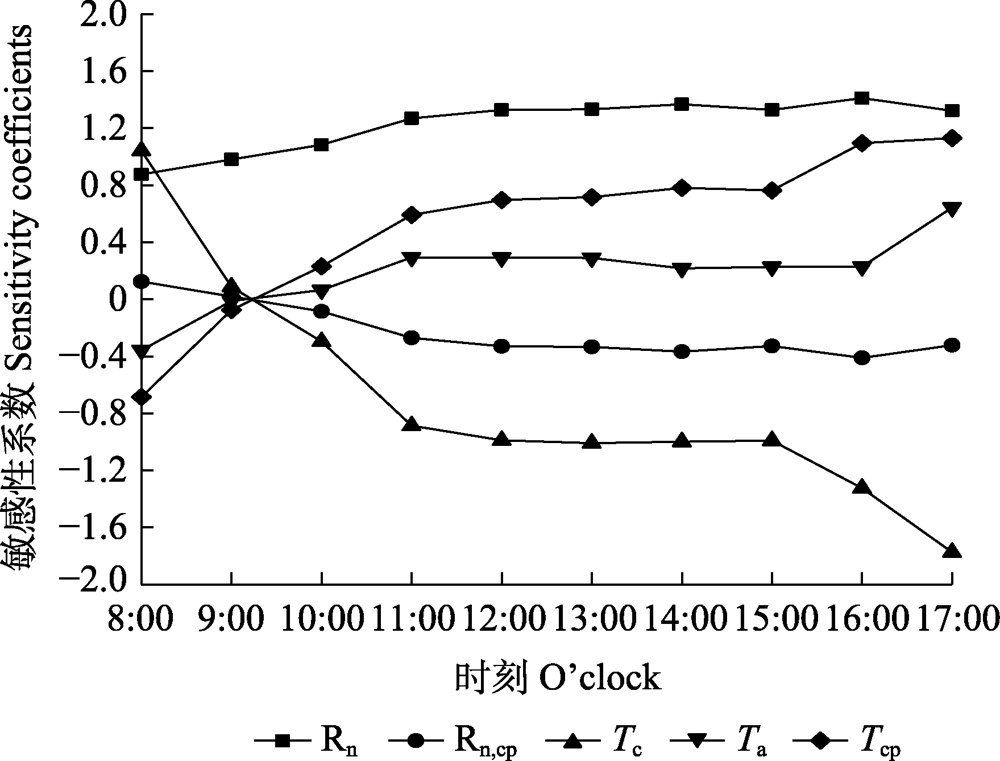
图5 各参数敏感性系数的日间变化。Rn, 净辐射; Rn,cp, 参考叶片净辐射; Ta, 气温; Tc, 植被表面温度; Tcp, 参考叶片温度。
Fig. 5 Diurnal variation of the sensitivity coefficients of each parameter. Rn, net radiation; Rn,cp, reference leaf net radiation; Ta, air temperature; Tc, vegetation canopy temperature; Tcp, reference leaf temperature.
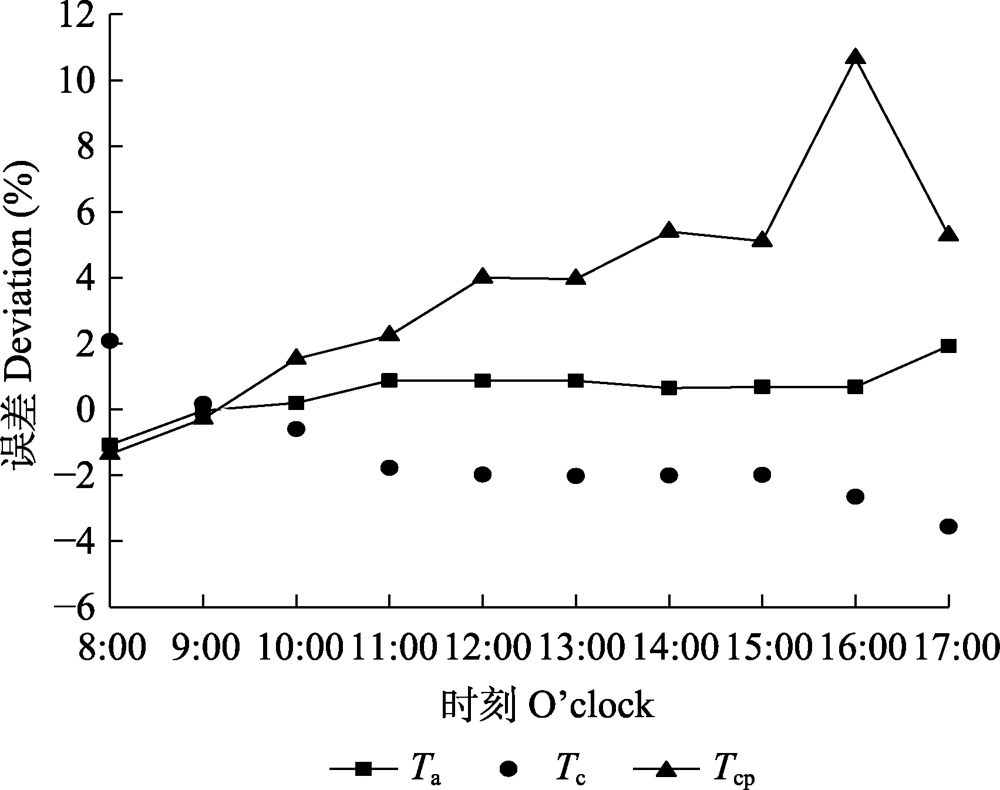
图6 气温(Ta)、植被表面温度(Tc)和参考叶片温度(Tcp)对结果造成误差的日变化。
Fig. 6 Diurnal variation of the deviation caused by air temperature (Ta), vegetation canopy temperature (Tc) and reference leaf temperature (Tcp).
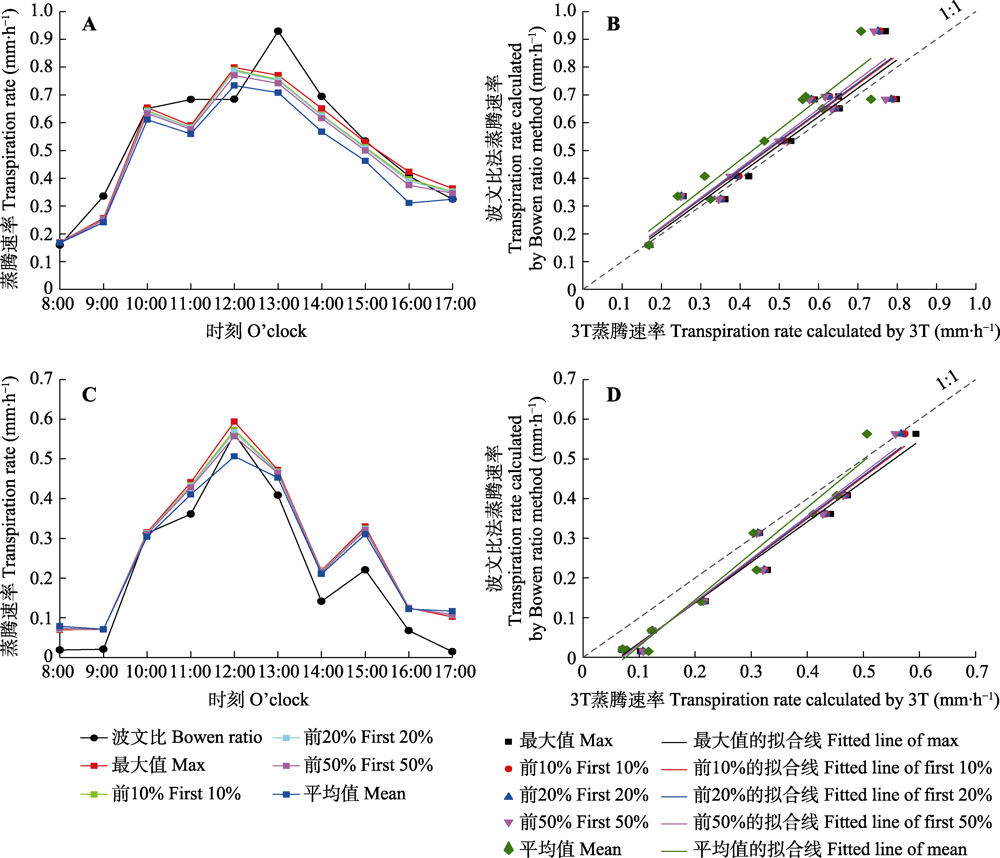
图7 波文比法与三温模型(3T)不同参考叶片温度取值计算草坪蒸腾速率结果对比。A, B, 2018年5月30日。C, D, 2018年11月7日。
Fig. 7 Comparison of lawn transpiration rate calculated by Bowen ratio method and three-temperature model (3T) with different reference leaf temperature value. A, B, May 30, 2018. C, D, November 7, 2018.
| 观测日期 Observation date | 斜率 Slope | 相关系数 Correlation coefficient | 均方根误差 Root mean square error (mm·h-1) | ||||||||||||
|---|---|---|---|---|---|---|---|---|---|---|---|---|---|---|---|
| 最大值 Max | 前10% 平均值 First 10% mean | 前20% 平均值 First 20% mean | 前50% 平均值 First 50% mean | 平均值 Mean | 最大值 Max | 前10% 平均值 First 10% mean | 前20% 平均值 First 20% mean | 前50% 平均值 First 50% mean | 平均值 Mean | 最大值 Max | 前10% 平均值 First 10% mean | 前20% 平均值 First 20% mean | 前50% 平均值 First 50% mean | 平均值 Mean | |
| 05-30 | 1.02 | 1.04 | 1.04 | 1.06 | 1.10 | 0.89 | 0.89 | 0.89 | 0.89 | 0.89 | 0.075 | 0.080 | 0.081 | 0.084 | 0.104 |
| 05-31 | 1.19 | 1.13 | 1.13 | 1.14 | 1.12 | 0.92 | 0.89 | 0.88 | 0.87 | 0.82 | 0.073 | 0.080 | 0.083 | 0.088 | 0.115 |
| 06-01 | 0.95 | 0.92 | 0.93 | 0.94 | 0.96 | 0.93 | 0.92 | 0.92 | 0.92 | 0.91 | 0.082 | 0.082 | 0.081 | 0.080 | 0.080 |
| 06-02 | 0.92 | 0.84 | 0.85 | 0.87 | 0.89 | 0.87 | 0.81 | 0.82 | 0.83 | 0.86 | 0.083 | 0.078 | 0.073 | 0.067 | 0.057 |
| 08-01 | 0.87 | 0.88 | 0.88 | 0.88 | 0.88 | 0.98 | 0.98 | 0.98 | 0.98 | 0.97 | 0.066 | 0.061 | 0.060 | 0.058 | 0.051 |
| 08-05 | 1.27 | 0.83 | 0.83 | 0.83 | 0.82 | 0.99 | 0.96 | 0.96 | 0.96 | 0.96 | 0.039 | 0.090 | 0.089 | 0.087 | 0.082 |
| 08-09 | 0.85 | 0.84 | 0.84 | 0.81 | 0.77 | 0.92 | 0.91 | 0.91 | 0.90 | 0.87 | 0.100 | 0.091 | 0.089 | 0.087 | 0.088 |
| 10-03 | 1.05 | 1.07 | 1.08 | 1.14 | 1.08 | 0.93 | 0.92 | 0.92 | 0.91 | 0.90 | 0.066 | 0.069 | 0.071 | 0.077 | 0.091 |
| 10-19 | 1.06 | 1.08 | 1.08 | 1.15 | 1.10 | 0.97 | 0.97 | 0.97 | 0.96 | 0.97 | 0.066 | 0.065 | 0.065 | 0.064 | 0.065 |
| 11-07 | 1.02 | 1.05 | 1.06 | 1.17 | 1.08 | 0.98 | 0.98 | 0.97 | 0.96 | 0.97 | 0.067 | 0.065 | 0.064 | 0.063 | 0.063 |
表2 不同参考叶片温度取值下的回归方程参数
Table 2 Regression equation parameters under different reference leaf temperature values
| 观测日期 Observation date | 斜率 Slope | 相关系数 Correlation coefficient | 均方根误差 Root mean square error (mm·h-1) | ||||||||||||
|---|---|---|---|---|---|---|---|---|---|---|---|---|---|---|---|
| 最大值 Max | 前10% 平均值 First 10% mean | 前20% 平均值 First 20% mean | 前50% 平均值 First 50% mean | 平均值 Mean | 最大值 Max | 前10% 平均值 First 10% mean | 前20% 平均值 First 20% mean | 前50% 平均值 First 50% mean | 平均值 Mean | 最大值 Max | 前10% 平均值 First 10% mean | 前20% 平均值 First 20% mean | 前50% 平均值 First 50% mean | 平均值 Mean | |
| 05-30 | 1.02 | 1.04 | 1.04 | 1.06 | 1.10 | 0.89 | 0.89 | 0.89 | 0.89 | 0.89 | 0.075 | 0.080 | 0.081 | 0.084 | 0.104 |
| 05-31 | 1.19 | 1.13 | 1.13 | 1.14 | 1.12 | 0.92 | 0.89 | 0.88 | 0.87 | 0.82 | 0.073 | 0.080 | 0.083 | 0.088 | 0.115 |
| 06-01 | 0.95 | 0.92 | 0.93 | 0.94 | 0.96 | 0.93 | 0.92 | 0.92 | 0.92 | 0.91 | 0.082 | 0.082 | 0.081 | 0.080 | 0.080 |
| 06-02 | 0.92 | 0.84 | 0.85 | 0.87 | 0.89 | 0.87 | 0.81 | 0.82 | 0.83 | 0.86 | 0.083 | 0.078 | 0.073 | 0.067 | 0.057 |
| 08-01 | 0.87 | 0.88 | 0.88 | 0.88 | 0.88 | 0.98 | 0.98 | 0.98 | 0.98 | 0.97 | 0.066 | 0.061 | 0.060 | 0.058 | 0.051 |
| 08-05 | 1.27 | 0.83 | 0.83 | 0.83 | 0.82 | 0.99 | 0.96 | 0.96 | 0.96 | 0.96 | 0.039 | 0.090 | 0.089 | 0.087 | 0.082 |
| 08-09 | 0.85 | 0.84 | 0.84 | 0.81 | 0.77 | 0.92 | 0.91 | 0.91 | 0.90 | 0.87 | 0.100 | 0.091 | 0.089 | 0.087 | 0.088 |
| 10-03 | 1.05 | 1.07 | 1.08 | 1.14 | 1.08 | 0.93 | 0.92 | 0.92 | 0.91 | 0.90 | 0.066 | 0.069 | 0.071 | 0.077 | 0.091 |
| 10-19 | 1.06 | 1.08 | 1.08 | 1.15 | 1.10 | 0.97 | 0.97 | 0.97 | 0.96 | 0.97 | 0.066 | 0.065 | 0.065 | 0.064 | 0.065 |
| 11-07 | 1.02 | 1.05 | 1.06 | 1.17 | 1.08 | 0.98 | 0.98 | 0.97 | 0.96 | 0.97 | 0.067 | 0.065 | 0.064 | 0.063 | 0.063 |
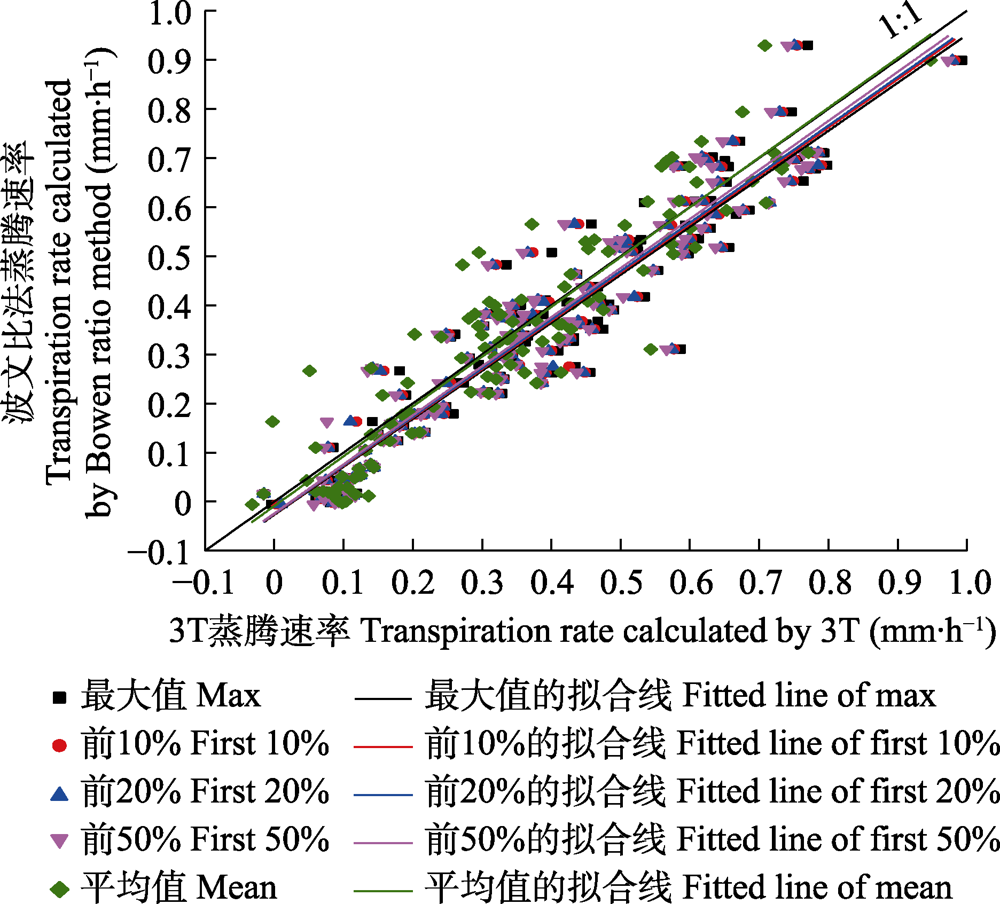
图8 观测期间波文比法与三温模型(3T)不同参考叶片温度取值计算草坪蒸腾速率结果对比。
Fig. 8 Comparison of lawn transpiration rate calculated by Bowen ratio method and three-temperature model (3T) with different reference leaf temperature values during the observation period.
| 不同参考叶片 温度取值 Different reference leaf temperature | 相关系数 Correlation coefficient | 斜率 Slope | 截距 Intercept | 均方根误差 Root mean square error (mm·h-1) |
|---|---|---|---|---|
| 最大值 Max | 0.91 | 0.98 | -0.03 | 0.078 |
| 前10%平均值 First 10% mean | 0.90 | 0.98 | -0.03 | 0.079 |
| 前20%平均值 First 20% mean | 0.90 | 0.99 | -0.02 | 0.078 |
| 前50%平均值 First 50% mean | 0.89 | 1.00 | -0.02 | 0.078 |
| 平均值 Mean | 0.86 | 1.01 | -0.01 | 0.083 |
表3 各取值方法的回归方程参数
Table 3 Regression equation parameters obtained by different reference leaf temperature approach
| 不同参考叶片 温度取值 Different reference leaf temperature | 相关系数 Correlation coefficient | 斜率 Slope | 截距 Intercept | 均方根误差 Root mean square error (mm·h-1) |
|---|---|---|---|---|
| 最大值 Max | 0.91 | 0.98 | -0.03 | 0.078 |
| 前10%平均值 First 10% mean | 0.90 | 0.98 | -0.03 | 0.079 |
| 前20%平均值 First 20% mean | 0.90 | 0.99 | -0.02 | 0.078 |
| 前50%平均值 First 50% mean | 0.89 | 1.00 | -0.02 | 0.078 |
| 平均值 Mean | 0.86 | 1.01 | -0.01 | 0.083 |
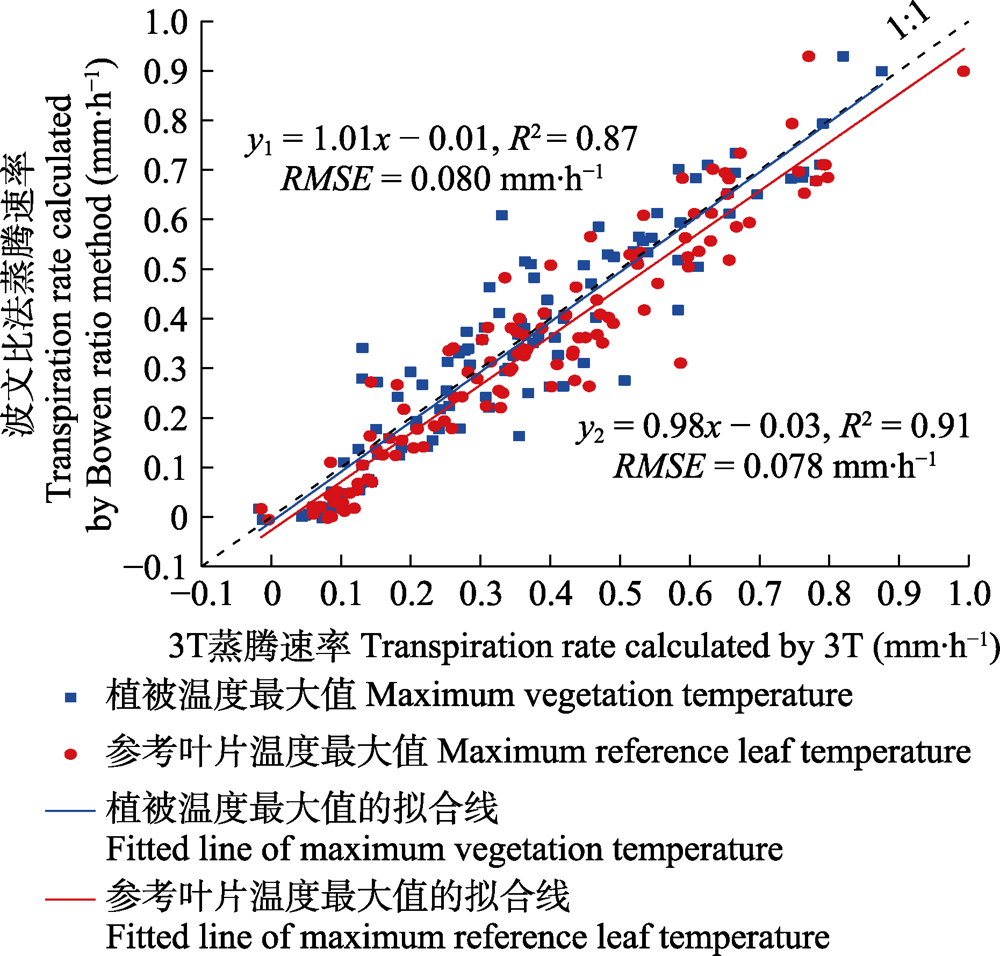
图9 观测期间波文比法与三温模型(3T)观测冠层最高温度为参考温度时计算草坪蒸腾速率结果对比。
Fig. 9 Comparison of lawn transpiration rate calculated by Bowen ratio method and three-temperature model (3T) with the maximum temperature of the observed canopy as reference temperature during the observation period.
| [1] |
Arnfield AJ (2003). Two decades of urban climate research: a review of turbulence, exchanges of energy and water, and the urban heat island. International Journal of Climatology, 23, 1-26.
DOI URL |
| [2] |
Beven K (1979). A sensitivity analysis of the Penman-Monteith actual evapotranspiration estimates. Journal of Hydrology, 44, 169-190.
DOI URL |
| [3] |
Bowen IS (1926). The ratio of heat losses by conduction and by evaporation from any water surface. Physical Review, 27, 779-787.
DOI URL |
| [4] | Brutsaert W (1986). Catchment-scale evaporation and the atmospheric boundary layer. Water Resources Research, 22, 39-45. |
| [5] | Burman RD, Cuenca RH, Weiss A (1983). Techniques for estimating irrigation water requirements. Advances in Irrigation, 2, 335-394. |
| [6] |
Dyer AJ (1974). A review of flux-profile relationships. Boundary- Layer Meteorology, 7, 363-372.
DOI URL |
| [7] |
Hatfield JL, Reginato RJ, Idso SB (1983). Comparison of long-wave radiation calculation methods over the United States. Water Resources Research, 19, 285-288.
DOI URL |
| [8] | Jensen ME, Burman RD, Allen RG (1990). Evapotranspiration and Irrigation Water Requirements. American Society of Civil Engineers, New York. 25-41. |
| [9] |
Lhomme JP, Monteny B, Amadou M (1994). Estimating sensible heat flux from radiometric temperature over sparse millet. Agricultural and Forest Meteorology, 68, 77-91.
DOI URL |
| [10] |
Litvak E, Manago KF, Hogue TS, Pataki DE (2017a). Evapotranspiration of urban landscapes in Los Angeles, California at the municipal scale. Water Resources Research, 53, 4236-4252.
DOI URL |
| [11] |
Litvak E, McCarthy HR, Pataki DE (2017b). A method for estimating transpiration of irrigated urban trees in California. Landscape and Urban Planning, 158, 48-61.
DOI URL |
| [12] |
Liu X, Li XX, Harshan S, Roth M, Velasco E (2017). Evaluation of an urban canopy model in a tropical city: the role of tree evapotranspiration. Environmental Research Letters, 12, 094008. DOI: 10.1088/1748-9326/aa7ee7.
DOI URL |
| [13] |
McCabe MF, Wood EF (2006). Scale influences on the remote estimation of evapotranspiration using multiple satellite sensors. Remote Sensing of Environment, 105, 271-285.
DOI URL |
| [14] | Monteith JL, Unsworth MH (2013). Principles of Environmental Physics: Plants, Animals and the Atmosphere. Academic Press, New York. |
| [15] |
Nouri H, Beecham S, Kazemi F, Hassanli AM (2013). A review of ET measurement techniques for estimating the water requirements of urban landscape vegetation. Urban Water Journal, 10, 247-259.
DOI URL |
| [16] | Qiu GY (1996). A New Method for Estimation of Evapotranspiration. PhD dissertation, United Graduate School of Agriculture Science, Tottori University, Tottori, Japan. |
| [17] |
Qiu GY, Momii K, Yano T, Lascano RJ (1999). Experimental verification of a mechanistic model to partition evapotranspiration into soil water and plant evaporation. Agricultural and Forest Meteorology, 93(2), 79-93.
DOI URL |
| [18] |
Qiu GY, Sase S, Shi P, Ding G (2003). Theoretical analysis and experimental verification of a remotely measurable plant transpiration transfer coefficient. Japan Agricultural Research Quarterly, 37(3), 141-149.
DOI URL |
| [19] |
Qiu GY, Shi PJ, Wang LM (2006). Theoretical analysis of a remotely measurable soil evaporation transfer coefficient. Remote sensing of Environment, 101, 390-398.
DOI URL |
| [20] |
Qiu GY, Tan SL, Wang Y, Yu XH, Yan CH (2017). Characteristics of evapotranspiration of urban lawns in a sub-tropical megacity and its measurement by the “three temperature model + infrared remote sensing” method. Remote Sensing, 9, 502. DOI: 10.3390/rs9050502.
DOI URL |
| [21] |
Qiu GY, Wang B, Li T, Zhang XN, Zou ZD, Yan CH (2021). Estimation of the transpiration of urban shrubs using the modified three-dimensional three-temperature model and infrared remote sensing. Journal of Hydrology, 594, 125940. DOI: 10.1016/j.jhydrol.2020.125940.
DOI URL |
| [22] | Qiu GY, Wu X, Wang S, Song XF (2006). Three temperature (3T) model—A method to estimate evapotranspiration and evaluate environmental quality based on surface temperature. IV. Plant transpiration transfer coefficient. Journal of Plant Ecology (Chinese Version), 30, 852-860. |
|
[ 邱国玉, 吴晓, 王帅, 宋献方 (2006). 三温模型——基于表面温度测算蒸散和评价环境质量的方法IV. 植被蒸腾扩散系数. 植物生态学报, 30, 852-860.]
DOI |
|
| [23] | Qiu GY, Xiong YJ (2014). Water Versus Energy: Evapotranspiration, Thermal Environment and Energy Budget. Science Press, Beijing. |
| [ 邱国玉, 熊育久 (2014). 水与能: 蒸散发, 热环境及其能量收支. 科学出版社, 北京.] | |
| [24] |
Qiu GY, Yano T, Momii K (1998). An improved methodology to measure evaporation from bare soil based on comparison of surface temperature with a dry soil surface. Journal of Hydrology, 210, 93-105.
DOI URL |
| [25] |
Qiu GY, Yu XH, Wen HY, Yan CH (2020). An advanced approach for measuring the transpiration rate of individual urban trees by the 3D three-temperature model and thermal infrared remote sensing. Journal of Hydrology, 587, 125034. DOI: 10.1016/j.jhydrol.2020.125034.
DOI URL |
| [26] |
Weiss A (1982). An experimental study of net radiation, its components and prediction. Agronomy Journal, 74, 871-874.
DOI URL |
| [27] | Xia J, Shi W, Wang Q, Zou L (2017). Discussion of several hydrological issues regarding sponge city construction. Water Resources Protection, 33(1), 1-8. |
| [ 夏军, 石卫, 王强, 邹磊 (2017). 海绵城市建设中若干水文学问题的研讨. 水资源保护, 33(1), 1-8.] | |
| [28] |
Xiong YJ, Qiu GY (2014). Simplifying the revised three- temperature model for remotely estimating regional evapotranspiration and its application to a semi-arid steppe. International Journal of Remote Sensing, 35, 2003-2027.
DOI URL |
| [29] |
Yan C, Qiu GY (2016). The three-temperature model to estimate evapotranspiration and its partitioning at multiple scales: a review. Transactions of the ASABE, 59, 661-670.
DOI URL |
| [30] | Yu XH, Yang YJ, Tan SL, Li RL, Qin HP, Qiu GY (2017). Evapotranspiration and its cooling effect of urban green roof. Chinese Journal of Environmental Engineering, 11, 5333-5340. |
| [ 于小惠, 杨雅君, 谭圣林, 李瑞利, 秦华鹏, 邱国玉 (2017). 绿色屋顶蒸散发及其降温效果. 环境工程学报, 11, 5333-5340.] | |
| [31] |
Zhang YY, Qin HP, Zhang JY, Hu YC (2020). An in situ measurement method of evapotranspiration from typical LID facilities based on the three-temperature model. Journal of Hydrology, 588. DOI: 10.1016/j.jhydrol.2020.125105.
DOI |
| [32] |
Zou ZD, Yang YJ, Qiu GY (2019). Quantifying the evapotranspiration rate and its cooling effects of urban hedges based on three-temperature model and infrared remote sensing. Remote Sensing, 11, 202. DOI: 10.3390/rs11020202.
DOI URL |
| [1] | 邱国玉, 吴晓, 王帅, 宋献方. 三温模型——基于表面温度测算蒸散和评价环境质量的方法Ⅳ. 植被蒸腾扩散系数[J]. 植物生态学报, 2006, 30(5): 852-860. |
| [2] | 邱国玉, 王帅, 吴晓. 三温模型——基于表面温度测算蒸散和评价环境质量的方法Ⅰ.土壤蒸发[J]. 植物生态学报, 2006, 30(2): 231-238. |
| 阅读次数 | ||||||
|
全文 |
|
|||||
|
摘要 |
|
|||||
Copyright © 2026 版权所有 《植物生态学报》编辑部
地址: 北京香山南辛村20号, 邮编: 100093
Tel.: 010-62836134, 62836138; Fax: 010-82599431; E-mail: apes@ibcas.ac.cn, cjpe@ibcas.ac.cn
备案号: 京ICP备16067583号-19
![]()