


植被生产力是人类生活所需食物、原料及燃料的来源。植物通过光合作用将太阳能固定并转化为植物生物量。单位时间和单位面积上,绿色植物通过光合作用所产生的全部有机物同化量,即光合总量,叫总初级生产力(GPP);净初级生产力(NPP)则是从光合作用所产生的有机质总量中扣除自养呼吸后的剩余部分。NPP作为地表碳循环的重要组成部分,不仅直接反映了植被群落在自然环境条件下的生产能力,表征陆地生态系统的质量状况,而且是判定生态系统碳源/汇和调节生态过程的主要因子(Field et al., 1998),在全球变化及碳平衡中扮演着重要的作用。自20世纪60年代以来,各国学者对NPP的研究倍受重视,国际生物学计划(International biological programme, IBP, 1965~1974)期间,曾进行了大量的植物NPP的测定,并以测定资料为基础联系气候环境因子建立模型对植被NPP的区域分布进行评估,如Miami模型、Thornthwaite纪念模型、Chikugo模型等(Lieth, 1975; Uchijima & Seino, 1985)。建立于1987年的国际地圈-生物圈计划(International geo-biosphere programme, IGBP)、全球变化与陆地生态系统(Global change and terristrial ecosystems, GCTE)和最近出台的京都协定(Kyoto protocol)均把植被的NPP研究确定为核心内容之一。
早在20世纪70年代Monteith就发现NPP和植被吸收的光合有效辐射(APAR)之间存在着稳定的关系:当水分和肥料处在最适的条件下,农作物的NPP与APAR具有很强的线性相关(Monteith, 1972)。进一步的研究发现,NPP与APAR的时间序列积分有较好的相关性(Landsberg, 1996),但是不同的植被类型,或者同一植被类型在不同的生长条件下,所获得的经验模型存在着差异,这就意味着植被的NPP受植物本身及其生长环境的影响(Evans, 1989)。
尽管早期的一些科学家利用APAR-NPP这一关系在小范围的实验点上开展植被NPP估算,取得了一定的成功,但在区域及全球尺度上,由于气候类型和植被类型的多样,其应用受到了很大的限制,问题主要存在于一些参数的确定上,具体表现在以下几个方面:1)很多光能利用率模型本身考虑了不同的植被覆盖类型对NPP估算结果的影响,但也仅仅是在光合有效辐射吸收比例(FPAR)的估算过程中,根据不同的植被覆盖类型来确定比值植被指数最大值(Field et al.,1995;朴世龙等,2001;彭少麟等,2000),没有考虑不同的植被覆盖分类精度对NPP估算结果的影响。2)全球植被最大光能利用率的取值对NPP的估算结果影响很大。Monteith最初的“光能利用率”模型包含一个最大光能利用率(εmax),然后再根据不同的环境胁迫因子对其进行调整。早期的研究都是假设εmax为一个不变的常量,如CASA模型就将全球最大光能利用率取值为0.389 g C·MJ-1(Field et al.,1995),后来的研究表明,月最大光能利用率的取值因不同的植被类型而有所不同(彭少麟等,2000;Russell et al., 1989),可能与自养呼吸耗减量的差异有关(Hunt, 1994)。3)光能利用率模型需要估算水分胁迫对植物的影响,在估算水分胁迫因子时,一般是用土壤水分子模型(Field et al.,1995;朴世龙等,2001),其中涉及到大量的土壤参数,如田间持水量、萎蔫含水量、土壤粘粒和砂粒的百分比、土壤深度等,而通常情况下,这些土壤参数都是根据土壤类型来确定,其精度难以保证。
根据光能利用率模型的建模思路,本文所构建的NPP遥感估算模型准备在以下3个方面作进一步的改进与完善:1)将植被覆盖分类引入模型,并考虑植被覆盖分类精度对NPP估算的影响,由它们共同决定不同植被覆盖类型的NDVI最大值,由此获得各植被覆盖类型的比值植被指数最大值,最后实现FPAR的估算;2)根据误差最小的原则,利用中国的NPP实测数据,模拟出各植被类型的最大光能利用率,使之更符合中国的实际情况。3)利用气象数据(温度、降水、太阳净辐射),结合已有的区域蒸散模型来实现水分胁迫因子的估算,这样一方面可以保证数据源的可靠性和可获得性,另一方面则在一定程度上对有关参数实行了简化,使其实际的可操作性得到加强。
1 数据来源与预处理
1.1 遥感数据
本研究所利用的气象卫星NOAA/AVHRR NDVI数据,来源于美国地球资源观测系统(Earth resources observation system, EROS)数据中心的探路者数据集(Pathfinder data set, PDS),图像空间分辨率为8 km×8 km,时间分辨率为月,时间序列为1989年1月~1993年12月。所有数据均进行了几何校正、大气纠正、去云处理以及传感器退化性能的订正(Los, 1993; Tucker et al.,1994;Myneni et al.,1998),使数据具有一致性和可比性。数据最后经投影变换处理,选取的投影方式为波尔伯斯等积圆锥投影(Albers conical equal area projection)。
1.2 气象数据
本研究所利用的气象数据来源于中国气象局,时间为1989年1月~1993年12月,数据内容为月降水量、月平均气温、月总太阳辐射,以及各气象站点的经度、纬度和海拔高度,共涉及全国726个气象站点。模拟最大光利用率时需要栅格化的气象数据,并从空间上与遥感数据相匹配。利用GIS的插值工具,根据各气象站点的经纬度信息,通过对气象数据进行Kriging插值和基于DEM的插值(潘耀忠等,2004),获取像元大小与NDVI数据一致、投影相同的气象要素栅格图。
1.3 土地覆盖分类图
土地覆盖分类图来源于欧盟联合研究中心(The joint research centre, JRC),原始分类图像由中国科学院遥感应用研究所编译,分类用的遥感数据为2000年的SPOT-VGT 1 km数据,共分了22类(表1),检验后的总体分类精度为61.8%。
表1 各植被类型NDVI和SR的最大值与最小值
Table 1
| 代码 Code | 植被类型 Vegetation type | 像元数 Pixels | NDVImax | NDVImin | SRmax | SRmin |
|---|---|---|---|---|---|---|
| 1 | 落叶针叶林Deciduous needle-leaf forest | 4 339 | 0.738 | 0.023 | 6.63 | 1.05 |
| 2 | 常绿针叶林Evergreen needle-leaf forest | 15 104 | 0.647 | 0.023 | 4.67 | 1.05 |
| 3 | 常绿阔叶林Evergreen broad-leaf forest | 6 502 | 0.676 | 0.023 | 5.17 | 1.05 |
| 4 | 落叶阔叶林Deciduous broad-leaf forest | 8 690 | 0.747 | 0.023 | 6.91 | 1.05 |
| 5 | 灌丛Bush | 11 905 | 0.636 | 0.023 | 4.49 | 1.05 |
| 6 | 疏林Sparse woods | 958 | 0.636 | 0.023 | 4.49 | 1.05 |
| 7 | 海边湿地Seaside wetlands | 287 | 0.634 | 0.023 | 4.46 | 1.05 |
| 8 | 高山、亚高山草甸Alpine and sub-alpine meadow | 11 675 | 0.634 | 0.023 | 4.46 | 1.05 |
| 9 | 坡面草地Slope grassland | 4 364 | 0.634 | 0.023 | 4.46 | 1.05 |
| 10 | 平原草地Plain grassland | 7 940 | 0.634 | 0.023 | 4.46 | 1.05 |
| 11 | 荒漠草地Desert grassland | 10 184 | 0.634 | 0.023 | 4.46 | 1.05 |
| 12 | 草甸Meadow | 11 773 | 0.634 | 0.023 | 4.46 | 1.05 |
| 13 | 城市City | 65 | 0.634 | 0.023 | 4.46 | 1.05 |
| 14 | 河流River | 958 | 0.634 | 0.023 | 4.46 | 1.05 |
| 15 | 湖泊Lake | 1 240 | 0.634 | 0.023 | 4.46 | 1.05 |
| 16 | 沼泽Swamp | 1 015 | 0.634 | 0.023 | 4.46 | 1.05 |
| 17 | 冰川Glacier | 1 887 | 0.634 | 0.023 | 4.46 | 1.05 |
| 18 | 裸岩Bare rocks | 4 528 | 0.634 | 0.023 | 4.46 | 1.05 |
| 19 | 砾石Gravels | 13 657 | 0.634 | 0.023 | 4.46 | 1.05 |
| 20 | 荒漠Desert | 12 661 | 0.634 | 0.023 | 4.46 | 1.05 |
| 21 | 耕地Farmland | 30 046 | 0.634 | 0.023 | 4.46 | 1.05 |
| 22 | 高山、亚高山草地Alpine and sub-alpine plain grassland | 10 931 | 0.634 | 0.023 | 4.46 | 1.05 |
NDVI: Normalized difference vegetation index SR: Simple ration
1.4 NPP实测资料
NPP实测数据来源于中国前林业部1989~1993年的林业普查资料(Ni et al. , 2001),共包括中国17种森林类型690个观测站点的植被属性数据,数据内容为立木年龄、叶面积指数、总生物量和净初级生产力,以及各观测点的经度、纬度和海拔高度。净初级生产力的单位是干物质的重量,在转换成以碳为单位(g C·m-2·a-1)时乘了一个0.475的系数(Scurlock et al., 1999)。
2 模型构建
NPP估算模型的总体设计如图1所示。模型中所估算的NPP可以由植物吸收的光合有效辐射(APAR)和实际光能利用率(ε)两个因子来表示,其估算公式如下:
式中,APAR(x, t)表示像元x在t月吸收的光合有效辐射(g C·m-2·month-1), ε(x, t)表示像元x在t月的实际光能利用率(g C·MJ-1)。
图1
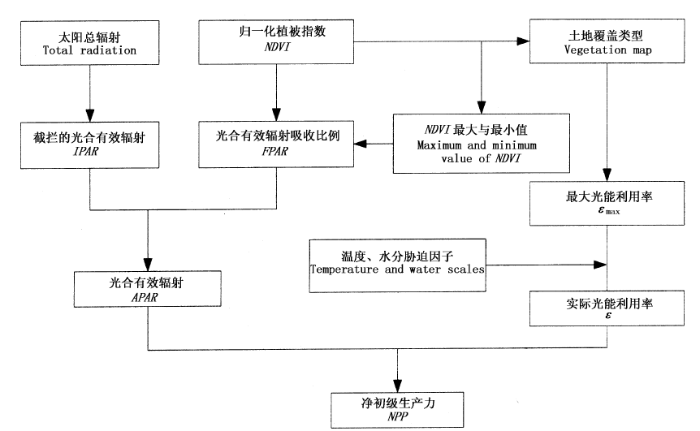
图1
净初级生产力(NPP)估算模型总体框架
Fig.1
Frame of net primary productivity (NPP) Estimation Model
NDVI: Normalized difference vegetation index IPAR: Intercepted photosynthetically active radiation FPAR: Fraction of photosythetically active rediation APAR: Absorbed photosynthetically active radiation εmax: Maximum light use efficiency ε: Actual light use efficiency
2.1 APAR的估算
利用遥感数据估算光合有效辐射(PAR)中被植物叶子吸收的部分(APAR)是根据植被对红外和近红外波段的反射特征实现的。光合有效辐射(PAR,0.4~0.7 μm)是植物光合作用的驱动力,它与生物量有很强的相关性。植被吸收的光合有效辐射取决于太阳总辐射和植物本身的特征,可用公式(2)计算。
式中,SOL(x, t)表示t月在像元x处的太阳总辐射量(MJ·m-2·month-1), FPAR(x, t)为植被层对入射光合有效辐射的吸收比例, 常数0.5表示植被所能利用的太阳有效辐射占太阳总辐射的比例。
2.1.1 FPAR的估算
在一定范围内,FPAR与NDVI之间存在着线性关系(Ruimy & Saugier, 1994),这一关系可以根据某一植被类型NDVI的最大值和最小值以及所对应的FPAR最大值和最小值来确定,即:
式中,NDVIi,max和NDVIi,min分别对应第i种植被类型的NDVI最大值和最小值(表1)。
进一步的研究表明,FPAR与比值植被指数(SR)也存在较好的线性关系(Field et al., 1995;Los et al., 1994),可由公式(4)表示:
式中,FPARmin和FPARmax的取值与植被类型无关,分别为0.001和0.95;SRi,max和SRi,min分别对应第i种植被类型NDVI的95%和5%下侧百分位数(表1),SR(x,t)由公式(5)确定:
通过对FPAR-NDVI和FPAR-SR所估算结果的比较发现,由NDVI所估算的FPAR比实测值高,而由SR所估算的FPAR则低于实测值,但其误差小于直接由NDVI所估算的结果,考虑到这种情况,Los(1998)将这两种方法结合起来,取其平均值作为FPAR的估算值,此时,估算的FPAR与实测值之间的误差达到最小。本研究最终将公式(3)和(4)组合起来,取其平均值作为FPAR的估算值:
式中,FPARNDVI为公式(3)所估算的结果;FPARSR为公式(4)所估算的结果;α为两种方法间的调整系数,在本研究中统一定为0.5(取二者的平均值)。
2.1.2 NDVI最大值与最小值的确定
本研究中,NDVI最大值是指植被刚好达到全覆盖状态下的NDVI值,并不是指某一植被类型NDVI实际能达到的最大值,为了消除植被分类以及NDVI数据本身所固有的误差,本模型将植被分类精度引进来,使NDVI最大值随分类精度的变化而变化。详细的计算过程请参看文献(Zhu et al., 2006),所确定的各植被类型的NDVI最大值与最小值如表1所示。
2.2 光能利用率的估算
光能利用率是在一定时期单位面积上生产的干物质中所包含的化学潜能与同一时间投射到该面积上的光合有效辐射能之比。环境因子如气温、土壤水分状况以及大气水汽压差等会通过影响植物的光合能力而调节植被的NPP。在遥感模型中,这些因子对NPP的调控是通过对最大光能利用率进行调节而实现的。
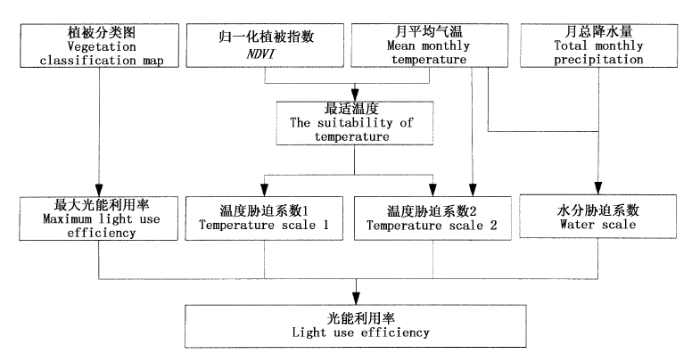
光能利用率的估算流程如图2所示。Potter等(1993)认为在理想条件下植被具有最大光能利用率,而在现实条件下的最大光能利用率主要受温度和水分的影响,其计算如公式(7)所示。
式中,Tε1(x, t)和Tε2(x,t)表示低温和高温对光能利用率的胁迫作用; Wε(x, t)为水分胁迫影响系数,反映水分条件的影响; εmax是理想条件下的最大光能利用率(g C·MJ-1)。
图2
2.2.1 温度胁迫因子的估算
1)Tε1(x,t)的估算: Tε1(x,t)反映在低温和高温时植物内在的生化作用对光合的限制而降低净第一性生产力(Field et al., 1995)。用公式(8)计算:
式中,Topt(x)为植物生长的最适温度,定义为某一区域一年内NDVI值达到最高时的当月平均气温(℃); 当某一月平均温度小于或等于-10℃时,Tε1(x,t)取0。
2)Tε2(x,t)的估算: Tε2(x,t)表示环境温度从最适温度Topt(x)向高温或低温变化时植物光能利用率逐渐变小的趋势(Potter et al., 1993; Field et al., 1995),这是因为低温和高温时高的呼吸消耗必将会降低光能利用率,生长在偏离最适温度的条件下,其光能利用率也一定会降低,用公式(9)计算:
当某一月平均温度T(x, t)比最适温度Topt(x)高10℃或低13℃时,该月的Tε2(x, t)值等于月平均温度T(x, t)为最适温度Topt(x)时Tε2(x, t)值的一半。
2.2.2 水分胁迫因子的估算
地面干湿程度对于植物生长有着十分重要的作用。一般认为,土壤水分超过某一临界值时,蒸发速率不受土壤水分供应的限制,而只与气象条件有关;当土壤水分含量低于这一临界值时,蒸发速率除与气象条件有关外,还随土壤水分的有效性的降低而降低。因此,周广胜和张新时(1996a,1996b)用区域实际蒸散量与区域潜在蒸散量的比值来反映土壤水分干湿程度。
水分胁迫影响系数Wε(x,t)反映了植物所能利用的有效水分条件对光能利用率的影响,随着环境中有效水分的增加,Wε(x,t)逐渐增大,它的取值范围为0.5(在极端干旱条件下)到1(非常湿润条件下)(朴世龙等,2001),由公式(10)计算:
式中,E(x, t)为区域实际蒸散量(mm),可根据周广胜和张新时(1995)建立的区域实际蒸散模型求取;Ep(x, t)为区域潜在蒸散量(mm),可根据Boucher提出的互补关系求取(张志明,1990;周广胜和张新时,1996a, 1996b)。
2.2.3 最大光能利用率的确定
月最大光能利用率εmax的取值因不同的植被类型而有所不同,由于全球最大光能利用率的取值对NPP的估算结果影响很大,人们对它的大小一直存在争议,Potter等(1993)和Field等(1995,1998)认为全球植被的最大光能利用率为0.389 g C·MJ-1;在没有气候和其它因素的限制时,Raymond和Hunt(1994)认为光能利用率的上限为3.5 g C·MJ-1,而另外的研究结果则认为一些草本植物和其它植被的光能利用率在0.09~2.16 g C·MJ-1之间(Ruimy & Saugier, 1994; Paruelo et al., 1997; McCrady & Jokela, 1998);彭少麟等(2000)利用GIS和RS估算了广东植被光能利用率,认为CASA模型中所使用的全球植被月最大光能利用率(0.389 g C·MJ-1)对广东植被来讲偏低。
本文月最大光能利用率分3步来确定:首先计算所有像元的APAR、温度和水分胁迫因子;然后,挑选研究区相同时间段的NPP实测数据;最后,根据误差最小的原则模拟出各植被类型的εmax。有关最大光能利用率的详细模拟过程和误差分析请参看文献(Zhu et al., 2006),模拟结果见表2。
表2 中国典型植被类型的最大光能利用率(εmax)
Table 2
| 代码 Code | 植被类型 Vegetation type | 样本数 Samples | 最小值 Min | 最大值 Max | 模拟值 Simulated value | NPP实测 平均值 Observed NPP (g C·m-2·a-1) | NPP实测值 标准差 SE of observed NPP | NPP实测 值范围 Range of observed NPP (g C·m-2·a-1) |
|---|---|---|---|---|---|---|---|---|
| εmax (g C·MJ-1) | ||||||||
| 1 | 落叶针叶林 Deciduous needle-leaf forest | 39 | 0.159 | 2.453 | 0.485 | 490 | 160.9 | 179~824 |
| 2 | 常绿针叶林 Evergreen needle-leaf forest | 110 | 0.204 | 2.553 | 0.389 | 396 | 121.2 | 179~806 |
| 3 | 落叶阔叶林 Deciduous broad-leaf forest | 356 | 0.256 | 2.521 | 0.692 | 672 | 271.9 | 114~1 669 |
| 4 | 常绿阔叶林 Evergreen broad-leaf forest | 142 | 0.407 | 2.194 | 0.985 | 1 017 | 278.9 | 407~1 913 |
| 5 | 针阔混交林 Needle and broad-leaf mixed forest | 21 | 0.242 | 0.74 | 0.475 | 472 | 128.3 | 257~717 |
| 6 | 常绿、落叶阔叶混交林 Evergreen and deciduous broad-leaf mixed forest | 22 | 0.461 | 1.295 | 0.768 | 723 | 141.4 | 414~1 098 |
| 7 | 灌丛 Bush | 9 | 0.429 | 364 | ||||
| 8 | 草地 Grassland | 0.542 | 231 | 64.9 | ||||
| 9 | 耕地 Farmland | 0.542 | ||||||
| 10 | 其它 Others | 0.542 | ||||||
NPP: 净初级生产力 Net primary productivity
3 NPP模型验证
3.1 与实测数据的比较
1989~1993年中国陆地生态系统平均NPP分布如图3所示,NPP模拟值与实测值的比较见表3和图4。总体来看,NPP的空间分布趋势符合中国的实际情况,690个点的NPP观测值与模拟值也比较接近,平均值都在650 g C·m-2·a-1左右,二者相差43 g C·m-2·a-1,平均相对误差(即模拟值减去观测值,再除以观测值,然后乘以100%)为4.5%。模拟值所得到的总体标准差(259.2)低于观测值的标准差(313.9),说明模拟值的波动范围小于观测值,这主要有两方面的原因,一是因为最大光能利用率是通过模拟得到,最后应用到同一植被类型的所有像元,这在无形中对NPP模拟值作了一次平滑处理;二是因为大尺度的遥感数据本身可以反映植被的渐变过程,而观测点的取样面积一般在数公顷左右,很难代表一个真实像元(8 km×8 km)的植被状况,尤其是在取样不典型的情况下,同一类型的植被,它们本身的实测值也会差异很大。从不同的森林类型来看,NPP的模拟值均落在观测值的范围之内,而且NPP的模拟平均值也基本上接近实测平均值。
图3
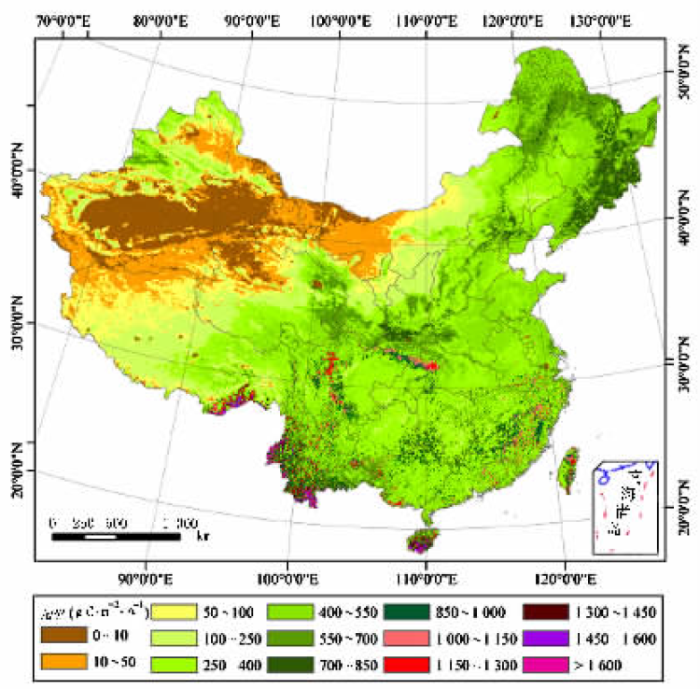
图3
1989~1993年中国陆地生态系统植被净初级生产力(NPP)平均值
Fig.3
Spatial distribution of mean net primary productivity (NPP) in Chinese terrestrial ecosystem between 1989 and 1993
表3 净初级生产力(NPP)模拟值与实测值的比较
Table 3
| 森林类型 Forest type | 样本数 Samples | 实测值(g C·m-2·a-1) Observed NPP | 模拟值(g C·m-2·a-1) Simulated NPP | 平均相对误差(%) Mean relative error | |||||||||
|---|---|---|---|---|---|---|---|---|---|---|---|---|---|
| 最小值 Min | 最大值 Max | 平均值 Mean | 标准差 SE | 最小值 Min | 最大值 Max | 平均值 Mean | 标准差 SE | ||||||
| 1 北方森林 Boreal forest | |||||||||||||
| 落叶松Larix forest | 39 | 179 | 824 | 490 | 160.9 | 152 | 626 | 447 | 115.3 | 4.9 | |||
| 针阔混交林Coniferous broad-leaf mixed forest | 21 | 257 | 717 | 472 | 128.3 | 348 | 559 | 469 | 49.7 | 6.2 | |||
| 冷杉-云杉林Abies-Picea forest | 101 | 179 | 806 | 403 | 123.6 | 111 | 585 | 372 | 103.8 | -0.2 | |||
| 山地杨桦林Montane Populus-Betula forest | 72 | 270 | 1 314 | 681 | 230.1 | 198 | 1 135 | 694 | 139.2 | 12.3 | |||
| 樟子松Pinus sylvestris var. mongolica forest | 9 | 258 | 387 | 317 | 37.1 | 48 | 425 | 354 | 116.9 | 13.1 | |||
| 2 落叶阔叶林Deciduous broad-leaf forest | |||||||||||||
| 典型落叶阔叶林Typical deciduous broad-leaf forest | 41 | 259 | 704 | 518 | 116.5 | 214 | 862 | 663 | 145.9 | 36.1 | |||
| 杜加依林Tugai forest | 8 | 114 | 430 | 259 | 118.3 | 186 | 426 | 270 | 88.9 | 19.6 | |||
| 3 常绿阔叶林Evergreen broad-leaf forest | |||||||||||||
| 典型常绿阔叶林Typical evergreen broad-leaf forest | 129 | 478 | 1 577 | 1 041 | 249.4 | 401 | 1 753 | 927 | 246.3 | -5.0 | |||
| 常绿-落叶阔叶林 Evergreen-deciduous broad-leaf mixed forest | 22 | 414 | 1 098 | 722 | 141.4 | 493 | 1 099 | 688 | 155.4 | -1.2 | |||
| 硬叶常绿阔叶林Sclerophyllous evergreen broad-leaf forest | 9 | 407 | 651 | 542 | 73.3 | 401 | 1 221 | 872 | 297.8 | 59.3 | |||
| 4 热带雨林、季雨林Rain forest and monsoon forest | 4 | 904 | 1 913 | 1 287 | 435.4 | 1 471 | 1 770 | 1 628 | 128.8 | 36.5 | |||
| 5 温带针叶林Temperate coniferous forest | |||||||||||||
| 油松林Pinus tabulaeformis forest | 22 | 269 | 637 | 468 | 112.6 | 356 | 828 | 609 | 132.1 | 35.9 | |||
| 6 亚热带针叶林Subtropical coniferous forest | |||||||||||||
| 华山松与黄山松林Pinus armandi, P.taiwanensis and P. densata forest | 35 | 260 | 845 | 566 | 157 | 198 | 1136 | 649 | 201.2 | 23.7 | |||
| 杉木林Cunninghamia lanceolata forest | 86 | 328 | 1 669 | 791 | 339.9 | 401 | 1 115 | 608 | 136.8 | -10.5 | |||
| 马尾松林Pinus massoniana forest | 59 | 378 | 1 431 | 831 | 249.2 | 364 | 904 | 564 | 115.5 | -27.2 | |||
| 云南松林Pinus yunnanensis and P. khasya forest | 19 | 395 | 773 | 604 | 117.8 | 425 | 1 225 | 836 | 195.4 | 44.8 | |||
| 柏林Cupressus forest | 14 | 342 | 1 023 | 587 | 200.7 | 198 | 1 136 | 611 | 240.6 | 13.4 | |||
| 合计 Total | 690 | 114 | 1 913 | 684 | 313.9 | 48 | 1 770 | 641 | 259.2 | 4.5 | |||
图4
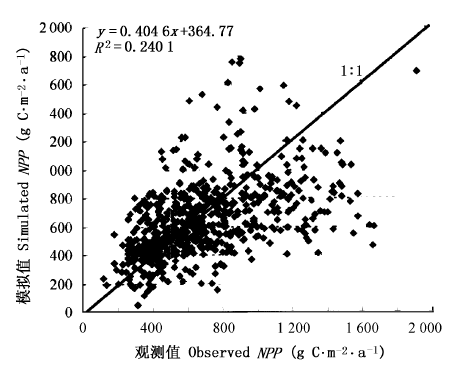
图4
净初级生产力(NPP)模拟值与实测值的比较
Fig.4
Comparison of simulated net primary productivity (NPP) and observed NPP
从图4可以看出,成对的模拟值与实测值之间的相关性是比较低的,R值仅为0.49,考虑到生态环境、数据源及尺度转换上的差异,大尺度的NPP精度验证本身也存在着一定的不可比性,要想获得观测数据与大尺度模拟数据间的典型相关是不可能的,但在实测数据样方比较典型、面积足够大、数量足够多、抽样时间也比较一致的情况下,平均值之间还是存在一定的可比性。表3的数据表明,当样方数量较多时(如冷杉(Abies)-云杉(Picea)林、典型常绿阔叶林),它们的相对误差较小,这在一定程度上说明了模拟结果的可靠性。Ni(2003)利用平均值法对中国森林清查的点数据进行尺度扩张,得到0.5°×0.5°的栅格数据,并与机理模型LPJ-DGVM (The lund-potsdam-jena dynamic global vegetation model)的估算结果进行了比较,结果表明,尽管两套数据的NPP平均值和取值范围比较接近(实测数据的平均值为567 g C·m-2·a-1,范围在103.5~1 813.5 g C·m-2·a-1之间;模拟数据的平均值为606.3 g C·m-2·a-1,范围在108.5~1 404.5 g C·m-2·a-1之间),但二者之间无明显相关性(R2=0.104),这可能与4个方面的原因有关:NPP数据质量、模型本身的缺点、不同的空间尺度以及人类干扰(Ni, 2003)。
3.2 与其它模型和研究结果的比较
自国际生物学计划(IBP)以来,许多学者结合NPP观测数据,建立了一系列的NPP估算模型。Ruimy和Saugier (1994)把这些模型概括为3类,即统计模型、参数模型和过程模型。统计模型也称为气候相关模型,以Miami模型(Lieth, 1972)、Thornthwaite Memorial模型(Lieth & Box, 1972)、Chickugo模型(Uchijima & Seino, 1985)为代表,它们是利用气候因子(温度、降水等)来估算NPP,因此大部分统计模型估算的结果是潜在的植被生产力。参数模型结合植被吸收的光合有效辐射和光能利用率两个因子来估算NPP,其中把光能利用率看成是只取决于植被类型的变量。过程模型是在参数模型上的引申,其中最为普遍的处理方式是在参数模型基础上加上温度、水分及养分等参数,代表性的模型有TEM(Terrestrial ecosystem model)模型(McGuire et al., 1995)、BIOME-BGC (Biome bio-geochemical cycles model)模型(Running & Hunt, 1993)、CEVSA(Carbon exchange between vegetation, soil and atmosphere)模型(Woodward et al., 1995; Cao & Woodward, 1998)等。中国的一些学者利用上述模型对中国陆地生态系统NPP作了估算(朴世龙等,2001;孙睿和朱启疆,2000; 陈利军等,2001),平均值在1.95~6.13 Pg C之间。
通过采用全国726个气象站点的气象数据,利用Miami和Thornthwaite模型对中国陆地植被NPP进行了计算。从各植被类型的统计数据来看(表4),Miami模型仅仅考虑了温度和降水对NPP的影响,估算结果与实测值偏差较大,估算的1989~1993年中国陆地生态系统NPP平均值为3.91 Pg C;Thornthwaite模型因采用了实际蒸散量,而实际蒸散量取决于太阳辐射、温度、降水、气压和风速等多因子的影响,故估算的结果与实测值偏差较小,所估算的全国NPP为3.71 Pg C;本文模型所估算的全国NPP为3.12 Pg C,明显低于Miami模型和Thornthwaite模型的估算结果。由于这两个气候相关模型在计算时未考虑地表植被覆盖状况,所估计的是潜在的NPP;而本文则是在利用遥感数据提取地表植被覆盖信息的基础上计算的现实NPP,故比它们的计算值偏小应属正常。
表4 本文NPP模型模拟值同其它模型及研究结果的比较,NPP平均值单位为g C·m-2·a-1,NPP总量单位为1012 g C·a-1
Table 4
| 代码 Code | 植被覆盖类型 Vegetation type | 像元数 Pixels | 模拟值 Simulated NPP | 实测值1)2) Observed NPP | Miami模型 Miami model | Thornthwaite 模型 Thornthwaite model | CASA 模型3) CASA model | CEVSA 模型4) CEVSA model | 罗天祥1) | 刘明亮 (2001) | 孙睿和 朱启疆 (2000) | |||||||||||||
|---|---|---|---|---|---|---|---|---|---|---|---|---|---|---|---|---|---|---|---|---|---|---|---|---|
| 平均值 Mean | 总和 Total | 范围 Range | 平均值 Mean | 平均值 Mean | 总和 Total | 平均值 Mean | 总和 Total | 平均值 Mean | 平均值 Mean | 平均值 Mean | 平均值 Mean | 平均值 Mean | ||||||||||||
| 1 | 落叶针叶林 Deciduous needle-leaf forest | 3 086 | 438.8 | 86.6 | 179~824 | 490.0 | 270.7 | 53.5 | 350.2 | 69.2 | 432 | 379.1 | 460 | 585 | 281.7 | |||||||||
| 2 | 常绿针叶林 Evergreen needle-leaf forest | 14 579 | 367.1 | 342.5 | 179~806 | 395.5 | 740.9 | 691.3 | 691.6 | 645.3 | 354 | 515.0 | 439 | 587 | 540.9 | |||||||||
| 3 | 常绿阔叶林 Evergreen broad-leaf forest | 6 375 | 985.8 | 402.2 | 407~1 913 | 1 016.5 | 809.5 | 330.3 | 749.6 | 305.8 | 525 | 721.0 | 945 | 945 | 987.4 | |||||||||
| 4 | 落叶阔叶林 Deciduous broad-leaf forest | 7 083 | 642.9 | 291.4 | 114~1 669 | 671.8 | 449.1 | 203.6 | 453.4 | 205.5 | 304 | 517.6 | 548 | 928 | 443.5 | |||||||||
| 5 | 灌木 Bush | 11 287 | 367.7 | 265.6 | 364.0 | 627.5 | 453.3 | 590.7 | 426.7 | 283 | 272.0 | 348.7 | ||||||||||||
| 6 | 疏林地 Sparse woods | 959 | 465.0 | 28.5 | 839.8 | 51.6 | 776.7 | 47.7 | 532.0 | |||||||||||||||
| 7 | 海边湿地 Seaside wet lands | 271 | 375.4 | 6.5 | 831.5 | 14.4 | 767.7 | 13.3 | ||||||||||||||||
| 8 | 高山亚高山草甸 Alpine and sub-alpine meadow | 10 582 | 349.8 | 236.9 | 323.4 | 219.0 | 335.8 | 227.4 | ||||||||||||||||
| 9 | 坡面草地 Slope grassland | 4 095 | 507.4 | 133.0 | 625.5 | 163.9 | 583.7 | 153.0 | ||||||||||||||||
| 10 | 平原草地 Plain grassland | 6 595 | 226.2 | 95.5 | 230.6 | 232.8 | 98.2 | 220.5 | 93.1 | 414.6 | 271 | 221.1 | ||||||||||||
| 11 | 荒漠草地 Desert grassland | 8 744 | 103.4 | 57.9 | 168.8 | 94.5 | 150.7 | 84.3 | ||||||||||||||||
| 12 | 草甸 Meadow | 9 363 | 382.8 | 229.4 | 282.2 | 169.1 | 284.7 | 170.6 | ||||||||||||||||
| 13 | 城市 City | 63 | 347.1 | 1.4 | 628.5 | 2.5 | 585.8 | 2.4 | ||||||||||||||||
| 14 | 河流 River | 869 | 371.4 | 20.7 | 603.1 | 33.5 | 564.7 | 31.4 | ||||||||||||||||
| 15 | 湖泊 Lake | 1 140 | 236.8 | 17.3 | 568.5 | 41.5 | 526.7 | 38.4 | ||||||||||||||||
| 16 | 沼泽 Swamp | 767 | 556.1 | 27.3 | 419.2 | 20.6 | 451.9 | 22.2 | ||||||||||||||||
| 17 | 冰川 Glacier | 1 659 | 89.4 | 9.5 | 213.6 | 22.7 | 199.7 | 21.2 | ||||||||||||||||
| 18 | 裸岩 Bare rocks | 3 908 | 80.9 | 20.2 | 150.4 | 37.6 | 135.2 | 33.8 | ||||||||||||||||
| 19 | 砾石 Gravels | 11 301 | 36.5 | 26.4 | 94.6 | 68.4 | 74.1 | 53.6 | ||||||||||||||||
| 20 | 荒漠 Desert | 10 767 | 21.8 | 15.0 | 73.8 | 50.9 | 51.9 | 35.8 | 14 | 20.8 | ||||||||||||||
| 21 | 耕地 Farmland | 26 406 | 426.5 | 720.8 | 239~760 | 532.9 | 558.7 | 944.2 | 524.8 | 886.9 | 216 | 648.8 | 752 | 405.2 | ||||||||||
| 22 | 高山亚高山草地 Alpine and sub-alpine plain Grassland | 10 103 | 131.7 | 85.2 | 220.1 | 142.3 | 209.7 | 135.6 | ||||||||||||||||
| 总计 Total | 150 000 | 3 119.8 | 3 906.8 | 3 703.0 | ||||||||||||||||||||
NPP: 净初级生产力 Net primary productivity 1)引自
就全国尺度的NPP模拟结果与其它研究结果的比较来看,各植被类型间均存在一定的差异(表4)。从全国NPP的总量来看,差别也比较大:朴世龙等(2001)利用CASA模型对中国1997年的NPP进行了估算,总量为1.95 Pg C,由于所取的最大光能利用率(0.389 g C·MJ-1)对中国某些植被来说有些偏低(彭少麟等,2000),其估算结果明显偏小;陶波(2003)利用CEVSA模型估算的1982~2000年中国NPP总量在3.06~3.61 Pg C之间,平均为3.27 Pg C,而1989~1993年的平均值为3.29 Pg C;GLO-PEM估算的结果为2.76~3.31 Pg C,平均为3.00 Pg C;孙睿和朱启疆(2000)利用光能利用率模型估算1993~1994年中国的NPP为2.645 Pg C;陈利军等(2001)运用遥感手段估算了1990年中国陆地植被NPP,总量为6.13 Pg C,结果明显偏高,可能与用于计算的数据精度较粗有关。
4 讨论
值得注意的是,本文所估算的水体(湖泊和河流)、冰川、裸岩等无植被地带,其NPP值也比较高(表4),尤其是水体,而实际情况下,这些无植被地带的NPP应该为0。这主要是由遥感数据本身的空间分辨率决定的,对于像元为8 km×8 km的NDVI数据和植被分类数据,一般的河流、湖泊以及小面积分布的冰川、裸岩等均因面积过小而无法反映出来,更何况还存在混合像元的问题,如果某个像元刚好跨在水域和植被上,当水域占的比例比较大时,在分类上有可能被分为水体,而实际上里面还包含有植被的成分,在遥感数据上则可能表现为一定的NDVI值。实际情况也是如此,在8 km的NDVI数据上,我们基本上分不出长江和黄河,即使在洞庭湖和鄱阳湖的中心地带,也只有少数几个像元的NDVI值较低(略高于0);但青海湖和塔克拉玛干沙漠就不一样,中心的NDVI值基本为0,所估算的NPP也为0。
比较而言,遥感模型利用了全覆盖的NDVI数据,能比较真实地反映陆地NPP分布的实际情况,这是气候模型所无法比拟的;同时,NPP遥感模型在解决问题中也具有很大的潜力,它不仅能实现植被NPP的大范围快速监测,而且有助于将环境变量和植被联系起来,并利用NPP定量描述环境与植被间的相互作用。鉴于计算NPP需要时间系列的数据,高频采样的卫星数据是很理想的数据源。虽然多光谱辐射仪AVHRR系列从1981年7月起开始持续接受遥感数据,但替代AVHRR的NOAA VIS、法国的VEGETATION,特别是拥有36个波段的EOS MODIS将会为未来提供持续的、增强的遥感动态监测能力。在全球尺度上,利用地理信息系统技术将遥感数据和各种观测数据集成在一起,并对NPP模型进行参数校正,基本上可以实现全球范围不同生态系统NPP的动态监测(陈利军等,2001)。
参考文献
Dynamic responses of terrestrial ecosystem carbon cycling to global climate change
Estimation of net primary productivity of terrestrial vegetation in China by remote sensing
Photosynthesis and nitrogen relationships in leaves of C3 plants
DOI:10.1007/BF00377192
URL
PMID:28311896
[本文引用: 1]

The photosynthetic capacity of leaves is related to the nitrogen content primarily bacause the proteins of the Calvin cycle and thylakoids represent the majority of leaf nitrogen. To a first approximation, thylakoid nitrogen is proportional to the chlorophyll content (50 mol thylakoid N mol(-1) Chl). Within species there are strong linear relationships between nitrogen and both RuBP carboxylase and chlorophyll. With increasing nitrogen per unit leaf area, the proportion of total leaf nitrogen in the thylakoids remains the same while the proportion in soluble protein increases. In many species, growth under lower irradiance greatly increases the partitioning of nitrogen into chlorophyll and the thylakoids, while the electron transport capacity per unit of chlorophyll declines. If growth irradiance influences the relationship between photosynthetic capacity and nitrogen content, predicting nitrogen distribution between leaves in a canopy becomes more complicated. When both photosynthetic capacity and leaf nitrogen content are expressed on the basis of leaf area, considerable variation in the photosynthetic capacity for a given leaf nitrogen content is found between species. The variation reflects different strategies of nitrogen partitioning, the electron transport capacity per unit of chlorophyll and the specific activity of RuBP carboxylase. Survival in certain environments clearly does not require maximising photosynthetic capacity for a given leaf nitrogen content. Species that flourish in the shade partition relatively more nitrogen into the thylakoids, although this is associated with lower photosynthetic capacity per unit of nitrogen.
Carbon stock in grassland ecosystem and its affecting factors
Primary production of the biosphere: integrating terrestrial and oceanic components
DOI:10.1126/science.281.5374.237
URL
PMID:9657713
[本文引用: 2]
Integrating conceptually similar models of the growth of marine and terrestrial primary producers yielded an estimated global net primary production (NPP) of 104.9 petagrams of carbon per year, with roughly equal contributions from land and oceans. Approaches based on satellite indices of absorbed solar radiation indicate marked heterogeneity in NPP for both land and oceans, reflecting the influence of physical and ecological processes. The spatial and temporal distributions of ocean NPP are consistent with primary limitation by light, nutrients, and temperature. On land, water limitation imposes additional constraints. On land and ocean, progressive changes in NPP can result in altered carbon storage, although contrasts in mechanisms of carbon storage and rates of organic matter turnover result in a range of relations between carbon storage and changes in NPP.
Global net primary production: combining ecology and remote sensing
Relationship between woody biomass and PAR conversion efficiency for estimating net primary production from NDVI
DOI:10.1080/01431169408954203 URL [本文引用: 1]
Study on Carbon Storage and Vegetation Producticity in Chinese Terrestrial Ecosystem
(中国土地利用/土地覆被变化与陆地生态系统植被碳库和生产力研究)
Calibration adjustment of the NOAA-AVHRR normalized difference vegetation index without resource to component channels 1 and 2 data
DOI:10.1080/01431169308954011 URL [本文引用: 1]
Linkages Between Global Vegetation and Climate: an Analysis Based on NOAA Advanced Very High Resolution Radiometer Data. PhD dissertation
A global 1° by 1° NDVI dataset for climate studies derived from the GIMMS continental NDVI data
DOI:10.1080/01431169408954342 URL [本文引用: 1]
Canopy dynamics, light interception, and radiation use efficiency of selected loblolly pine families
Equilibrium responses of soil carbon to climate change—empirical and process-based estimates
DOI:10.2307/2845980 URL [本文引用: 1]
Solar radiation and productivity in tropical ecosystems
DOI:10.2307/2401901 URL [本文引用: 1]
Interannual variations in satellite-sensed vegetation index data from 1981 to 1991
DOI:10.1029/97JD03603 URL [本文引用: 1]
Net primary productivity in forests of China: scaling-up of national inventory data and comparison with model predictions
DOI:10.1016/S0378-1127(02)00312-2 URL [本文引用: 2]
NPP Multi-Biome: Chinese Forests Data, 1989-1994
Smart distance dearching-based and DEM-informed interpolation of surface air temperature of climatology in China
DOI:10.11821/xb200403006
URL
[本文引用: 1]
oC, on average 1.51oC. The smart distance searching technique yield a MAE of 0.53-0.92oC, on average 0.69oC. Errors have been reduced as much as 50%.]]>
ANPP estimates from NDVI for the central grassland region of the United States
DOI:10.1890/0012-9658(1997)078[0953:AEFNFT]2.0.CO;2 URL [本文引用: 1]
Use of GIS and RS to estimate the light utilization efficiency of the vegetation in Guangdong, China
Application of CASA Model to the estimation of Chinese terrestrial net primary productivity
Terrestrial ecosystem production—a process model based on global satellite and surface data
DOI:10.1029/93GB02725 URL [本文引用: 3]
Relationship between woody biomass and PAR conversion efficiency for estimating net primary production from NDVI
DOI:10.1080/01431169408954203 URL [本文引用: 1]
Methodology for the estimation of terrestrial net primary production from remotely sensed data
Terrestrial NPP: towards a consistent data set for global model evaluation
Distributional and seasonal change of net primary productivity in China from April, 1992 to March, 1993
Study on the Simulation of Net Primary Productivity and Net Ecosystem Productivity in Chinese Terrestrial Ecosystem
(中国陆地生态系统净初级生产力与净生态系统生产力模拟研究)
AVHRR datasets for determination of desert spatial extent
Agroclimatic evaluation of net primary productivity of natural vegetation. (1) Chikugo model for evaluating productivity
A global land primary productivity and phytogeography model
Simulation of maximum light use efficiency for some typical vegetation types in China
DOI:10.1007/s11434-006-0457-1 URL [本文引用: 2]
A natural vegetation NPP model
Study on climate vegetation classification for global change in China
The Study on the Chinese natural vegetation net primary productivity in the global change
