
植物生态学报 ›› 2007, Vol. 31 ›› Issue (3): 413-424.DOI: 10.17521/cjpe.2007.0050
朱文泉( ), 潘耀忠, 张锦水*()
收稿日期:2006-02-15
接受日期:2006-06-24
出版日期:2007-02-15
发布日期:2007-05-30
通讯作者:
张锦水
作者简介:* E-mail: zhangjsh@ires.cn基金资助:
ZHU Wen-Quan(), PAN Yao-Zhong, ZHANG Jin-Shui*()
Received:2006-02-15
Accepted:2006-06-24
Online:2007-02-15
Published:2007-05-30
Contact:
ZHANG Jin-Shui
摘要:
该文在综合分析已有光能利用率模型的基础上,构建了一个净初级生产力(NPP)遥感估算模型,该模型体现了3方面的特色:1)将植被覆盖分类引入模型,并考虑植被覆盖分类精度对NPP估算的影响,由它们共同决定不同植被覆盖类型的归一化植被指数(NDVI)最大值;2)根据误差最小的原则,利用中国的NPP实测数据,模拟出各植被类型的最大光能利用率,使之更符合中国的实际情况;3)根据区域蒸散模型来模拟水分胁迫因子,与土壤水分子模型相比,这在一定程度上对有关参数实行了简化,使其实际的可操作性得到加强。模拟结果表明,1989~1993年中国陆地植被NPP平均值为3.12 Pg C (1 Pg=1015 g),NPP模拟值与观测值比较接近,690个实测点的平均相对误差为4.5%;进一步与其它模型模拟结果以及前人研究结果的比较表明,该文所构建的NPP遥感估算模型具有一定的可靠性,说明在区域及全球尺度上,利用地理信息系统技术将遥感数据和各种观测数据集成在一起,并对NPP模型进行参数校正,基本上可以实现全球范围不同生态系统NPP的动态监测。
朱文泉, 潘耀忠, 张锦水. 中国陆地植被净初级生产力遥感估算. 植物生态学报, 2007, 31(3): 413-424. DOI: 10.17521/cjpe.2007.0050
ZHU Wen-Quan, PAN Yao-Zhong, ZHANG Jin-Shui. ESTIMATION OF NET PRIMARY PRODUCTIVITY OF CHINESE TERRESTRIAL VEGETATION BASED ON REMOTE SENSING. Chinese Journal of Plant Ecology, 2007, 31(3): 413-424. DOI: 10.17521/cjpe.2007.0050
| 代码 Code | 植被类型 Vegetation type | 像元数 Pixels | NDVImax | NDVImin | SRmax | SRmin |
|---|---|---|---|---|---|---|
| 1 | 落叶针叶林Deciduous needle-leaf forest | 4 339 | 0.738 | 0.023 | 6.63 | 1.05 |
| 2 | 常绿针叶林Evergreen needle-leaf forest | 15 104 | 0.647 | 0.023 | 4.67 | 1.05 |
| 3 | 常绿阔叶林Evergreen broad-leaf forest | 6 502 | 0.676 | 0.023 | 5.17 | 1.05 |
| 4 | 落叶阔叶林Deciduous broad-leaf forest | 8 690 | 0.747 | 0.023 | 6.91 | 1.05 |
| 5 | 灌丛Bush | 11 905 | 0.636 | 0.023 | 4.49 | 1.05 |
| 6 | 疏林Sparse woods | 958 | 0.636 | 0.023 | 4.49 | 1.05 |
| 7 | 海边湿地Seaside wetlands | 287 | 0.634 | 0.023 | 4.46 | 1.05 |
| 8 | 高山、亚高山草甸Alpine and sub-alpine meadow | 11 675 | 0.634 | 0.023 | 4.46 | 1.05 |
| 9 | 坡面草地Slope grassland | 4 364 | 0.634 | 0.023 | 4.46 | 1.05 |
| 10 | 平原草地Plain grassland | 7 940 | 0.634 | 0.023 | 4.46 | 1.05 |
| 11 | 荒漠草地Desert grassland | 10 184 | 0.634 | 0.023 | 4.46 | 1.05 |
| 12 | 草甸Meadow | 11 773 | 0.634 | 0.023 | 4.46 | 1.05 |
| 13 | 城市City | 65 | 0.634 | 0.023 | 4.46 | 1.05 |
| 14 | 河流River | 958 | 0.634 | 0.023 | 4.46 | 1.05 |
| 15 | 湖泊Lake | 1 240 | 0.634 | 0.023 | 4.46 | 1.05 |
| 16 | 沼泽Swamp | 1 015 | 0.634 | 0.023 | 4.46 | 1.05 |
| 17 | 冰川Glacier | 1 887 | 0.634 | 0.023 | 4.46 | 1.05 |
| 18 | 裸岩Bare rocks | 4 528 | 0.634 | 0.023 | 4.46 | 1.05 |
| 19 | 砾石Gravels | 13 657 | 0.634 | 0.023 | 4.46 | 1.05 |
| 20 | 荒漠Desert | 12 661 | 0.634 | 0.023 | 4.46 | 1.05 |
| 21 | 耕地Farmland | 30 046 | 0.634 | 0.023 | 4.46 | 1.05 |
| 22 | 高山、亚高山草地Alpine and sub-alpine plain grassland | 10 931 | 0.634 | 0.023 | 4.46 | 1.05 |
表1 各植被类型NDVI和SR的最大值与最小值
Table 1 NDVImax, NDVImin, SRmax and SRmin of typical vegetation types in China
| 代码 Code | 植被类型 Vegetation type | 像元数 Pixels | NDVImax | NDVImin | SRmax | SRmin |
|---|---|---|---|---|---|---|
| 1 | 落叶针叶林Deciduous needle-leaf forest | 4 339 | 0.738 | 0.023 | 6.63 | 1.05 |
| 2 | 常绿针叶林Evergreen needle-leaf forest | 15 104 | 0.647 | 0.023 | 4.67 | 1.05 |
| 3 | 常绿阔叶林Evergreen broad-leaf forest | 6 502 | 0.676 | 0.023 | 5.17 | 1.05 |
| 4 | 落叶阔叶林Deciduous broad-leaf forest | 8 690 | 0.747 | 0.023 | 6.91 | 1.05 |
| 5 | 灌丛Bush | 11 905 | 0.636 | 0.023 | 4.49 | 1.05 |
| 6 | 疏林Sparse woods | 958 | 0.636 | 0.023 | 4.49 | 1.05 |
| 7 | 海边湿地Seaside wetlands | 287 | 0.634 | 0.023 | 4.46 | 1.05 |
| 8 | 高山、亚高山草甸Alpine and sub-alpine meadow | 11 675 | 0.634 | 0.023 | 4.46 | 1.05 |
| 9 | 坡面草地Slope grassland | 4 364 | 0.634 | 0.023 | 4.46 | 1.05 |
| 10 | 平原草地Plain grassland | 7 940 | 0.634 | 0.023 | 4.46 | 1.05 |
| 11 | 荒漠草地Desert grassland | 10 184 | 0.634 | 0.023 | 4.46 | 1.05 |
| 12 | 草甸Meadow | 11 773 | 0.634 | 0.023 | 4.46 | 1.05 |
| 13 | 城市City | 65 | 0.634 | 0.023 | 4.46 | 1.05 |
| 14 | 河流River | 958 | 0.634 | 0.023 | 4.46 | 1.05 |
| 15 | 湖泊Lake | 1 240 | 0.634 | 0.023 | 4.46 | 1.05 |
| 16 | 沼泽Swamp | 1 015 | 0.634 | 0.023 | 4.46 | 1.05 |
| 17 | 冰川Glacier | 1 887 | 0.634 | 0.023 | 4.46 | 1.05 |
| 18 | 裸岩Bare rocks | 4 528 | 0.634 | 0.023 | 4.46 | 1.05 |
| 19 | 砾石Gravels | 13 657 | 0.634 | 0.023 | 4.46 | 1.05 |
| 20 | 荒漠Desert | 12 661 | 0.634 | 0.023 | 4.46 | 1.05 |
| 21 | 耕地Farmland | 30 046 | 0.634 | 0.023 | 4.46 | 1.05 |
| 22 | 高山、亚高山草地Alpine and sub-alpine plain grassland | 10 931 | 0.634 | 0.023 | 4.46 | 1.05 |
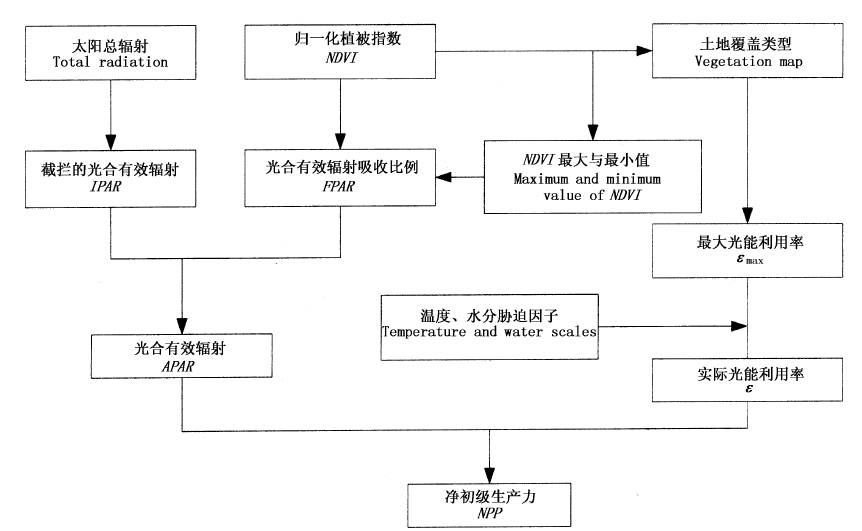
图1 净初级生产力(NPP)估算模型总体框架
Fig.1 Frame of net primary productivity (NPP) Estimation Model NDVI: Normalized difference vegetation index IPAR: Intercepted photosynthetically active radiation FPAR: Fraction of photosythetically active rediation APAR: Absorbed photosynthetically active radiation εmax: Maximum light use efficiency ε: Actual light use efficiency
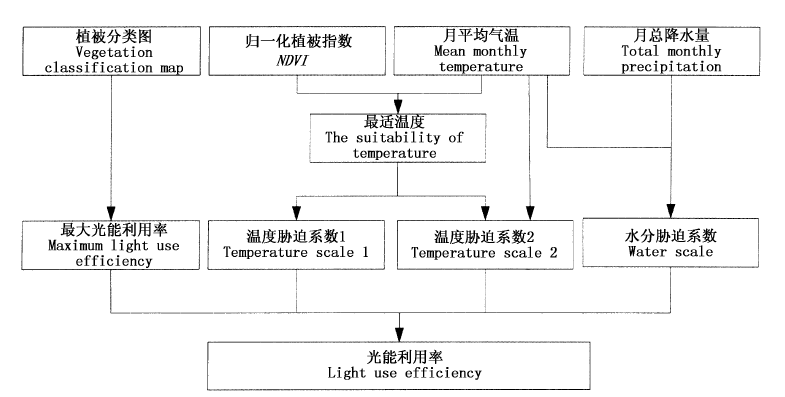
图2 光能利用率估算流程图
Fig.2 Flow chart of light use efficiency estimation
| 代码 Code | 植被类型 Vegetation type | 样本数 Samples | 最小值 Min | 最大值 Max | 模拟值 Simulated value | NPP实测 平均值 Observed NPP (g C·m-2·a-1) | NPP实测值 标准差 SE of observed NPP | NPP实测 值范围 Range of observed NPP (g C·m-2·a-1) |
|---|---|---|---|---|---|---|---|---|
| εmax (g C·MJ-1) | ||||||||
| 1 | 落叶针叶林 Deciduous needle-leaf forest | 39 | 0.159 | 2.453 | 0.485 | 490 | 160.9 | 179~824 |
| 2 | 常绿针叶林 Evergreen needle-leaf forest | 110 | 0.204 | 2.553 | 0.389 | 396 | 121.2 | 179~806 |
| 3 | 落叶阔叶林 Deciduous broad-leaf forest | 356 | 0.256 | 2.521 | 0.692 | 672 | 271.9 | 114~1 669 |
| 4 | 常绿阔叶林 Evergreen broad-leaf forest | 142 | 0.407 | 2.194 | 0.985 | 1 017 | 278.9 | 407~1 913 |
| 5 | 针阔混交林 Needle and broad-leaf mixed forest | 21 | 0.242 | 0.74 | 0.475 | 472 | 128.3 | 257~717 |
| 6 | 常绿、落叶阔叶混交林 Evergreen and deciduous broad-leaf mixed forest | 22 | 0.461 | 1.295 | 0.768 | 723 | 141.4 | 414~1 098 |
| 7 | 灌丛 Bush | 9 | 0.429 | 364 | ||||
| 8 | 草地 Grassland | 0.542 | 231 | 64.9 | ||||
| 9 | 耕地 Farmland | 0.542 | ||||||
| 10 | 其它 Others | 0.542 | ||||||
表2 中国典型植被类型的最大光能利用率(εmax)
Table 2 Maximum light use efficiency (εmax) of typical vegetation types in China
| 代码 Code | 植被类型 Vegetation type | 样本数 Samples | 最小值 Min | 最大值 Max | 模拟值 Simulated value | NPP实测 平均值 Observed NPP (g C·m-2·a-1) | NPP实测值 标准差 SE of observed NPP | NPP实测 值范围 Range of observed NPP (g C·m-2·a-1) |
|---|---|---|---|---|---|---|---|---|
| εmax (g C·MJ-1) | ||||||||
| 1 | 落叶针叶林 Deciduous needle-leaf forest | 39 | 0.159 | 2.453 | 0.485 | 490 | 160.9 | 179~824 |
| 2 | 常绿针叶林 Evergreen needle-leaf forest | 110 | 0.204 | 2.553 | 0.389 | 396 | 121.2 | 179~806 |
| 3 | 落叶阔叶林 Deciduous broad-leaf forest | 356 | 0.256 | 2.521 | 0.692 | 672 | 271.9 | 114~1 669 |
| 4 | 常绿阔叶林 Evergreen broad-leaf forest | 142 | 0.407 | 2.194 | 0.985 | 1 017 | 278.9 | 407~1 913 |
| 5 | 针阔混交林 Needle and broad-leaf mixed forest | 21 | 0.242 | 0.74 | 0.475 | 472 | 128.3 | 257~717 |
| 6 | 常绿、落叶阔叶混交林 Evergreen and deciduous broad-leaf mixed forest | 22 | 0.461 | 1.295 | 0.768 | 723 | 141.4 | 414~1 098 |
| 7 | 灌丛 Bush | 9 | 0.429 | 364 | ||||
| 8 | 草地 Grassland | 0.542 | 231 | 64.9 | ||||
| 9 | 耕地 Farmland | 0.542 | ||||||
| 10 | 其它 Others | 0.542 | ||||||
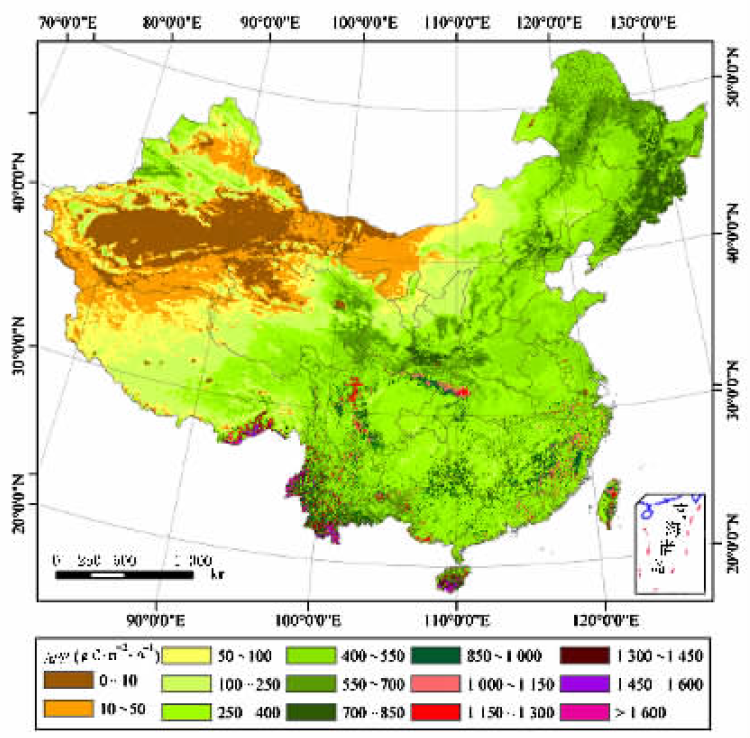
图3 1989~1993年中国陆地生态系统植被净初级生产力(NPP)平均值
Fig.3 Spatial distribution of mean net primary productivity (NPP) in Chinese terrestrial ecosystem between 1989 and 1993
| 森林类型 Forest type | 样本数 Samples | 实测值(g C·m-2·a-1) Observed NPP | 模拟值(g C·m-2·a-1) Simulated NPP | 平均相对误差(%) Mean relative error | |||||||||
|---|---|---|---|---|---|---|---|---|---|---|---|---|---|
| 最小值 Min | 最大值 Max | 平均值 Mean | 标准差 SE | 最小值 Min | 最大值 Max | 平均值 Mean | 标准差 SE | ||||||
| 1 北方森林 Boreal forest | |||||||||||||
| 落叶松Larix forest | 39 | 179 | 824 | 490 | 160.9 | 152 | 626 | 447 | 115.3 | 4.9 | |||
| 针阔混交林Coniferous broad-leaf mixed forest | 21 | 257 | 717 | 472 | 128.3 | 348 | 559 | 469 | 49.7 | 6.2 | |||
| 冷杉-云杉林Abies-Picea forest | 101 | 179 | 806 | 403 | 123.6 | 111 | 585 | 372 | 103.8 | -0.2 | |||
| 山地杨桦林Montane Populus-Betula forest | 72 | 270 | 1 314 | 681 | 230.1 | 198 | 1 135 | 694 | 139.2 | 12.3 | |||
| 樟子松Pinus sylvestris var. mongolica forest | 9 | 258 | 387 | 317 | 37.1 | 48 | 425 | 354 | 116.9 | 13.1 | |||
| 2 落叶阔叶林Deciduous broad-leaf forest | |||||||||||||
| 典型落叶阔叶林Typical deciduous broad-leaf forest | 41 | 259 | 704 | 518 | 116.5 | 214 | 862 | 663 | 145.9 | 36.1 | |||
| 杜加依林Tugai forest | 8 | 114 | 430 | 259 | 118.3 | 186 | 426 | 270 | 88.9 | 19.6 | |||
| 3 常绿阔叶林Evergreen broad-leaf forest | |||||||||||||
| 典型常绿阔叶林Typical evergreen broad-leaf forest | 129 | 478 | 1 577 | 1 041 | 249.4 | 401 | 1 753 | 927 | 246.3 | -5.0 | |||
| 常绿-落叶阔叶林 Evergreen-deciduous broad-leaf mixed forest | 22 | 414 | 1 098 | 722 | 141.4 | 493 | 1 099 | 688 | 155.4 | -1.2 | |||
| 硬叶常绿阔叶林Sclerophyllous evergreen broad-leaf forest | 9 | 407 | 651 | 542 | 73.3 | 401 | 1 221 | 872 | 297.8 | 59.3 | |||
| 4 热带雨林、季雨林Rain forest and monsoon forest | 4 | 904 | 1 913 | 1 287 | 435.4 | 1 471 | 1 770 | 1 628 | 128.8 | 36.5 | |||
| 5 温带针叶林Temperate coniferous forest | |||||||||||||
| 油松林Pinus tabulaeformis forest | 22 | 269 | 637 | 468 | 112.6 | 356 | 828 | 609 | 132.1 | 35.9 | |||
| 6 亚热带针叶林Subtropical coniferous forest | |||||||||||||
| 华山松与黄山松林Pinus armandi, P.taiwanensis and P. densata forest | 35 | 260 | 845 | 566 | 157 | 198 | 1136 | 649 | 201.2 | 23.7 | |||
| 杉木林Cunninghamia lanceolata forest | 86 | 328 | 1 669 | 791 | 339.9 | 401 | 1 115 | 608 | 136.8 | -10.5 | |||
| 马尾松林Pinus massoniana forest | 59 | 378 | 1 431 | 831 | 249.2 | 364 | 904 | 564 | 115.5 | -27.2 | |||
| 云南松林Pinus yunnanensis and P. khasya forest | 19 | 395 | 773 | 604 | 117.8 | 425 | 1 225 | 836 | 195.4 | 44.8 | |||
| 柏林Cupressus forest | 14 | 342 | 1 023 | 587 | 200.7 | 198 | 1 136 | 611 | 240.6 | 13.4 | |||
| 合计 Total | 690 | 114 | 1 913 | 684 | 313.9 | 48 | 1 770 | 641 | 259.2 | 4.5 | |||
表3 净初级生产力(NPP)模拟值与实测值的比较
Table 3 Comparison of simulated net primary productivity (NPP) and observed NPP
| 森林类型 Forest type | 样本数 Samples | 实测值(g C·m-2·a-1) Observed NPP | 模拟值(g C·m-2·a-1) Simulated NPP | 平均相对误差(%) Mean relative error | |||||||||
|---|---|---|---|---|---|---|---|---|---|---|---|---|---|
| 最小值 Min | 最大值 Max | 平均值 Mean | 标准差 SE | 最小值 Min | 最大值 Max | 平均值 Mean | 标准差 SE | ||||||
| 1 北方森林 Boreal forest | |||||||||||||
| 落叶松Larix forest | 39 | 179 | 824 | 490 | 160.9 | 152 | 626 | 447 | 115.3 | 4.9 | |||
| 针阔混交林Coniferous broad-leaf mixed forest | 21 | 257 | 717 | 472 | 128.3 | 348 | 559 | 469 | 49.7 | 6.2 | |||
| 冷杉-云杉林Abies-Picea forest | 101 | 179 | 806 | 403 | 123.6 | 111 | 585 | 372 | 103.8 | -0.2 | |||
| 山地杨桦林Montane Populus-Betula forest | 72 | 270 | 1 314 | 681 | 230.1 | 198 | 1 135 | 694 | 139.2 | 12.3 | |||
| 樟子松Pinus sylvestris var. mongolica forest | 9 | 258 | 387 | 317 | 37.1 | 48 | 425 | 354 | 116.9 | 13.1 | |||
| 2 落叶阔叶林Deciduous broad-leaf forest | |||||||||||||
| 典型落叶阔叶林Typical deciduous broad-leaf forest | 41 | 259 | 704 | 518 | 116.5 | 214 | 862 | 663 | 145.9 | 36.1 | |||
| 杜加依林Tugai forest | 8 | 114 | 430 | 259 | 118.3 | 186 | 426 | 270 | 88.9 | 19.6 | |||
| 3 常绿阔叶林Evergreen broad-leaf forest | |||||||||||||
| 典型常绿阔叶林Typical evergreen broad-leaf forest | 129 | 478 | 1 577 | 1 041 | 249.4 | 401 | 1 753 | 927 | 246.3 | -5.0 | |||
| 常绿-落叶阔叶林 Evergreen-deciduous broad-leaf mixed forest | 22 | 414 | 1 098 | 722 | 141.4 | 493 | 1 099 | 688 | 155.4 | -1.2 | |||
| 硬叶常绿阔叶林Sclerophyllous evergreen broad-leaf forest | 9 | 407 | 651 | 542 | 73.3 | 401 | 1 221 | 872 | 297.8 | 59.3 | |||
| 4 热带雨林、季雨林Rain forest and monsoon forest | 4 | 904 | 1 913 | 1 287 | 435.4 | 1 471 | 1 770 | 1 628 | 128.8 | 36.5 | |||
| 5 温带针叶林Temperate coniferous forest | |||||||||||||
| 油松林Pinus tabulaeformis forest | 22 | 269 | 637 | 468 | 112.6 | 356 | 828 | 609 | 132.1 | 35.9 | |||
| 6 亚热带针叶林Subtropical coniferous forest | |||||||||||||
| 华山松与黄山松林Pinus armandi, P.taiwanensis and P. densata forest | 35 | 260 | 845 | 566 | 157 | 198 | 1136 | 649 | 201.2 | 23.7 | |||
| 杉木林Cunninghamia lanceolata forest | 86 | 328 | 1 669 | 791 | 339.9 | 401 | 1 115 | 608 | 136.8 | -10.5 | |||
| 马尾松林Pinus massoniana forest | 59 | 378 | 1 431 | 831 | 249.2 | 364 | 904 | 564 | 115.5 | -27.2 | |||
| 云南松林Pinus yunnanensis and P. khasya forest | 19 | 395 | 773 | 604 | 117.8 | 425 | 1 225 | 836 | 195.4 | 44.8 | |||
| 柏林Cupressus forest | 14 | 342 | 1 023 | 587 | 200.7 | 198 | 1 136 | 611 | 240.6 | 13.4 | |||
| 合计 Total | 690 | 114 | 1 913 | 684 | 313.9 | 48 | 1 770 | 641 | 259.2 | 4.5 | |||
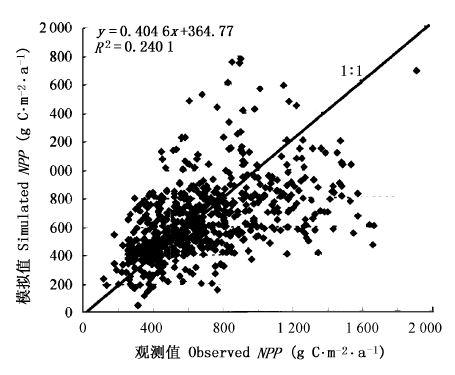
图4 净初级生产力(NPP)模拟值与实测值的比较
Fig.4 Comparison of simulated net primary productivity (NPP) and observed NPP
| 代码 Code | 植被覆盖类型 Vegetation type | 像元数 Pixels | 模拟值 Simulated NPP | 实测值1)2) Observed NPP | Miami模型 Miami model | Thornthwaite 模型 Thornthwaite model | CASA 模型3) CASA model | CEVSA 模型4) CEVSA model | 罗天祥1) | (2001) | 朱启疆 (2000) | |||||||||||||
|---|---|---|---|---|---|---|---|---|---|---|---|---|---|---|---|---|---|---|---|---|---|---|---|---|
| 平均值 Mean | 总和 Total | 范围 Range | 平均值 Mean | 平均值 Mean | 总和 Total | 平均值 Mean | 总和 Total | 平均值 Mean | 平均值 Mean | 平均值 Mean | 平均值 Mean | 平均值 Mean | ||||||||||||
| 1 | 落叶针叶林 Deciduous needle-leaf forest | 3 086 | 438.8 | 86.6 | 179~824 | 490.0 | 270.7 | 53.5 | 350.2 | 69.2 | 432 | 379.1 | 460 | 585 | 281.7 | |||||||||
| 2 | 常绿针叶林 Evergreen needle-leaf forest | 14 579 | 367.1 | 342.5 | 179~806 | 395.5 | 740.9 | 691.3 | 691.6 | 645.3 | 354 | 515.0 | 439 | 587 | 540.9 | |||||||||
| 3 | 常绿阔叶林 Evergreen broad-leaf forest | 6 375 | 985.8 | 402.2 | 407~1 913 | 1 016.5 | 809.5 | 330.3 | 749.6 | 305.8 | 525 | 721.0 | 945 | 945 | 987.4 | |||||||||
| 4 | 落叶阔叶林 Deciduous broad-leaf forest | 7 083 | 642.9 | 291.4 | 114~1 669 | 671.8 | 449.1 | 203.6 | 453.4 | 205.5 | 304 | 517.6 | 548 | 928 | 443.5 | |||||||||
| 5 | 灌木 Bush | 11 287 | 367.7 | 265.6 | 364.0 | 627.5 | 453.3 | 590.7 | 426.7 | 283 | 272.0 | 348.7 | ||||||||||||
| 6 | 疏林地 Sparse woods | 959 | 465.0 | 28.5 | 839.8 | 51.6 | 776.7 | 47.7 | 532.0 | |||||||||||||||
| 7 | 海边湿地 Seaside wet lands | 271 | 375.4 | 6.5 | 831.5 | 14.4 | 767.7 | 13.3 | ||||||||||||||||
| 8 | 高山亚高山草甸 Alpine and sub-alpine meadow | 10 582 | 349.8 | 236.9 | 323.4 | 219.0 | 335.8 | 227.4 | ||||||||||||||||
| 9 | 坡面草地 Slope grassland | 4 095 | 507.4 | 133.0 | 625.5 | 163.9 | 583.7 | 153.0 | ||||||||||||||||
| 10 | 平原草地 Plain grassland | 6 595 | 226.2 | 95.5 | 230.6 | 232.8 | 98.2 | 220.5 | 93.1 | 414.6 | 271 | 221.1 | ||||||||||||
| 11 | 荒漠草地 Desert grassland | 8 744 | 103.4 | 57.9 | 168.8 | 94.5 | 150.7 | 84.3 | ||||||||||||||||
| 12 | 草甸 Meadow | 9 363 | 382.8 | 229.4 | 282.2 | 169.1 | 284.7 | 170.6 | ||||||||||||||||
| 13 | 城市 City | 63 | 347.1 | 1.4 | 628.5 | 2.5 | 585.8 | 2.4 | ||||||||||||||||
| 14 | 河流 River | 869 | 371.4 | 20.7 | 603.1 | 33.5 | 564.7 | 31.4 | ||||||||||||||||
| 15 | 湖泊 Lake | 1 140 | 236.8 | 17.3 | 568.5 | 41.5 | 526.7 | 38.4 | ||||||||||||||||
| 16 | 沼泽 Swamp | 767 | 556.1 | 27.3 | 419.2 | 20.6 | 451.9 | 22.2 | ||||||||||||||||
| 17 | 冰川 Glacier | 1 659 | 89.4 | 9.5 | 213.6 | 22.7 | 199.7 | 21.2 | ||||||||||||||||
| 18 | 裸岩 Bare rocks | 3 908 | 80.9 | 20.2 | 150.4 | 37.6 | 135.2 | 33.8 | ||||||||||||||||
| 19 | 砾石 Gravels | 11 301 | 36.5 | 26.4 | 94.6 | 68.4 | 74.1 | 53.6 | ||||||||||||||||
| 20 | 荒漠 Desert | 10 767 | 21.8 | 15.0 | 73.8 | 50.9 | 51.9 | 35.8 | 14 | 20.8 | ||||||||||||||
| 21 | 耕地 Farmland | 26 406 | 426.5 | 720.8 | 239~760 | 532.9 | 558.7 | 944.2 | 524.8 | 886.9 | 216 | 648.8 | 752 | 405.2 | ||||||||||
| 22 | 高山亚高山草地 Alpine and sub-alpine plain Grassland | 10 103 | 131.7 | 85.2 | 220.1 | 142.3 | 209.7 | 135.6 | ||||||||||||||||
| 总计 Total | 150 000 | 3 119.8 | 3 906.8 | 3 703.0 | ||||||||||||||||||||
表4 本文NPP模型模拟值同其它模型及研究结果的比较,NPP平均值单位为g C·m-2·a-1,NPP总量单位为1012 g C·a-1
Table 4 Comparison of simulated NPP in this paper with that of other models,NPP mean unit:g C·m-2·a-1, NPP total unit: 1012g C·a-1
| 代码 Code | 植被覆盖类型 Vegetation type | 像元数 Pixels | 模拟值 Simulated NPP | 实测值1)2) Observed NPP | Miami模型 Miami model | Thornthwaite 模型 Thornthwaite model | CASA 模型3) CASA model | CEVSA 模型4) CEVSA model | 罗天祥1) | (2001) | 朱启疆 (2000) | |||||||||||||
|---|---|---|---|---|---|---|---|---|---|---|---|---|---|---|---|---|---|---|---|---|---|---|---|---|
| 平均值 Mean | 总和 Total | 范围 Range | 平均值 Mean | 平均值 Mean | 总和 Total | 平均值 Mean | 总和 Total | 平均值 Mean | 平均值 Mean | 平均值 Mean | 平均值 Mean | 平均值 Mean | ||||||||||||
| 1 | 落叶针叶林 Deciduous needle-leaf forest | 3 086 | 438.8 | 86.6 | 179~824 | 490.0 | 270.7 | 53.5 | 350.2 | 69.2 | 432 | 379.1 | 460 | 585 | 281.7 | |||||||||
| 2 | 常绿针叶林 Evergreen needle-leaf forest | 14 579 | 367.1 | 342.5 | 179~806 | 395.5 | 740.9 | 691.3 | 691.6 | 645.3 | 354 | 515.0 | 439 | 587 | 540.9 | |||||||||
| 3 | 常绿阔叶林 Evergreen broad-leaf forest | 6 375 | 985.8 | 402.2 | 407~1 913 | 1 016.5 | 809.5 | 330.3 | 749.6 | 305.8 | 525 | 721.0 | 945 | 945 | 987.4 | |||||||||
| 4 | 落叶阔叶林 Deciduous broad-leaf forest | 7 083 | 642.9 | 291.4 | 114~1 669 | 671.8 | 449.1 | 203.6 | 453.4 | 205.5 | 304 | 517.6 | 548 | 928 | 443.5 | |||||||||
| 5 | 灌木 Bush | 11 287 | 367.7 | 265.6 | 364.0 | 627.5 | 453.3 | 590.7 | 426.7 | 283 | 272.0 | 348.7 | ||||||||||||
| 6 | 疏林地 Sparse woods | 959 | 465.0 | 28.5 | 839.8 | 51.6 | 776.7 | 47.7 | 532.0 | |||||||||||||||
| 7 | 海边湿地 Seaside wet lands | 271 | 375.4 | 6.5 | 831.5 | 14.4 | 767.7 | 13.3 | ||||||||||||||||
| 8 | 高山亚高山草甸 Alpine and sub-alpine meadow | 10 582 | 349.8 | 236.9 | 323.4 | 219.0 | 335.8 | 227.4 | ||||||||||||||||
| 9 | 坡面草地 Slope grassland | 4 095 | 507.4 | 133.0 | 625.5 | 163.9 | 583.7 | 153.0 | ||||||||||||||||
| 10 | 平原草地 Plain grassland | 6 595 | 226.2 | 95.5 | 230.6 | 232.8 | 98.2 | 220.5 | 93.1 | 414.6 | 271 | 221.1 | ||||||||||||
| 11 | 荒漠草地 Desert grassland | 8 744 | 103.4 | 57.9 | 168.8 | 94.5 | 150.7 | 84.3 | ||||||||||||||||
| 12 | 草甸 Meadow | 9 363 | 382.8 | 229.4 | 282.2 | 169.1 | 284.7 | 170.6 | ||||||||||||||||
| 13 | 城市 City | 63 | 347.1 | 1.4 | 628.5 | 2.5 | 585.8 | 2.4 | ||||||||||||||||
| 14 | 河流 River | 869 | 371.4 | 20.7 | 603.1 | 33.5 | 564.7 | 31.4 | ||||||||||||||||
| 15 | 湖泊 Lake | 1 140 | 236.8 | 17.3 | 568.5 | 41.5 | 526.7 | 38.4 | ||||||||||||||||
| 16 | 沼泽 Swamp | 767 | 556.1 | 27.3 | 419.2 | 20.6 | 451.9 | 22.2 | ||||||||||||||||
| 17 | 冰川 Glacier | 1 659 | 89.4 | 9.5 | 213.6 | 22.7 | 199.7 | 21.2 | ||||||||||||||||
| 18 | 裸岩 Bare rocks | 3 908 | 80.9 | 20.2 | 150.4 | 37.6 | 135.2 | 33.8 | ||||||||||||||||
| 19 | 砾石 Gravels | 11 301 | 36.5 | 26.4 | 94.6 | 68.4 | 74.1 | 53.6 | ||||||||||||||||
| 20 | 荒漠 Desert | 10 767 | 21.8 | 15.0 | 73.8 | 50.9 | 51.9 | 35.8 | 14 | 20.8 | ||||||||||||||
| 21 | 耕地 Farmland | 26 406 | 426.5 | 720.8 | 239~760 | 532.9 | 558.7 | 944.2 | 524.8 | 886.9 | 216 | 648.8 | 752 | 405.2 | ||||||||||
| 22 | 高山亚高山草地 Alpine and sub-alpine plain Grassland | 10 103 | 131.7 | 85.2 | 220.1 | 142.3 | 209.7 | 135.6 | ||||||||||||||||
| 总计 Total | 150 000 | 3 119.8 | 3 906.8 | 3 703.0 | ||||||||||||||||||||
| [1] | Cao MK, Woodward FI (1998). Dynamic responses of terrestrial ecosystem carbon cycling to global climate change. Nature, 393, 249-252. |
| [2] | Chen LJ (陈利军), Liu GH (刘高焕), Feng XF(冯险峰) (2001). Estimation of net primary productivity of terrestrial vegetation in China by remote sensing. Acta Botanica Sinica (植物学报), 43, 1191-1198. (in Chinese with English abstract) |
| [3] |
Evans J (1989). Photosynthesis and nitrogen relationships in leaves of C3 plants. Oecologia, 78, 9-19.
DOI URL PMID |
| [4] | Fan JW (樊江文), Zhong HP (钟华平), Liang B (梁飚), Shi PL(石培礼), Yu GR(于贵瑞) (2003). Carbon stock in grassland ecosystem and its affecting factors. Grassland of China (中国草地), 25(6), 51-58. (in Chinese with English abstract) |
| [5] |
Field CB, Behrenfeld MJ, Randerson JT, Falkowski P (1998). Primary production of the biosphere: integrating terrestrial and oceanic components. Science, 281, 237-240.
DOI URL PMID |
| [6] | Field CB, Randerson JT, Malmstrøm CM (1995). Global net primary production: combining ecology and remote sensing. Remote Sensing of Environment, 51, 74-88. |
| [7] |
Hunt EJ (1994). Relationship between woody biomass and PAR conversion efficiency for estimating net primary production from NDVI. International Journal of Remote Sensing, 15, 1725-1730.
DOI URL |
| [8] | Landsberg JJ, Prince SD, Jarvis PG, McMurtrie RE, Luxmore R, Medlyn BE (1996). Energy conversion and use in forests: an analysis of forest production in terms of radiation utilization efficiency. In: Gholz HL, Nakane K, Shimoda H eds. The Use of Remote Sensing in the Modeling of Forest Productivity. Kluwer Academic Press, London, 273-298. |
| [9] | Lieth H 1972. Computer mapping of forest data. In: Lieth H ed. Proceedings of 51 Annual Meeting of the Society of American Foresters. Society of American Section, Washington DC, 53-79. |
| [10] | Lieth H 1975. Historical survey of primary productivity research. In: Lieth H, Whittaker RH ed. Primary Productivity of the Biosphere. Springer-Verlag, New York, 7-16. |
| [11] | Lieth H, Box E 1972. Evapotranspiration and primary productivity. In: Thornthwaite W ed. Memorial Model. Publications in Climatology, New Jersey, 37-46. |
| [12] | Liu ML (刘明亮) (2001). Study on Carbon Storage and Vegetation Producticity in Chinese Terrestrial Ecosystem (中国土地利用/土地覆被变化与陆地生态系统植被碳库和生产力研究). PhD Disertation, Institute of Remote Sensing Applications, Chinese Academy of Sciences. (in Chinese with English abstract) |
| [13] |
Los SO (1993). Calibration adjustment of the NOAA-AVHRR normalized difference vegetation index without resource to component channels 1 and 2 data. International Journal of Remote Sensing, 14, 1907-1917.
DOI URL |
| [14] | Los SO (1998). Linkages Between Global Vegetation and Climate: an Analysis Based on NOAA Advanced Very High Resolution Radiometer Data. PhD dissertation. National Aeronautics and Space Administration (NASA). |
| [15] |
Los SO, Justice CO, Tucker CJ (1994). A global 1° by 1° NDVI dataset for climate studies derived from the GIMMS continental NDVI data. International Journal of Remote Sensing, 15, 3493-3518.
DOI URL |
| [16] | McCrady RL, Jokela EJ (1998). Canopy dynamics, light interception, and radiation use efficiency of selected loblolly pine families. Forest Science, 44, 64-72. |
| [17] |
McGuire AD, Melillo JM, Kicklighter DW, Joyce LA (1995). Equilibrium responses of soil carbon to climate change—empirical and process-based estimates. Journal of Biogeography, 22, 785-796.
DOI URL |
| [18] |
Monteith JL (1972). Solar radiation and productivity in tropical ecosystems. Journal of Applied Ecology, 9, 747-766.
DOI URL |
| [19] |
Myneni RB, Tucker CJ, Asrar G, Keeling CD (1998). Interannual variations in satellite-sensed vegetation index data from 1981 to 1991. Journal of Geophysical Research, 103, 6145-6160.
DOI URL |
| [20] |
Ni J (2003). Net primary productivity in forests of China: scaling-up of national inventory data and comparison with model predictions. Forest Ecology and Management, 176, 485-495.
DOI URL |
| [21] | Ni J, Zhang XS, Scurlock JMO (2001). NPP Multi-Biome: Chinese Forests Data, 1989-1994. Available on-line from Oak Ridge National Laboratory Distributed Active Archive Center, Oak Ridge, Tennessee, USA. http://www.daac.ornl.gov. |
| [22] |
Pan YZ (潘耀忠), Gong DY (龚道溢), Deng L (邓磊), Li J(李京), Gao J (高静) (2004). Smart distance dearching-based and DEM-informed interpolation of surface air temperature of climatology in China. Acta Geographica Sinica, 59, 366-374. (in Chinese with English abstract)
DOI URL |
| [23] |
Paruelo JM, Epstei HE, Lauenroth WK, Burke IC(1997). ANPP estimates from NDVI for the central grassland region of the United States. Ecology, 78, 953-958.
DOI URL |
| [24] | Peng SL (彭少麟), Guo ZH (郭志华), Wang BS (王伯荪) (2000). Use of GIS and RS to estimate the light utilization efficiency of the vegetation in Guangdong, China. Acta Ecologica Sinica (生态学报), 20, 903-909. (in Chinese with English abstract) |
| [25] | Piao SL (朴世龙), Fang JY (方精云), Guo QH (郭庆华) (2001). Application of CASA Model to the estimation of Chinese terrestrial net primary productivity. Acta Phytoecologica Sinica (植物生态学报), 25, 603-608. (in Chinese with English abstract) |
| [26] |
Potter CS, Randerson JT, Field CB, Matson PA, Vitousek PM, Mooney HA, Klooster SA(1993). Terrestrial ecosystem production—a process model based on global satellite and surface data. Global Biogeochemical Cycles, 7, 811-841.
DOI URL |
| [27] |
Raymond E, Hunt JR (1994). Relationship between woody biomass and PAR conversion efficiency for estimating net primary production from NDVI. International Journal of Remote Sensing, 15, 1725-1730.
DOI URL |
| [28] | Ruimy A, Saugier B (1994). Methodology for the estimation of terrestrial net primary production from remotely sensed data. Journal of Geophysical Research, 97, 18515-18521. |
| [29] | Running SW, Hunt ER Jr 1993. Generalization of a forest ecosystem process model for other biomes, BIOME-BGC, and an application for global-scale models. In: Ehleringer JR, Field CB eds. Scaling Physiological Processes: Leaf to Globe. Academic Press, San Diego, 141-158. |
| [30] | Russell GJ, Arvis P, Monteith JL 1989. Absorption of radiation by canopies and stand growth. In: Russell G, Jarvis P, Monteith J eds. Plant Canopies: Their Growth, Form and Function. ambridge University Press, Cambridge, 21-40. |
| [31] | Scurlock JMO, Cramer W, Cramer W, Olson RJ, Parton WJ, Prince SD (1999). Terrestrial NPP: towards a consistent data set for global model evaluation. Ecological Applications, 9, 913-919. |
| [32] | Sun R (孙睿), Zhu QJ (朱启疆) (2000). Distributional and seasonal change of net primary productivity in China from April, 1992 to March, 1993. Acta Geographica Sinica (地理学报), 55, 36-45. (in Chinese with English abstract) |
| [33] | Tao B (陶波) (2003). Study on the Simulation of Net Primary Productivity and Net Ecosystem Productivity in Chinese Terrestrial Ecosystem (中国陆地生态系统净初级生产力与净生态系统生产力模拟研究). PhD Disertation, Institute of Geographic Sciences and Natural Resurces Research, Chinese Academy of Sciences. (in Chinese with English abstract) |
| [34] | Tucker CJ, Newcomb WW, Dregne HE(1994). AVHRR datasets for determination of desert spatial extent. International Journal of Remote Sensing, 15, 3547-3565. |
| [35] | Uchijima Z, Seino H (1985). Agroclimatic evaluation of net primary productivity of natural vegetation. (1) Chikugo model for evaluating productivity. Journal of Agricultural Meteorology, 40, 343-353. |
| [36] | Woodward FI, Smith TM, William R, Emanuel WR (1995). A global land primary productivity and phytogeography model. Global Biogeochemical Cycle, 9, 471-490. |
| [37] | Zhang ZM (张志明) (1990). Theory and Methods About Computing Evapotranspiration (计算蒸发量的原理与方法). Chengdu Science and Technology University Press, Chengdu, 216-223. (in Chinese) |
| [38] |
Zhu WQ, Pan YZ, He H, Yu DY, Hu HB (2006). Simulation of maximum light use efficiency for some typical vegetation types in China. Chinese Science Bulletin, 51, 457-463.
DOI URL |
| [39] | Zhou GS (周广胜), Zhang XS (张新时) (1995). A natural vegetation NPP model. Acta Phytoecologica Sinica (植物生态学报), 19, 193-200. (in Chinese with English abstract) |
| [40] | Zhou GS (周广胜), Zhang XS (张新时) (1996a). Study on climate vegetation classification for global change in China. Acta Botanica Sinica (植物学报), 38, 8-17. (in Chinese with English abstract) |
| [41] | Zhou GS (周广胜), Zhang XS (张新时) (1996b). The Study on the Chinese natural vegetation net primary productivity in the global change. Acta Phytoecologica Sinica (植物生态学报), 20, 11-19. (in Chinese with English abstract) |
| [1] | 王袼, 胡姝娅, 李阳, 陈晓鹏, 李红玉, 董宽虎, 何念鹏, 王常慧. 不同类型草原土壤净氮矿化速率的温度敏感性[J]. 植物生态学报, 2024, 48(4): 523-533. |
| [2] | 梁逸娴, 王传宽, 臧妙涵, 上官虹玉, 刘逸潇, 全先奎. 落叶松径向生长和生物量分配对气候变暖的响应[J]. 植物生态学报, 2024, 48(4): 459-468. |
| [3] | 吴茹茹, 刘美珍, 谷仙, 常馨月, 郭立月, 蒋高明, 祁如意. 气候变化对巨柏适宜生境分布的潜在影响和预测[J]. 植物生态学报, 2024, 48(4): 445-458. |
| [4] | 黄玲, 王榛, 马泽, 杨发林, 李岚, SEREKPAYEV Nurlan, NOGAYEV Adilbek, 侯扶江. 长期放牧和氮添加对黄土高原典型草原长芒草种群生长的影响[J]. 植物生态学报, 2024, 48(3): 317-330. |
| [5] | 耿雪琪, 唐亚坤, 王丽娜, 邓旭, 张泽凌, 周莹. 氮添加增加中国陆生植物生物量并降低其氮利用效率[J]. 植物生态学报, 2024, 48(2): 147-157. |
| [6] | 李娜, 唐士明, 郭建英, 田茹, 王姗, 胡冰, 罗永红, 徐柱文. 放牧对内蒙古草地植物群落特征影响的meta分析[J]. 植物生态学报, 2023, 47(9): 1256-1269. |
| [7] | 赵艳超, 陈立同. 土壤养分对青藏高原高寒草地生物量响应增温的调节作用[J]. 植物生态学报, 2023, 47(8): 1071-1081. |
| [8] | 苏炜, 陈平, 吴婷, 刘岳, 宋雨婷, 刘旭军, 刘菊秀. 氮添加与干季延长对降香黄檀幼苗非结构性碳水化合物、养分与生物量的影响[J]. 植物生态学报, 2023, 47(8): 1094-1104. |
| [9] | 郭敏, 罗林, 梁进, 王彦杰, 赵春章. 冻融变化对西南亚高山森林优势种云杉和华西箭竹根区土壤理化性质与酶活性的影响[J]. 植物生态学报, 2023, 47(6): 882-894. |
| [10] | 李冠军, 陈珑, 余雯静, 苏亲桂, 吴承祯, 苏军, 李键. 固体培养内生真菌对土壤盐胁迫下木麻黄幼苗渗透调节和抗氧化系统的影响[J]. 植物生态学报, 2023, 47(6): 804-821. |
| [11] | 罗娜娜, 盛茂银, 王霖娇, 石庆龙, 何宇. 长期植被恢复对中国西南喀斯特石漠化土壤活性有机碳组分含量和酶活性的影响[J]. 植物生态学报, 2023, 47(6): 867-881. |
| [12] | 杜英东, 袁相洋, 冯兆忠. 不同形态氮对杨树光合特性及生长的影响[J]. 植物生态学报, 2023, 47(3): 348-360. |
| [13] | 和璐璐, 张萱, 章毓文, 王晓霞, 刘亚栋, 刘岩, 范子莹, 何远洋, 席本野, 段劼. 辽东山区不同坡向长白落叶松人工林树冠特征与林木生长关系[J]. 植物生态学报, 2023, 47(11): 1523-1539. |
| [14] | 刘艳杰, 刘玉龙, 王传宽, 王兴昌. 东北温带森林5个羽状复叶树种叶成本-效益关系比较[J]. 植物生态学报, 2023, 47(11): 1540-1550. |
| [15] | 郝晴, 黄昌. 森林地上生物量遥感估算研究综述[J]. 植物生态学报, 2023, 47(10): 1356-1374. |
| 阅读次数 | ||||||
|
全文 |
|
|||||
|
摘要 |
|
|||||
Copyright © 2026 版权所有 《植物生态学报》编辑部
地址: 北京香山南辛村20号, 邮编: 100093
Tel.: 010-62836134, 62836138; Fax: 010-82599431; E-mail: apes@ibcas.ac.cn, cjpe@ibcas.ac.cn
备案号: 京ICP备16067583号-19
![]()