


由于蒸发散在生态系统水分循环与能量平衡中占有十分重要的地位, 许多基于不同时空尺度的蒸发散及其组分(如植被蒸腾、土壤蒸发和冠层截留)评估方法被不断地研究及改进(宋霞等, 2003; Ferretti et al., 2003; Massman & Lee, 2002; 王礼先和张志强, 1998; 张志强等, 2001), 其中代表性的方法有土壤水分平衡法(Wilson et al., 2001)、树干液流法(刘奉觉和Edwards, 1997; Hatton et al., 1990; Lundblad & Lindroth, 2002)、植物气孔计法(Downton et al., 1988; Baker, 1991)、同位素跟踪法(Williams et al., 2004)、波文比法(吴家兵等, 2005)、涡度相关法(Williams et al., 2004; Law et al., 2002)、流域水量平衡法(Eagleson, 1978; Milly, 1994)以及遥感法(刘雅妮等, 2005)等, 这些方法技术原理不同、测定范围不同、测量时的环境背景和假设条件也不同, 可能有其特殊的优势, 也可能存在局限性。涡度相关法是目前假设条件少且可以在生态系统尺度上连续测定碳水通量的方法, 目前国内外有较多通过该系统测定CO2通量的研究报道(宋霞等, 2003; Ferretti et al., 2003; Law et al., 2002), 而将该系统用于水分通量的研究在国内仅有少数报道(宋霞等, 2004; 吴家兵等, 2005)。大多数涡度通量观测系统可同时测定气象因子以及能量各组分, 这便于分析水汽通量受各气象要素的影响以及与能量平衡各组分的关系(Olivier et al., 2006)。但由于该测量系统是基于湍流交换的空气动力学原理测定通量过程的, 所以受湍流交换水平的强弱影响很大。夜晚湍流交换较弱, 数据质量会受到影响, 使得测量系统所得到的能量平衡闭合水平较低 (Lee et al., 1996; Falge et al., 2001a, 2001b); 其他原因, 如雨季打湿的探测感应头, 或者鸟类的粪便滴落在感应器上以及结露、结霜等情况都会使仪器运转异常而影响数据质量, 通常的处理是去除这些数据然后采用其他方法填补。而各种运转故障的排除则需要定期的系统维护和保养。另由于该测量系统要求下垫面平坦, 林相均匀整齐, 所以在很多山区或者林分结构复杂的立地条件下应用受到了限制。
树干液流法被广泛应用于森林生态系统不同树种(刘奉觉等, 1993; 李海涛和陈灵芝, 1998; 高岩等, 2001)、不同林分类型(阮宏华等, 1999; 孙鹏森, 2000)以及不同气候区域(Thomas et al., 2003; Lagergren & Lindroth, 2004)条件下树木蒸腾的研究, 它被普遍认为是测定单株树木蒸腾作用较好的方法。采用该方法与涡度相关法同时观测蒸腾过程, 为研究特定生态系统在不同水分输入条件下蒸腾变化及其与环境控制因子的响应机制、占蒸发散的比重等问题提供了较为详细的信息。从单株水平尺度扩大到林分水平的误差分析及解决办法是目前该方法应用当中的研究重点(Wilson et al., 2001; Hatton et al., 1990)。同时, 从树干液流法经尺度转化所得到的生态系统尺度上的蒸腾水平与涡度相关法“footprint”有效测区蒸发散的实际测量水平是否一致也是一个急需研究的问题(Williams et al., 2004)。评估蒸发散及其组分的不同方法各代表的空间和时间尺度Wilson等(2001)已有详细的总结。
土壤蒸发量对于未郁闭林地而言是蒸发散总量中很重要的一个组分。独立评估土壤蒸发的水平和过程能与树干液流法的测定结果相结合来验证与涡度相关法测值的闭合关系, 也便于分析每种方法在应用当中的局限性。目前评估土壤蒸发较常见的方法有蒸渗仪法、水分通量法、蒸发皿称重法以及林下涡度相关法等(Olivier et al., 2006)。但每种方法都有其局限性, 共同的缺点主要表现为试验所测土样与田地自然土壤性状有差异, 虽然林下涡度相关法克服了这个问题, 但是测值中除了土壤蒸发量外, 还包括了所测范围内草灌层的蒸腾量。
本研究以位于北京市大兴区永定河沿河沙地的杨树(Populus euramericana)人工林生态系统为对象, 采用涡度相关法、树干液流法、土壤水分动态监测和土壤蒸发称重法相结合的综合技术体系, 分别测定了生态系统蒸发散、林木蒸腾量以及土壤蒸发量, 其目的在于: 1)对生态系统能量平衡的闭合水平进行检测, 评估涡度相关法测量结果的精度; 2)对比分析与评价不同水分条件下生态系统蒸发散及其各组分在不同时空尺度上的差异, 分析影响该生态系统蒸发散水平的主导因子; 3)对涡度相关法所测林分蒸散与分别基于树干液流法、土壤蒸发法和林冠截留蒸发组分求和而得的林分蒸散进行评估差异的分析比较。
1 研究方法
1.1 研究区概况
试验地位于北京市南郊大兴区榆垡镇大兴林场(39°31′50″ N, 116°15′07″ E, 海拔30 m), 属暖温带亚湿润气候区, 年平均气温为11.5 ℃, 极端最低气温-27.4 ℃, 极端最高气温40.6 ℃, 年平均无霜期209 d; 年平均日照总时数2 772 h, 净辐射日均通量为6.7 MJ·m-2, 平均风速2.60 m•s-1, 风向变化显著; 年平均降雨量569 mm, 20 a内最少年降雨量为262 mm, 最多年降雨量为1 058 mm, 其中7~9月降水占全年降水总量的60%~70%。该区是海河水系永定河洪积-冲积平原, 土质为沙壤土, 通透性好, 保肥蓄水能力差, 容重1.43~1.47 g•cm-3 。地下水位2003~2006年平均为16.67 m, 此期间水位平均每年下降1 m。
试验林为集约栽培‘欧美107’杨树人工纯林, 75%为2002年种植, 其余主要为1998、2001和2003年种植, 栽植密度(2 m × 2 m)。林地总面积0.8 km2, 林木平均胸径为12 cm, 平均树高为12 m。林下植物种类较少, 优势种为灰绿藜(Chenopodium glaucum), 伴生有紫花苜蓿(Medicago sativa), 黄香草木樨(Melilotus officinalis), 猪毛菜(Salsola collina)和蒺藜(Tribulus terrestris)等。
1.2 涡度相关法、树干液流法和土壤水分平衡法的测定原理
1.2.1 涡度相关法
涡度相关是指某种物质的浓度与其垂直速度的协方差。涡度相关法已经成为直接测定大气与植物群落气体交换通量的通用标准方法 (Law et al., 2002; Wilson et al., 2002 )。该试验区下垫面平坦均匀, 符合涡度相关法观测要求。运用涡度相关法(EC)开路系统直接测定潜热通量和显热通量, 通过用实时所测的垂直风速与水汽浓度/温度的协方差所得, 其湍流通量的计算式可表示为:
式中, LE 为潜热通量, H为显热通量, ρ为干空气密度, Cp为空气的定压比热, q′和T′分别为比湿和位温的脉动量, w′为垂直风速的脉动量。
本研究中通量数据一般采用0.5 h间隔的汇总或平均。数据处理基本步骤包括:
1)进行单位和量纲的统一。
2)去除峰值信号, 剔除3个方向上的风速、温度和水汽密度数据中的野点(异常值或奇异点, 这一步的具体做法为: 找到偏离物理量正常阀值范围的单数据点, 并用连续平均值来代替。
3)统计学计算, 一般需要计算平均值、标准偏差、统计学上的最小和最大值以及变量之间的协方差。在进行这些计算前不对数据进行过滤, 只进行数据块平均(Block averaging)。
4)对原始数据中的3个方向上的风速资料进行坐标旋转(Webb et al., 1980); 最普遍的旋转程序是以测定平均风速所定义每个观测期内的直角矢量为基础, 即自然风坐标系, 然后对所有观测的通量进行坐标轴旋转, 使超声风速计平行于地形表面。
5)另外仪器本身的倾斜也会对标量通量产生误差, 继而对动量通量产生误差。这种倾斜错误可以通过旋转风速矢量坐标来减少, 倾斜校正的基本坐标变换途径, 包括两次坐标轴旋转(Double coordinate rotation, DR) (Massman & Lee, 2002)和三次坐标轴旋转(Triple coordinate rotation, TR)。通常使坐标系x轴与平均水平风方向平行, 从而使平均侧风速度和平均垂直风速度为零, 即二次坐标轴旋转, 并且使相应的平均侧风应力也为零, 即三次坐标轴旋转。
在对该测定系统能量闭合(Energy balance closure)验证的基础上运用以下公式通过潜热通量(LE)计算林地蒸发散:
式中, 潜热通量(LE)的单位为(W·m-2), (597- 0.564T)为水的汽化热(cal·g-1), 0.43为单位转换系数, T 为冠层高度处的空气温度, 蒸发散(ET)通过将1 d中各0.5 h的值相加得到, 最后输出单位为(mm·d-1)。
1.2.2 树干液流法
树干液流法(Sap flow method)利用热扩散原理, 通过测定插入树干边材的热探针与参比探针的温度差dt的方法来估算平均液流速率。Grainer (1987)提出了一个无量纲的参数K, K=(dtm-dt)/dt, 其中dt是无液流时热探针与参比探针的温度差, dtm是阶段内探针的最大温差值。Grainer给出了平均液流速率Vs (cm·s-1)的经验公式Vs=0.011 9K1.231, 边材的流量Fs (cm3·h-1)可由Fs=As×Vs×3 600求得, 其中As为边材面积。
树干液流从单株水平到林分水平的空间尺度转化方法取决于立地条件和林分状况, 考虑到该试验林分为龄差较小的纯林, 胸径和边材面积具有很好的相关性, 故选用胸径作为纯量来推求林分水平的蒸腾量。解析木得到边材面积和胸径的关系方程为: 当DBH>6.5 cm时: y=11.77x-54.41, R2=0.98; 当DBH<6.5 cm时: y=6.44x-18.67, R2= 0.998; (y为边材面积, cm2; x为胸径, cm)。据此得到样地中所有样木的边材计算值。可用下式表示林分水平的蒸腾量(T, mm·d-1):
式中: T为林分水平的蒸腾量(mm·d-1); Fi为径阶i梯度组中所有样树的蒸腾量(cm3·d-1); A为样地总面积(m2); Jsk为测株k日平均每小时的液流密度(cm3·cm-2·h-1); Sk为同一径阶梯度组里所有样树的边材之和(cm2)。
1.2.3 土壤水分平衡法
对于本研究区而言, 水分收入项中除去降雨还在不同时段有一定的灌溉量, 由于该系统为平坦的沙地, 水分可以全部渗入土体, 土壤表面并不形成表面径流, 所以准确测定土壤水分含量是较为准确的测算该系统蒸散量的基础, 但水分通量零通量面的选择是本方法的难点所在, 由此造成的测算误差也是该方法的主要误差来源, 本研究中, 根据植被根系层的分布深度将土层的研究界面划定在2 m深度处, 假设2 m以下的土体水分不再发生上下交换, 再根据实际计算结果来检验假设并进行此方法的评价。
本研究中土壤水分平衡法计算蒸散总量的公式可表示为:
式中, P为计算时段内的降雨量(mm); Ir为计算时段内的灌溉量(mm);
通过2006年生长季所测各时段内的降雨量、灌溉量及土壤储水变化量依据上述公式推求各时段的蒸散量。
1.3 试验方法
本试验利用涡度相关观测系统, 在试验站点中心架设一高18 m的观测塔。主要观测仪器包括净辐射仪(Q7.1, REBS, Seattle, WA, USA)、日照强度计(LI200X-L, Li-Cor, Lincoln, NE, USA), 仪器安装高度均为15 m; H2O和CO2红外气体分析仪(Li-7500, Li-Cor, Lincoln, NE, USA)安装高度13 m; 三维超声风速仪(CSAT3, CS, USA)和气压计(CS105, CS, USA)安装高度均为13 m, 翻斗式自动雨量计(TE525-L, Texas Electronics, USA)安装高度为17 m; 空气温湿度传感器(HMP45C, Vaisala, Helsinki, Finland)在2、6、10和14 m高度处各安置一套; 土壤温度传感器(TCAV107, CS, USA)和土壤热通量板(HFT3, Campbell Scientific Inc., Logan, UT, USA)均置于地表以下5、10、20 cm处; 土壤水分观测仪(CS616, CS, USA)位于地表以下15和20 cm处。采用数据采集器(CR5000, CS, USA)以10 Hz频率采集观测数据, 实时数据采集的同时自动计算出通量数据并取30 min平均值, 全部观测数据保存到CF卡定时下载, 所下载的数据包括实时数据和0.5 h平均或汇总数据, 常规气象数据仅保存0.5 h平均或汇总数据。整个观测过程从2004年10月开始。
选择4株可代表林地不同径级的标准木作为树干液流的测株, 样树的胸径梯度从80到180 mm, 树高梯度从7到16 m。采用美国Dynamax公司生产的TDP热扩散液流探针(Thermal dissipation sap velocity probe), 所用的两个探针型号分别为TDP-30和TDP-50, 其中TDP-30探针长30 mm, 探针头直径为1.2 mm, TDP-50探针长50 mm, 探针直径为1.65 mm。对于胸径为180 mm的测株在树身的正南面1.3 m高处分别安装TDP-30和TDP-50探针各一套, 其余测株均在其树身的南北两侧1.3 m高处各安装TDP-30探针一套, 这种试验设计可便于对比不同边材深度及不同方向的液流水平差异。30 min 测量间隔所得的数据存储在CR10数据采集器里(CR10, CS, Logan, UN), 定时下载。该测量系统从2006年5月开始起测至今, 每年有效数据量不低于90%。
应用Micro-lysimeter蒸发器每天称重测定土壤蒸发, 称重时间与该站点水面蒸发的测定时间同步, 定为20: 00称测。由于降雨期间土壤蒸发量在目前的测量条件下无法观测, 而填补空缺值的方法难度较大, 故舍去降雨期间的数据。
由于土壤湿度探头位于地表以下20 cm处, 观测深度不够, 故辅以土钻烘干法连续测定2005年至2006年生长季林内0~100 cm范围内的土壤含水量(每间隔20 cm为1层, 分5层, 每隔10 d观测1次), 为了进一步研究土壤水分的连续动态变化, 2006年增加了可测50和100 cm深度的TDR水分探测仪, 测量间隔为1 h, 辅助分析土体含水量的动态变化。观测点布设在各样地的标准木下。由解析木分析了解到该林地林木主根系分布在地面以下30~80 cm范围内, 在林地无地下水补给, 研究区土壤层深厚的情况下, 对于降水入渗层和林木生长耗水层来说, 0~100 cm土层的水分观测基本能说明林地土壤水分的动态变化过程。
1.4 通量数据质量控制和空缺值填补
2006年微气象观测获得全年96%的气象数据, 其中包括净辐射、空气温湿度和降雨等, 缺失值采用平均昼夜变化法(MDV) (Lagergren & Lindroth, 2004)通过相邻10 d内相同时段的观测平均值来填补; 土壤热通量数据有约20%未采集到, 空缺值填补方法根据相邻20 d内土壤热通量与净辐射线性回归方程插补, 回归系数在0.8~0.9之间。分析生态系统蒸发散随时间动态变化过程需对涡度相关法所得数据(30 min均值)进行严格的质量控制和空缺值填补。采用以下几个标准进行潜热通量和显热通量的数据质量控制: 1)大气稳定度, 非常稳定和非常不稳定大气状态下所得的数据进行了剔除(Hollinger et al., 2004); 2)根据每个在线数据阶段内的数据记录数量, 即当实际记录数据量达到应该记录数据量的95%时(在30 min的10 Hz原始湍流数据中, 应该记录到的 18 000个数据里至少需有17 000个数据得到记录)方认为数据质量可靠; 3)湍流稳态测试, 将30 min 的数据分成6组5 min、10 Hz的短时间间隔数据系列, 当其稳态测试比值小于30%时认为湍流通量观测处于稳态条件, 接受此条件下的观测通量(Foken & Wichura, 1996; Mahrt, 1998); 4)在观测期间任意时刻下, 当摩擦风速μ*<0.25 m·s-1时(对试验数据进行综合分析后确定此临界值), 湍流强度较弱, 拒绝此状态下的观测数据, 以保证涡度相关的测定是处于强湍流条件下的观测结果。
通量数据经过上述步骤进行质量控制后, 潜热通量和显热通量的数据中大约有35%的数据被上述虑定条件拒绝, 成为空缺值。对于这些空缺值的填补, 根据空缺窗口的大小进行了分类处理(刘晨峰, 2007)。
2 结果分析
2.1 涡度相关能量平衡闭合分析
系统的能量平衡闭合分析是评价EC法观测数据可靠性的主要方法之一(Williams et al., 2004), 以2006年生长季5~10月该生态系统经质量控制后的数据每日的潜热通量和显热通量之和(LE+Hs)与可提供能量(Rn-G)进行闭合(图1), 所得回归直线斜率为0.86, 相关系数为0.87, 该闭合水平在大部分文献报道结果的范围内(Wilson et al., 2002)。该能量闭合的验证结果说明该站点的涡度相关法观测数据是可靠的。
图1
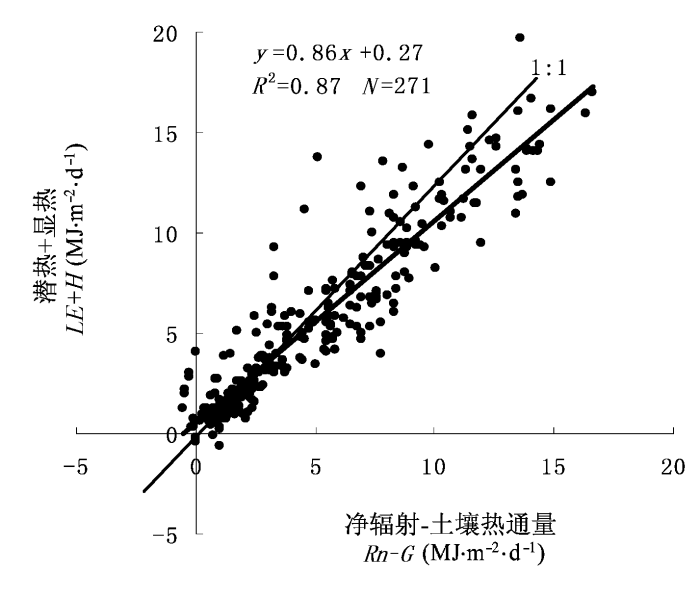
图1
2006年1~12月经质量控制后的数据每日能量闭合情况
LE: Latent heat H: Sensible heat Rn: Net radiation G: Soil heat flux
Fig. 1
Daily energy balance closure using the quality controlled data from January to December in 2006 for the Daxing site
2.2 水分状况对能量分配的影响
图2表明研究区2006年降雨分布极不均匀, 全年降雨总量为444 mm, 比当地多年平均降雨量低, 其中7、8月降雨量占全年降雨量的72%, 仅7月降雨量就达243 mm, 日平均温度也到达全年的最高水平, 为25.5 ℃, 最高温度为37 ℃, 这与2005年7月降水为146 mm的情况下, 日平均温度为27 ℃, 最高温度可达40.1 ℃相比, 相差较大; 而4和6月以及生长季末期9到10月林地水分输入明显不足, 土壤水分含量一般降至3%以下, 约占该林分田间持水量(为30%)的10%~15%, 从植被生理过程到生态系统尺度上的蒸发散水平都提示存在严重的水分胁迫状态。这种春秋少雨、土壤水分含量较低与夏季降雨充沛、土壤水分含量充足的干湿季分明的气候特征便于分析该生态系统在水分输入差异较大的情形下水量平衡各项的变化和能量各组分所占比例的差异(根据该区域的土壤特性和土壤含水量年内的变化过程, 将土壤含水量为20%的田间持水量以下的阶段定义为该生态系统的干季, 20%以上为湿季)。
图2
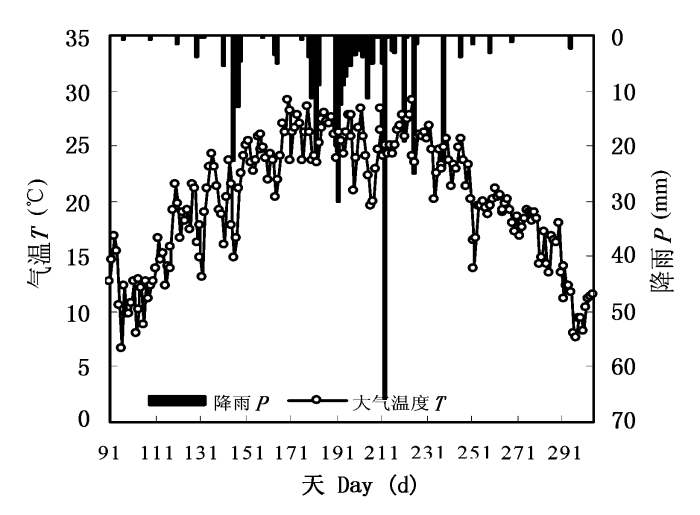
图2
2006年生长季内日降雨总量和日平均气温
Fig. 2
Daily precipitation and daily mean air temperature during the growing season of 2006 T: Temperature P: Precipitation
该生态系统能量平衡在水分输入差异较大的状况下各组分的分配比例显著不同。5月林地土壤水分条件较差, 月平均土壤水分含量不到3%, 只占该林分田间持水量(30%)的10%, 而凋萎湿度为1.44%, 故此期间的土壤水分严重限制了植物的正常生长。可以将此阶段作为生长季中的典型干季来分析。在典型干季日变化中, 显热高于潜热(图3a), 该日, 全天的净辐射收入量为8.8 MJ·m-2, 显热通量耗热为5.1 MJ·m-2; 7月5日土壤前期储水充足, 如图3b所示, 此期间土壤含水量达到8%, 为田间持水量的27% (全年土壤含水量最好状况下可达到10%), 可作为该生态系统特定条件下的典型湿季。日变化过程显示潜热水平远高于显热, 该天全天净辐射通量为29 MJ·m-2, 蒸发散潜热为19 MJ·m-2, 说明该系统在供水充足的条件下, 能量大部分用于蒸发散耗热, 大气增温幅度较小; 而干季的林内, 由于水分胁迫使得蒸腾强度很弱, 能量大部分用于加热空气所耗的显热, 所以以往文献所提到的森林的增湿降温作用在该生态系统中只在水分供应充足的条件下通过量化的能量各组成的比例能明显体现出来; 而干季, 这种效应几乎没有, 差异较大的原因除供水条件的差异外, 与该林地为沙质土, 保水持水性差, 散热和加热的速度都比较快、变化剧烈有关。土壤热通量无论在干季还是湿季, 变化程度都不大, 每天地热通量平均为1 MJ·m-2, 峰值发生的时间段与蒸发散和土壤蒸发峰值段基本一致。
图3
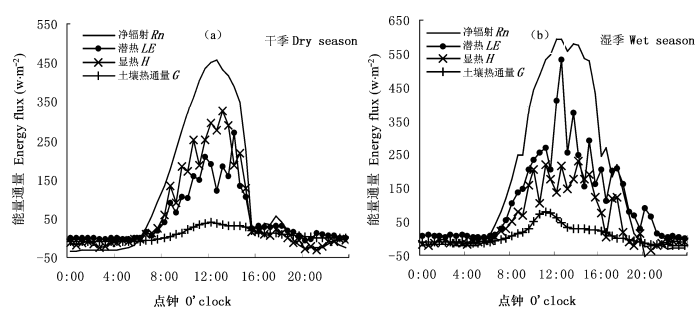
图3
2006年生长季能量平衡各组分不同水分条件下分配
Rn, LE, H, G: 同
Fig. 3
Energy balance and its components under different water conditions during the growing season of 2006 (a) dry days and (b) wet days
2.3 蒸发散组分变化特征
林分蒸发散总量和土壤蒸发量在生长季的峰值段均发生在8月上旬, 此期间平均每天蒸发散量和土壤蒸发量为4.4和1.9 mm。而蒸腾量的峰值段滞后并于8月中旬达到最高值, 平均每天蒸腾量为2.6 mm。蒸发散与蒸腾在生长季中的日峰值均发生于8月1日, 分别为5.3和3.5 mm, 土壤蒸发量在整个生长季内呈多峰分布, 峰值多发生于每场降雨之后的典型晴天, 全年日最大值为3.7 mm。由于7月充沛的降雨使得此期间林分水分环境是整个生长季最好的阶段, 8月蒸腾量占蒸发散总量的63%, 而在5和6月平均为47%和38%, 这与降雨在整个生长季内的数量和时间分布, 林分叶面积指数变化过程密切相关。
5、6和7月土壤蒸发量与植被蒸腾量相当, 但过程并不一样, 其中, 生长季初5月虽然降雨丰富, 但由于林分正处于展叶期, 且春季的辐射和温度也不算高, 所以蒸腾水平偏低, 土壤蒸发和蒸腾量相差不大。6月由于降雨量较小, 只有浅层土体, 也就是土壤蒸发所需水分的来源层得到了水分补偿, 使得土壤蒸发量维持在较高的水平, 而深层土体水分没有明显的改善, 所以即使在林分叶面积指数逐渐增大的情况下蒸腾仍然维持在较低的水平。而7月, 由于降雨量较多, 大气温度和辐射较低, 土壤蒸发和植被蒸腾水平也受到较大影响, 按照该林分2005年所做林冠截留的试验统计结果可知, 截留量大概占降雨量的10%, 也就是说7月截留蒸发量可以达到24 mm, 与蒸腾量和土壤蒸发量共同构成了7月较高的蒸发散总量。随着7、8月雨季的到来, 水分迅速下渗使深层土体水分环境得到明显改善, 植物蒸腾量所占比重显著增加, 在8~10月期间远高于土壤蒸发量。雨季前, 蒸腾量占蒸发散量比重较小, 而生长季末蒸腾量比重增加, 反映了水分从浅层土体逐渐入渗补偿深层植物根系主要分布区土体的过程。涡度相关法和组分求和法所得蒸散的日尺度进程见图4, 10月的观测结果显示, 涡度相关法日尺度所测的蒸发散总量比当天的蒸腾量、土壤蒸发量和林冠截留量三者之和偏低, 这是由于此期间涡度相关系统出现了仪器故障问题而导致测量结果低估了实际蒸发散总量。
图4
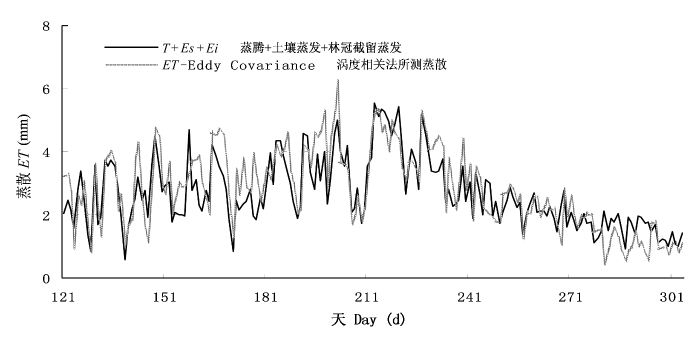
图4
2006年生长季内组分之和法与涡度相关法所测蒸发散过程
Fig. 4
Daily ecosystem ET estimated by eddy covariance and components-base approaches during 2006 ET: Evapotranspiration T: Temperature Es: Soil evaporation Ei: Interception evaporation
2.4 生长季内蒸发散测定结果的比较
图5
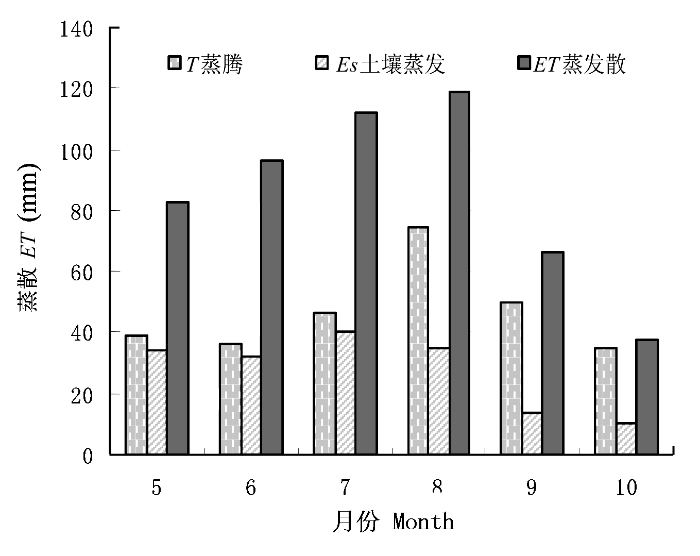
图5
2006年长季内蒸腾、土壤蒸发和蒸散的月总量ET, T, Es: 同
Fig. 5
Monthly estimates of transpiration, soil evaporation and evapotranspiration during 2006
图6
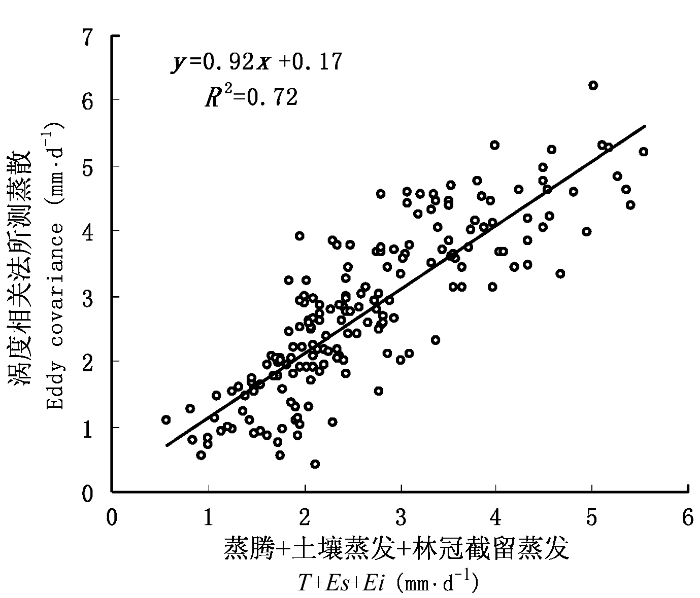
图6
组分之和法与涡度相关法所测结果的相关分析T, Es, Ei: 同
Fig. 6
Regression between monthly ET estimated by ET and component-based approaches in 2006
取8月水分条件较好的雨天和雨后晴天树干液流法对植被蒸腾和涡度相关法对总蒸发散量在林分水平上、小时尺度的测算结果进行对比(图7), 研究雨天和晴天两种方法观测结果相关性的差异可知, 晴天树干液流法得到的植被蒸腾过程与林分总蒸发散过程有很好的相关性, 相关系数为0.83, 而在雨天, 这种相关水平较弱, 相关系数仅为0.57; 一方面8月土壤深层水分得到很好的补偿, 植物蒸腾作用强烈, 蒸腾量占蒸发散总量的比例很高, 二者的日变化过程很相似, 所以相关性水平很高。同时数据分析表明, 此阶段夜间蒸腾水平几乎为零, 但涡度相关法观测到夜间仍有少量蒸发散量, 在晴朗的夜晚, 这部分蒸散应当直接来源于土壤蒸发, 因为土壤蒸发的发生条件比植物蒸腾简单, 只要有可供蒸发的水分以及适合的气象条件, 土壤蒸发就能发生。这为评估夜间土壤蒸发水平提供了较为精确的观测结果。在雨天的情况下, 一则截留蒸发占当天蒸发散总量相当的比重, 二则冠层顶部涡度相关法观测系统上的感应头被打湿也会导致数据的较大变异, 这均是雨天蒸腾和蒸发散总量相关水平低的原因。
图7
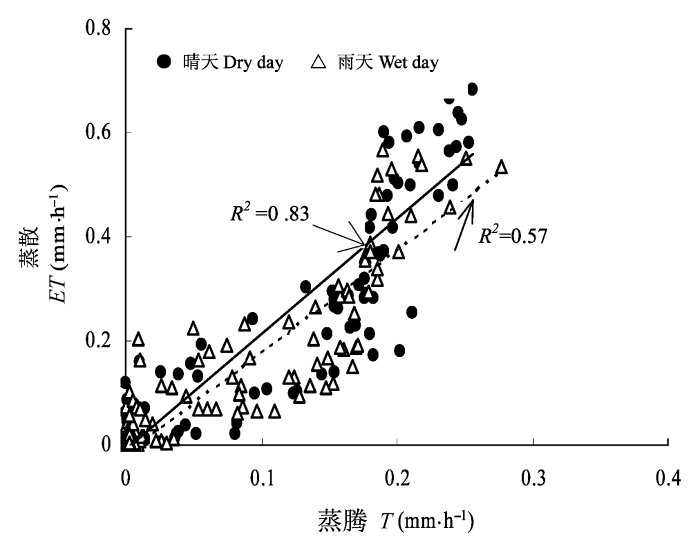
图7
2006年生长季内涡度相关法测定的蒸发散和树干液流法对蒸腾的评估在林分/小时尺度上的相关关系
Fig. 7
Relationship between hourly sap flow estimates of transpiration (T) and eddy covariance estimates of evapotranspiration (ET) during growing season of 2006
该生态系统生长季总水量平衡收入项及各分量的支出比例如图8所示, 生长季内, 降雨共465 mm, 灌溉累计约86 mm, 水分收入共计551 mm。基于土壤水分平衡法所计算的实际蒸发散总量为531 mm, 涡度相关法所测实际蒸发散总量为513 mm, 比土壤水分平衡法测定低3.4%, 占降水量的93%; 其中, 植物蒸腾量为281 mm; 土壤蒸发为165 mm; 而根据2005年观测试验所得到的经验公式计算出截留蒸发为46 mm, 这些基于独立方法所测得的蒸发散组分之和为492 mm, 与涡度相关法所得结果接近; 而与土壤水分平衡法测得的蒸发散总量相比, 还有40 mm的差额, 分析认为根据涡度相关法能量平衡闭合水平和严格的数据质量控制过程, 涡度相关法所测的结果生长季内除10月仪器故障质量较差外, 其余时段数据质量是可靠的。而土壤水分平衡法在该研究的前提假设下相对高估了蒸发散水平, 在7~8月的雨季期间, 由于降雨次数较多, 土体含水量一直偏高, 在这种前期土壤水分较饱和的情形下, 后期降雨能较快地补偿深层土壤水分并仍然有部分水分渗漏至土体的更深层, 即2 m以下土体仍然存在水分交换, 在这种状况下, 所计算的蒸发散量就会偏大, 误以为渗漏出研究系统界面的那部分水分是通过蒸发散损失的, 从而高估了蒸发散水平。这个计算结果可以考虑以后应用此方法时加深土体蓄水量的观测深度, 找准水分通量零通量面是该方法提高测定精度的主要因素。
图8
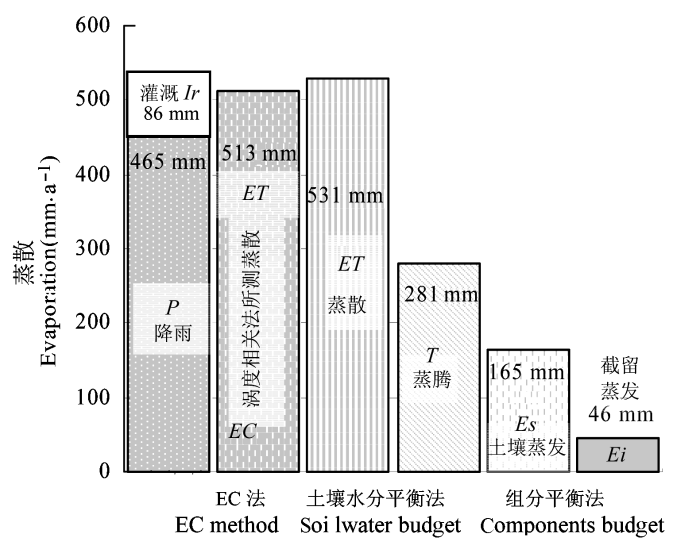
图8
2006年生长季内对降雨, 基于土壤水分平衡法的实际蒸发散, 基于涡度相关法的实际蒸发散
ET, T, Es, Ei: 同
Fig. 8
The independent annual estimates of precipitation, actual evaportranspiration (AET) derived from soil water budget and EC methods in 2006 Ir: Irrigation EC: Eddy covariance
取涡度相关法与基于独立方法所得到的各组分之和两个结果的均值作为该生态系统生长季的实际蒸发散量参考值, 则该生态系统蒸发散总量占水分收入总量的91.3%。
2.5 主要环境因子对蒸发散过程的影响
林分在不同的水分环境条件下, 涡度相关法和树干液流法在日尺度上的观测结果与饱和水汽压差(VPD)和净辐射强度(Rn)具有较为相似的响应关系(图9)。在土壤水分充足的条件下, 植被蒸腾量在水汽压差变化较小的情况下仍显示出较大的变化(图9a), 说明此期间植被蒸腾对于水汽压差的响应程度较低, 此时水汽压差不是蒸散的限制性因子。在土壤水分环境较差的情况下, 蒸腾水平随水汽压差的增加而逐渐增强, 二者有较为显著的响应关系, 说明此期间水汽压差是蒸腾水平的重要限制性因子。虽然水汽压差在此期间的变化幅度很大, 但并没有引起植被蒸腾的剧烈变化, 这是由水分制约造成的。相似的响应关系见于涡度相关法所测到的林分总蒸发散和水汽压差之间(图9b), 在土壤水分含量较低的状况下, 水汽压差和蒸发散水平之间相应关系较平缓, 且干季的蒸发散水平则相对较弱。同样是在水汽压差较小的情况下, 湿季的蒸发散水平仍可维持在较高的水平。
图9
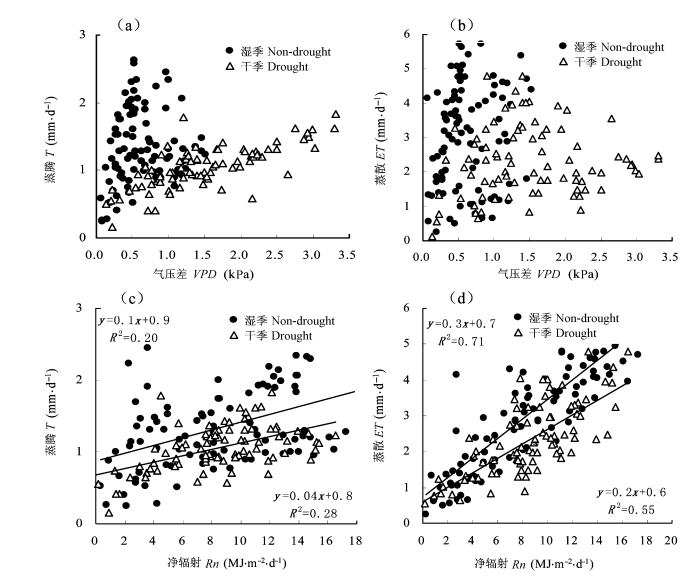
图9
2006年生长季内不同的水分环境条件下涡度相关法和树干液流法在日尺度上的观测结果和气压差/净辐射的响应关系
Fig. 9
Reponses of transpiration (T) and Evapotranspiration (ET) measured by sap flow and eddy covariance to the atmospheric vapor pressure deficit (VPD), (a) and (b) for net radiation (Rn), (c) and (d) under different water input during the growing season of 2006
3 结论和讨论
尽管目前大多数的研究将能量闭合水平作为涡度相关法数据质量控制的重要依据之一, 但还没有建立能量闭合水平及其对应的测量误差范围的定量关系, 而能量闭合水平还依赖于不同的时间尺度。我们采用涡度相关测量系统所研究的沙地杨树人工林2006年的能量闭合水平在整个生长季所得回归直线斜率为0.86, 相关系数为0.87,与很多同类研究相比, 闭合水平较高, 数据质量的可靠性较强。但这种闭合程度前提下所测得的系统蒸发散水平的误差范围是多少, 闭合水平达到多少才能将涡度相关法观测到的结果认为是标准值而评价其他方法测定精度, 本研究采用土壤水分平衡法、蒸发散组分求和法得到的杨树人工林生态系统蒸发散值与涡度相关法测定结果进行了比较分析, 为分析不同能量闭合水平条件下采用涡度相关法生态系统蒸发散测定误差进行评估。
由于本研究的杨树高耗水性和降雨短缺的矛盾使得林分在能量平衡和水量平衡过程中有不同于其他生态系统的特点。在水分受限期间, 能量平衡各组分中显热通量的比重大于潜热通量, 占净辐射通量的大部分, 能量的大部分用于加热空气; 在有雨水输入的条件下则表现为潜热比例大幅度提高, 显热显著较低。这表明, 该系统的能量分配特征对水分输入状况敏感度较高。
在该生态系统水量平衡中, 蒸发散总量占降雨总量的91.3%, 为503 mm, 其中各组分中土壤蒸发占蒸发散总量的33%, 植物蒸腾量占蒸发散总量的56%, 截留蒸发占10%, 土壤蒸发大约占蒸发散总量的1/3, 比起很多同类研究这个比例相对较高(Williams et al., 2004; Wilson et al., 2002)。在研究蒸发散以及蒸腾过程和环境因子的响应关系中, 水分条件是最重要的环境因子。在水分环境较好的条件下, 水汽压差与蒸腾、蒸散水平的响应关系不明显, 说明在水分条件充足的情况下, 水汽压差不是限制蒸散的主要因子, 蒸发散与净辐射的相关性比干季条件下显著, 且无论在干季还是湿季, 蒸发散总量的变化与净辐射的相关性均较高。这与2005年所研究的蒸发散与环境因子相关性分析的结论是一致的(刘晨峰等, 2006)。净辐射是蒸发散发生的先决条件, 水分条件的好坏决定了净辐射对蒸发散的影响程度。
对于没有径流形成的生态系统, 用土壤水分平衡法测算总蒸发散量可能带来的误差较小, 但是确定土壤水分零通量面位置难度较大。本研究林木主根系主要分布在30~80 cm之间, 测定土壤蓄水量变化的取土样深度为200 cm, 可能导致土壤水分平衡法产生一定的误差。因此, 200 cm以下土壤水分不参与水分交换的假设还有待于进一步的试验证实。如果土壤水分测定取样深度增加, 能够找到零通量面就可以减少土壤水分平衡法测定误差, 以此评价涡度相关法蒸发散测定精度更为合理。
参考文献
A possible role for photosystem II in environmental perturbations of photosynjournal
Non-uniform stomatal closure induced by water stress cause putative non-stomatal inhibition of photosynjournal
Climate, soil, and vegetation- introduction to water balance dynamics
Gap filling strategies for long term energy flux data sets
Gap filling strategies for defensible annual sums of net ecosystem exchange
Partitioning evapotranspiration fluxes from a Colorado grassland using stable isotopes: seasonal variations and ecosystem implications of elevated atmospheric CO2

The stable isotopic composition of soil water is controlled by precipitation inputs, antecedent conditions, and evaporative losses. Because transpiration does not fractionate soil water isotopes, the relative proportions of evaporation and transpiration can be estimated using a simple isotopic mass balance approach. At our site in the shortgrass steppe in semi-arid northeastern Colorado, 18O values of soil water were almost always more enriched than those of precipitation inputs, owing to evaporative losses. The proportion of water lost by evaporation (E/ET) during the growing season ranged from nil to about 40% (to >90% in the dormant season), and was related to the timing of precipitation inputs. The sum of transpiration plus evaporation losses estimated by isotopic mass balance were similar to actual evapotranspiration measured from a nearby Bowen ratio system. We also investigated the evapotranspiration response of this mixed C3/C4 grassland to doubled atmospheric [CO2] using Open-Top Chambers (OTC). Elevated atmospheric [CO2] led to increased soil-water conservation via reduced stomatal conductance, despite greater biomass growth. We used a non-invasive method to measure the 18O of soil CO2 as a proxy for soil water, after establishing a strong relationship between 18O of soil CO2 from non-chambered control (NC) plots and 18O of soil–water from an adjacent area of native grassland. Soil–CO2 18O values showed significant treatment effects, particularly during a dry summer: values in ambient chambers (AC) were more enriched than in NC and elevated chamber (EC) plots. During the dry growing season of 2000, transpiration from the EC treatment was higher than from AC and lower than from NC treatments, but during 2001, transpiration was similar on all three treatments. Slightly higher evaporation rates from AC than either EC or NC treatments in 2000 may have resulted from increased convection across the soil surface from the OTC blowers, combined with lower biomass and litter cover on the AC treatment. Transpiration-use efficiency, or the amount of above-ground biomass produced per mm water transpired, was always greatest on EC and lowest on NC treatments.]]>
Tools for quality assessment of surface-based flux measurements
A study on volume and velocity of stem sap flow of popular’s by heat-pulse technique
Evaluation of transpiration in a Douglas fir stand by means of sap flow measurements
Transpiration of a Douglas-fir (Pseudotsuga menziesii (Mirb.) Franco) stand was evaluated by sap flow measurements during a 4-month period. Between-tree variation in sap flow depended on crown class. On a sunny day, total transpiration was 1.6, 8.0 and 22.0 liters day(-1) for suppressed, codominant and dominant trees, respectively. Transpiration estimated by sap flow fell below potential evapotranspiration when available soil water decreased below 30% of its maximum value. Sap flow measurements gave transpiration values similar to those obtained by the water balance method.
Integration of sapflow velocity to estimate plant water use
The heat pulse technique provides an estimate of sapflow velocity at one position within the xylem of an individual plant. Previous experience has shown that the velocity profile across the conducting area cannot be assumed to be constant, necessitating several such point estimates for a reasonable characterization of the velocity profile with depth. These point estimates must be integrated over the sapwood conducting area to derive flux. The most common method is to fit a one degree of freedom least-squares polynomial to the point estimates, and then to integrate this equation across the sapwood profile and around the bole. An alternative method is presented based on a weighted average approach. The latter is shown to be a more robust estimator of flux when velocity profiles exhibit large curvatures.
Transpiration of plantation Pinus radiata estimated by the heat pulse method and the bowen ratio
Spatial and temporal variability in forest-atmosphere CO2 exchange
Variation in sapflow and stem growth in relation to tree size, competition and thinning in a mixed forest of pine and spruce in Sweden
Environmental controls over carbon dioxide and vapor exchange of terrestrial vegetation
Carbon dioxide exchange and nocturnal processes over a mixed deciduous forest
A study on the volume and velocity of stem sapflow of Betula dahurica and Acer mono forests by the heat pulse technique
Soil moisture statues effects on the energy allocation and diurnal evapotranspiration of a Poplar plantation ecosystem on sandy soil as measured by Eddy-Covariance method
Energy and Water budget of a Poplar Plantation in Suburban Beijing (北京地区杨树人工林能量和水量平衡研究)
A study on the dynamics of sap flow in space and time in poplar stems
A study on comparison of measuring water consumption for transpiration in poplar
Populus deltoides CV.“Lux”ex.I -69/55)and Ningxia Autonomous Region(Populus opera)from 1989 to 1991.The five measuring methods are whole-tree potometer,quick-weighing method,LI-1600 porometer,heat pulse technique and Penman—Monteith method.The results of the study are as follows:(1)Supposing that the relative value of daily transpiration waterconsumption per tree measured with whole-tree potometer is 100%,the relative value measured by quick-weighing method is 130%-140%,the relative value measured with LI-1600 porometer is 291% and the relative value measured by heat pulse technique is 90.14%.(2)Supposing that the relative value of the daily transpiration water-consumption per tree measured by heat pulse technique is 100%,the relative value measured by quick-weighing method is 88%in 6-year-old tree and 112%in 2-year-old tree.(3)The value measured with LI-1600 porometer is 30%-90%higher than that measured by quick-weighing method in Ningxia arid zone and 140%-220%higher than that in more humid area of Shandong Province.(4)The value measured by Penman-Monteith method is very close to that measured with whole—tree potometer and that measured by heat pulse technique with errors less than 2%.]]>
Summary of two-layer models on estimating evapotranspiration using quantitative parameters derived from remote sensing
Stand transpiration and sapflow density in relation to weather, soil moisture and stand characteristics
SummarySapflow density was measured in six stands in a boreal forest in central Sweden, to assess its dependence on soil moisture and stand characteristics. The stands were mixed and pure Scots pine and Norway spruce stands, which were between 34 and 105 years old. Sapflow was measured in 12 trees per stand using the Granier method during two contrasting growing seasons; one warm and dry and one wet and cool. The canopy conductance of the stands was estimated by the inverse of the Penman-Monteith equation, using time-lag-adjusted sapflow as input. Maximum canopy conductance varied between 8 mm s−1 and 88 mm s−1 for the stand with the lowest and highest conductance, respectively. Transpiration was higher in the dry, warm season, mean values for the different stands ranging between 1.30 to 4.64 mm day−1 during July to September. The corresponding range in the wet, cool season was 0.95 to 2.65 mm day−1. Besides climatic factors, stand age, stem density and diameter explained most of the variation in sapflow density. By use of multiple regression analysis for 5-day periods it was possible to estimate sapflow density and transpiration for a larger area of the forest. This upscaled areal transpiration was compared with evaporation measured by an eddy-correlation system located centrally in the area. It was shown that areal transpiration constituted 78% of total evaporation in the warm, dry season and 52% in the wet, cool season. It was not possible to establish with confidence a critical limit for soil water at which transpiration began to be reduced, mainly because of wide scatter in the relationship between potential and actual transpiration.Die Saftflussdichte wurde in sechs Beständen des borealen Waldes Zentralschwedens gemessen, um ihre Abhängigkeit von der Bodenfeuchte und den Bestandseigenschaften zu beurteilen. Die Bestände waren reine und gemischte Bestände von Waldkiefer und Fichte, zwischen 34 und 105 Jahre alt. Der Saftfluss wurde mit der Granier-Methode an 12 Bäumen pro Bestand in zwei unterschiedlichen Wachstums-Perioden gemessen: eine warme, trockene und eine nasse, kühle Saison. Die Kronendachleitfähigkeit wurde mit der inversen Penman-Monteith-Gleichung unter Verwendung eines verzögerungskorrigierten Saftflusses als Eingabe abgeschätzt. Die maximale Kronendachleitfähigkeit der Bestände variierte zwischen 8 mm s−1 bei geringster und 88 mm s−1 bei höchster Leitfähigkeit. Die Transpiration in der trockenen, warmen Saison im Zeitraum Juli bis September war mit Mittelwerten zwischen 1.30 und 4.64 mm Tag−1 höher. Die entsprechende Spannweite in der nassen, kalten Saison war 0.95 bis 2.65 mm Tag−1. Neben den klimatischen Faktoren erklärten Bestandsalter, Stammdichte und -durchmesser den größten Teil der Variation in der Saftflussdichte. Unter Verwendung einer multiplen Regressionsanalyse für 5-Tages-Zeiträume war es möglich, Saftflussdichte und Transpiration für ein größeres Areal des Waldes abzuschätzen. Diese hochskalierte Areal-Transpiration wurde mit der Verdunstung verglichen, die mit einem “eddy correlation”-System im Zentrum des Areals gemessen wurde. Es wurde gezeigt, dass die Areal-Transpiration in der warmen, trockenen Saison 78% und in der nassen, kalten Saison 52% der gesamten Verdunstung ausmachte. Hauptsächlich aufgrund der weiten Streuung in der Beziehung zwischen potentieller und tatsächlicher Transpiration war es nicht möglich mit Sicherheit ein kritisches Limit für das Bodenwasser zu finden, bei dem die Transpiration reduziert wurde.]]>
Flux sampling errors for aircraft and towers
Eddy covariance flux corrections and uncertainties in long-term studies of carbon and energy
Climate,interseasonal storage of soil water,and the annual water balance
Partitioning energy and evapotranspiration above and below a tropical palm canopy
A study on the transpiration intensity and total transpiration calculation of the secondary Oak forest
Study on the comparison of chamber technique and eddy covariance in measuring carbon flux
Comparison study on carbon dioxide, water and heat flux of the forest ecosystem in red earth hilly zone over winter and spring
Layout and Different Scale Water Use Characteristic of Water Conservation Tree Species in North Beijing Mountain Area (京北水源保护林格局及不同尺度树种蒸腾耗水特性研究)
Transpiration in a small tropical forest patch
Advances in the study of ecohydrological effects from vegetation changes
Correction of flux measurements for density effects due to heat and water vapour transfer
Evapotranspiration components determined by stable isotope, sap flow and eddy covariance techniques
A comparison of methods for determining forest evapotranspiration and its components: sap-flow, soil water budget, eddy covariance and catchment water balance
Energy balance closure at fluxnet sites
Comparison of eddy covariance and BREB methods in determining forest evapotranspiration—Case study on broad-leaved Korean pine forest in Changbai Mountain
Impacts of forest vegetation on runoff generation mechanisms: a review
Runoff generation mechanism is one of the key research focuses in the hydrological study on which more and more attention is concentrated.The complexity of hydrological processes such as scale dependence and nonlinear behavior resulted from the widespread spatial heterogeneity and temporal variability of hydrological environment and fluxes makes it very difficult,given that without detailed understanding of the physical processes,to extrapolate the information from one area to another or from one scale to another.Current generation of physically based,distributed parameter models could accommodate the assessment of hydrological impacts of forest vegetation changes to certain degree in comparison with traditional approaches.However,the confidence of such models and the scale issues highlights current and future research needs in the forest vegetation influences on the runoff generation and delivery mechanisms.Three major research methods being adopted are hydrometry,tracer/isotope tracing,and dynamic calculation at the spatial scale from hillslopes to watershed.The current understanding of forest vegetation influences on the runoff generation could be summarized as (a)runoff is controlled by variable source area mechanisms for forested watershed,(b)major runoff components for forested watershed are saturated surface runoff,subsurface runoff,and groundwater runoff,(c)co existing and shifting of different runoff generation mechanisms,and (d)preferential flow is a key factor in controlling runoff generation for forested watershed.
