


植物群落内外的环境常常存在较大的差别。植株的冠型不仅是对它生存环境的一种客观反映, 而且是环境和遗传等因素共同作用的结果(Archibald & Bond, 2003)。对冠层郁闭的植物群落如森林、草原和农田生态系统而言, 植物冠型在种间竞争中发挥着重要作用, 它不仅影响植物的株高、光截获、稳定性、自我保护和繁殖, 还决定了植物的生活史(Kohyama & Hotta, 1990; Coomes & Grubb, 1998)。对水分受限的干旱地区而言, 以孤立岛状分布的灌木为主的灌丛植被类型在自然植被中占有主导地位。在这种植被条件下, 地下竞争被认为是干旱区植物群落个体间竞争的主要形式(Fowler, 1986), 因为植物的地上部分间断分布, 冠层间的竞争不可能在种间和种内竞争中占主导地位。灌丛也对其生活和定植的环境, 如凋落物产量、盖度、生物量等产生了不可忽略的影响(赵哈林等, 2007)。由于灌丛的存在改变了局部小气候条件和营养物的输入, 产生了干旱区所特有的各种“资源岛”效应, 例如“肥岛”、“水岛”和“盐岛”等, 使植物可利用的资源在空间上也成岛状分布(Kidron, 2009)。对水分受限的荒漠生态系统来说, 孤立的岛状灌丛更多地体现了植物个体与环境的关系, 而非植物群体与环境的关系, 所以冠型可以不受种内和种间竞争的影响, 达到外界环境制约条件下的理想形态(Chesson et al., 2004; Allen et al., 2008)。
荒漠灌丛的建成, 即灌丛的水平(冠幅)拓展与垂直(株高)的长高(Xiao et al., 2006)、灌丛体积的增长和灌丛与外界环境的接触面(灌丛表面积)的扩大, 体现了灌木个体在生长发育过程中与环境的协调关系。不同灌木的这4组表型特征之间的异速生长, 会形成不同类型的冠型, 体现了不同物种与环境条件之间的关系。长久以来, 植物各部分之间的相对生长速率和冠型建成是植物形态学家和生态学家极为感兴趣的领域(Ishii et al., 2000)。特别是异速生长关系理论, 已经发展成描述动植物形态结构比例关系的一种行之有效的理论(韩文轩和方精云, 2008), 不仅影响着生物个体的所有生理变量和生理过程, 而且在种群、群落直至生态系统各层次的生态格局和过程中, 也发挥着重要作用(West et al., 2002; Brown et al., 2004), 虽然这一理论较多地建立在从幼苗到成年的植株个体外型结构及其相关指标的测量基础之上(Ishii et al., 2000)。大体来讲, 苗期的冠型是垂直生长(相对较快)和水平生长(较慢)的一种权衡(Ackerly & Donoghue, 1998; Hein & Spiecker, 2008)。随着时间的推移, 枝条的凋敝等因素会使植株冠型发生一些改变(Maguire & Hann, 1987), 尤其在树冠下部, 新生的枝条可能取代死亡或干枯的枝条, 同一树冠内水平方向上死亡或新生枝条的分布就使得冠型生长速率不同(Ishii et al., 2000)。对荒漠生态系统而言, 自然条件极其严苛, 植物可利用的资源十分稀缺, 长期处于匮乏状态(郑新军等, 2009), 在相对丰富的时期水资源以脉冲形式输入系统(Schwinning et al., 2004)。“脉冲-储存” (pulse-reserve)范式体现了群落自身发展和水分变化之间的耦合作用(Reynolds et al., 2004)。植物生长脉冲与碳同化之间的关系, 使得灌木的体积增长和表面积生长表现出一种适宜的表型特征。降水的长期波动以及不同类型的灌木间不同的用水策略(许皓等, 2010; 朱雅娟等, 2010), 使得灌木相对于草本植物而言, 增强了其作为群落优势种的稳定性(刘峻杉等, 2010)。所以, 荒漠生境的典型特征是环境的不确定性和资源亏缺, 植物在生活史选择时, 更趋于维持存活, 而非生殖和生长, 荒漠灌木的 生长必将极其缓慢, 而植物个体又相对较大 (Schwinning et al., 2008), 想短时间内通过栽培试验完整观测一株灌木的生活史是极不现实的, 更何况要获得大量统计意义上具有足够代表性的信息?这是异速生长理论在研究长生活史物种时遇到的主要问题。
本文将从Malthusian方程微分形式出发, 导出乘幂形式的异速生长公式, 结合大量野外植被调查获得的荒漠灌丛形态参数, 从理论上, 结合生境现实地分析并讨论在基本一致的环境条件下不同类型灌丛建成的异同点。
1 研究区概况
研究区地处中纬度欧亚大陆腹地, 东天山主峰博格达北麓三工河流域及其毗连的古尔班通古特沙漠东南缘, 地理区域大致为: 87°45′-88°05′ E, 43°45′-44°30′ N。属典型的温带大陆性荒漠气候, 年降水量为70-200 mm, 70%以上的降水集中在春夏两季, 年潜在蒸发量2 000 mm左右。年平均气温6.6 ℃, 最高气温42.6 ℃, 最低气温-41.6 ℃, 7月平均气温25.6 ℃, 1月平均气温-17 ℃, 冬季平均积雪深度为20 cm, 积雪覆盖稳定持续110天左右。土壤类型可以简单地按照质地分成较为黏重的灰漠土及盐化灰漠土和沙粒含量较高的风沙土。从自然植被类型来看, 一般是以稀疏且冠层不连续的超旱生的小半乔木、灌木和半灌木为建群种的荒漠灌丛和荒漠草地。
2 研究方法
2.1 植被调查和灌丛参数的获得
2.1.1 样点代表性和样方选取
为了较全面地获得研究区的荒漠灌丛信息, 广泛选取自然植被发育良好、群落结构完整、受人为干扰较小的代表性样点30个, 在每个样点设置100 m × 100 m的大样方, 再在每个大样方内随机选取10 m × 10 m的小样方9个, 通过这种方式的分层取样方法, 共调查10 m × 10 m样方270个。
2.1.2 植被调查
记录出现的灌木物种数(M)和每一物种(i)出现的株数(ji)。各物种相对频度(RF)和相对密度(RD)的计算, 参考《数量生态学》关于植物群落数量特征的相关公式(张金屯, 2004)。某物种在100 m × 100 m大样方调查中无论是一株还是多株, 都被认为在本样点出现, 那么灌木出现的最大频度(Fmax)为30, 最小(Fmin)为1, 某一物种的相对频度(RFi)可以通过下式计算获得:
种群相对密度(RDi)可以通过下式计算:
假设荒漠灌丛立体结构为半三轴椭球体, 那么其冠幅就为椭圆。灌丛在地表垂直投影的最大割线段作为冠幅长轴(a), 从灌丛中心通过与长轴正交的割线段作为短轴(b), 灌丛中心最高点距地面的距离作为灌丛株高(H)。用测尺测量并记录出现的所有灌丛的长轴、短轴和株高。
2.1.3 灌丛冠幅(CA)、灌丛体积(V)和灌丛表面积(S)的计算
灌丛冠幅通过下式计算:
灌丛体积通过下式计算:
根据半三轴椭球体的球坐标参数方程(5), 三轴椭球面是由$\phi$和$\lambda$所构成的区域, 根据曲面面积的积分公式推导出灌丛的表面积积分形式(6), 调用Matlab 7.0以上版本的dblquad函数即可直接计算出较为精确的灌丛表面积(S)。
2.2 灌丛形态参数的异速生长公式推导
根据Malthusian方程的微分形式, 生物个体或部分的相对生长速率与生长时间(t)成正比(徐克学, 2004), 那么灌丛的垂直生长(株高伸长)、水平生长(冠幅半径的扩大)、灌丛表面积增长和灌丛体积增长的相对速率可以表示如下:
将方程(7)与(8), (9)与(10)两两联立, 可以消去时间$t$, 即
将${{k}_{A}}/{{k}_{H}}={{\gamma }_{1}}$和${{{k}_{S}}}/{{{k}_{V}}}\;={{\gamma }_{2}}$带入方程(11)和(12), 解微分方程, 得到
方程(13)和(14)即为异速生长的乘幂形式, 等式两边取对数, 得到
${{C}_{1}}=\log (C_{1}^{*})$, ${{C}_{2}}=\log (C_{2}^{*})$, C1、C2为常数。按方程(15)与(16), 作log(CA)~log(H)和log(S)~log(V)的线性回归, 求得参数γi和Ci。并作方差分析和$F$检验, 如果p < 0.05, 则认为线性回归方程有统计学意义, 即模型通过验证; 同时, 根据决定系数(R2)的大小判定各曲线拟合优势度。
所有数据计算、统计分析和作图都用Minitab 15.0和Matlab 7.0完成。
3 结果和分析
3.1 灌丛类型及其数量特征
在30个样点的270个10 m × 10 m样方中, 共出现18种类型的灌丛, 隶属于7科16属, 总计3 302株灌木, 这些灌木的相对密度和相对频度见表1。相对频度最高的3类灌丛依次为梭梭(Haloxylon ammodendron, Ha)、淡枝沙拐枣(Calligonum leucocladum, Cal)和白梭梭(Haloxylon persicum, Hp), 分别为93.3%、56.7%和56.7%, 其他均不超过50%。只在一个样点出现的灌丛类型有4种, 即: 花花柴(Karelinia caspica, Kc)、驼绒藜(Ceratoides lateens, Cel)、盐节木(Halostachys caspica, Hs)和盐生假木贼(Anabasis salsa, Ans)。种群相对密度最大的4类灌丛为Ha、琵琶柴(Reaumuria soongorica, Rs)、盐爪爪(Kalidium spp., Kf)和Hp, 分别为38.5%、24.2%、13.2%和4.0%, 合计79.9%, 约占全部灌丛数量的4/5。还有8类灌丛白刺(Nitraria sibirica, Ns)、Cal、柽柳(Tamarix spp., Tr)、Kc、疏叶骆驼刺(Alhagi sparsifolia, Als)、毛足假木贼(Anabasis eriopoda, Ae)、盐穗木(Halostachys caspica, Hc)和准噶尔沙蒿(Artemisia songarica, Ars)的种群相对密度大于1%, 另外6类灌丛黑果枸杞(Lycium ruthenicum, Lr)、铃铛刺(Halimodendrom halodendron, Hh)、Cel、小叶碱蓬(Suaeda microphylla, Sm)、Hs和Ans的种群相对密度小于1%, 即在全部样点调查的样方中, 种群数量在33株以下, 已属十分罕见。在18类灌木类型中只有Ha和Hp同时在种群相对密度和相对频度上占优势。
表1 灌丛类型及其数量特征
Table 1
| 物种 Species | 代号Code | 相对密度Relative density (RD) (%) | 相对频度Relative frequency (RF) (%) |
|---|---|---|---|
| 白刺 Nitraria sibirica | Ns | 1.2 | 13.3 |
| 淡枝沙拐枣 Calligonum leucocladum | Cal | 3.3 | 56.7 |
| 白梭梭 Haloxylon persicum | Hp | 4.0 | 56.7 |
| 柽柳 Tamarix spp. | Tr | 2.9 | 26.7 |
| 黑果枸杞 Lycium ruthenicum | Lr | 0.8 | 6.7 |
| 花花柴 Karelinia caspica | Kc | 1.5 | 3.3 |
| 铃铛刺 Halimodendrom halodendron | Hh | 0.4 | 6.7 |
| 疏叶骆驼刺 Alhagi sparsifolia | Als | 1.4 | 6.7 |
| 毛足假木贼 Anabasis eriopoda | Ae | 1.3 | 6.7 |
| 琵琶柴 Reaumuria soongorica | Rs | 24.2 | 33.3 |
| 梭梭 Haloxylon ammodendron | Ha | 38.5 | 93.3 |
| 驼绒藜 Ceratoides lateens | Cel | 0.7 | 3.3 |
| 小叶碱蓬 Suaeda microphylla | Sm | 0.7 | 13.3 |
| 盐节木 Halocnemum strobilaceum | Hs | 0.6 | 3.3 |
| 盐生假木贼 Anabasis salsa | Ans | 0.7 | 3.3 |
| 盐穗木 Halostachys caspica | Hc | 2.3 | 10.0 |
| 盐爪爪 Kalidium spp. | Kf | 13.2 | 16.7 |
| 准噶尔沙蒿 Artemisia songarica | Ars | 2.3 | 13.3 |
3.2 灌丛高度、冠幅、体积和表面积的数量特征
18类灌丛的高度、冠幅、体积和表面积数量如图1所示。灌丛高度为0.02-5.80 m, 平均高度最高的为Hp, 1.89 m, 平均高度最小的为Rs, 0.22 m。平均高度在1.00 m以上的还有Hh和Ha。平均冠幅面积前4位为Hp、Tr、Hh和Ha, 分别为4.065、2.686、2.306和2.008 m2, 而平均冠幅面积最小的为Als, 仅0.079 m2。灌丛体积最小的仅为0.000 02 m3, 是一株Rs, 而最大值为119.58 m3, 是一株Tr, 后者约是前者的6 × 10⁶倍。与灌丛体积一样, 虽然Tr灌丛表面积的最大值可达94.16 m2, 但是平均表面积最大者仍是Hp。
图1
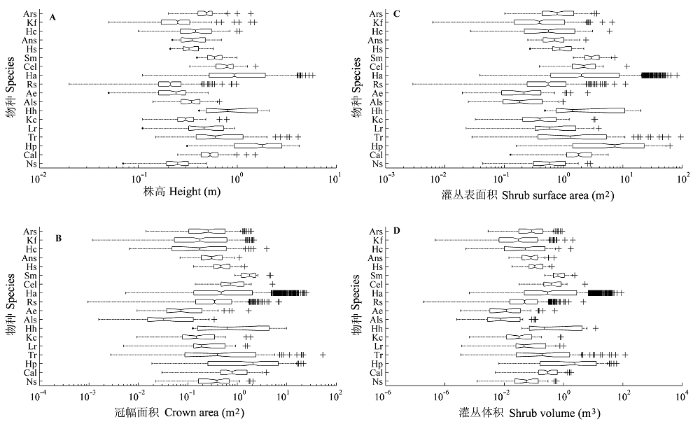
图1
18种灌木的株高(A)、冠幅面积(B)、灌丛表面积(C)和体积(D)的分布。箱型图左、右的竖线为样本的25%和75%分位数, 箱型顶端和底部的差值为四分位极值; 箱型中间的竖线为样本中值, 若线不在箱型中央, 则表明存在偏度; 箱型向左或向右延伸的直线称为“触须”, 若没有统计异常值, 则样本最大值为右触须顶部, 样本最小值为左触须的底部。若样本中存在距离箱型左侧或右侧大于1.5倍内四分位极值的数值, 则认为样本中有统计异常值(如图用“+”表示)。若触须外无数据, 则底部触须有一点; 箱型上下两侧的V型槽口对应样本中值95%置信区间。物种代号见
Fig. 1
Distribution of 18 shrubs’ height (A), crown area (B), shrub surface area (C) and volume (D). On each box, the reft and right edges of the box are the 25th and 75th percentiles, the difference of the top and bottom is quartile extreme; the central mark is the median, if the line doesn’t lie the central of the box, it shows skewness; box to the left or right extension of the line were known as “whisker”, if there were no statistical outliers, the maximum value of the sample should be the top of the right whiskers, and the sample minimum should be the bottom of the left whisker. It will be considered as statistical outliers in the samples if there are values more than 1.5 times of the quartile extreme from the left or right side of the box (see Figure with “+” indicates). A dot will be at the bottom of the tentacles if no data out of tentacles; the notch of both sides of the box corresponding to 95% confidence interval of the samples. Species code see
3.3 灌丛水平拓展和垂直生长的关系
18类灌丛冠幅面积和高度取对数后的散点图及数量关系如图2所示。log(CA)~log(H)线性回归的方差分析和F检验结果显示, 18类灌丛均有p < 0.05, 特别是除Hs以外的其他类型灌丛均有p < 0.001。可见方程(15)在统计学上具有极其显著的意义, 但其决定系数除了Hp、Tr和Ha达0.75以外, 其他的决定系数均较低, 表现出植物个体间的差异性。对方程(13)两边进行开方, 得:
然后, 对H求二次导数, 得到:
若γ1 > 1.0, 则d$\sqrt{CA}$/dH是单调递增函数, 否则为单调递减函数。于是从回归结果可知, Ns、Ae、Ha、Cel和Hc的γ1大于0.9而小于1.1, 表明冠幅半径和株高的相对生长速率随株高的增加基本平衡, 冠型向近半球型发展; 而Hp、Tr、Kc、Hh、Als、Rs和Kf的γ1均大于1.1, 表明这7类灌丛冠幅半径的相对生长速率随株高的增加, 将逐渐优先于株高的相对生长速率, 向扁平方向发展, 其余6类灌丛γ1小于0.9, 说明株高的相对生长速率将随株高的增长, 逐渐优先于冠幅半径的相对生长速率。这18类荒漠灌木随着灌丛的增高, 水平拓展速率相对于垂直长高速率将逐渐增大, 冠型将逐渐由竖直型向扁平型方向发展。
图2
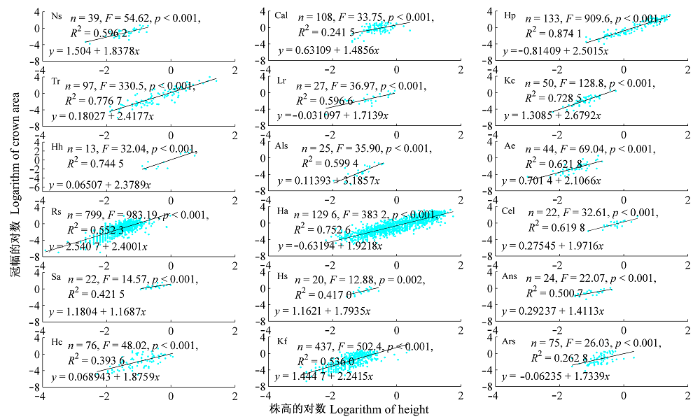
图2
18类灌丛的冠幅与株高的相互关系。物种代号见
Fig. 2
Relationship between height (H) and crown area (CA) of 18 shrubs. Species code see
3.4 灌丛体积生长与表面积生长的关系
18类灌丛表面积和体积取对数后的散点图及数量关系如图3所示。log(S)~log(V)线性回归的方差分析和F检验结果显示, 18类灌丛均有p < 0.001, 可见方程(16)在统计学上有极其显著的意义, 同时决定系数都达0.98以上, 表明拥有极好的曲线拟合优势度。18类灌丛的系数γ2和C2都分布在极窄的范围内, 分别为0.603 52-0.681 06和1.251 7-1.493 5, 平均值 分别是0.652 00 ± 0.004 20和1.383 40 ± 0.013 90。特 别是灌丛表面积的相对生长速率与体积相对生长速率的指数接近2/3, 可知这些灌丛在荒漠环境适应方面表现出惊人的相似性。
图3
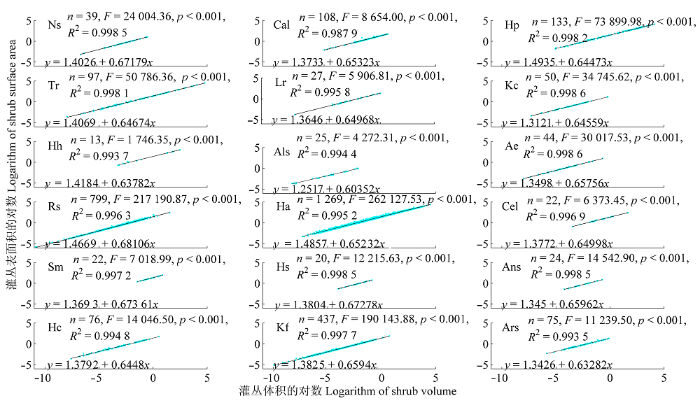
图3
18类灌丛的表面积与体积的相互关系。物种代号见
Fig. 3
Relationship between surface area and volume of 18 shrubs. Species code see
3.5 灌丛生长情景模拟
根据方程(15)与(16)及3.2和3.3的结果, 模拟灌丛的生长情景并画出生长模式图。图4 (Ns)-(Ars)由内到外依次再现了18类灌丛平均高度为1/8、1/4、1/2、1和2倍时, 灌丛中心的纵切面图, 很好地反映了这18类灌木随着株高的伸长冠型发生的变化。按灌丛中心的纵切面将其分为3类, 即: 竖直型、扁平型和近球型, 不同类型的灌丛拥有不同的冠型, 并在不同生长阶段其冠型也不同。如图4所示, Rs在株高较矮时, 冠型为竖直型, 但是在株高趋近于其增长极限时, 株高的相对生长速率下降很快, 而冠幅的相对生长速率却变化不大, 或仍然保持较高水平, 使冠型转变为扁平型, 似乎表明Rs的水平拓展较少受到限制, 而株高生长受到极大地限制, 很早就达到生长极限。
图4
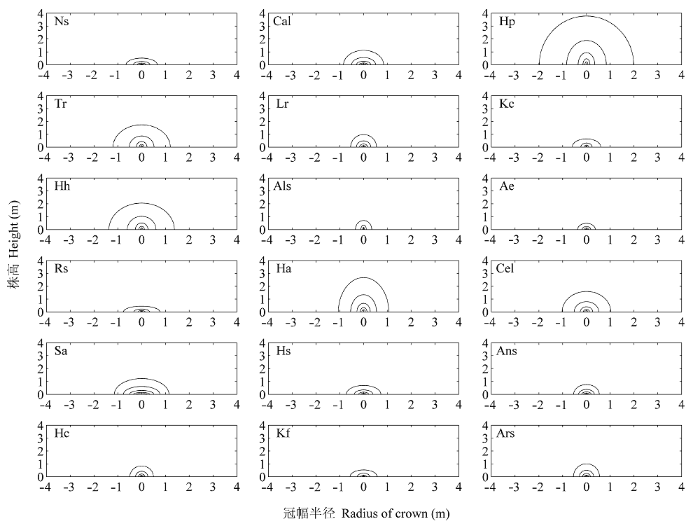
图4
18种灌木的冠型模拟图。物种代号见
Fig. 4
Crown-type simulative diagrams of 18 desert shrubs. Species code see
4 结论
Westoby和Wright (2003)在综述大量研究文献的基础上, 提出了度量种间变异的3对异速生长的生态维度, 即: 单位叶面积生物量与叶寿命、种子单位质量与产量和叶片大小与其着生小枝大小, 并认为它们可以快速测定, 能比较和综合世界范围内大量野外实验和生理生态研究的数据和结果。然而对荒漠植物来说并非如此, 它们有一些种的叶片部分甚至全部退化, 而以当年生未木质化的小枝作为同化器官, 代替叶片功能。在本研究中, 最典型的莫过于荒漠灌木梭梭, 它广泛分布于准噶尔荒漠各种土壤质地和盐分条件下, 一般都能成为建群种, 可见至少Westoby和Wright (2003)提出的3对生态维度有2对是不适用的, 所以有必要根据荒漠植物的特点寻找新的生态维度来比较物种间的差异。
灌丛数量特征, 如灌丛高度和冠幅面积是一对相对简单易行的适于大量测定的指标。如果为了量纲分析的需要, 将冠幅面积转换为冠幅半径, 就可以表征灌丛水平拓展和垂直增高之间的数量关系。从本文的研究结果来看, 灌丛的发展趋势可以是扁平型、近半球型和竖直型。但是由于维管导水系统向上提升力的限制, 使灌丛高度容易受到限制, 较快达到生长极限, 使灌丛在成年期(例如在灌木株高为平均株高的2倍时)最终都停留在扁平型和近半球型。
灌丛形态, 特别是长成期的形态, 是灌木对所处环境长期适应的结果。因为在荒漠生态系统中, 植被稀疏, 灌丛之间有间隔, 光不是种间竞争的限制因素, 个体不必比周围长得更高就可以接受足够的光线, 这也是荒漠灌丛在一定阶段后停止生长的原因之一。是否灌丛的水平拓展就可以无限地发展下去, 最终占领灌丛周围所有空地, 使植被冠层郁闭?荒漠生态系统由于水分受限, 生物可利用的资源极度稀缺, 不能维持郁闭冠层产生的对资源的消耗, 所以灌丛个体的外表面即为植物与大气环境的界面。考虑到荒漠植物一般由幼嫩的小枝部分或全部代替叶片作为同化器官, 这些同化枝也一般处于枝条的最前端(即外表面), 所以气体交换如呼吸与蒸腾作用也发生在这里。蒸腾消耗的水分是荒漠灌丛维持生存的最重要的投入, 灌丛的表面可以理解为灌丛的蒸发面, 同时整个灌木的现存生物量是整个灌丛的产出, 灌木生物量与灌丛表面积的数量关系反映了荒漠植物的投入产出关系。如何能够在最小灌丛表面积条件下, 生产出更多生物量, 对荒漠灌木就显得尤为重要, 因为这样植物就处于群落竞争的优势地位。然而大量获得荒漠灌木的生物量信息是十分困难的, 也是不可能的, 因为挖掘根系和收割地上部分称重, 将对脆弱的荒漠环境产生危害。如果将灌丛体积理解为植物体地上部分现存生物量所占有的空间, 那么灌丛体积必然与生物量成正比, 也可以用来表征植物的碳同化收入, 于是, 只需计算灌丛体积和灌丛表面积并研究它们之间的数量关系。因此对灌丛形态进行适当合理的假设, 可以计算体积和表面积就显得尤为关键。在本研究中, 假设荒漠灌丛形态为半三轴椭球体, 根据欧氏几何模型的量纲分析, 体表面积与长度的平方成正比, 而体积与长度的立方成正比。那么体表面积就与体积的2/3次方成正比, 从本研究结果来看, γ2极接近于2/3, 表明这样处理是可取的。既然γ2$\equiv$2/3, 于是参数C2的变动可以反映水分利用效率高低的不同。本研究的结果表明, 参数C2在较狭窄的范围内波动, 相对较为恒定, 是该荒漠地区灌丛植物对荒漠环境的一种形态趋同适应的表现。在所有几何体中, 球体的表面积与体积之比最小, 如果单纯地考虑灌丛形态对水分利用效率最优化的影响, 那么半球就是荒漠灌丛最理想的形态, 此时半球表面积与半球体积2/3次方之比的自然对数值为1.345, 而在本研究中, 18种灌木的参数C2在1.251 7-1.493 5范围内波动, 平均值为1.383 4 ± 0.013 9, 所以这些荒漠灌木形态都接近于最佳水分利用效率时的灌丛形态。
致谢
国家杰出青年科学基金(40725002)资助。
参考文献
Leaf size, sapling allometry, and Corner’s rules: phylogeny and correlated evolution in maples (Acer)
Allometry, growth and population regulation of the desert shrub Larrea tridentata
Growing tall vs growing wide: tree architecture and allometry of Acacia karroo in forest, savanna, and arid environments
Toward a metabolic theory of ecology
Resource pulses, species interactions, and diversity maintenance in arid and semi-arid environments

Arid environments are characterized by limited and variable rainfall that supplies resources in pulses. Resource pulsing is a special form of environmental variation, and the general theory of coexistence in variable environments suggests specific mechanisms by which rainfall variability might contribute to the maintenance of high species diversity in arid ecosystems. In this review, we discuss physiological, morphological, and life-history traits that facilitate plant survival and growth in strongly water-limited variable environments, outlining how species differences in these traits may promote diversity. Our analysis emphasizes that the variability of pulsed environments does not reduce the importance of species interactions in structuring communities, but instead provides axes of ecological differentiation between species that facilitate their coexistence. Pulses of rainfall also influence higher trophic levels and entire food webs. Better understanding of how rainfall affects the diversity, species composition, and dynamics of arid environments can contribute to solving environmental problems stemming from land use and global climate change.
A comparison of 12 tree species of Amazonian caatinga using growth rates in gaps and understorey, and allometric relationships
The role of competition in plant communities in arid and semiarid regions
Review on the mechanism models of allometric scaling laws: 3/4 vs. 2/3 power
Crown and tree allometry of open-grown ash (Fraxinus excelsior L.) and sycamore (Acer pseudoplatanus L.)
The aim of this study was to set up allometric models on the development of open-grown trees (OGT) of ash (Fraxinus excelsior L.) and sycamore (Acer pseudoplatanus L.). Sampling was carried out during a study on valuable broadleaves in Europe and covers a geographical location from 0° to 9° eastern longitude and 47° to 51° northern latitude in Western Europe. We set up models describing (I) crown allometry, taking into account possible effects of (II) site-specific differences and (III) species effects. In addition, simulations were used calculating the potential width of the knotty core inside the stem for self-pruned OGTs. The models also procured insight into space occupation of OGTs. This investigation on crown and tree allometry for a broad range of tree size complements dynamic models on growth of broadleaved trees only monitored at young ages and for a small number of years. It quantifies the relationship between tree height, stem diameter, height-stem diameter ratio, height to crown base, and descriptors of crown form. Only for the models on the crown width/length ratio (WL ratio) and on the crown ratio were there no significant allometric differences between the two species. For none of the models were site effects found to be significant. Self-pruning of ash and sycamore OGTs was slow and the simulated knottiness of the trunk was considerable. Therefore artificial pruning is necessary for a long clear bole, although both species are known for fast self-pruning. In addition, comparison of crown allometric models for forest trees and open-grown ash and sycamore trees underlined the need for specific models in agroforestry based on OGT. Specifically, when tree diameter being equal, OGTs have larger crowns compared to trees from closed forests. During tree development crown form changes uniformly with no significant species-related difference: The vertical crown expansion of young ash and sycamore overweighs the lateral expansion. As trees mature, the crown WL ratio increases leading to crown width values almost equal to crown length. Thus in their early stages of development ash and sycamore OGTs invest more in the vertical space occupation and only at later stages in horizontal expansion.]]>
Branch growth and crown form in old coastal Douglas-fir
The effect of shrub canopy upon surface temperatures and evaporation in the Negev Desert
Significance of allometry in tropical saplings
Effect of rainfall interannual variability on the biomass and soil water distribution in a semiarid shrub community
Equations for predicting sapwood area at crown base in southwestern Oregon Douglas-fir
Modifying the “pulse-reserve” paradigm for deserts of North America: precipitation pulses, soil water, and plant responses
Sensitivity of the Colorado plateau to change: climate, ecosystems, and society
Thresholds, memory, and seasonality: understanding pulse dynamics in arid/semi-arid ecosystems
Allometric scaling of metabolic rate from molecules and mitochondria to cells and mammals
The leaf size-twig size spectrum and its relationship to other important spectra of variation among species
There is a spectrum from species with narrow, frequently branched twigs carrying small leaves and other appendages, to species with thick twigs carrying large leaves and appendages. Here we investigate the allometry of this spectrum and its relationship to two other important spectra of ecological variation between species, the seed mass-seed output spectrum and the specific leaf area-leaf lifespan spectrum. Our main dataset covered 33 woody dicotyledonous species in sclerophyll fire-prone vegetation on low nutrient soil at 1,200 mm annual rainfall near Sydney, Australia. These were phylogenetically selected to contribute 32 evolutionary divergences. Two smaller datasets, from 390 mm annual rainfall, were also examined to assess generality of cross-species patterns. There was two to three orders of magnitude variation in twig cross-sectional area, individual leaf size and total leaf area supported on a twig across the study species. As expected, species with thicker twigs had larger leaves and branched less often than species with thin twigs. Total leaf area supported on a twig was mainly driven by leaf size rather than by the number of leaves. Total leaf area was strongly correlated with twig cross-section area, both across present-day species and across evolutionary divergences. The common log-log slope of 1.45 was significantly steeper than 1. Thus on average, species with tenfold larger leaves supported about threefold more leaf area per twig cross-section, which must have considerable implications for other aspects of water relations. Species at the low rainfall site on loamy sand supported about half as much leaf area, at a given twig cross-section, as species at the low rainfall site on light clay, or at the high rainfall site. Within sites, leaf and twig size were positively correlated with seed mass, and negatively correlated with specific leaf area. Identifying and understanding leading spectra of ecological variation among species is an important challenge for plant ecology. The seed mass-seed output and specific leaf area-leaf lifespan spectra are each underpinned by a single, comprehensible trade-off and their consequences are fairly well understood. The leaf-size-twig-size spectrum has obvious consequences for the texture of canopies, but we are only just beginning to understand the costs and benefits of large versus small leaf and twig size.
Density effects on plant height growth and inequality in sunflower populations
Influence of solar radiation and groundwater table on carbon balance of phreatophytic desert shrub Tamarix
Multiple effects of shrub on soil properties and understory vegetation in Horqin Sand Land, Inner Mongolia
The condensation water input to the saline- alkaline desert ecosystem in the southeastern edge of the Junggar Basin
Water use strategy of five shrubs in Ulanbuh Desert
