


碳(C)、氮(N)、磷(P)是细胞结构与功能最为重要的生命元素, 且各元素与植物体内的代谢过程存在密切的联系, 通常植物体内C的固定需要大量酶(N库)的参与, 而酶的装配需要大量核酸的复制(P库) (Sterner & Elser, 2002; 曾德慧和陈广生, 2005)。物候节律是植物对环境适应与进化的重要表现特征, 伴随植物发育阶段的不同, 往往涉及物质在功能代谢方面的非平衡分配, 一般认为, 随着植物物候期的推迟, 植物细胞内贮藏性物质的比例会逐渐增多(Kerkhoff et al., 2005), 因此, 植物物候期的不同, 植物叶片C、N、P计量特征也可能会出现很大差异。另外, 同一生活型的生物, 在结构和功能上具有很多的相似性, 反映了对外界环境适应与进化的趋同性(孙儒泳等, 1993; 张文彦等, 2010), 所以, 同一生活型的植物叶片C、N、P化学计量特征在不同生长季节的动态变化规律可能具有一致性, 但目前关于以上两方面的报道不多(吴统贵等, 2010; 李征等, 2012)。此外, 现有的大范围植物叶片C、N、P含量及其计量学特征的研究结果, 大多是基于不同年份的数据集合, 其叶片采集的时间能相差1-3个月(如样品采集时间为7-9月) (Reich et al., 1997; Reich & Oleksyn, 2004; Wright et al., 2004, 2005; Han et al., 2005; Kerkhoff et al., 2005; He et al., 2006; 李玉霖等, 2010), 且各植物种的物候期也不一致, 那么, 不同生长季节植物叶片C、N、P化学计量比是否变化且变化范围又有多大?对当前群落水平植物生态化学计量学的研究有何启示?本试验研究了6种灌木植物叶片C、N、P含量及计量比特征在整个生长季中的动态变化特征, 以便为大尺度植物生态化学计量学研究中的取样设计提供参考。
1 材料和方法
1.1 研究地概况
研究样地位于内蒙古阿拉善左旗巴彦浩特西南约32 km (105°36′ E, 39°08′ N )处, 海拔1360 m, 年平均气温8 ℃, 极端最高气温38.6 ℃, 极端最低气温-33.2 ℃, ≥10 ℃积温3000-3400 ℃。年降水量80-150 mm, 年蒸发量3000-4000 mm, 年平均风速3.1 m·s-1, 土壤为棕漠土(Pei et al., 2006)。植被是以霸王(Zygophyllum xanthoxylum)为优势种, 白刺(Nitraria tangutorum)、红砂(Reaumuria soongorica)、驼绒藜(Ceratoides latens)、猫头刺(Oxytropis aciphylla)、沙冬青(Ammopiptanthus mongolicus)为主要伴生种的荒漠群落。
1.2 试验设计和样本采集
2010年5月份, 在该样地内选择霸王、白刺、红砂、驼绒藜、猫头刺、沙冬青6种灌木植物作为研究对象, 每种植物固定7株中等大小长势及冠幅一致的植株, 逐月中旬收集植物叶片样品, 并观察其物候期, 观察时间为5-10月(表1)。为减少采样时对植物的伤害, 于第一次采样时, 每株植物固定12个新生枝条, 接下来每月仅选择2个新生枝条, 收集其上的所有叶片, 混合后作为1个重复样品。野外采集的叶片样品, 室内65 ℃烘干至恒重, 粉碎过0.5 mm筛, 装入棕色磨口瓶, 用于C、N、P的测定。
表1 6种灌木植物采样物候期记录
Table 1
| 物种 Species | 5月 May | 6月 Jun. | 7月 Jul. | 8月 Aug. | 9月 Sept. | 10月 Oct. |
|---|---|---|---|---|---|---|
| 霸王 Zygophyllum xanthoxylon | D | F | A | A | A | H |
| 白刺 Nitraria tangutorum | A | F | G | A | A | H |
| 红砂 Reaumuria soongorica | A | A | A | C | D | F |
| 驼绒藜 Ceratoides latens | A | A | A | A | A | F |
| 猫头刺 Oxytropis aciphylla | C | F | A | A | A | H |
| 沙冬青 Ammopiptanthus mongolicus | F | F | A | A | A | A |
A, 营养期; B, 现蕾期; C, 初花期; D, 末花期; E, 初果期; F, 盛果期; G, 落果期; H, 枯黄期。
A, vegetative stage; B unopened buds stage; C, open flowers stage; D, old flowers stage; E, initiated fruit stage; F, expanding fruit stage; G, seed dehisced stage; H, senescence stage.
1.3 室内测定
植物C、N含量采用有机元素分析仪(Flash- EA1112, Thermo Scientific, West Palm Beach, USA)测定; 植物P含量采用钼锑抗比色法测定, 称取植物样品150 mg, 然后添加5 mL硝酸和5 mL氢氟酸, 经800 ℃微波消解, 转移定容到50 mL容量瓶, 采用钼锑抗比色法测定P含量(Kuo, 1996)。
1.4 数据处理
用SigmaPlot 11.0作图, 用统计软件SPSS 11.0对实验数据进行统计分析, 显著度水平设为0.05。不同物种与不同采样月份对植物叶片C、N、P含量及其化学计量特征的影响结果采用Repeated- Measure ANOVA分析。
2 结果
2.1 不同生长季节植物叶片C、N、P含量及其计量比的动态变化特征
6种植物叶片C、N、P含量及其计量比在整个生长季节内的变化规律不一致(图1), 植物叶片C含量, 沙冬青、猫头刺、驼绒藜和白刺4种植物在生长季内基本保持不变, 霸王、红砂表现为先降低后升高的趋势。植物叶片N含量, 白刺、红砂逐渐下降, 沙冬青略有增加, 霸王、驼绒藜、猫头刺表现为先降低后升高的规律。植物叶片P含量, 6种植物5月份含量较高, 之后逐渐降低, 接下来, 红砂和沙冬青趋于稳定, 9月份霸王、白刺和驼绒藜叶片P含量再次升高, 10月份又有所降低, 猫头刺则是7月份叶片P含量最低, 而后逐渐升高。植物叶片C:N, 霸王、驼绒藜、猫头刺表现为先升高后降低的趋势, 沙冬青在整个生长季节内呈现出缓慢降低的趋势, 白刺表现为缓慢上升的趋势, 红砂5月至8月保持不变, 8月至10月明显增加。整个生长季节植物叶片C:P, 沙冬青基本保持不变, 其余5种植物表现为先升高后降低再升高的趋势。植物叶片N:P, 沙冬青在整个生长季节内呈现出缓慢升高的趋势; 红砂则在5-7月明显增加, 8月降低, 8-10月变化不大; 霸王、白刺、驼绒藜和猫头刺4种植物则为先升高后降低再升高的趋势。
图1
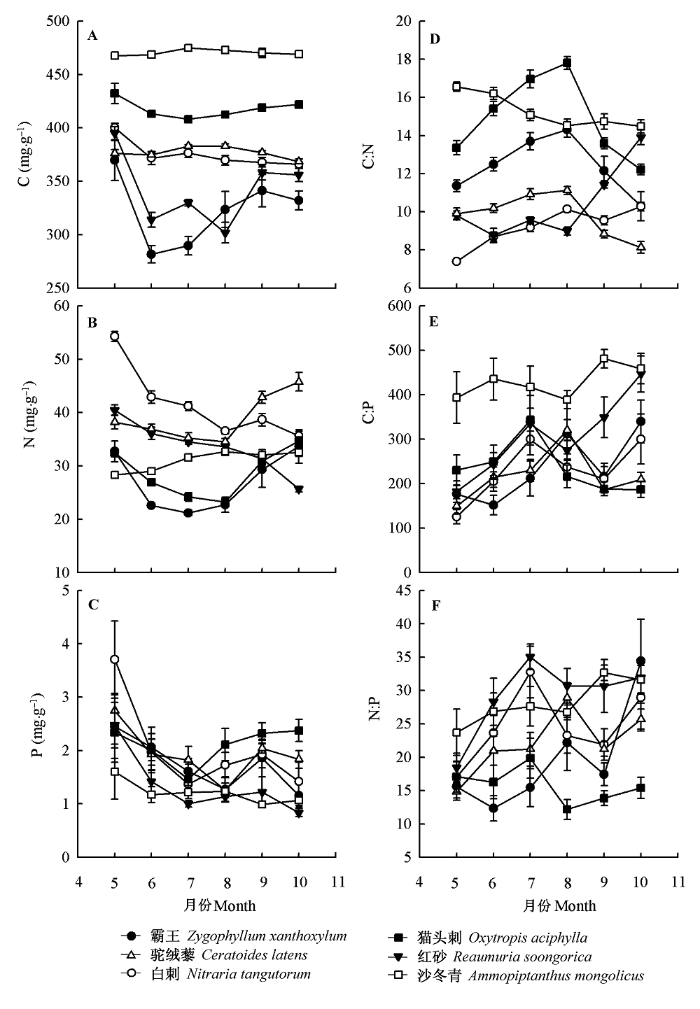
图1
6种植物不同物候期叶片C、N、P及C:N、C:P、N:P的动态(平均值±标准误差, n = 7)。
Fig. 1
Seasonal dynamics of leaf C, N, P contents and C: N, C: P, N: P mass ratios in six plant species (mean ± SE, n = 7).
2.2 不同植物叶片C、N、P含量及其计量比的季节变异特征
6种植物叶片C、N、P含量及其计量比在整个生长季节内的变异特征不同(表2), 植物叶片C含量的变异整体较小, 仅霸王变异系数(10.20%)大于10%, 其余5种植物均小于10%。植物叶片N含量的变异, 仅沙冬青变异系数(6.09%)小于10%, 其余5种植物变异系数均大于10%, 霸王变异系数最大, 为20.50%, 不同月份间其叶片N含量为21.19-33.64 mg·g-1。植物叶片P含量的变异整体较大, 6种植物变异系数均大于15%, 其中, 白刺、红砂变异系数超过了40%。
表2 6种灌木植物不同物候期叶片C、N、P及C:N、C:P、N:P的变化
Table 2
| 参数 Parameter | 物种 Species | 平均值 Mean | 极差 Range | 最小值 Minimum | 最大值 Maximum | 变异系数 Coefficient of variation (%) |
|---|---|---|---|---|---|---|
| C (mg·g-1) | 霸王 Zygophyllum xanthoxylon | 322.87 | 88.03 | 281.53 | 369.56 | 10.20 |
| 白刺 Nitraria tangutorum | 375.24 | 34.49 | 365.71 | 400.20 | 3.40 | |
| 红砂 Reaumuria soongorica | 342.43 | 93.32 | 301.73 | 395.04 | 9.97 | |
| 驼绒藜 Ceratoides latens | 377.03 | 14.53 | 368.49 | 383.01 | 1.45 | |
| 猫头刺 Oxytropis aciphylla | 417.81 | 24.25 | 408.04 | 432.29 | 2.07 | |
| 沙冬青 Ammopiptanthus mongolicus | 470.59 | 7.29 | 467.63 | 474.92 | 0.60 | |
| N (mg·g-1) | 霸王 Zygophyllum xanthoxylon | 27.02 | 12.44 | 21.19 | 33.64 | 20.50 |
| 白刺 Nitraria tangutorum | 41.53 | 18.56 | 35.67 | 54.23 | 16.36 | |
| 红砂 Reaumuria soongorica | 33.60 | 14.76 | 25.66 | 40.42 | 14.68 | |
| 驼绒藜 Ceratoides latens | 38.91 | 11.24 | 34.51 | 45.75 | 11.47 | |
| 猫头刺 Oxytropis aciphylla | 28.72 | 11.43 | 23.22 | 34.65 | 16.19 | |
| 沙冬青 Ammopiptanthus mongolicus | 31.01 | 4.36 | 28.28 | 32.64 | 6.09 | |
| P (mg·g-1) | 霸王 Zygophyllum xanthoxylon | 1.73 | 1.29 | 1.16 | 2.45 | 28.20 |
| 白刺 Nitraria tangutorum | 2.02 | 2.33 | 1.37 | 3.70 | 42.71 | |
| 红砂 Reaumuria soongorica | 1.35 | 1.64 | 0.84 | 2.47 | 43.43 | |
| 驼绒藜 Ceratoides latens | 1.94 | 1.49 | 1.26 | 2.75 | 24.78 | |
| 猫头刺 Oxytropis aciphylla | 2.10 | 0.91 | 1.46 | 2.37 | 16.43 | |
| 沙冬青 Ammopiptanthus mongolicus | 1.21 | 0.61 | 0.99 | 1.60 | 17.56 | |
| C:N | 霸王 Zygophyllum xanthoxylon | 12.38 | 4.02 | 10.29 | 14.31 | 11.94 |
| 白刺 Nitraria tangutorum | 9.20 | 2.88 | 7.39 | 10.27 | 11.55 | |
| 红砂 Reaumuria soongorica | 10.41 | 5.15 | 8.76 | 13.91 | 18.78 | |
| 驼绒藜 Ceratoides latens | 9.85 | 2.99 | 8.12 | 11.12 | 11.92 | |
| 猫头刺 Oxytropis aciphylla | 14.89 | 5.59 | 12.21 | 17.81 | 14.81 | |
| 沙冬青 Ammopiptanthus mongolicus | 15.26 | 2.08 | 14.48 | 16.56 | 5.87 | |
| C:P | 霸王 Zygophyllum xanthoxylon | 234.59 | 187.76 | 151.95 | 339.71 | 31.95 |
| 白刺 Nitraria tangutorum | 229.79 | 174.74 | 125.48 | 300.22 | 28.71 | |
| 红砂 Reaumuria soongorica | 305.21 | 264.85 | 182.00 | 446.86 | 30.28 | |
| 驼绒藜 Ceratoides latens | 218.22 | 171.42 | 149.09 | 320.52 | 26.30 | |
| 猫头刺 Oxytropis aciphylla | 235.61 | 155.38 | 186.96 | 342.33 | 24.45 | |
| 沙冬青 Ammopiptanthus mongolicus | 429.07 | 92.05 | 388.88 | 480.94 | 8.48 | |
| N:P | 霸王 Zygophyllum xanthoxylon | 19.56 | 22.09 | 12.32 | 34.42 | 40.73 |
| 白刺 Nitraria tangutorum | 24.59 | 15.69 | 17.06 | 32.74 | 22.44 | |
| 红砂 Reaumuria soongorica | 29.18 | 16.60 | 18.46 | 35.06 | 19.52 | |
| 驼绒藜 Ceratoides latens | 22.12 | 14.04 | 14.82 | 28.87 | 21.63 | |
| 猫头刺 Oxytropis aciphylla | 15.77 | 7.69 | 12.17 | 19.86 | 16.90 | |
| 沙冬青 Ammopiptanthus mongolicus | 28.18 | 8.93 | 23.70 | 32.64 | 11.86 |
植物叶片C:N的变异, 除沙冬青外(5.87%), 其余4种植物变异系数均大于10%, 红砂变异系数最大, 不同月份间其叶片C:N范围为8.76-13.91。植物叶片C:P的变异, 也是沙冬青最小, 为8.48%, 其余4种植物变异系数均大于20%, 其中, 霸王、红砂变异系数超过了30%。植物叶片N:P的变异, 沙冬青最小, 为11.86%, 霸王最大, 为40.73%, 白刺、红砂、驼绒藜、猫头刺介于15%-25%之间。
综合分析6种植物叶片C、N、P及其计量比各指标在整个生长季节的变异, 植物叶片P含量的变异系数最大, 为28.85%, 含量范围为0.84-3.70 mg·g-1。其次为C:P和N:P的变异系数, 分别为25.02%、22.18% (比值变化范围分别为125.48- 480.94、12.17-35.06), 植物叶片N含量(含量变化范围为21.19-54.23 mg·g-1)及C:N (比值变化范围分别为7.39-17.81)的变异系数分别为14.22%、12.48%。植物叶片C含量的变异系数最小, 为4.62%, 其含量范围为281.53-474.92 mg·g-1。
2.3 植物叶片C、N、P及其计量比的整体变异分解
植物叶片C、N、P及其计量比受不同采样时间和植物种类单因素及其两因素的交互影响程度各不相同(表3), 植物叶片C含量的变异主要受植物种类影响, 其离差平方和最大为597711.49, 但采样时间以及植物种类和采样时间的交互作用对植物叶片C含量的影响也达到显著水平。与植物叶片C含量相类似, 植物叶片N含量的变异也主要受植物种类影响, 其次, 为植物种类和采样时间的交互作用, 接下来为采样时间, 以上三者对植物叶片N含量的影响均达到显著水平。植物叶片P含量的变异主要受植物采样时间影响, 其次为植物种类,而植物种类和采样时间的交互作用对植物叶片P含量的影响不显著。植物叶片C:N、C:P和N:P的变异都主要受植物种类影响, 其次为植物种类和采样时间的交互作用, 接下来为采样时间, 以上三者对植物叶片C:N、C:P和N:P的影响都均达到显著水平。
表3 6种灌木植物叶片C、N、P含量及C: N、C: P、N: P的整体变异来源分析
Table 3
| 参数 Parameter | 变异来源 Source of variation | df | 离差平方和 SS | 均方 MS | F |
|---|---|---|---|---|---|
| C (mg·g-1) | 物种 Species (S) | 5 | 597 711.49 | 119 542.30 | 148.64* |
| 物种间误差 S-error | 36 | 28 953.23 | 804.26 | ||
| 月份 Month (M) | 5 (1) | 34 439.91 | 6 887.98 | 29.92* | |
| 物种×月份 S × M | 25 (5) | 53 994.40 | 2 159.78 | 9.38* | |
| 月份间误差 M-error | 180 (36) | 41 444.84 | 230.25 | ||
| N (mg·g-1) | 物种 Species (S) | 5 | 6 916.68 | 1 383.34 | 75.89* |
| 物种间误差 S-error | 36 | 656.19 | 18.23 | ||
| 月份 Month (M) | 5 (1) | 1 443.42 | 288.68 | 36.61* | |
| 物种×月份 S × M | 25 (5) | 3 676.34 | 147.05 | 18.65* | |
| 月份间误差 M-error | 180 (36) | 1 419.24 | 7.88 | ||
| P (mg·g-1) | 物种 Species (S) | 5 | 28.51 | 5.70 | 11.97* |
| 物种间误差 S-error | 36 | 17.14 | 0.48 | ||
| 月份 Month (M) | 5 (1) | 39.07 | 7.81 | 12.16* | |
| 物种×月份 S × M | 25 (5) | 21.12 | 0.84 | 1.32 | |
| 月份间误差 M-error | 180 (36) | 115.64 | 0.64 | ||
| C:N | 物种 Species (S) | 5 | 1 435.30 | 287.06 | 173.29* |
| 物种间误差 S-error | 36 | 59.64 | 1.66 | ||
| 月份 Month (M) | 5 (1) | 68.78 | 13.76 | 21.33* | |
| 物种×月份 S × M | 25 (5) | 427.37 | 17.09 | 26.51* | |
| 月份间误差 M-error | 180 (36) | 116.07 | 0.64 | ||
| C:P | 物种 Species (S) | 5 | 1402 340.42 | 280 468.08 | 41.53* |
| 物种间误差 S-error | 36 | 243 097.02 | 6 752.69 | ||
| 月份 Month (M) | 5 (1) | 345 548.68 | 69 109.74 | 9.12* | |
| 物种×月份 S × M | 25 (5) | 564 090.30 | 22 563.61 | 2.98* | |
| 月份间误差 M-error | 180 (36) | 1 363 342.92 | 7 574.13 | ||
| N:P | 物种 Species (S) | 5 | 5 524.04 | 1 104.81 | 23.28* |
| 物种间误差 S-error | 36 | 1 708.24 | 47.45 | ||
| 月份 Month (M) | 5 (1) | 2 445.29 | 489.06 | 9.80* | |
| 物种×月份 S × M | 25 (5) | 3 334.12 | 133.36 | 2.67* | |
| 月份间误差 M-error | 180 (36) | 8 978.80 | 49.88 |
自由度后括号内数字为按Lower-bound方法校正后的自由度结果。*表示在0.05水平影响显著。
df corrected with Lower-bound method in parentheses in the df column. * indicates significant influence at 0.05 level.
3 讨论
植物叶片元素特征与自身结构特点和生长节律有密切关系(Aerts & Chapin III, 2000), 本研究通过对6种植物不同月份采样调查也发现, 植物叶片C、N、P含量及C:N、C:P和N:P的变异特征不仅与植物种类有关, 而且不同生长季节差异很大(图1; 表2)。沙冬青为常绿植物, 其叶片C、N、P含量及其计量比不同生长季节间变异较小, 可能是由于其叶片全年保持常绿生活状态, 生理代谢强度变化较小的缘故。相比, 其他5种植物均为落叶植物, 由于其叶片生理代谢活力受日照和温度的影响存在明显的季节波动, 叶片C、N、P含量及C:N、C:P、N:P不同生长季节间差异较大, 不过以上各指标的季节变化规律在上述5种植物中的表现也不一致(图1), 例如, 植物叶片C含量, 猫头刺、驼绒藜和白刺生长季内基本保持不变, 霸王、红砂表现为先降低后升高的趋势; 而植物叶片N含量, 白刺、红砂逐渐下降, 霸王、驼绒藜和猫头刺表现为先降低后升高的规律。植物叶片N:P, 红砂则5-7月明显增加, 8月降低, 8-10月变化不大, 霸王、白刺、驼绒藜、猫头刺4种植物则为先升高后降低再升高的趋势。这一现象可能和各物种生殖阶段出现的早晚有关, 霸王、白刺和猫头刺3种植物5-6月份已经是花果期, 所以其叶片N、P含量5-6月明显降低。另外, 植物叶片的发育阶段也可能影响叶片的N、P含量, 植物叶片发育初期(5月份), 叶片较小, 但叶片细胞处于快速分裂阶段, 需要大量的蛋白质和核酸的支持, 因此叶片N、P浓度较高; 生长旺季, 叶片生长迅速, 叶片细胞快速伸长扩大, 而植物根系对营养元素的吸收赶不上叶片细胞膨胀的速率, 使得叶片N、P元素浓度逐渐被稀释; 当叶片不再生长后, 植物叶片N、P含量又会略有增加, 用以提高植物的代谢强度, 同时, 一些植物还会对N、P元素进行奢侈吸收; 而到生长末期, 叶片衰老, 致使N、P元素出现回吸收现象, 其含量再次降低(吴统贵等, 2010; 刘超等, 2012)。Santa Regina等(1997)和Agren (2008)也报道了植物叶片C:N和C:P随生长季推移逐渐升高的现象, 并且解释主要是由于植物叶片的快速生长对N、P浓度的稀释作用引起。本研究中, 并非所有植物的叶片N、P含量的季节变化符合上述规律, 这主要是由于不同季节植物叶片N、P含量受上述因素的综合作用的结果, 而且, 上述因素的综合影响, 在物种的水平上也表现出一定的种间差异。李征等(2012)在研究滨海盐地碱蓬(Suaeda salsa)时发现, 随着植物的生长、成熟、衰老, 其叶片C含量在逐渐升高, N含量在逐渐降低, 而P含量在3个时期都没有显著差异性, 此结果与上述规律也不相一致(吴统贵等, 2010)。另外, 本研究中(图1), 植物叶片C:N和C:P的季节变化趋势与叶片N、P含量的变化规律相反, 植物叶片N:P的季节变化与叶片P含量的变化规律相反, 进一步表明植物叶片N、P含量对叶片C:N和C:P的主导作用, 叶片N:P主要受P含量决定, 此结果与杨阔等(2010)和张文彦等(2010)的报道一致。
He等(2010)对采自中国北方草地174个地方171个植物种429份植物样本叶片性状(包括N、P含量)的变异来源分析显示, 物种不同对总变异的解释率为27%, 环境因素引起的变异占29%, 两者共同作用引起的变异占38%。而本研究中, 植物叶片C、N含量及C:N、C:P、N:P大小主要受植物种类影响, 其次, 为植物种类和采样时间的交互作用, 而植物叶片P含量则主要受采样时间影响, 接下来为植物种类(表3)。与He等(2010)的研究相比, 本研究中由于所有植物样品采集都在同一个地方, 土壤的空间异质性可以不予考虑, 因此, 突出了植物种类对植物叶片C、N含量及C:N、C:P、N:P大小影响的首要地位, 进一步体现了植物种系分化过程中物种对元素吸收利用的特异性。采样时间不同对植物叶片元素特征造成的差异一方面是由于不同物候期植物自生的生物学特征引起, 另外, 各月份温度和降雨的不同也可能是引起差异的主要原因, 尤其在荒漠地区, 土壤有效养分的释放与转移受土壤水分影响较大。本研究中, 植物叶片P含量主要受采样时间影响, 是否和不同季节土壤有效P的供应能力有关, 还有待结合土壤养分状况做进一步研究。
李玉霖等(2010)针对我国北方荒漠及荒漠化地区植物叶片N、P含量及其计量比的研究发现, 7-9月份采集的植物叶片N含量变化范围为6.8-52.1 mg·g-1, 变异系数为31.76%, 植物叶片P含量变化范围为0.13-7.15 mg·g-1, 变异系数为50.57%, 植物叶片N:P变化范围为4.6-52.4, 变异系数为47.50%。本研究中, 综合分析6种植物C、N、P含量及其计量比6项指标在整个生长季节的变异, 植物叶片P含量的变异系数最大, 其次为C:P和N:P的变异系数, 接下来为植物叶片N含量及C:N的变异系数, 植物叶片C含量的变异系数最小, 以上结果中关于叶片N、P含量及N:P变异系数的排序与李玉霖等(2010)的报道结果一致。另外, 本研究中6种植物叶片P含量(变化范围为0.84-3.70 mg·g-1)和N:P (变化范围为12.17- 35.06)均落在李玉霖等(2010)关于植物叶片P含量及N:P的变化范围的报道之内, 不过, 本研究中植物叶片N含量变化范围为21.19-54.23 mg·g-1, 其上限略微大于李玉霖等(2010)的报道结果。此外, 本研究中针对于单个植物种叶片C、N、P含量及其计量比的季节变异分析显示, 叶片C、N含量及C:N的季节变异较小, 6种植物由于季节变异所计算的变异系数变化范围分别为0.60%-10.20%、6.09%-20.50%和5.87%-18.78%, 其余3项指标变异都较大, 6种植物叶片P含量的季节变异所产生的变异系数范围为16.43%-43.43%, 叶片C:P和N:P的变异系数范围分别为8.48%-31.95%和11.86%- 40.73%。以上结果显示, 由于植物叶片采集的时间不同, 植物叶片C、N、P含量及其计量比值将会有很大的差异, 甚至一些植物的叶片P含量及N:P由于季节变异所产生的变异系数都接近于李玉霖等(2010)关于北方荒漠地区214种植物叶片P含量及N:P总变异的报道结果。由此可见, 当比较不同植物叶片C、N、P含量及其计量比值时, 无论是在大尺度还是小尺度上, 一次性采样分析不能真实地反映植物的生态化学计量学特征, 尤其是对于叶片P含量及C:P和N:P, 所以, 全面的、跨越整个生长季的采样更加科学合理。另外, 关于群落水平植物生态化学计量学特征的调查, 进行跨越整个生长季的系统采样分析才比较科学。
生活型(功能型)是生物对外界环境适应的外部表现形式, 同一生活型的生物, 在结构和功能上具有很多的相似性, 反映了对外界环境适应与进化的趋同性(孙儒泳等, 1993)。由于不同功能群植物对生境条件有着不同的适应方式, 其资源利用效率也将存在差异, 该差异可能体现在C、N、P化学计量学特征上(张文彦等, 2010)。本研究所选的6种植物均属灌木生活型, 除沙冬青为常绿植物外, 其他5种植物均为落叶植物, 5种落叶灌木植物叶片C、N、P含量及C:N、C:P、N:P的季节变化规律也存在明显差异(图1; 表2), 由此可见, 即使是同一生活型植物, 其叶片C、N、P含量及其计量比的季节变化规律也存在明显的种间特异性, 体现了物种进化过程中植物种属养分利用策略分异的特征。另外, 结果还表明, 统一采样时间, 即使同一生活型植物, 其叶片C、N、P含量及其计量比也存在明显差异, 所以, 按生活型划分植物类群, 比较其叶片C、N、P生态化学计量特征, 需要关注植物的物候特征或发育阶段。此外, Elser等(2000)认为, 生态系统中消费者体内元素化学计量学特征相对稳定, 而初级生产者体内元素化学计量学特征种内种间具有多变性。本研究中, 植物叶片C:P和N:P在不同季节的大幅度波动也支持上述观点。
致谢
感谢黄贝梅、陈梦蝶、陈鸿洋、张宝林在室内分析与野外采样工作中给予的帮助。
参考文献
The mineral nutrition of wild plants revisited: a re-evaluation of processes and patterns
Stoichiometry and nutrition of plant growth in natural communities
Biological stoichiometry from genes to ecosystems
Leaf nitrogen and phosphorus stoichiometry across 753 terrestrial plant species in China
Stoichiometry and large-scale patterns of leaf carbon and nitrogen in the grassland biomes of China
Taxonomic identity, phylogeny, climate and soil fertility as drivers of leaf traits across Chinese grassland biomes
Plant allometry, stoichiometry and the temperature-dependence of primary productivity
Leaf nitrogen and phosphorus stoichiometry in typical desert and desertified regions, North China
北方典型荒漠及荒漠化地区植物叶片氮磷化学计量特征研究
C, N and P stoichiometric characteristics in leaves of Suaeda salsa during different growth phase in coastal wetlands of China
滨海盐地碱蓬不同生长阶段叶片C、N、P化学计量特征

Suaeda salsa)是滨海湿地典型植被之一, 研究其化学计量特征变化对于了解滨海湿地植被健康状况具有重要意义。该文比较了盐地碱蓬生长期、成熟期和衰退期内叶片C、N、P营养元素的化学计量特征, 并做了相关性分析。结果表明, 叶片C含量在不同生长阶段差异性显著, 生长期最低, 衰退期最高; 叶片N含量在衰退期较生长期和成熟期显著降低; 叶片P含量较为稳定, 在不同生长阶段无显著性差异。C:N、C:P在植物整个生长发育期内呈现逐渐增大的趋势, 而N:P表现出逐渐减小的趋势。相关性分析显示, 在盐地碱蓬3个不同的生长阶段, C:N和C:P与相应的N、P含量呈显著负相关, 随着N、P的变化以对数方程的形式减小; N含量与P含量之间呈显著正相关, 体现了植物体内两营养元素含量需求变化的相对一致性。同时发现, N元素已经成为滨海湿地盐地碱蓬生长发育过程中的主要限制性因子。]]>
Advances research in plant nitrogen, phosphorus and their stoichiometry in terrestrial ecosystems: a review
Nitrogen (N), phosphorus (P) and their stoichiometry play pivotal roles in plant structure and functions, development and ecological strategies in terrestrial ecosystems due to their coupling with each other and their irreplaceability. Plant N and P can be influenced by biotic and abiotic factors, such as individual traits, climate change and human disturbance, and it is those factors that determine the plant community composition and structure that finally affect the ecosystem processes. According to previous studies, there is an allometric relationship between N and P. Relationships between plant N and P depend on the soil nutrient condition and species plasticity in N and P. Understanding the relationships between plant N and P in major ecological gradients can further our knowledge about vegetation restoration, succession, biodiversity, ecosystem trophic structure and biogeochemical cycles. This information could help predict potential changes in terrestrial ecosystems in response to future climate change. We review recent advances in the influencing factors and mechanism of stoichiometry in order to improve understanding of plant responses to global change.
陆地生态系统植被氮磷化学计量研究进展
因化学功能的耦合和元素的不可替代性, 植物对N、P的需求和利用存在严格的比例。植物N、P化学计量在不同功能群、生长地区、生长季、器官之间以及环境梯度下存在明显的变化规律。多数研究从N、P浓度、N:P及N、P间异速指数等角度分析了植物化学计量变化规律, 并探讨其在全球范围内的具体数值。为增进对植物响应全球变化的理解, 该文综述了N、P化学计量的影响因素及其机理的最新研究进展, 并指出未来拟重点研究的方向。
Observations on changes in soil properties in grazed and nongrazed areas of Alxa desert steppe, Inner Mongolia
Global patterns of plant leaf N and P in relation to temperature and latitude
A global data set including 5,087 observations of leaf nitrogen (N) and phosphorus (P) for 1,280 plant species at 452 sites and of associated mean climate indices demonstrates broad biogeographic patterns. In general, leaf N and P decline and the N/P ratio increases toward the equator as average temperature and growing season length increase. These patterns are similar for five dominant plant groups, coniferous trees and four angiosperm groups (grasses, herbs, shrubs, and trees). These results support the hypotheses that (i) leaf N and P increase from the tropics to the cooler and drier midlatitudes because of temperature-related plant physiological stoichiometry and biogeographical gradients in soil substrate age and then plateau or decrease at high latitudes because of cold temperature effects on biogeochemistry and (ii) the N/P ratio increases with mean temperature and toward the equator, because P is a major limiting nutrient in older tropical soils and N is the major limiting nutrient in younger temperate and high-latitude soils.
From tropics to tundra: global convergence in plant functioning
Despite striking differences in climate, soils, and evolutionary history among diverse biomes ranging from tropical and temperate forests to alpine tundra and desert, we found similar interspecific relationships among leaf structure and function and plant growth in all biomes. Our results thus demonstrate convergent evolution and global generality in plant functioning, despite the enormous diversity of plant species and biomes. For 280 plant species from two global data sets, we found that potential carbon gain (photosynthesis) and carbon loss (respiration) increase in similar proportion with decreasing leaf life-span, increasing leaf nitrogen concentration, and increasing leaf surface area-to-mass ratio. Productivity of individual plants and of leaves in vegetation canopies also changes in constant proportion to leaf life-span and surface area-to-mass ratio. These global plant functional relationships have significant implications for global scale modeling of vegetation-atmosphere CO2 exchange.
Seasonal variation in nutrient concentration in leaves and branches of Quercus pyrenaica
Assessing the generality of global leaf trait relationships
The worldwide leaf economics spectrum
Bringing together leaf trait data spanning 2,548 species and 175 sites we describe, for the first time at global scale, a universal spectrum of leaf economics consisting of key chemical, structural and physiological properties. The spectrum runs from quick to slow return on investments of nutrients and dry mass in leaves, and operates largely independently of growth form, plant functional type or biome. Categories along the spectrum would, in general, describe leaf economic variation at the global scale better than plant functional types, because functional types overlap substantially in their leaf traits. Overall, modulation of leaf traits and trait relationships by climate is surprisingly modest, although some striking and significant patterns can be seen. Reliable quantification of the leaf economics spectrum and its interaction with climate will prove valuable for modelling nutrient fluxes and vegetation boundaries under changing land-use and climate.
Seasonal variations of leaf nitrogen and phosphorus stoichiometry of three herbaceous species in Hangzhou Bay coastal wetlands, China
Aims Homeostasis constrains the elemental composition of individual species within narrow bounds no matter the chemical composition of the environment or the resource base. Our objective was to determine the dynamics of leaf stoichiometry during the growth period of plants and the optimum time for stoichiometry study. Methods We monitored leaf N, P stoichiometry of Scirpus mariqueter, Carex scabrifolia and Phragmites australis, the dominant species in Hangzhou Bay coastal wetlands, at different growth stages from May to October 2007. Important findings Leaf N, P stoichiometry of the Scirpus, Carex and Phragmites species showed differences: 7.41–17.12, 7.47–13.15 and 6.03–18.09 mg·g–1 for N, 0.34–2.60, 0.41–1.10 and 0.35–2.04 mg·g–1 for P, and 7.19–30.63, 11.58–16.81 and 8.62–21.86 for N:P ratios, respectively. The arithmetic means for the three species were (11.69 ± 2.66), (10.17 ± 1.53) and (11.56 ± 3.19) mg·g–1 for N, (0.93 ± 0.62), (0.74 ± 0.23) and (0.82 ± 0.53) mg·g–1 for P, and 16.83 ± 8.31, 14.53 ± 3.91 and 16.49 ± 5.51 for N:P, respectively, but there was no sig-nificant difference of N, P stoichiometry (p > 0.05). It showed high N, P concentrations at the early stage of growth because of small biomass and then decreased greatly with leaf expansion during the fast growth period, increased as leaf growth became stable and decreased again with leaf senescence. Leaf N:P was low at the early stage of growth and then increased, decreased strongly at the fast growth period, and became stable after leaf maturation.]]>
杭州湾滨海湿地3种草本植物叶片N、P化学计量学的季节变化
Scirpus mariqueter)、糙叶薹草(Carex scabrifolia)和芦苇(Phragmites australis)叶片N、P生态化学计量特征的季节变化。结果发现, 3种植物叶片N含量范围分别是7.41–17.12、7.47–13.15和6.03–18.09 mg·g–1, 平均值(±标准差)分别为(11.69 ± 2.66)、(10.17 ± 1.53)和(11.56 ± 3.19) mg·g–1; 叶片P范围分别是0.34–2.60、0.41–1.10和0.35–2.04 mg·g–1, 平均值为(0.93 ± 0.62)、(0.74 ± 0.23)和(0.82 ± 0.53) mg·g–1; N:P范围分别是7.19–30.63、11.58–16.81和8.62–21.86, 平均值为16.83 ± 8.31、14.53 ± 3.91和16.49 ± 5.51, 可见不同植物其生态化学计量值范围存在一定差异, 但经方差分析发现3种草本植物间生长季节内N、P元素含量差异并不显著(p > 0.05)。各物种叶片N、P含量均表现出在生长初期显著大于其他生长季节(p < 0.05), 生长旺季(6、7月)随着叶片生物量的持续增加, N、P含量逐渐降低并达到最小值, 随后8–9月叶片不再生长而N、P含量逐渐回升, 在10月叶片衰老时N、P含量再次下降; 叶片N:P则在生长初期较小, 在生长旺季先升高后降低, 随后叶片成熟不再生长时又逐渐增加并趋于稳定。]]>
Canopy leaf N and P stoichiometry in grassland communities of Qinghai-Tibetan Plateau, China
Aims Leaf N and P stoichiometry has been widely studied at the species level in both aquatic and terrestrial ecosystems, however, it lacks research at the community level. Since the ecological stoichiometric characteristics could play important roles in connecting different levels of ecological studies and former studies mainly focused on the individual level, in this study, we try to figure out the pattern of foliar N and P at the community level of grassland ecosystems in Qinghai-Tibetan Plateau. Additionally, we also try to find out the relationships between community level leaf N, P and site climate factors. Methods Leaf samples were collected from 47 research sites in Qinghai-Tibetan Plateau at the end of the grow-ing season yearly from 2006 to 2008. We measured the leaf N concentrations by using an elemental analyzer and the leaf P concentration based on a molybdate/stannous chloride method. Climate data of annual mean tempera-ture and annual mean precipitation (65 national standard stations) between 2006 and 2008 were used to interpolate into gridded data with a resolution of 1 km × 1 km through the tchebycheffian spline function. Important findings Leaf N, P concentrations and N:P ratios at the community level over the southern part of Qinghai-Tibetan Plateau were 23.2 mg·g–1, 1.7 mg·g–1and 13.5, respectively. Significant inter-annual differences were presented in leaf N, P concentrations and N:P ratios. Mean annual temperature was strongly correlated with leaf N, P and N:P ratios. Besides, the correlations between climate factors and leaf N, P, N:P ratios were generally consistent with the previous results found at the global scale. Our results suggest that the high variation in leaf P concentration and its strong correlation with environmental factors reveal that, to some extent, stoichiometric traits at the community level are adaptive to local environmental conditions.]]>
青藏高原草地植物群落冠层叶片氮磷化学计量学分析
–1, 平均为23.2 mg·g–1; P含量变化范围为0.8–2.8 mg·g–1, 平均为1.7 mg·g–1; N:P比值变化范围为6.8–25.6, 平均为13.5。群落叶片N含量与P含量呈显著正相关关系, 叶片的N:P比值与P含量呈显著负相关关系, N:P比值的变化主要由P含量变化决定。另外发现: 群落水平叶片N、P含量及N:P比值存在着显著的年际变化, 叶片的N、P含量及N:P比值与年平均气温之间存在着极显著的相关关系。通过该研究结果推测: P含量较高的变异系数及其与环境因子表现出的显著相关性, 在一定程度上体现了植物群落对当地气候条件的一种适应。]]>
Ecological stoichiometry: a science to explore the complexity of living systems
生态化学计量学: 复杂生命系统奥秘的探索
20世纪以来,生物科学的发展异军突起,成为发展最快的学科,不仅学科分类逐渐细化,而且研究领域也逐渐深入,然而,这种分化和深入也可能会掩盖生物的一些最普遍特征。地球上的生物是否具有统一的、更本质的特征?能否把不同生物学领域和不同层次的知识联系起来?随着对这些问题的不断探索,一门新兴的学科——生态化学计量学,在最近20年悄然兴起。生态化学计量学结合了生物学、化学和物理学等基本原理,是研究生物系统能量平衡和多重化学元素(主要是C、N、P)平衡的科学。这一研究领域使得生物学科不同层次(分子、细胞、有机体、种群、生态系统和全球尺度)的研究理论能够有机地统一起来。目前,生态化学计量学已经广泛应用于种群动态、生物体营养动态、微生物营养、寄主_病原关系、生物共生关系、消费者驱动的养分循环、限制性元素的判断、生态系统比较分析和森林演替与衰退及全球C、N、P生物地球化学循环等研究中,并取得了许多研究成果。该文概述了生态化学计量的概念、历史起源和基本理论,重点介绍了生态化学计量学理论在消费者驱动的养分循环、限制性养分元素判别以及全球C、N、P循环等方面的应用进展,并对生态化学计量学未来的研究方向进行了展望,期望引起国内同行的重视并有助于推动我国在此领域开展相关研究。
The nitrogen: phosphorus stoichiometry of different plant functional groups for dominant species of typical steppes in China
中国典型草原优势植物功能群氮磷化学计量学特征研究
