1State Key Laboratory of Vegetation and Environmental Change, Institute of Botany, Chinese Academy of Sciences, Beijing 1000932College of Resources and Environment, University of Chinese Academy of Sciences, Beijing 1000493Chinese Academy of Meteorological Sciences, , Beijing 100081
Aims A light response curve can reflect a plant’s ability to utilize light, which is also a key tool in determining the relationship between photosynthetic capacity and environmental factors; however the model accuracies concerning the light response curve remain elusive. The objectives of this study were to compare and assess the model accuracies related to a light response curve and the effects of drought. Methods A field rain shelter was used to control the soil water conditions. To obtain photosynthesis parameters from the light response curve and the drought effects, the relevant models (including the rectangular model, non-rectangular hyperbolic model, modified rectangular hyperbolic model, exponential model, quadratic function model, and a newly modified model) were applied to fit the light response curves. The validity of each model was tested by analyzing the differences between the fitted values obtained by the models and the measured values. Important findings The newly modified model has been proved to performing relatively better in accurately describing the light response curve patterns, and credibly obtaining the crucial photosynthetic parameters such as the maximum net photosynthetic rate, light saturation point, light compensation point, and dark respiration rate, especially under high radiation conditions.
Yi-BoLi. Modeling study on photosynthetic-light response curves of a C4 plant, maize. Chinese Journal of Plant Ecology, 2017, 41(12): 1289-1300 https://doi.org/10.17521/cjpe.2017.0158
光合作用是决定植物生长、发育和繁殖的关键环节, 同时也制约着陆地生态系统碳水循环等基本过程(Smith et al., 2000; Beer et al., 2010); C4作物作为至关重要的农作物(如玉米(Zea mays)、甘蔗(Saccharum officinarum)等), 主要分布在非洲南部、澳大利亚北部、亚洲东部和南部以及美洲大部分地区(Edwards et al., 2010), 由于C4植物中具有CO2浓缩机制从而限制了光呼吸并提高羧化效率, 使得C4植物能够在低浓度CO2下维持较高的光合速率; 另一方面, CO2在叶片细胞间隙的供应速率与通过气孔的水分蒸腾密切相关。较高的固碳能力和气孔调节能力, 使具有C4光合作用途径的植物具有较高的水分利用效率(Raschke, 1975; Taylor et al., 2014); 与C3物种相比, C4植物在强光、高温和干旱条件下具有明显的竞争优势(Moore, 1994; Ward et al., 1999)。在未来气候变化情景下, 干旱发生的频率、时期和严重性将持续增加, 严重影响到农业生产和食品安全(Stratonovitch & Semenov, 2015), 并且CO2的施肥效应对C4植物不明显, 干旱对玉米(Zea mays)的影响更加显著(Lobell et al., 2011)。所以分析干旱条件下玉米的光响应曲线对于深入理解C4植物光合的特性及其环境影响, 提高对玉米干旱发生的认知及识别, 乃至对保障中国粮食安全都具有重要作用。
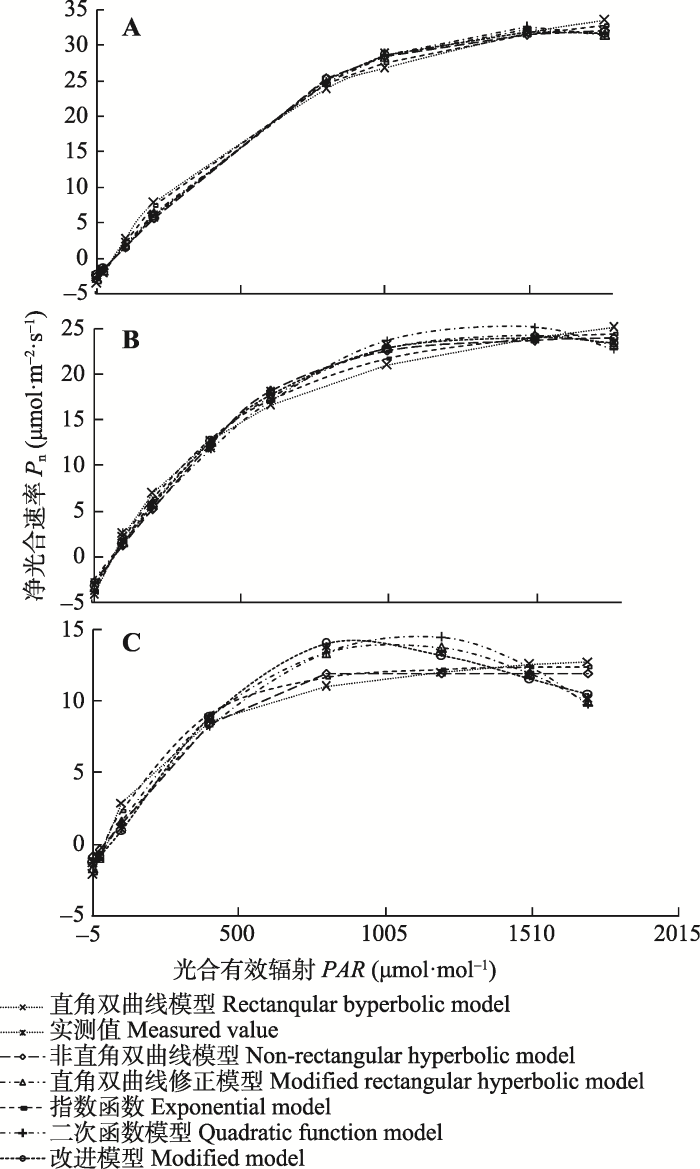
Fig. 1 Comparison of measured and fitted values by six light response curves for maize under different drought treatment. A, Light response curves under control treatment. B, Light responses curves under continuous 12 days drought treatment. C, Light responses curves under continuous 26 days drought treatment.
Table 1
表1
表1 玉米拔节期至抽雄期6个光响应模型模拟的光合生理参数与实测值的比较
Table 1 Comparison between the fitted photosynthesis parameters by the models and the measured values
处理 Treatment
模型 Model
初始量子效率 α (μmol·μmol-1 )
最大净光合速率 Pnmax (μmol·m-2·s-1)
光饱和点 LSP (μmol·m-2·s-1)
光补偿点 LCP (μmol·m-2·s-1)
暗呼吸速率 Rd (μmol·m-2·s-1)
拔节期至抽雄期正常处理 control treatment between jointing stage and tasseling stage
直角双曲线模型 Rectangular hyperbolic model
0.072
52.08
1 287.62
52.73
3.55
非直角双曲线模型 Non-rectangular hyperbolic model
0.041
36.17
912.31
58.26
2.37
直角双曲线修正模型 Modified rectangular hyperbolic model
0.049
32.22
1 536.90
57.42
2.76
指数模型 Exponential model
0.057
34.74
161.57
56.43
2.62
二次函数模型 Quadratic function model
0.047
32.56
1 512.69
57.23
2.61
改进模型 Modified model
0.043
31.88
1 596.85
58.80
2.23
实测值 Measured value
-
31.78
1 775.00
56.05
2.51
拔节期至抽雄期干旱12天处理 continuous 12 days drought treatment between jointing stage and tasseling stage
直角双曲线模型 Rectangular hyperbolic model
0.078
37.05
886.63
59.43
4.14
非直角双曲线模型 Non-rectangular hyperbolic model
0.040
27.42
674.09
64.88
2.68
直角双曲线修正模型 Modified rectangular hyperbolic model
0.053
24.41
1 390.46
66.07
3.35
指数模型 Exponential model
0.055
25.07
117.81
21.66
1.15
二次函数模型 Quadratic function model
0.042
25.60
1 340.60
59.19
2.42
改进模型 Modified model
0.047
24.08
1 398.59
67.91
2.88
实测值 Measured value
-
23.94
1 500.00
68.83
3.12
拔节期至抽雄期干旱26天处理 continuous 26 days drought treatment between jointing stage and tasseling stage
直角双曲线模型 Rectangular hyperbolic model
0.073
17.00
740.68
33.52
2.13
非直角双曲线模型 Non-rectangular hyperbolic model
0.023
12.84
572.64
36.57
0.85
直角双曲线修正模型 Modified rectangular hyperbolic model
0.036
14.04
1 033.40
47.55
1.65
指数模型 Exponential model
0.046
12.43
58.52
41.03
1.16
二次函数模型 Quadratic function model
0.029
14.61
1 094.81
46.37
1.32
改进模型 Modified model
0.022
14.18
889.19
56.63
1.33
实测值 Measured value
-
13.90
800.00
55.27
1.37
Maximum Pn is taken as Pnmax. Rd is the measured Pn when PAR = LCP is the visual value obtained by the interaction point between light response curve and x-axis. LSP is known when the curve is in stable state, the PAR corresponding maximum value of Pn is LSP. Italic numbers are measured value or estimated value. α, intrinsic quantum yield; Pn, net photosynthetic rates; PAR, photosynthetically active radiation; LCP, light compensation point; LSP, light saturation point; Rd, rate of dark respiration; Pnmax, the maximum net photosynthetic rates.取测量净光合速率最大值作为最大净光合速率实测值; 暗呼吸速率为光强等于0时的实测值; 光补偿点根据测量曲线与x交点的目测值; 以达到平稳状态时的光强作为光饱和点, 最大净光合速率对应的光合有效辐射值为光饱和点。斜体表示实测值或估测值。
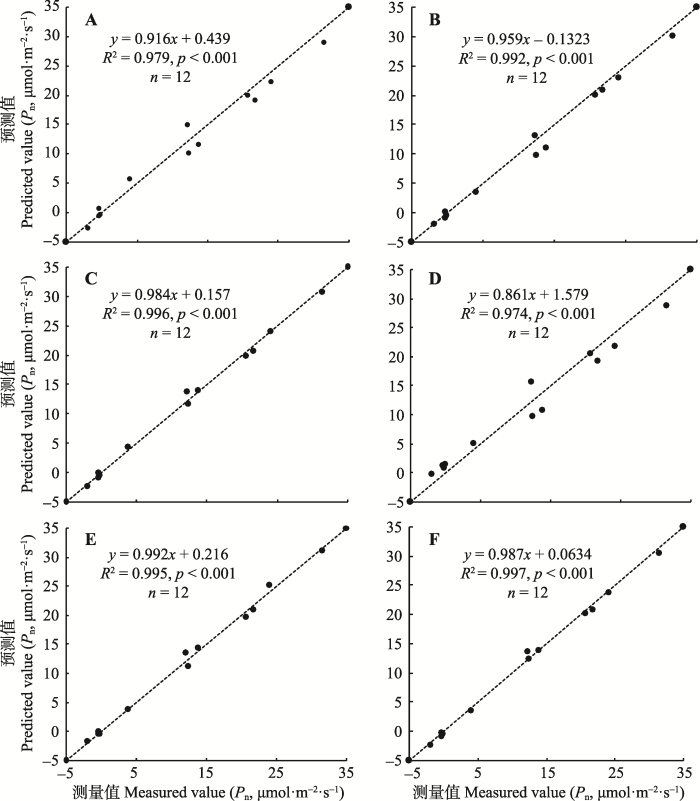
Fig. 2 Linear regression for measured values and predicted values, the dashed line is the 1:1 line. A, B, C, D, E and F represent rectangular hyperbolic, non-rectangular hyperbolic model, modified rectangular hyperbolic model, exponential model, quadratic function model and modified model, respectively. All of these slopes are not significantly different from 1, and all of these intercepts are not significantly different from 0.
Abstract Terrestrial gross primary production (GPP) is the largest global CO(2) flux driving several ecosystem functions. We provide an observation-based estimate of this flux at 123 +/- 8 petagrams of carbon per year (Pg C year(-1)) using eddy covariance flux data and various diagnostic models. Tropical forests and savannahs account for 60%. GPP over 40% of the vegetated land is associated with precipitation. State-of-the-art process-oriented biosphere models used for climate predictions exhibit a large between-model variation of GPP's latitudinal patterns and show higher spatial correlations between GPP and precipitation, suggesting the existence of missing processes or feedback mechanisms which attenuate the vegetation response to climate. Our estimates of spatially distributed GPP and its covariation with climate can help improve coupled climate-carbon cycle process models.
In leaves of C(3) plants, the rate of nonphotorespiratory respiration appears to be higher in darkness than in the light. This change from a high to a low rate of carbon loss with increasing photon flux density leads to an increase in the apparent quantum yield of photosynthetic CO(2) assimilation at low photon flux densities (Kok effect). The mechanism of this suppression of nonphotorespiratory respiration is not understood, but biochemical evidence and the observation that a Kok effect is often not observed under low O(2), has led to the suggestion that photorespiration might be involved in some way. This hypothesis was tested with snowgum (Eucalyptus pauciflora Sieb. ex Spreng.) using gas exchange methods. The test was based on the assumption that if photorespiration were involved, then it would be expected that the intercellular partial pressure of CO(2) would also have an influence on the Kok effect. Under normal atmospheric levels of CO(2) and O(2), a Kok effect was found. Changing the intercellular partial pressure of CO(2), however, did not affect the estimate of nonphotorespiratory respiraton, and it was concluded that its decrease with increasing photon flux density did not involve photorespiration. Concurrent measurements showed that the quantum yield of net assimilation of CO(2) increased with increasing intercellular partial pressure of CO(2), and this increase agreed closely with predictions based on recent models of photosynthesis.
[21]
KumarDP, MurthySD (2007).
Photoinhibition induced alterations in energy transfer process in phycobilisomes of PSII in the cyanobacterium, Spirulina platensis
. Journal of Biochemistry and Molecular Biology, 40, 644-648.
Exposure of algae or plants to irradiance from above the light saturation point of photosynthesis is known as high light stress. This high light stress induces various responses including photoinhibition of the photosynthetic apparatus. The degree of photoinhibition could be clearly determined by measuring the parameters such as absorption and fluorescence of chromoproteins. In cyanobacteria and red algae, most of the photosystem (PS) II associated light harvesting is performed by a membrane attached complex called the phycobilisome (PBS). The effects of high intensity light (1000-4000 micromol photons m(-2) s(-1)) on excitation energy transfer from PBSs to PS II in a cyanobacterium Spirulina platensis were studied by measuring room temperature PC fluorescence emission spectra. High light (3000 micromol photons m(-2) s(-1)) stress had a significant effect on PC fluorescence emission spectra. On the other hand, light stress induced an increase in the ratio of PC fluorescence intensity of PBS indicating that light stress inhibits excitation energy transfer from PBS to PS II. The high light treatment to 3000 micromol photons m(-2) s(-1) caused disappearance of 31.5 kDa linker polypeptide which is known to link PC discs together. In addition we observed the similar decrease in the other polypeptide contents. Our data concludes that the Spirulina cells upon light treatment causes alterations in the phycobiliproteins (PBPs) and affects the energy transfer process within the PBSs.
Light response of photosynthesis and its simulation in leaves of Prunus sibirica L. under different soil water conditions
. Acta Ecologica Sinica, 31, 4499-4509.(in Chinese with English abstract) [郎莹, 张光灿, 张征坤, 刘顺生, 刘德虎, 胡小兰 (2011).
不同土壤水分下山杏光合作用光响应过程及其模拟
. 生态学报, 31, 4499-4509.]
[23]
LarcherW (1997). (Translated by Zhai ZX (翟志席), Guo YH (郭玉海), Ma YZ (马永泽)).
Plant Eco-physiology (植物生态生理学)
, China Agricultural University Press, Beijing. (in Chinese)
[24]
LarocqueGR (2002).
Coupling a detailed photosynthetic model with foliage distribution and light attenuation functions to compute daily gross photosynthesis in sugar maple ( Acer saccharum Marsh.) stands
Canopy multilayer models for forest stands to scale from leaf to canopy have generally focused on developing relatively detailed photosynthetic active radiation (PAR) characterization functions within canopies, but with much simplified photosynthetic production functions. This study aimed at developing a multilayer model based on detailed foliage distribution, PAR interception and photosynthesis components. Allometric, physiological and meteorological data collected in two sugar maple ( Acer saccharum Marsh.) stands that differed in climatic conditions, stand structure and fertility were used to calibrate the model. In the leaf photosynthesis model, photosynthetic rate is limited by the ribulose-bisphosphate (RUBP) concentration or the activity of RUBP carboxylase/oxygenase. The Rubisco potential capacity for CO 2 fixation, V cmax, and the potential electron transport rate, J, were related to temperature and leaf nitrogen and soluble and insoluble protein contents. The Weibull distribution function was used to represent leaf area and biomass distribution within the canopy. PAR was computed in different layers of the canopy using a radiative transfer approach. There was fairly good agreement between measured and predicted photosynthetic rate at the individual leaf level, which indicated that the leaf photosynthesis model accounted for variation in PAR, temperature and foliage nitrogen content. The pattern of foliage nitrogen variation at different levels of the canopy was similar for both sites. However, foliage area and biomass distribution functions were characterized by different patterns between both sites. Simulations showed that differences in canopy properties represented by the site-specific functions were essential to obtain good agreement between predicted and measured PAR below the canopy, as both stands had relatively close values in leaf area index (LAI) and leaf biomass. Sensitivity analysis indicated that the coupled multilayer model derived accounted for relatively small variation in LAI and foliage nitrogen concentration.
Abstract While increasing temperatures and altered soil moisture arising from climate change in the next 50 years are projected to decrease yield of food crops, elevated CO2 concentration ([CO2]) is predicted to enhance yield and offset these detrimental factors. However, C4 photosynthesis is usually saturated at current [CO2] and theoretically should not be stimulated under elevated [CO2]. Nevertheless, some controlled environment studies have reported direct stimulation of C4 photosynthesis and productivity, as well as physiological acclimation, under elevated [CO2]. To test if these effects occur in the open air and within the Corn Belt, maize (Zea mays) was grown in ambient [CO2] (376 micromol mol(-1)) and elevated [CO2] (550 micromol mol(-1)) using Free-Air Concentration Enrichment technology. The 2004 season had ideal growing conditions in which the crop did not experience water stress. In the absence of water stress, growth at elevated [CO2] did not stimulate photosynthesis, biomass, or yield. Nor was there any CO2 effect on the activity of key photosynthetic enzymes, or metabolic markers of carbon and nitrogen status. Stomatal conductance was lower (-34%) and soil moisture was higher (up to 31%), consistent with reduced crop water use. The results provide unique field evidence that photosynthesis and production of maize may be unaffected by rising [CO2] in the absence of drought. This suggests that rising [CO2] may not provide the full dividend to North American maize production anticipated in projections of future global food supply.
[26]
LiL, ZhangXX, ZhengR, GuoJQ (2016).
Photosynthetic characteristics and photosynthesis-light response curve models of summer maize
.Chinese Journal of Plant Ecology, 40, 1310-1318.(in Chinese with English abstract) [李力, 张祥星, 郑睿, 郭建青 (2016).
Efforts to anticipate how climate change will affect future food availability can benefit from understanding the impacts of changes to date. We found that in the cropping regions and growing seasons of most countries, with the important exception of the United States, temperature trends from 1980 to 2008 exceeded one standard deviation of historic year-to-year variability. Models that link yields of the four largest commodity crops to weather indicate that global maize and wheat production declined by 3.8 and 5.5%, respectively, relative to a counterfactual without climate trends. For soybeans and rice, winners and losers largely balanced out. Climate trends were large enough in some countries to offset a significant portion of the increases in average yields that arose from technology, carbon dioxide fertilization, and other factors.
Chlamydocin is a powerful in vitro antitumoral agent, quickly inactivated in vivo. A series of cyclic tetrapeptides related to chlamydocin or HC toxin and bearing a bioactive alkylating group on an epsilon-amino-lysyl function have been examined for their antitumoral activity on L1210 and P388 murine leukemia cell lines. One analog was found to be potent at inhibiting L1210 cell proliferation and had a higher therapeutic index than the reference compound bis-beta-chloroethylnitrosourea on the in vivo P388-induced leukemia model.
[33]
LuoFY, ChenWY, ChenZY (2013).
Applicability of modified exponential model in photosynthetic-CO2 response curve of barley
.Chinese Journal of Plant Ecology, 37, 650-655.(in Chinese with English abstract) [罗辅燕, 陈卫英, 陈真勇 (2013).
Variations in nitrogen use efficiency reflect the biochemical subtype while variations in water use efficiency reflect the evolutionary lineage of C4 grasses at interglacial CO2
Photosynthetic capacity on area (P Nmaxa ) and mass bases (P Nmaxm ) and specific leaf mass (SLM) were determined in twenty adult woody species of Cerrado under field conditions. The mean values obtained for P Nmaxa [11.4 mol(CO2) m-2 s-1], P Nmaxm [78 mol(CO2) kg-1 s-1] and SLM (150 g m-2) were compared with mean values found for deciduous and evergreen sclerophyllous species growing also under field conditions. P Nmaxm and SLM were statistically different among deciduous, Cerrado and evergreen sclerophyllous species. There was a gradual decrease of P Nmaxm and an increase of SLM from deciduous to evergreen sclerophyllous species. Woody species of Cerrado showed mean values of P Nmaxm and SLM between deciduous and evergreen species indicating its brevideciduousness. The comparison using mean values of P Nmaxm and SLM belonging to deciduous, Cerrado and evergreen sclerophyllous species was suitable to confirm the interdependence among leaf life span, structure and physiological attributes of leaf.
[38]
PrioulJL, ChartierP (1977).
Partitioning of transfer and carboxylation components of intracellular resistance to photosynthetic CO2 fixation: A critical analysis of the methods used
The partitioning of intracellular resistance to CO60 transfer in two components: mesophyll (rm ) and carboxylation (rx) resistances, is based upon the combination of two sub-models: one encompassing transfer processes and the second, the carboxylation system. All the determinations derived from this method yield a high rm/rx ratio. It is demonstrated in low oxygen conditions, whatever the model used, that this conclusion is highly-dependent upon the form of the equation used at the carboxylation level. The possible influence of O60 concentration on the rm/rx ratio is discussed. Starting from a Rabinowitch model (rectangular hyperbola), some of the conditions necessary to yield lower rm/rx ratio are considered. It is shown that the most relevant factor when modelling the Calvin cycle is the number of limiting pools (enzymes or cofactors) rather than the number of limiting reactions.
Abstract Arid ecosystems, which occupy about 20% of the earth's terrestrial surface area, have been predicted to be one of the most responsive ecosystem types to elevated atmospheric CO2 and associated global climate change. Here we show, using free-air CO2 enrichment (FACE) technology in an intact Mojave Desert ecosystem, that new shoot production of a dominant perennial shrub is doubled by a 50% increase in atmospheric CO2 concentration in a high rainfall year. However, elevated CO2 does not enhance production in a drought year. We also found that above-ground production and seed rain of an invasive annual grass increases more at elevated CO2 than in several species of native annuals. Consequently, elevated CO2 might enhance the long-term success and dominance of exotic annual grasses in the region. This shift in species composition in favour of exotic annual grasses, driven by global change, has the potential to accelerate the fire cycle, reduce biodiversity and alter ecosystem function in the deserts of western North America.
[43]
StratonovitchP, SemenovMA (2015).
Heat tolerance around flowering in wheat identified as a key trait for increased yield potential in Europe under climate change
Global climate change is expected to shift regional rainfall patterns, influencing species distributions where they depend on water availability. Comparative studies have demonstrated that C4 grasses inhabit drier habitats than C3 relatives, but that both C3 and C4 photosynthesis are susceptible to drought. However, C4 plants may show advantages in hydraulic performance in dry environments. We investigated the effects of seasonal variation in water availability on leaf physiology, using a common garden experiment in the Eastern Cape of South Africa to compare 12 locally occurring grass species from C4 and C3 sister lineages. Photosynthesis was always higher in the C4 than C3 grasses across every month, but the difference was not statistically significant during the wettest months. Surprisingly, stomatal conductance was typically lower in the C3 than C4 grasses, with the peak monthly average for C3 species being similar to that of C4 leaves. In water-limited, rain-fed plots, the photosynthesis of C4 leaves was between 2.0 and 7.4 μmol m612 s611 higher, stomatal conductance almost double, and transpiration 60% higher than for C3 plants. Although C4 average instantaneous water-use efficiencies were higher (2.4–8.1 mmol mol611) than C3 averages (0.7–6.8 mmol mol611), differences were not as great as we expected and were statistically significant only as drought became established. Photosynthesis declined earlier during drought among C3 than C4 species, coincident with decreases in stomatal conductance and transpiration. Eventual decreases in photosynthesis among C4 plants were linked with declining midday leaf water potentials. However, during the same phase of drought, C3 species showed significant decreases in hydrodynamic gradients that suggested hydraulic failure. Thus, our results indicate that stomatal and hydraulic behaviour during drought enhances the differences in photosynthesis between C4 and C3 species. We suggest that these drought responses are important for understanding the advantages of C4 photosynthesis under field conditions.
Summary Interactive effects of CO 2 and water availability have been predicted to alter the competitive relationships between C3 and C4 species over geological and contemporary time scales. We tested the effects of drought and CO 2 partial pressures ( p CO 2 ) ranging from values of the Pleistocene to those predicted for the future on the physiology and growth of model C3 and C4 species. We grew co-occurring Abutilon theophrasti (C3) and Amaranthus retroflexus (C4) in monoculture at 18 (Pleistocene), 27 (preindustrial), 35 (current), and 70 (future) Pa CO 2 under conditions of high light and nutrient availability. After 27days of growth, water was withheld from randomly chosen plants of each species until visible wilting occurred. Under well-watered conditions, low p CO 2 that occurred during the Pleistocene was highly limiting to C3 photosynthesis and growth, and C3 plants showed increased photosynthesis and growth with increasing p CO 2 between the Pleistocene and future CO 2 values. Well-watered C4 plants exhibited increased photosynthesis in response to increasing p CO 2 , but total mass and leaf area were unaffected by p CO 2 . In response to drought, C3 plants dropped a large amount of leaf area and maintained relatively high leaf water potential in remaining leaves, whereas C4 plants retained greater leaf area, but at a lower leaf water potential. Furthermore, drought-treated C3 plants grown at 18Pa CO 2 retained relatively greater leaf area than C3 plants grown at higher p CO 2 and exhibited a delay in the reduction of stomatal conductance that may have occurred in response to severe carbon limitations. The C4 plants grown at 70Pa CO 2 showed lower relative reductions in net photosynthesis by the end of the drought compared to plants at lower p CO 2 , indicating that CO 2 enrichment may alleviate drought effects in C4 plants. At the Pleistocene p CO 2 , C3 and C4 plants showed similar relative recovery from drought for leaf area and biomass production, whereas C4 plants showed higher recovery than C3 plants at current and elevated p CO 2 . Based on these model systems, we conclude that C3 species may not have been at a disadvantage relative to C4 species in response to low CO 2 and severe drought during the Pleistocene. Furthermore, C4 species may have an advantage over C3 species in response to increasing atmospheric CO 2 and more frequent and severe droughts.
[49]
WhiteAJ, CritchleyC (1999).
Rapid light curves: A new fluorescence method to assess the state of the photosynthetic apparatus
Effects of elevated CO2, warming and precipitation change on plant growth, photosynthesis and peroxidation in dominant species from North China grassland
用美国Li-Cor公司生产的Li-6400光合作用测定仪控制CO2浓度和温度,测量了华北平原冬小麦(Triticum aestivum)的光响应数据.分别用C3植物光响应新模型、直角双曲线模型、非直角双曲线模型和Prado-Moraes模型拟合这些实测数据,分析了由直角双曲线模型、非直角双曲线模型和Prado-Moraes模型拟合这些数据得到的最大净光合速率(The maximum net photosynthetic rate)远大于实测值,而光饱和点(Light saturation point)远小于实测值的原因.结果表明,由C3植物光响应新模型拟合的结果与实测数据符合程度最高(R2=0.999 4和R2=0.998 7);表观量子效率(Apparent quantum yield)不是一个理想的表示植物利用光能的指标,建议用植物光响应曲线在光补偿点处的量子效率作为表示植物光能利用的指标.
[61]
YeZP, YuQ, KangHJ (2012).
Evaluation of photosynthetic electron flow using simultaneous measurements of gas exchange and chlorophyll fluorescence under photorespiratory conditions
The quantitative simulation of gross primary production (GPP) at various spatial and temporal scales has been a major challenge in quantifying the global carbon cycle. We developed a light use efficiency (LUE) daily GPP model from eddy covariance (EC) measurements. The model, called EC-LUE, is driven by only four variables: normalized difference vegetation index (NDVI), photosynthetically active radiation (PAR), air temperature, and the Bowen ratio of sensible to latent heat flux (used to calculate moisture stress). The EC-LUE model relies on two assumptions: First, that the fraction of absorbed PAR (fPAR) is a linear function of NDVI; Second, that the realized light use efficiency, calculated from a biome-independent invariant potential LUE, is controlled by air temperature or soil moisture, whichever is most limiting. The EC-LUE model was calibrated and validated using 24,349 daily GPP estimates derived from 28 eddy covariance flux towers from the AmeriFlux and EuroFlux networks, covering a variety of forests, grasslands and savannas. The model explained 85% and 77% of the observed variations of daily GPP for all the calibration and validation sites, respectively. A comparison with GPP calculated from the Moderate Resolution Imaging Spectroradiometer (MODIS) indicated that the EC-LUE model predicted GPP that better matched tower data across these sites. The realized LUE was predominantly controlled by moisture conditions throughout the growing season, and controlled by temperature only at the beginning and end of the growing season. The EC-LUE model is an alternative approach that makes it possible to map daily GPP over large areas because (1) the potential LUE is invariant across various land cover types and (2) all driving forces of the model can be derived from remote sensing data or existing climate observation networks.
[64]
ZhangLY, WenGS, WangSJ, LiuZL (2011).
Four light-response models to estimate photosynthesis of
Phyllostachys pubescens. Journal of Zhejiang A & F University, 28(2), 188-193.(in Chinese with English abstract) [张利阳, 温国胜, 王圣杰, 刘兆玲 (2011).
The slow reversibility of photosystem II thermal energy dissipation on transfer from high to low light may cause large losses in carbon gain by crop canopies: A theoretical analysis
Coupling a detailed photosynthetic model with foliage distribution and light attenuation functions to compute daily gross photosynthesis in sugar maple ( Acer saccharum Marsh.) stands
1
2002
... 叶片光合作用对光的响应曲线及其模拟是研究植物光合作用与环境变化相互作用的重要手段(叶子飘, 2007; 李力等, 2016), 也是有效模拟冠层光合作用、陆地生态系统过程进而预测植被生产力的关键方法(Yuan et al., 2007; Pinto et al., 2016; Yao et al., 2017).光曲线模型是模拟光合作用对环境因子响应的重要方法, 通过分析光合有效辐射与净光合速率的关系, 可得出表观量子效率(AQE)、光补偿点(LCP)、最大净光合速率(Pnmax)、光饱和点(LSP)和暗呼吸速率(Rd)等若干重要光合生理参数(Larocque, 2002), 这些参数有助于了解植物光合作用中光化学效率(Sharp et al., 1984), 也能够指示植物的生长情况及抗逆性大小(许大全, 2002).因此, 确定植物光响应曲线对于研究植物的光合特性具有重要意义.不同环境条件下最适模型的确定是定量研究植物对环境的适应性以及气体交换参数的基础(叶子飘和于强, 2008; 张利阳等, 2011).目前, 常用的光响应曲线模型主要有: 直角双曲线模型(Baly, 1935; Kirschbaum & Farquhar, 1987)、非直角双曲线模型(Prioul & Chartier, 1977)、直角双曲线修正模型(Ye, 2007; Ye et al., 2012)、指数方程(Bassman & Zwier, 1991; Prado & Moraes, 1997)、二次函数(段爱国等, 2010)等.其中, 非直角双曲线模型的使用频率最高(王圣杰等, 2011), 但拟合的最大净光合速率值偏高, 限制了模型的应用(叶子飘, 2010; 王荣荣等, 2013); 直角双曲线修正模型由于能够模拟光抑制的情况, 近年来被广泛应用(Ye, 2007; 李力等, 2016), 但未进行模型的检验, 模型的准确性有待进一步确定(罗辅燕等, 2013).这些模型对同一植物拟合所得的光合参数也有不同(吴爱姣等, 2015), 如何正确地模拟光响应曲线是准确获取相关参数的关键(闫小红等, 2013; Friedlingstein et al., 2014). ...
Photosynthesis, productivity, and yield of maize are not affected by open-air elevation of CO2 concentration in the absence of drought
2
2006
... 在全球变化条件下, C4植物虽然能够利用低浓度的CO2, 在强光、高温和干旱条件下具有明显的竞争优势(Moore, 1994; Ward et al., 1999; Leakey et al., 2006; Xu et al., 2014), 但在CO2浓度升高, 且水分条件较好时, 其CO2的施肥效应不明显; 然而, 在水分亏缺条件下, 由于CO2浓度升高导致了气孔导度降低, 从而提高了水分利用率, 这使得在未来全球变化条件下, C4植物对干旱的适应性更强, 值得进行深入探讨(Leakey et al., 2006; Lobell et al., 2011).阐明干旱对C4植物玉米光合生理生态特性的影响, 对指导制定玉米生产应对气候变化的适应管理策略, 乃至保障粮食安全都具有重要意义. ...
... 植物对干旱的适应性更强, 值得进行深入探讨(Leakey et al., 2006; Lobell et al., 2011).阐明干旱对C4植物玉米光合生理生态特性的影响, 对指导制定玉米生产应对气候变化的适应管理策略, 乃至保障粮食安全都具有重要意义. ...
夏玉米光合特性及光响应曲线拟合
3
2016
... 叶片光合作用对光的响应曲线及其模拟是研究植物光合作用与环境变化相互作用的重要手段(叶子飘, 2007; 李力等, 2016), 也是有效模拟冠层光合作用、陆地生态系统过程进而预测植被生产力的关键方法(Yuan et al., 2007; Pinto et al., 2016; Yao et al., 2017).光曲线模型是模拟光合作用对环境因子响应的重要方法, 通过分析光合有效辐射与净光合速率的关系, 可得出表观量子效率(AQE)、光补偿点(LCP)、最大净光合速率(Pnmax)、光饱和点(LSP)和暗呼吸速率(Rd)等若干重要光合生理参数(Larocque, 2002), 这些参数有助于了解植物光合作用中光化学效率(Sharp et al., 1984), 也能够指示植物的生长情况及抗逆性大小(许大全, 2002).因此, 确定植物光响应曲线对于研究植物的光合特性具有重要意义.不同环境条件下最适模型的确定是定量研究植物对环境的适应性以及气体交换参数的基础(叶子飘和于强, 2008; 张利阳等, 2011).目前, 常用的光响应曲线模型主要有: 直角双曲线模型(Baly, 1935; Kirschbaum & Farquhar, 1987)、非直角双曲线模型(Prioul & Chartier, 1977)、直角双曲线修正模型(Ye, 2007; Ye et al., 2012)、指数方程(Bassman & Zwier, 1991; Prado & Moraes, 1997)、二次函数(段爱国等, 2010)等.其中, 非直角双曲线模型的使用频率最高(王圣杰等, 2011), 但拟合的最大净光合速率值偏高, 限制了模型的应用(叶子飘, 2010; 王荣荣等, 2013); 直角双曲线修正模型由于能够模拟光抑制的情况, 近年来被广泛应用(Ye, 2007; 李力等, 2016), 但未进行模型的检验, 模型的准确性有待进一步确定(罗辅燕等, 2013).这些模型对同一植物拟合所得的光合参数也有不同(吴爱姣等, 2015), 如何正确地模拟光响应曲线是准确获取相关参数的关键(闫小红等, 2013; Friedlingstein et al., 2014). ...
... 该试验在辽宁省锦州市生态与农业气象中心(41.13° N, 121.17° E, 海拔27.4 m)进行.该区属温带季风型大陆性气候, 四季分明, 年极端最高气温41.8 ℃, 年极端最低气温-31.3 ℃; 1981-2010年年平均气温9.9 ℃.年降水量为568 mm, 其中60%- 70%的降水集中在夏季.年无霜期144-180天; 土壤为典型棕壤, pH值6.3, 有机质含量1.8%, 0-100 cm土壤容重为1.61 g·cm-3, 田间持水量22.3%, 凋萎湿度6.5%, 主要作物为玉米(于文颖等, 2015; 米娜等, 2017). ...
High hopes for C4 plants
2
1994
... 光合作用是决定植物生长、发育和繁殖的关键环节, 同时也制约着陆地生态系统碳水循环等基本过程(Smith et al., 2000; Beer et al., 2010); C4作物作为至关重要的农作物(如玉米(Zea mays)、甘蔗(Saccharum officinarum)等), 主要分布在非洲南部、澳大利亚北部、亚洲东部和南部以及美洲大部分地区(Edwards et al., 2010), 由于C4植物中具有CO2浓缩机制从而限制了光呼吸并提高羧化效率, 使得C4植物能够在低浓度CO2下维持较高的光合速率; 另一方面, CO2在叶片细胞间隙的供应速率与通过气孔的水分蒸腾密切相关.较高的固碳能力和气孔调节能力, 使具有C4光合作用途径的植物具有较高的水分利用效率(Raschke, 1975; Taylor et al., 2014); 与C3物种相比, C4植物在强光、高温和干旱条件下具有明显的竞争优势(Moore, 1994; Ward et al., 1999).在未来气候变化情景下, 干旱发生的频率、时期和严重性将持续增加, 严重影响到农业生产和食品安全(Stratonovitch & Semenov, 2015), 并且CO2的施肥效应对C4植物不明显, 干旱对玉米(Zea mays)的影响更加显著(Lobell et al., 2011).所以分析干旱条件下玉米的光响应曲线对于深入理解C4植物光合的特性及其环境影响, 提高对玉米干旱发生的认知及识别, 乃至对保障中国粮食安全都具有重要作用. ...
... 在全球变化条件下, C4植物虽然能够利用低浓度的CO2, 在强光、高温和干旱条件下具有明显的竞争优势(Moore, 1994; Ward et al., 1999; Leakey et al., 2006; Xu et al., 2014), 但在CO2浓度升高, 且水分条件较好时, 其CO2的施肥效应不明显; 然而, 在水分亏缺条件下, 由于CO2浓度升高导致了气孔导度降低, 从而提高了水分利用率, 这使得在未来全球变化条件下, C4植物对干旱的适应性更强, 值得进行深入探讨(Leakey et al., 2006; Lobell et al., 2011).阐明干旱对C4植物玉米光合生理生态特性的影响, 对指导制定玉米生产应对气候变化的适应管理策略, 乃至保障粮食安全都具有重要意义. ...
Variations in nitrogen use efficiency reflect the biochemical subtype while variations in water use efficiency reflect the evolutionary lineage of C4 grasses at interglacial CO2
1
2016
... 叶片光合作用对光的响应曲线及其模拟是研究植物光合作用与环境变化相互作用的重要手段(叶子飘, 2007; 李力等, 2016), 也是有效模拟冠层光合作用、陆地生态系统过程进而预测植被生产力的关键方法(Yuan et al., 2007; Pinto et al., 2016; Yao et al., 2017).光曲线模型是模拟光合作用对环境因子响应的重要方法, 通过分析光合有效辐射与净光合速率的关系, 可得出表观量子效率(AQE)、光补偿点(LCP)、最大净光合速率(Pnmax)、光饱和点(LSP)和暗呼吸速率(Rd)等若干重要光合生理参数(Larocque, 2002), 这些参数有助于了解植物光合作用中光化学效率(Sharp et al., 1984), 也能够指示植物的生长情况及抗逆性大小(许大全, 2002).因此, 确定植物光响应曲线对于研究植物的光合特性具有重要意义.不同环境条件下最适模型的确定是定量研究植物对环境的适应性以及气体交换参数的基础(叶子飘和于强, 2008; 张利阳等, 2011).目前, 常用的光响应曲线模型主要有: 直角双曲线模型(Baly, 1935; Kirschbaum & Farquhar, 1987)、非直角双曲线模型(Prioul & Chartier, 1977)、直角双曲线修正模型(Ye, 2007; Ye et al., 2012)、指数方程(Bassman & Zwier, 1991; Prado & Moraes, 1997)、二次函数(段爱国等, 2010)等.其中, 非直角双曲线模型的使用频率最高(王圣杰等, 2011), 但拟合的最大净光合速率值偏高, 限制了模型的应用(叶子飘, 2010; 王荣荣等, 2013); 直角双曲线修正模型由于能够模拟光抑制的情况, 近年来被广泛应用(Ye, 2007; 李力等, 2016), 但未进行模型的检验, 模型的准确性有待进一步确定(罗辅燕等, 2013).这些模型对同一植物拟合所得的光合参数也有不同(吴爱姣等, 2015), 如何正确地模拟光响应曲线是准确获取相关参数的关键(闫小红等, 2013; Friedlingstein et al., 2014). ...
Photosynthetic capacity and specific leaf mass in twenty woody species of Cerrado vegetation under field conditions
1
1997
... 叶片光合作用对光的响应曲线及其模拟是研究植物光合作用与环境变化相互作用的重要手段(叶子飘, 2007; 李力等, 2016), 也是有效模拟冠层光合作用、陆地生态系统过程进而预测植被生产力的关键方法(Yuan et al., 2007; Pinto et al., 2016; Yao et al., 2017).光曲线模型是模拟光合作用对环境因子响应的重要方法, 通过分析光合有效辐射与净光合速率的关系, 可得出表观量子效率(AQE)、光补偿点(LCP)、最大净光合速率(Pnmax)、光饱和点(LSP)和暗呼吸速率(Rd)等若干重要光合生理参数(Larocque, 2002), 这些参数有助于了解植物光合作用中光化学效率(Sharp et al., 1984), 也能够指示植物的生长情况及抗逆性大小(许大全, 2002).因此, 确定植物光响应曲线对于研究植物的光合特性具有重要意义.不同环境条件下最适模型的确定是定量研究植物对环境的适应性以及气体交换参数的基础(叶子飘和于强, 2008; 张利阳等, 2011).目前, 常用的光响应曲线模型主要有: 直角双曲线模型(Baly, 1935; Kirschbaum & Farquhar, 1987)、非直角双曲线模型(Prioul & Chartier, 1977)、直角双曲线修正模型(Ye, 2007; Ye et al., 2012)、指数方程(Bassman & Zwier, 1991; Prado & Moraes, 1997)、二次函数(段爱国等, 2010)等.其中, 非直角双曲线模型的使用频率最高(王圣杰等, 2011), 但拟合的最大净光合速率值偏高, 限制了模型的应用(叶子飘, 2010; 王荣荣等, 2013); 直角双曲线修正模型由于能够模拟光抑制的情况, 近年来被广泛应用(Ye, 2007; 李力等, 2016), 但未进行模型的检验, 模型的准确性有待进一步确定(罗辅燕等, 2013).这些模型对同一植物拟合所得的光合参数也有不同(吴爱姣等, 2015), 如何正确地模拟光响应曲线是准确获取相关参数的关键(闫小红等, 2013; Friedlingstein et al., 2014). ...
Partitioning of transfer and carboxylation components of intracellular resistance to photosynthetic CO2 fixation: A critical analysis of the methods used
2
1977
... 叶片光合作用对光的响应曲线及其模拟是研究植物光合作用与环境变化相互作用的重要手段(叶子飘, 2007; 李力等, 2016), 也是有效模拟冠层光合作用、陆地生态系统过程进而预测植被生产力的关键方法(Yuan et al., 2007; Pinto et al., 2016; Yao et al., 2017).光曲线模型是模拟光合作用对环境因子响应的重要方法, 通过分析光合有效辐射与净光合速率的关系, 可得出表观量子效率(AQE)、光补偿点(LCP)、最大净光合速率(Pnmax)、光饱和点(LSP)和暗呼吸速率(Rd)等若干重要光合生理参数(Larocque, 2002), 这些参数有助于了解植物光合作用中光化学效率(Sharp et al., 1984), 也能够指示植物的生长情况及抗逆性大小(许大全, 2002).因此, 确定植物光响应曲线对于研究植物的光合特性具有重要意义.不同环境条件下最适模型的确定是定量研究植物对环境的适应性以及气体交换参数的基础(叶子飘和于强, 2008; 张利阳等, 2011).目前, 常用的光响应曲线模型主要有: 直角双曲线模型(Baly, 1935; Kirschbaum & Farquhar, 1987)、非直角双曲线模型(Prioul & Chartier, 1977)、直角双曲线修正模型(Ye, 2007; Ye et al., 2012)、指数方程(Bassman & Zwier, 1991; Prado & Moraes, 1997)、二次函数(段爱国等, 2010)等.其中, 非直角双曲线模型的使用频率最高(王圣杰等, 2011), 但拟合的最大净光合速率值偏高, 限制了模型的应用(叶子飘, 2010; 王荣荣等, 2013); 直角双曲线修正模型由于能够模拟光抑制的情况, 近年来被广泛应用(Ye, 2007; 李力等, 2016), 但未进行模型的检验, 模型的准确性有待进一步确定(罗辅燕等, 2013).这些模型对同一植物拟合所得的光合参数也有不同(吴爱姣等, 2015), 如何正确地模拟光响应曲线是准确获取相关参数的关键(闫小红等, 2013; Friedlingstein et al., 2014). ...
Effects of elevated CO2, warming and precipitation change on plant growth, photosynthesis and peroxidation in dominant species from North China grassland
1
2014
... 在全球变化条件下, C4植物虽然能够利用低浓度的CO2, 在强光、高温和干旱条件下具有明显的竞争优势(Moore, 1994; Ward et al., 1999; Leakey et al., 2006; Xu et al., 2014), 但在CO2浓度升高, 且水分条件较好时, 其CO2的施肥效应不明显; 然而, 在水分亏缺条件下, 由于CO2浓度升高导致了气孔导度降低, 从而提高了水分利用率, 这使得在未来全球变化条件下, C4植物对干旱的适应性更强, 值得进行深入探讨(Leakey et al., 2006; Lobell et al., 2011).阐明干旱对C4植物玉米光合生理生态特性的影响, 对指导制定玉米生产应对气候变化的适应管理策略, 乃至保障粮食安全都具有重要意义. ...
四种水稻品种的光合光响应曲线及其模型拟合
2
2013
... 叶片光合作用对光的响应曲线及其模拟是研究植物光合作用与环境变化相互作用的重要手段(叶子飘, 2007; 李力等, 2016), 也是有效模拟冠层光合作用、陆地生态系统过程进而预测植被生产力的关键方法(Yuan et al., 2007; Pinto et al., 2016; Yao et al., 2017).光曲线模型是模拟光合作用对环境因子响应的重要方法, 通过分析光合有效辐射与净光合速率的关系, 可得出表观量子效率(AQE)、光补偿点(LCP)、最大净光合速率(Pnmax)、光饱和点(LSP)和暗呼吸速率(Rd)等若干重要光合生理参数(Larocque, 2002), 这些参数有助于了解植物光合作用中光化学效率(Sharp et al., 1984), 也能够指示植物的生长情况及抗逆性大小(许大全, 2002).因此, 确定植物光响应曲线对于研究植物的光合特性具有重要意义.不同环境条件下最适模型的确定是定量研究植物对环境的适应性以及气体交换参数的基础(叶子飘和于强, 2008; 张利阳等, 2011).目前, 常用的光响应曲线模型主要有: 直角双曲线模型(Baly, 1935; Kirschbaum & Farquhar, 1987)、非直角双曲线模型(Prioul & Chartier, 1977)、直角双曲线修正模型(Ye, 2007; Ye et al., 2012)、指数方程(Bassman & Zwier, 1991; Prado & Moraes, 1997)、二次函数(段爱国等, 2010)等.其中, 非直角双曲线模型的使用频率最高(王圣杰等, 2011), 但拟合的最大净光合速率值偏高, 限制了模型的应用(叶子飘, 2010; 王荣荣等, 2013); 直角双曲线修正模型由于能够模拟光抑制的情况, 近年来被广泛应用(Ye, 2007; 李力等, 2016), 但未进行模型的检验, 模型的准确性有待进一步确定(罗辅燕等, 2013).这些模型对同一植物拟合所得的光合参数也有不同(吴爱姣等, 2015), 如何正确地模拟光响应曲线是准确获取相关参数的关键(闫小红等, 2013; Friedlingstein et al., 2014). ...
Evaluation of photosynthetic electron flow using simultaneous measurements of gas exchange and chlorophyll fluorescence under photorespiratory conditions
1
2012
... 叶片光合作用对光的响应曲线及其模拟是研究植物光合作用与环境变化相互作用的重要手段(叶子飘, 2007; 李力等, 2016), 也是有效模拟冠层光合作用、陆地生态系统过程进而预测植被生产力的关键方法(Yuan et al., 2007; Pinto et al., 2016; Yao et al., 2017).光曲线模型是模拟光合作用对环境因子响应的重要方法, 通过分析光合有效辐射与净光合速率的关系, 可得出表观量子效率(AQE)、光补偿点(LCP)、最大净光合速率(Pnmax)、光饱和点(LSP)和暗呼吸速率(Rd)等若干重要光合生理参数(Larocque, 2002), 这些参数有助于了解植物光合作用中光化学效率(Sharp et al., 1984), 也能够指示植物的生长情况及抗逆性大小(许大全, 2002).因此, 确定植物光响应曲线对于研究植物的光合特性具有重要意义.不同环境条件下最适模型的确定是定量研究植物对环境的适应性以及气体交换参数的基础(叶子飘和于强, 2008; 张利阳等, 2011).目前, 常用的光响应曲线模型主要有: 直角双曲线模型(Baly, 1935; Kirschbaum & Farquhar, 1987)、非直角双曲线模型(Prioul & Chartier, 1977)、直角双曲线修正模型(Ye, 2007; Ye et al., 2012)、指数方程(Bassman & Zwier, 1991; Prado & Moraes, 1997)、二次函数(段爱国等, 2010)等.其中, 非直角双曲线模型的使用频率最高(王圣杰等, 2011), 但拟合的最大净光合速率值偏高, 限制了模型的应用(叶子飘, 2010; 王荣荣等, 2013); 直角双曲线修正模型由于能够模拟光抑制的情况, 近年来被广泛应用(Ye, 2007; 李力等, 2016), 但未进行模型的检验, 模型的准确性有待进一步确定(罗辅燕等, 2013).这些模型对同一植物拟合所得的光合参数也有不同(吴爱姣等, 2015), 如何正确地模拟光响应曲线是准确获取相关参数的关键(闫小红等, 2013; Friedlingstein et al., 2014). ...
不同生育期玉米叶片光合特性及水分利用效率对水分胁迫的响应
1
2015
... 该试验在辽宁省锦州市生态与农业气象中心(41.13° N, 121.17° E, 海拔27.4 m)进行.该区属温带季风型大陆性气候, 四季分明, 年极端最高气温41.8 ℃, 年极端最低气温-31.3 ℃; 1981-2010年年平均气温9.9 ℃.年降水量为568 mm, 其中60%- 70%的降水集中在夏季.年无霜期144-180天; 土壤为典型棕壤, pH值6.3, 有机质含量1.8%, 0-100 cm土壤容重为1.61 g·cm-3, 田间持水量22.3%, 凋萎湿度6.5%, 主要作物为玉米(于文颖等, 2015; 米娜等, 2017). ...
Deriving a light use efficiency model from eddy covariance flux data for predicting daily gross primary production across biomes
1
2007
... 叶片光合作用对光的响应曲线及其模拟是研究植物光合作用与环境变化相互作用的重要手段(叶子飘, 2007; 李力等, 2016), 也是有效模拟冠层光合作用、陆地生态系统过程进而预测植被生产力的关键方法(Yuan et al., 2007; Pinto et al., 2016; Yao et al., 2017).光曲线模型是模拟光合作用对环境因子响应的重要方法, 通过分析光合有效辐射与净光合速率的关系, 可得出表观量子效率(AQE)、光补偿点(LCP)、最大净光合速率(Pnmax)、光饱和点(LSP)和暗呼吸速率(Rd)等若干重要光合生理参数(Larocque, 2002), 这些参数有助于了解植物光合作用中光化学效率(Sharp et al., 1984), 也能够指示植物的生长情况及抗逆性大小(许大全, 2002).因此, 确定植物光响应曲线对于研究植物的光合特性具有重要意义.不同环境条件下最适模型的确定是定量研究植物对环境的适应性以及气体交换参数的基础(叶子飘和于强, 2008; 张利阳等, 2011).目前, 常用的光响应曲线模型主要有: 直角双曲线模型(Baly, 1935; Kirschbaum & Farquhar, 1987)、非直角双曲线模型(Prioul & Chartier, 1977)、直角双曲线修正模型(Ye, 2007; Ye et al., 2012)、指数方程(Bassman & Zwier, 1991; Prado & Moraes, 1997)、二次函数(段爱国等, 2010)等.其中, 非直角双曲线模型的使用频率最高(王圣杰等, 2011), 但拟合的最大净光合速率值偏高, 限制了模型的应用(叶子飘, 2010; 王荣荣等, 2013); 直角双曲线修正模型由于能够模拟光抑制的情况, 近年来被广泛应用(Ye, 2007; 李力等, 2016), 但未进行模型的检验, 模型的准确性有待进一步确定(罗辅燕等, 2013).这些模型对同一植物拟合所得的光合参数也有不同(吴爱姣等, 2015), 如何正确地模拟光响应曲线是准确获取相关参数的关键(闫小红等, 2013; Friedlingstein et al., 2014). ...
毛竹光响应模型适用性分析
1
2011
... 叶片光合作用对光的响应曲线及其模拟是研究植物光合作用与环境变化相互作用的重要手段(叶子飘, 2007; 李力等, 2016), 也是有效模拟冠层光合作用、陆地生态系统过程进而预测植被生产力的关键方法(Yuan et al., 2007; Pinto et al., 2016; Yao et al., 2017).光曲线模型是模拟光合作用对环境因子响应的重要方法, 通过分析光合有效辐射与净光合速率的关系, 可得出表观量子效率(AQE)、光补偿点(LCP)、最大净光合速率(Pnmax)、光饱和点(LSP)和暗呼吸速率(Rd)等若干重要光合生理参数(Larocque, 2002), 这些参数有助于了解植物光合作用中光化学效率(Sharp et al., 1984), 也能够指示植物的生长情况及抗逆性大小(许大全, 2002).因此, 确定植物光响应曲线对于研究植物的光合特性具有重要意义.不同环境条件下最适模型的确定是定量研究植物对环境的适应性以及气体交换参数的基础(叶子飘和于强, 2008; 张利阳等, 2011).目前, 常用的光响应曲线模型主要有: 直角双曲线模型(Baly, 1935; Kirschbaum & Farquhar, 1987)、非直角双曲线模型(Prioul & Chartier, 1977)、直角双曲线修正模型(Ye, 2007; Ye et al., 2012)、指数方程(Bassman & Zwier, 1991; Prado & Moraes, 1997)、二次函数(段爱国等, 2010)等.其中, 非直角双曲线模型的使用频率最高(王圣杰等, 2011), 但拟合的最大净光合速率值偏高, 限制了模型的应用(叶子飘, 2010; 王荣荣等, 2013); 直角双曲线修正模型由于能够模拟光抑制的情况, 近年来被广泛应用(Ye, 2007; 李力等, 2016), 但未进行模型的检验, 模型的准确性有待进一步确定(罗辅燕等, 2013).这些模型对同一植物拟合所得的光合参数也有不同(吴爱姣等, 2015), 如何正确地模拟光响应曲线是准确获取相关参数的关键(闫小红等, 2013; Friedlingstein et al., 2014). ...
The slow reversibility of photosystem II thermal energy dissipation on transfer from high to low light may cause large losses in carbon gain by crop canopies: A theoretical analysis
 , 周广胜
, 周广胜
