


碳(C)、氮(N)、磷(P)是所有植物的重要组成元素(贺金生和韩兴国, 2010), 对植物个体的生长、发育乃至整个生态系统的结构和功能都起着重要作用(Westheimer, 1987; Elser et al., 2001; Han et al., 2005; 曾德慧和陈广生, 2005)。作为植物生长所必需的大量元素, C、N、P参与植物的各项生理、生化过程, 而且三者之间密切相关(Niklas et al., 2005; Reich et al., 2006; 张珂等, 2014)。C是植物干物质的最主要元素, 约占植物生物量的一半, 对植物生长起决定性作用(王冬梅和杨慧敏, 2011; 张珂等, 2014; 刘万德等, 2015)。而N和P是植物生长所必需的限制性营养元素(Vitousek, 1982; Elser et al., 2010)。其中, N是植物细胞蛋白质、核酸的组成元素, 并参与叶绿体中叶绿素的合成, 因而与植物光合作用的能力紧密相关(Field & Mooney, 1986); P则是植物细胞核酸和酶的重要组成成分, 在细胞分裂增殖和遗传变异等生命活动中起关键性作用(Dawson & Curron, 1998; Lambers et al., 1998)。植物的元素组成会受自身遗传特性、所处的环境(气候、土壤养分)以及生长发育阶段的影响, 因而具有较大的变异性(Aerts & Chapin III, 2000; Reich & Oleksyn, 2004; Han et al., 2005; Kerkhoff et al., 2005; He et al., 2006, 2008)。
作为重要的生理指标, C、N、P三种元素的计量比值具有重要的指示功能。C:N和C:P常被用于表征植物利用单位养分(N、P)同化碳的能力, 即养分利用效率(韩文轩等, 2009; 吴统贵等, 2010a), 而N:P则可以反映植物生长所需养分受外界环境限制的情况。一般认为, 当叶片N:P小于10 (或14)时, 植物生长主要受N限制, N:P大于20 (或16)时则主要受P限制(Aerts & Chapin III, 2000; Elser et al., 2000a; Güsewell et al., 2003; Niklas et al., 2005)。此外, 研究表明, 植物C、N、P及其比值还可以用来反映生态系统整体的固碳能力及养分利用状态(Han et al., 2005; Wieder et al., 2015; 李瑞等, 2018), 以及解释群落内植物种间竞争与共存的关系(Elser et al., 2000b; Hu et al., 2019)。因此, 探索植物体内的C、N、P含量及其比值有助于认识整个生态系统的结构和功能以及资源限制状况。叶片作为植物的重要营养器官, 元素含量易于测定, 成为了近年来生态学研究的热点。
生态化学计量学是生态系统生态学的重要研究内容(Reiners, 1986), 其优势是以生态化学计量特征分析为手段, 通过探索生态系统中能流与多种化学元素(如C、N、P)间的平衡关系, 将生态系统过程在个体、种群、群落和生态系统等层次统一起来(程滨等, 2010)。生态化学计量学最早主要关注海洋生态系统(Redfield, 1958), 对陆地生态系统的研究起步较晚。近十几年来, 关于陆地生态系统的生态化学计量学研究也取得了丰硕的成果(Reich & Oleksyn, 2004; Moe et al., 2005; He et al., 2006, 2008; 任书杰等, 2007, 2012; 韩文轩等, 2009)。在我国, 生态化学计量学发展迅速, 在不同植被类型、不同时空尺度和生态系统的各个层次都取得了很大进展(Han et al., 2005; 高三平等, 2007; He et al., 2008; 刘万德等, 2010; 刘兴诏等, 2010; 李征等, 2012; 牛得草等, 2013; 宁志英等, 2017), 研究内容主要涉及区域尺度植物叶片C、N、P含量的分布格局及其环境驱动因子(Han et al., 2005; He et al., 2006, 2008), 植物群落不同演替阶段的植物营养元素计量分析(高三平等, 2007; 阎恩荣等, 2008; 刘万德等, 2010; 银晓瑞等, 2010; 胡耀升等, 2014; 周正虎和王传宽, 2016), 养分添加对植物养分计量关系的影响(黄菊莹等, 2013; 严正兵等, 2013)以及元素化学计量特征在不同功能类群植物间的差异(Han et al., 2005; He et al., 2008; 张文彦等, 2010; 张珂等, 2014)等。近期研究发现, 在不同发育阶段, 植物对资源的利用策略存在差异, 因而叶片C、N、P的计量特征在不同生长期之间也可能出现较大波动(李征等, 2012; 牛得草等, 2013; 刘万德等, 2015)。然而, 现有研究大多关注植物叶片C、N、P化学计量特征的年际变化或多年平均情况, 忽视了植物叶片元素计量特征的季节动态, 而叶片C、N、P计量特征的季节波动可能增加分析结果的不确定性。同时, 相同功能群的植物在结构和功能及其对环境的适应性上具有相似性(张文彦等, 2010), 因而, 叶片元素含量及其比值的季节变化趋势在同一功能群植物间倾向于一致, 而在不同功能群植物间则可能不同(Han et al., 2005)。然而, 关于叶片元素含量及其计量特征的季节变化趋势在不同功能类群之间的差异仍有待研究。
随着生态学的快速发展, 其各个分支学科在日益细化的同时也在相互渗透和整合, 使得生态学研究方法不断发展。在此背景之下, 由生态化学计量学与生态学代谢理论(MTE)结合而衍生的异速生长理论, 尝试将生态学各层次的格局和过程联系起来, 对从个体水平到生态系统间的物质和能量循环进行了整合(Vanni et al., 2002; Elser et al., 2010), 推动了植物元素含量及其比值的研究。植物异速生长研究始于生物量在不同器官之间的分配研究, 通常指不同器官相对生长速率不同的现象(Bertalanfy, 1999)。目前植物异速生长研究已扩展到从微观的基因水平到宏观的生态系统水平(West & Brown, 2005), 其中, 植物叶片性状的异速生长关系成为近年来的研究热点(Niinemets et al., 2007; Li et al., 2008)。植物叶片C、N、P含量及其比值是重要的叶片性状, 其中叶片N、P含量作为叶经济谱所涵盖的功能性状而被广泛关注(Wright et al., 2004)。但目前有关叶片元素含量异速生长的研究多集中于较大空间尺度的格局分析(Wright et al., 2004; 祝介东等, 2011), 小尺度异速生长关系的季节动态研究则关注较少。
位于干旱-半干旱地区的内蒙古典型温带草原是欧亚草原重要的组成部分, 对全球变化极为敏感。本研究以锡林浩特典型草原为研究对象, 采集了草原围封样地(自1979年起围封)常见物种植物的叶片样品, 研究了该地区植物叶片C、N、P含量及其比值的季节动态, 探讨了其对内蒙古典型草原生态系统植物群落结构与功能的影响, 为生态化学计量学和异速生长研究在时间尺度上的拓展提供借鉴。
1 材料和方法
1.1 研究区概况
本研究选择内蒙古锡林浩特典型温带草原为研究区。植物叶片样品均采集自距离中国科学院内蒙古草原生态系统定位研究站(以下简称内蒙古草原站) 1 km处长期围封的温带典型草原样地, 地理坐标为43.63° N, 116.7° E, 海拔1 187 m。该样地地势平坦(坡度小于5°), 面积为25 hm2 (500 m × 500 m), 自1979年起开始围封至今。该地区是中国温带典型草原最具代表性的地区之一, 属于半干旱气候, 冬季寒冷干燥, 夏季温暖湿润, 年平均气温(MAT)为0.9 ℃, 年降水量(MAP)为333 mm; 最冷月为1月份, 平均气温为-21.4 ℃, 最热月为7月份, 平均气温为19.5 ℃; 降水主要集中在夏季(6-8月), 约占全年降水的63% (图1)。典型植被为C3植物主导的温带草原, 群落优势种是当地广泛分布的多年生禾草, 例如羊草(Leymus chinensis)、大针茅(Stipa grandis)、羽茅(Achnatherum sibiricum)等。
图1
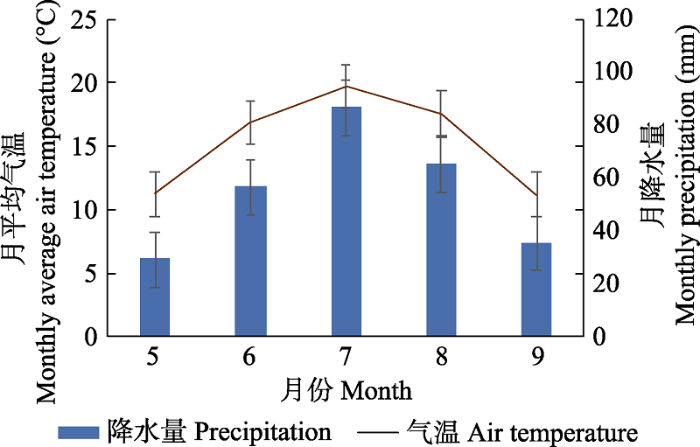
图1
内蒙古典型草原研究区生长季的月平均气温和月降水量(平均值±标准偏差)。
Fig. 1
Monthly average temperature and precipitation during the growing season in the study area in typical steppe in Nei Mongol (mean ± SD).
1.2 样品采集与元素测量
在2019年生长季的6-9月, 每隔15天进行一次样方调查(具体调查日期为6月2日、6月17日、7月2日、7月17日、8月2日、8月17日和9月2日)。每次调查时随机选取5个1 m × 1 m的小样方, 针对样方内共有的植物, 选取长势良好、向阳、无病害植株(每种5-10株), 每株采集5-15枚包含完整叶脉、基部以及顶端的整个叶片(不含叶柄、叶鞘)并混合为一个样品(Cornelissen et al., 2003)。具体采样物种的名称和物候期记录详见表1。将采集到的植物叶片以纸质信封保存并迅速运回实验室, 在65 ℃条件下烘干至恒质量。烘干后的植物样品用球磨仪研磨, 个别样品辅以手动研磨, 将磨细的样品过100目筛, 放在干燥离心管中加以标号保存。叶片C、N含量用元素分析仪(vario EL cube CHNOS Elemental Analyzer, Elementar Analysensysteme GmbH, Hanau, Germany)测定(江伟等, 2006); 叶片P含量采用HNO3消解- ICP-OES法(张金丽等, 2017)测定, 采用的仪器为电感耦合等离子体发射光谱仪(iCAP 6300 ICP-OES Spectrometer, Thermo Fisher, Waltham, USA)。所有测试均由中国科学院植物研究所分析测试中心完成。
表1 内蒙古典型草原采样物种(名称、功能类群、物候期)与采样时间
Table 1
| 物种 Species | 发育类群 Phylogenetic group | 生活型 Life form | 6月 June | 7月 July | 8月 Aug. | 9月 Sept. |
|---|---|---|---|---|---|---|
| 羽茅 Achnatherum sibiricum | 单子叶 Monocotyledons | 多年生禾草 Perennial grasses | A | A | B, C | D |
| 长柱沙参 Adenophora stenanthina | 双子叶 Dicotyledons | 多年生杂类草 Perennial forbs | A | A, B | B | B, C |
| 冰草 Agropyron cristatum | 单子叶 Monocotyledons | 多年生禾草 Perennial grasses | A | B, C | D | D, E |
| 矮韭 Allium anisopodium | 单子叶 Monocotyledons | 多年生杂类草 Perennial forbs | A, B | C | D | D |
| 黄花葱 Allium condensatum | 单子叶 Monocotyledons | 多年生杂类草 Perennial forbs | A, B | C | D | D |
| 山韭 Allium senescens | 单子叶 Monocotyledons | 多年生杂类草 Perennial forbs | A, B | C | D | D |
| 细叶韭 Allium tenuissimum | 单子叶 Monocotyledons | 多年生杂类草 Perennial forbs | A, B | C | D | D |
| 小叶锦鸡儿 Caragana microphylla | 双子叶 Dicotyledons | - | B | C | C | D |
| 糙隐子草 Cleistogenes squarrosa | 单子叶 Monocotyledons | 多年生禾草 Perennial grasses | A | A | B, C, D | D, E |
| 狗娃花 Aster hispidus | 双子叶 Dicotyledons | 多年生杂类草 Perennial forbs | B, C | C | C, D | D, E |
| 木地肤 Kochia prostrata | 双子叶 Dicotyledons | - | A | B, C | C, D | D, E |
| [艹/洽]草 Koeleria macrantha | 单子叶 Monocotyledons | 多年生禾草 Perennial grasses | B, C | D | D | D, E |
| 羊草 Leymus chinensis | 单子叶 Monocotyledons | 多年生禾草 Perennial grasses | A | B, C | C, D | D, E |
| 裂叶荆芥 Nepeta tenuifolia | 双子叶 Dicotyledons | 多年生杂类草 Perennial forbs | A | B, C | C | D |
| 二裂委陵菜 Potentilla bifurca | 双子叶 Dicotyledons | 多年生杂类草 Perennial forbs | A, B | B, C | C, D | D, E |
| 麻花头 Klasea centauroides | 双子叶 Dicotyledons | 多年生杂类草 Perennial forbs | B, C | C | C, D | D |
| 大针茅 Stipa grandis | 单子叶 Monocotyledons | 多年生禾草 Perennial grasses | A | A | B, C | C, D |
| 展枝唐松草 Thalictrum squarrosum | 双子叶 Dicotyledons | 多年生杂类草 Perennial forbs | A | B, C | C | D |
A, 营养期; B, 现蕾期; C, 花期; D, 果期; E, 枯黄期。
A, vegetative stage; B, unopened buds stage; C, flowers stage; D, fruit stages; E, senescence stage.
1.3 数据分析
估算每种植物的叶片C、N、P含量及其比值的平均值(叶片C、N、P含量采用质量含量, 各计量比值采用质量比)、标准偏差和变化范围。在此基础上, 将所调查的物种按系统发育类型分为单子叶和双子叶两类; 按生活型分为多年生禾草和多年生杂类草两类(具体划分结果参见表1)。然后, 分别计算每组两类植物叶片C、N、P含量及其比值的平均值并给出描述性统计值, 由于一、二年生草本和灌木/半灌木的生活型分别仅包含1个物种, 因此未包含在不同物种组比较分析中。
为探讨叶片C、N、P含量及其比值间的耦合关系, 我们采用Person相关分析, 分析了叶片C、N、P含量之间及其与计量比值之间的关系。异速生长方程的表达式为y = αxβ, 方程两边经过对数转化后得到logy = logα + βlogx。其中x和y代表不同的计量指标, β即异速生长指数。若β与1之间具有显著差异, 则计量指标间为异速生长关系。故对叶片元素含量及其比值进行以10为底的对数转换, 使其满足正态分布后进行指标间异速生长分析。异速生长方程的拟合采用标准主轴回归(SMA)的方法, 在此基础上检验斜率β与1的差异性(Warton et al., 2006)并估算异速生长方程斜率的置信区间(Pitman, 1939), 最后利用似然比检验方法, 检验斜率在生长季各个时期之间的异质性(Warton & Weber, 2002)。
为分析各功能类群植物的叶片化学计量指标随季节变化的趋势, 我们采用了普通最小二乘法(OLS) 进行回归分析, 以各化学计量指标作为因变量, 而取样时间(以儒略日表示)为自变量。为反映各化学计量指标随季节的非线性变化趋势, 我们采用了一元二次方程进行拟合。为分析同一类群的某一计量指标在生长季不同时期的差异, 我们使用了单因素方差分析, 并采用多重比较方法(Tukey’s HSD)进行显著性检验。为比较功能类群、取样时间及二者交互作用对植物叶片化学计量指标变异的贡献率, 我们采用了协方差分析(ANCOVA), 以各化学计量指标作为因变量, 以功能类群、取样时间(以儒略日表示)以及二者的交互作用作为自变量; 为反映各化学计量指标随季节的非线性变化趋势, 协方差分析中包含了取样时间的一次项和二次项。
所有分析和绘图均在Rstudio 3.6.1中完成。
2 结果
2.1 叶片C、N、P含量及其计量比值的总体特征
内蒙古典型草原植物叶片C、N、P含量及各元素的比值在不同物种及生长季不同时期间存在较大变异(表2; 附录I)。其中, 叶片N、P含量、C:N和C:P的变异最大, 其最大值和最小值相差3倍以上; 其次是N:P, 其最大值和最小值之间相差1倍; 而叶片C含量的变异最小。具体而言, 126个植物样本的叶片C含量分布范围为369.88-474.75 mg·g-1, 平均值为433.45 (±19.51) mg·g-1; 叶片N含量的分布范围为15.30-53.79 mg·g-1, 平均值为28.08 (±8.19) mg·g-1; 叶片P含量的分布范围为0.80-3.60 mg·g-1, 平均值为1.56 (±0.49) mg·g-1; 叶片C:N的分布范围为8.33-30.23, 平均值为16.67 (±4.58); 叶片C:P的分布范围为118.13-573.06, 平均值为302.60 (±88.31); 叶片N:P的分布区间为12.81-29.33, 平均值为18.32 (±3.24)(表2)。
表2 内蒙古典型草原不同功能类群植物叶片碳(C)、氮(N)、磷(P)含量及计量比值
Table 2
| 功能类群 Functional group | 样本数 Sample number | 平均值 Mean | 最小值 Minimum | 最大值 Maximum | 标准偏差 Standard deviation | 变异系数 Coefficient of variation | ||
|---|---|---|---|---|---|---|---|---|
| 碳含量 C concentration (mg·g-1) | 发育类群 Phylogenetic group | 单子叶 Monocotyledons | 70 | 431.87a | 391.36 | 468.83 | 18.2 | 0.04 |
| 双子叶 Dicotyledons | 56 | 435.43a | 369.88 | 474.75 | 21.03 | 0.05 | ||
| 生活型 Life form | 多年生禾草 Perennial grasses | 42 | 443.66a | 413.25 | 468.83 | 11.36 | 0.03 | |
| 多年生杂类草 Perennial forbs | 70 | 429.13b | 390.53 | 474.75 | 19.89 | 0.05 | ||
| 全部 All | 126 | 433.45 | 369.88 | 474.75 | 19.51 | 0.05 | ||
| 氮含量 N concentration (mg·g-1) | 发育类群 Phylogenetic group | 单子叶 Monocotyledons | 70 | 24.69b | 15.30 | 48.14 | 6.35 | 0.26 |
| 双子叶 Dicotyledons | 56 | 32.33a | 20.90 | 53.79 | 8.29 | 0.26 | ||
| 生活型 Life form | 多年生禾草 Perennial grasses | 42 | 23.50b | 15.30 | 35.25 | 5.13 | 0.22 | |
| 多年生杂类草 Perennial forbs | 70 | 29.85a | 17.00 | 53.79 | 8.42 | 0.28 | ||
| 全部 All | 126 | 28.08 | 15.30 | 53.79 | 8.19 | 0.29 | ||
| 磷含量 P concentration (mg·g-1) | 发育类群 Phylogenetic group | 单子叶 Monocotyledons | 70 | 1.41b | 0.80 | 3.09 | 0.44 | 0.31 |
| 双子叶 Dicotyledons | 56 | 1.75a | 1.04 | 3.60 | 0.49 | 0.28 | ||
| 生活型 Life form | 多年生禾草 Perennial grasses | 42 | 1.22b | 0.80 | 1.99 | 0.25 | 0.20 | |
| 多年生杂类草 Perennial forbs | 70 | 1.75a | 1.08 | 3.60 | 0.51 | 0.29 | ||
| 全部 All | 126 | 1.56 | 0.80 | 3.60 | 0.49 | 0.31 | ||
| C:N | 发育类群 Phylogenetic group | 单子叶 Monocotyledons | 70 | 18.55a | 8.48 | 30.23 | 4.43 | 0.24 |
| 双子叶 Dicotyledons | 56 | 14.32b | 8.33 | 21.85 | 3.59 | 0.25 | ||
| 生活型 Life form | 多年生禾草 Perennial grasses | 42 | 19.76a | 12.36 | 30.23 | 4.28 | 0.22 | |
| 多年生杂类草 Perennial forbs | 70 | 15.44b | 8.33 | 23.09 | 3.99 | 0.26 | ||
| 全部 All | 126 | 16.67 | 8.33 | 30.23 | 4.58 | 0.27 | ||
| C:P | 发育类群 Phylogenetic group | 单子叶 Monocotyledons | 70 | 330.93a | 130.66 | 573.06 | 91.16 | 0.28 |
| 双子叶 Dicotyledons | 56 | 267.19b | 118.13 | 423.14 | 70.72 | 0.26 | ||
| 生活型 Life form | 多年生禾草 Perennial grasses | 42 | 378.07a | 218.89 | 573.06 | 74.78 | 0.20 | |
| 多年生杂类草 Perennial forbs | 70 | 262.79b | 118.13 | 423.14 | 68.44 | 0.26 | ||
| 全部 All | 126 | 302.60 | 118.13 | 573.06 | 88.31 | 0.29 | ||
| N:P | 发育类群 Phylogenetic group | 单子叶 Monocotyledons | 70 | 17.95a | 12.81 | 29.33 | 3.52 | 0.20 |
| 双子叶 Dicotyledons | 56 | 18.78a | 13.76 | 26.99 | 2.80 | 0.15 | ||
| 生活型 Life form | 多年生禾草 Perennial grasses | 42 | 19.50a | 14.26 | 29.33 | 3.59 | 0.18 | |
| 多年生杂类草 Perennial forbs | 70 | 17.16b | 12.81 | 23.62 | 2.34 | 0.14 | ||
| 全部 All | 126 | 18.32 | 12.81 | 29.33 | 3.24 | 0.18 |
平均值后的不同小写字母代表不同功能类群之间叶片C、N、P含量及计量比值在0.05水平上差异显著。
Different lowercase letters following mean values represent significant differences among leaf C, N, P contents and ratios of different functional groups (p < 0.05).
2.2 叶片C、N、P含量及其计量比值间的关系
叶片C含量与P含量、C:N及C:P之间存在显著但较弱的相关性(|r| < 0.45, p < 0.05), 而N含量与C:N、C:P, P含量与C:P、C:N, C:N与C:P以及N含量与P含量之间均呈显著且较强的负相关关系(|r| > 0.75, p < 0.05)(图2, 图3)。因为N含量与C:P、P含量与C:N及C:N与C:P之间的关系是N与P含量关系的间接体现, 故接下来的异速生长分析主要关注N含量与C:N、P含量与C:P以及N与P含量之间的关系。结果表明, 物种间叶片N含量与C:N、叶片P含量与C:P以及叶片N与P含量间关系的斜率在生长季不同时期间均无显著差异(表3)。其中叶片N含量与C:N的共同斜率为-0.99 (95%置信区间: CI = -1.03- -0.95), 叶片P含量与C:P的共同斜率为-1.04 (95%置信区间: CI = -1.07- -1.01), 叶片N含量与P含量的共同斜率为1.11 (95%置信区间: CI = 0.97-1.26); 这三组关系斜率的绝对值均与1.0无显著差异(p > 0.05), 说明这三组关系均为等速生长关系。
图2
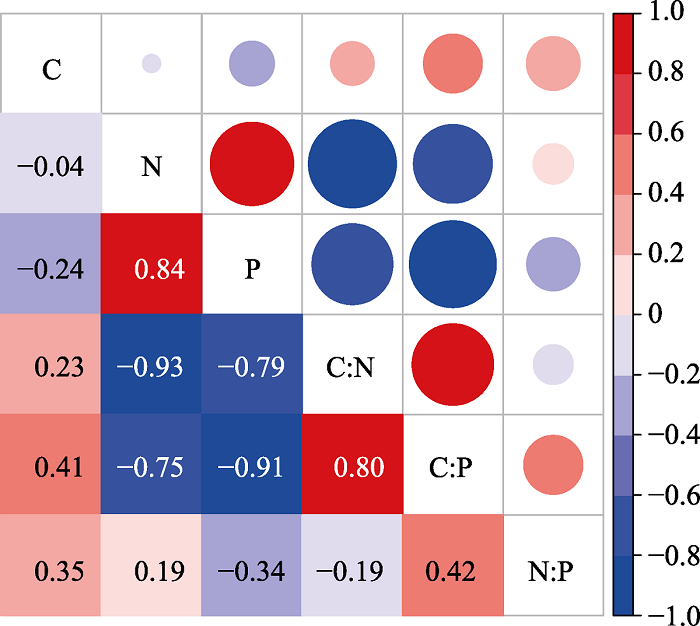
图2
内蒙古典型草原植物叶片碳(C)、氮(N)、磷(P)含量及计量比值间的相关性。
Fig. 2
Correlation between leaf carbon (C), nitrogen (N), phosphorus (P) contents and their ratios in a typical steppe in Nei Mongol.
图3
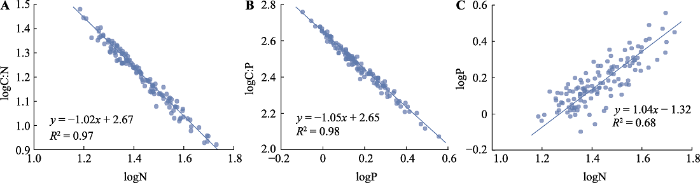
图3
内蒙古典型草原植物叶片碳氮比(C:N)与氮(N)含量(A)、碳磷比(C:P)与磷(P)含量(B)及N含量与P含量(C)间的关系。
Fig. 3
Relationships between leaf C:N and nitrogen (N) concentration (A), C:P and phosphorus (P) concentration (B), and N and P concentration (C) among species in a typical steppe in Nei Mongol.
表3 内蒙古典型草原植物叶片碳氮比(C:N)与氮(N)含量、碳磷比(C:P)与磷(P)含量及氮(N)含量与磷(P)含量的标准主轴(SMA)回归参数在不同季节间的差异
Table 3
| 组别 Group | C:N-N | C:P-P | P-N | ||||||
|---|---|---|---|---|---|---|---|---|---|
| 斜率 Slope | R2 | p | 斜率 Slope | R2 | p | 斜率 Slope | R2 | p | |
| 06-02 | -1.04 (-1.16, -0.93) | 0.96 | <0.001 | -1.04 (-1.11, -0.97) | 0.99 | <0.001 | 1.68 (1.26, 2.23) | 0.70 | <0.001 |
| 06-17 | -1.00 (-1.10, -0.90) | 0.96 | <0.001 | -1.03 (-1.12, -0.95) | 0.97 | <0.001 | 1.16 (0.87, 1.53) | 0.71 | <0.001 |
| 07-02 | -0.95 (-1.03, -0.88) | 0.98 | <0.001 | -0.98 (-1.06, -0.90) | 0.97 | <0.001 | 0.98 (0.72, 1.32) | 0.67 | <0.001 |
| 07-17 | -0.97 (-1.07, -0.87) | 0.96 | <0.001 | -1.05 (-1.15, -0.96) | 0.97 | <0.001 | 0.97 (0.68, 1.38) | 0.54 | <0.001 |
| 08-02 | -0.97 (-1.05, -0.89) | 0.98 | <0.001 | -1.02 (-1.12, -0.93) | 0.97 | <0.001 | 0.90 (0.65, 1.24) | 0.62 | <0.001 |
| 08-17 | -1.03 (-1.17, -0.90) | 0.94 | <0.001 | -1.10 (-1.23, -0.98) | 0.95 | <0.001 | 1.08 (0.76, 1.54) | 0.54 | <0.001 |
| 09-02 | -1.03 (-1.13, -0.93) | 0.97 | <0.001 | -1.08 (-1.16, -1.01) | 0.98 | <0.001 | 1.13 (0.80, 1.60) | 0.55 | <0.001 |
| 共同斜率 Common slope | 斜率异质性 Heterogeneity of slopes | 共同斜率 Common slope | 斜率异质性 Heterogeneity of slopes | 共同斜率 Common slope | 斜率异质性 Heterogeneity of slopes | ||||
| 全部 All | -0.99 (-1.03, -0.95) | p = 0.77 | -1.04 (-1.07, -1.01) | p = 0.58 | 1.11 (0.97, 1.26) | p = 0.10 | |||
括号内数值为斜率95%的置信区间。
Data in brackets is 95% confidence interval for the slope.
2.3 不同类群叶片C、N、P含量及计量比值的季节变化
图4
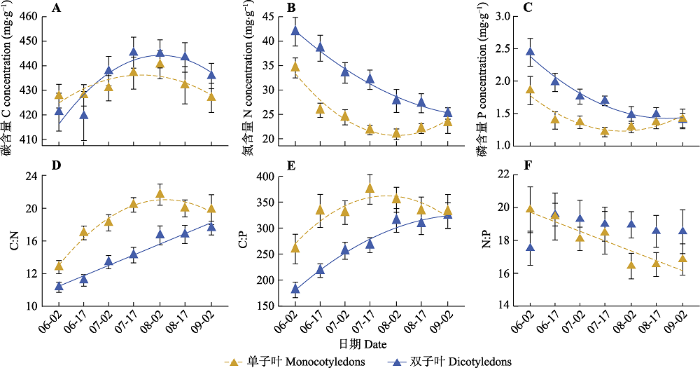
图4
内蒙古典型草原单子叶和双子叶植物叶片碳(C)、氮(N)、磷(P)含量(A、B、C)及计量比值(D、E、F)的季节动态(平均值±标准偏差)。回归图中的实线表示特定功能类群的特定计量指标随生长季的推移有显著变化(p < 0.05), 虚线表示特定功能类群的特定计量指标随生长季的推移有边缘显著变化趋势(0.05 < p < 0.1)。
Fig. 4
Seasonal dynamics of leaf carbon (C), nitrogen (N) and phosphorus (P) concentrations (A, B, C) and their ratios (D, E, F) in monocotyledons and dicotyledons in a typical steppe in Nei Mongol (mean ± SD). The solid line in the regression diagram indicates that the specific index of certain group has a significant change trend with growing season (p < 0.05). The dashed line indicates that the specific index of certain group has a marginal significant change trend with growing season (0.05 < p < 0.1).
图5
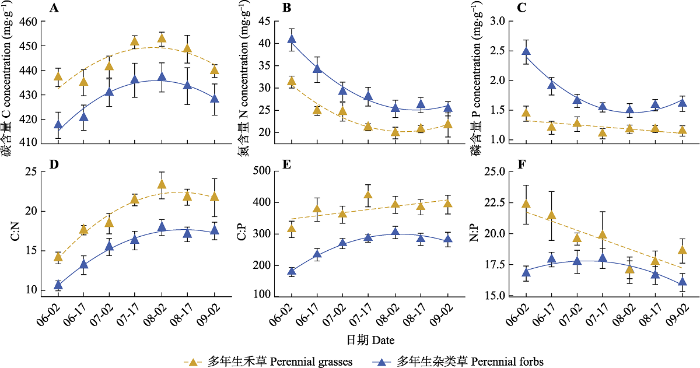
图5
内蒙古典型草原多年生禾草和多年生杂类草叶片碳(C)、氮(N)、磷(P)含量(A、B、C)及计量比值(D、E、F)的季节动态(平均值±标准偏差)。回归图中的实线表示特定功能类群的特定计量指标随生长季的推移有显著变化趋势(p < 0.05), 虚线表示特定功能类群的特定计量指标随生长季的推移有边缘显著变化趋势(0.05 < p < 0.1)。
Fig. 5
Seasonal dynamics of leaf carbon (C), nitrogen (N), phosphorus (P) concentrations (A, B, C) and their ratios (D, E, F) in perennial grasses and perennial forbs of typical steppe in Nei Mongol (mean ± SD). The solid line in the regression diagram indicates that the specific index of certain group has a significant change trend with growing season (p < 0.05). The dashed line indicates that the specific index of certain group has a marginal significant change trend with growing season (0.05 < p < 0.1).
2.4 叶片C、N、P含量及计量比值的整体变异分解
表4 内蒙古典型草原不同发育类群和生活型植物叶片碳(C)、氮(N)、磷(P)含量及其比值的协方差分析(ANCOVA)参数
Table 4
| 参数 Parameter | 发育类群 Phylogenetic group | |||
|---|---|---|---|---|
| 变异来源 Source of variation | 离差平方和 SS | 均方 MS | F | |
| 碳含量 C concentration (mg·g-1) | 发育类群 Phylogenetic group | 396 | 395.9 | 1.15 |
| 采样日期2 Sampling date2 | 2 867 | 2 867.2 | 8.33** | |
| 采样日期 Sampling date | 1 741 | 1 740.6 | 5.06* | |
| 发育类群×采样日期2 Phylogenetic group × Sampling date2 | 169 | 168.6 | 0.49 | |
| 发育类群×采样日期 Phylogenetic group × Sampling date | 1 088 | 1 088.4 | 3.16† | |
| 氮含量 N concentration (mg·g-1) | 发育类群 Phylogenetic group | 1 815 | 1 815.2 | 61.89*** |
| 采样日期2 Sampling date2 | 491 | 490.7 | 16.73*** | |
| 采样日期 Sampling date | 2 280 | 2 279.7 | 77.73*** | |
| 发育类群×采样日期2 Phylogenetic group × Sampling date2 | 93 | 93.1 | 3.17† | |
| 发育类群×采样日期 Phylogenetic group × Sampling date | 184 | 183.7 | 6.26* | |
| 磷含量 P concentration (mg·g-1) | 发育类群 Phylogenetic group | 3.48 | 3.48 | 22.78*** |
| 采样日期2 Sampling date2 | 2.18 | 2.18 | 14.25*** | |
| 采样日期 Sampling date | 4.86 | 4.86 | 31.82*** | |
| 发育类群×采样日期2 Phylogenetic group × Sampling date2 | 0.03 | 0.03 | 0.20 | |
| 发育类群×采样日期 Phylogenetic group × Sampling date | 1.40 | 1.40 | 9.18** | |
| C:N | 发育类群 Phylogenetic group | 554.8 | 554.8 | 56.52*** |
| 采样日期2 Sampling date2 | 135.2 | 135.2 | 13.78*** | |
| 采样日期 Sampling date | 696.9 | 696.9 | 70.80*** | |
| 发育类群×采样日期2 Phylogenetic group × Sampling date2 | 47.8 | 47.8 | 4.87* | |
| 发育类群×采样日期 Phylogenetic group × Sampling date | 5.5 | 5.5 | 0.56 | |
| C:P | 发育类群 Phylogenetic group | 126 456 | 126 456 | 23.29*** |
| 采样日期2 Sampling date2 | 42 934 | 42 934 | 7.91** | |
| 采样日期 Sampling date | 118 984 | 118 984 | 21.92*** | |
| 发育类群×采样日期2 Phylogenetic group × Sampling date2 | 5 798 | 5 798 | 1.07 | |
| 发育类群×采样日期 Phylogenetic group × Sampling date | 29 439 | 29 439 | 5.42* | |
| N:P | 发育类群 Phylogenetic group | 20.9 | 20.9 | 2.13 |
| 采样日期2 Sampling date2 | 0.2 | 0.22 | 0.02 | |
| 采样日期 Sampling date | 51.5 | 51.5 | 5.26* | |
| 发育类群×采样日期2 Phylogenetic group × Sampling date2 | 14.7 | 14.75 | 1.51 | |
| 发育类群×采样日期 Phylogenetic group × Sampling date | 46.9 | 46.9 | 4.80* | |
| 参数 Parameter | 生活型 Life form | |||
| 变异来源 Source of variation | 离差平方和 SS | 均方 MS | F | |
| 碳含量 C concentration (mg·g-1) | 生活型 Life form | 5 542 | 5 542 | 20.83*** |
| 采样日期2 Sampling date2 | 2 512 | 2 512 | 9.44** | |
| 采样日期 Sampling date | 1 810 | 1 810 | 6.80* | |
| 生活型×采样日期2 Life form × Sampling date2 | 10 | 10 | 0.04 | |
| 生活型×采样日期 Life form × Sampling date | 38 | 38 | 0.14 | |
| 氮含量 N concentration (mg·g-1) | 生活型 Life form | 1 060 | 1 059.6 | 31.75*** |
| 采样日期2 Sampling date2 | 526 | 525.5 | 15.75*** | |
| 采样日期 Sampling date | 1 833 | 1 832.8 | 54.92*** | |
| 生活型×采样日期2 Life form × Sampling date2 | 3 | 3.1 | 0.09 | |
| 生活型×采样日期 Life form × Sampling date | 78 | 78.1 | 2.34 | |
| 磷含量 P concentration (mg·g-1) | 生活型 Life form | 7.54 | 7.54 | 59.98*** |
| 采样日期2 Sampling date2 | 2.28 | 2.28 | 18.17*** | |
| 采样日期 Sampling date | 3.53 | 3.53 | 28.10*** | |
| 生活型×采样日期2 Life form × Sampling date2 | 0.58 | 0.58 | 4.58* | |
| 生活型×采样日期 Life form × Sampling date | 0.76 | 0.76 | 6.07* | |
| C:N | 生活型 Life form | 490.9 | 490.9 | 48.07*** |
| 采样日期2 Sampling date2 | 149.0 | 149.0 | 14.58*** | |
| 采样日期 Sampling date | 614.6 | 614.6 | 60.17*** | |
| 生活型×采样日期2 Life form × Sampling date2 | 2.1 | 2.1 | 0.21 | |
| 生活型×采样日期 Life form × Sampling date | 3.3 | 3.3 | 0.32 | |
| C:P | 生活型 Life form | 348 869 | 348 869 | 88.98*** |
| 采样日期2 Sampling date2 | 49 510 | 49 510 | 12.63*** | |
| 采样日期 Sampling date | 82 881 | 82 881 | 21.14*** | |
| 生活型×采样日期2 Life form × Sampling date2 | 1 157 | 1 157 | 0.30 | |
| 生活型×采样日期 Life form × Sampling date | 3 377 | 3 377 | 0.86 | |
| N:P | 生活型 Life form | 143.7 | 143.74 | 19.92*** |
| 采样日期2 Sampling date2 | 0.5 | 0.46 | 0.06 | |
| 采样日期 Sampling date | 73.3 | 73.3 | 10.16** | |
| 生活型×采样日期2 Life form × Sampling date2 | 34.8 | 34.82 | 4.83* | |
| 生活型×采样日期 Life form × Sampling date | 32.8 | 32.80 | 4.55* | |
分析中所用回归模型为: y ~发育类群+采样日期2 +采样日期+发育类群×采样日期2 +发育类群×采样日期; 或y ~生活型+采样日期2 +采样日期+生活型×采样日期2 +生活型×采样日期。SS, 离差平方和; MS, 均方。F值右上角的不同符号代表不同变异来源对特定计量指标影响的显著程度: ***, p < 0.001; **, p < 0.01; *, p < 0.05; †, p > 0.05。
Regression models used are: y ~ Phylogenetic group + Sampling date2 + Sampling date + Phylogenetic group × Sampling date2 + Phylogenetic group × Sampling date; or y ~ Life form + Sampling date2 + Sampling date + Life form × Sampling date2 + Life form × Sampling date. SS, sum of squares; MS, mean squares. Different symbols in the upper right corner of F value represent the significance of the influence of different sources of variation on a particular index: ***, p < 0.001; **, p < 0.01; *, p < 0.05; †, p > 0.05.
3 讨论
3.1 叶片C、N、P含量及计量比值的总体特征
C、N和P是植物生长发育所必需的大量元素, 其化学计量特征能反映植物的养分利用状况和元素平衡特征。本研究以内蒙古典型草原18种优势植物为研究对象, 分析了叶片C、N、P含量及其计量比值的季节性变化。结果发现, 全部物种的叶片平均C、N、P含量分别为433.45 (±19.51)、28.08 (±8.19)和1.56 (±0.49) mg·g-1。内蒙古典型温带草原植物叶片C含量与中国北方草地植物叶片平均C含量(438 mg·g-1, He et al., 2006)基本一致, 低于全球陆生植物叶片平均C含量((464 ± 32.1) mg·g-1, Elser et al., 2000a; p < 0.05)。这表明我国北方草地生态系统叶片C含量显著低于全球陆地生态系统的平均水平, 碳储存能力较弱。而内蒙古典型温带草原植物叶片N含量显著高于我国平均水平((20.2 ± 8.4) mg·g-1, Han et al., 2005; p < 0.05), 也高于全球平均水平((20.6 ± 12.2) mg·g-1, Elser et al., 2000b; p < 0.05)。这可能是因为内蒙古典型温带草原处在干旱-半干旱地区, 降水量相对较少, 从而减少了移动性较强的有效氮的淋溶, 为植物生长发育提供了相对充足的氮。这与以往研究的结果相一致, 即在全国乃至全球尺度上高纬度地区植物叶片的N含量较高(Elser et al., 2000a; Han et al., 2005)。本研究中内蒙古典型温带草原植物叶片P含量略高于全国平均水平((1.46 ± 0.99) mg·g-1, 韩文轩等, 2009), 但二者差异不显著(p > 0.05); 二者均显著低于全球平均水平((1.99 ± 1.49) mg·g-1, Elser et al., 2000a; p < 0.05)。有研究(Aerts & Chapin III, 2000; Han et al., 2005)认为, 植物叶片P含量主要受土壤P含量主导, 而我国大部分地区土壤P含量处在全球平均水平之下, 这可能是我国植物叶片P含量整体偏低的原因之一(Han et al., 2005; 任书杰等, 2007)。
植物叶片C:N和C:P表征植物吸收营养元素用来同化C的能力, 因而常被用作反映植物养分利用效率的指标(Sterner & Elser, 2002; 韩文轩等, 2009; 吴统贵等, 2010a)。本研究发现, 内蒙古典型草原植物叶片平均C:N显著低于全球平均水平(16.67 ± 4.58 vs. 22.5 ± 10.6; Elser et al., 2000a; p < 0.05), 而C:P则显著高于全球平均水平(302.60 ± 88.31 vs. 232 ± 145; Elser et al., 2000a; p < 0.05), 说明我国典型草原区植物N利用效率较全球植物偏低, 而P利用效率较全球植物偏高。植物叶片的N、P营养元素主要来自土壤, 其中土壤N的来源较为广泛, 而土壤P的获得途径则比较单一(阎恩荣等, 2008), 主要源于岩石母质的风化和淋溶。内蒙古典型草原地处高纬度干旱-半干旱区, 降水量较低, 在保存土壤有效氮的同时减缓了土壤P的释放(He et al., 2008; 宋彦涛等, 2012)。因此, 该地区植物生长发育所需的N较为充足而P相对匮乏, 这可能是该地区植物P利用效率较高而N利用效率较低的原因之一。
N和P一般被认为是陆地生态系统植物生长发育的限制因子, 因此植物叶片N:P常被用来评价植物受N或P相对限制的情况, 但不同研究采用不同的N:P阈值来判定植物营养元素限制情况。例如, Koerselman和Meuleman (1996)指出, N:P小于14的植物受N的限制, N:P大于16的植物受P的限制。而Güsewell (2004)则通过短期施肥实验发现, N:P小于10时, 植物生长受N限制, N:P大于20时则主要受P限制。这些研究说明, 用来表征植物N、P限制特征的N:P临界比存在不确定性。近期研究表明, 使用临界比为10和20比使用14和16的误差风险低(Yan et al., 2017)。在本研究中, 内蒙古典型草原的18种常见植物中不存在叶片N:P低于10的物种, 也不存在叶片N:P低于14且叶片N含量低于全球平均水平的植物(附录I); 同时, 叶片N:P大于16且叶片P含量低于全球平均值的植物为12种, 占所研究物种的72%, 叶片N:P大于20且叶片P含量低于全球平均水平的植物为3种, 占所研究物种的17% (附录I)。这些结果进一步说明, 相比其他地区的植物来说, 内蒙古典型草原植物可能更易受P限制。
以往有研究指出, 虽然植物叶片N、P含量随生长季推移存在较大变异, 但N:P则表现出较强的保守性, 支持了利用N:P临界比反映植物营养元素限制情况的可靠性(Santa et al., 1997; Ågren, 2008)。但我们的结果显示, 叶片N:P的季节性变化趋势在不同类群间具有显著差异。其中, 双子叶植物和多年生杂类草的叶片N:P随季节的变化不显著, 与以往研究的结论一致, 说明其营养元素限制情况未随季节发生显著变化。但单子叶植物和多年生禾草的叶片N:P则随季节呈显著下降趋势, 这与以往的研究结论不同。其中, 单子叶植物的N:P由生长季早期的约20下降至生长季后期的约16; 而多年生禾草的N:P由生长季早期的22.5下降至生长季后期的约17。单子叶植物和多年生禾草叶片N:P的季节性趋势说明, 虽然这两类植物的限制性营养元素在生长季不同时期未发生转变(均为P限制), 但营养元素限制程度则随生长季推移而显著减弱。这些结果说明, 当采用N:P判断植物营养元素限制情况时, 应注意研究的类群及数据采集的季节。
以往研究发现, 植物组织中C、N、P含量及其计量比值间具有显著相关性, 这种相关性反映了植物体内营养元素间内在的耦合机制(Elser et al., 2010), 本文结果进一步印证了这一观点。其中, 叶片N含量与C:N、叶片P含量与C:P以及叶片N含量与P含量都呈显著的强相关关系, 说明植物叶片N、P元素本身表现出很强的耦合关系, 而植物叶片C含量与N、P含量之间并未表现出直接的关系, 而是通过C:N、C:P计量比值来体现C-N、C-P的耦合关系, 而且这种耦合关系由叶片N、P含量主导。这一结果与牛得草等(2013)、杨阔等(2010)和张文彦等(2010)的发现一致。尽管叶片N、P含量和C:N、C:P均随季节而变化, 在不同功能类群间也有显著差异, 但叶片N含量与C:N、叶片P含量与C:P以及叶片N含量与P含量都呈现出等速生长关系, 且在生长季的不同时期呈现出较高的稳定性。这一结果进一步印证了植物叶片C-N、C-P、N-P之间的内在耦合关系。
3.2 不同类群植物叶片C、N、P含量及其计量比值的季节变化
内蒙古典型草原植物叶片C、N、P含量及其计量比值不仅随生长季节而变化, 在不同功能类群间也存在很大差异。在单子叶和双子叶两个类群间, 叶片C、N、P含量及C:N、C:P、N:P的变异均主要来自采样时间的不同, 而在多年生禾草和多年生杂类草间, 除叶片N含量和C:N的变异主要受采样时间的影响之外, 叶片C、P含量和C:P、N:P的变异则主要来自生活型的不同。由于采样时间的不同而导致的叶片化学计量指标的差异主要反映了植物自身在不同物候期的生物学特征, 而功能类群对叶片化学计量指标的影响则主要体现了功能类群对营养元素吸收利用的特异性表现。我们的结果显示, 多年生禾草和多年生杂类草两种生活型类群间具有较为不同的营养元素吸收利用特性。
糖类等有机物是C在植物体内的主要存在形式, 在生长季前期叶片光合作用强, 叶片作为光合作用的主要场所, 糖类等有机物大量积累, 单子叶和双子叶植物以及多年生禾草和杂类草叶片C含量在生长季前期均呈上升趋势; 而在生长季后期, 叶片光合作用减弱, 从而使叶片积累的有机物得到一定程度的消耗, 因而不同类群叶片C含量均有所下降。虽然叶片C含量在生长季不同时期具有一定的变化, 但与叶片N、P含量相比, 叶片C含量的季节变异最小。这一结果印证了在其他生态系统类型中的发现。例如: 牛得草等(2013)对阿拉善荒漠区6种主要灌木植物叶片元素含量的研究发现, 叶片C含量的季节变异显著小于N、P含量; 而刘万德等(2015)研究了普洱季风常绿阔叶林中6种优势植物种叶片C、N、P含量及化学计量比随植物生长发育的变化, 也发现C含量的整体变异最小。这些结果均表明了C作为植物体生长发育最主要的结构性物质, 其季节变异相对于作为功能性元素的N、P较小。
作为功能性元素, 叶片N、P含量会随植物生长各个阶段所进行的主要生理功能而发生变化, 因而在生长季的不同时期有较大差异。以往基于一次性采样得到的大尺度化学计量学结果, 通常忽略了化学计量特征的季节性差异, 这可能增加以往研究中的不确定性。在生长季前期, 单子叶和双子叶植物以及多年生禾草和杂类草叶片N、P含量均较高, 随着生长季节的推移呈下降趋势。吴统贵等(2010b)研究了杭州湾滨海湿地3种草本植物叶片N、P化学计量的季节变化, 发现叶片N、P含量均在生长初期显著大于其他生长季节; 而李征等(2012)发现滨海盐地碱蓬叶片N含量随生长季节的推移呈显著减小的趋势, 本研究结果与之类似。
在生长季前期, 植物叶片细胞具有快速分裂能力, 通过大量吸收N、P物质合成蛋白质和核酸来实现细胞快速增殖, 所以生长季前期植物叶片N、P含量最高(孙书存和陈灵芝, 2001; 吴统贵等, 2010b)。随着植物的生长, 叶片细胞在不断生长的过程中快速积累有机物, 导致叶片N、P浓度被逐渐稀释, 叶片N、P含量快速降低(吴统贵等, 2010b; 牛得草等, 2013)。在生长季中后期, 单子叶植物叶片N、P含量又略有回升, 这一现象在多年生杂类草类群中同样存在, 但在双子叶植物中不明显。不同功能类群在生长季中后期所表现出来的营养元素的差异性变化可能是因为不同功能类群物候期的异步性, 也可能是不同功能类群植物间吸收根系自身的功能差异。比如, 单子叶和多年生杂类草两个功能类群共有的百合科葱属(Allium)植物根系在8、9月份会对营养元素进行奢侈吸收(吴统贵等, 2010b), 这可能使得这两类物种叶片N、P含量在生长季后期有所升高。植物对营养元素的重吸收作用是指植物在落叶前将养分转移到其他活性组织中从而有效保存养分的现象, 从而造成叶片营养元素浓度会在落叶期出现明显的下降, 因而是影响植物叶片化学计量指标季节动态的重要过程。但本研究发现, 植物叶片N、P含量并没有表现出这一现象。对单子叶植物和多年生杂类草, 其叶片N、P含量均在生长季后期有升高现象。这种现象可能说明养分重吸收现象在温带草原植物中不显著, 或者是因为采样时养分重吸收过程尚未发生。在锡林浩特地区, 大部分研究物种在9月初仍处在花果期, 9月末10月初才进入枯黄、落叶期, 因而本文的研究时间可能未涵盖植物养分重吸收的阶段, 因而在今后的研究中有待进一步完善评估养分重吸收对叶片营养元素季节动态的影响。此外, 本研究发现单子叶和双子叶植物以及多年生禾草和杂类草叶片C:N、C:P在生长季前期均较低, 随着生长季节的推移呈上升趋势, 与叶片N、P含量的变化趋势相反, 这与以往研究的结果(Santa et al., 1997; Ågren, 2008; 牛得草等, 2013)一致, 进一步表明植物叶片C:N、C:P的季节变化主要由叶片N、P含量主导。叶片N:P随生长季的变化在不同功能类群间表现出不同的变化趋势, 其中单子叶植物和多年生禾草的叶片N:P随生长季推移呈现明显的下降趋势, 说明对于这两类植物而言, 由于叶片细胞伸长扩大所造成的N的稀释效应强于P, 这可能和不同植物类群对N、P的特异性吸收有关。
本研究显示, 单子叶植物的叶片N、P含量低于双子叶植物, 而叶片C:N、C:P则高于双子叶植物; 多年生禾草的叶片N、P含量低于多年生杂类草, 而叶片C含量和C:N、C:P、N:P则高于多年生杂类草, 这些结果与以往的研究一致。例如, Thompson等(1997)指出, 与单子叶植物相比, 双子叶植物叶片养分含量更高。Aerts (1996)研究发现, 禾本科植物叶片N、P含量一般较低。李玉霖等(2010)的研究表明, 非禾本科草本植物叶片N、P含量显著高于禾本科植物。以上结果均说明, 不同功能类群植物因养分适应策略的不同存在着明显的营养生态位分化。Tilman (1982)在竞争资源比例模型里指出营养元素含量较低的物种容易在养分匮乏的环境中长期生存。在本研究中, 叶片营养元素含量较低的单子叶、多年生禾草类植物有较强的养分利用效率, 能高效利用N、P营养元素同化更多的C, 具有较低的光合速率和生长速率, 在受贫瘠养分环境胁迫时的抵抗能力较强; 而营养元素含量较高的双子叶、多年生杂类草植物的养分吸收能力强, 具有较高的光合速率和生长速率, 对外界环境养分的竞争能力较强(Poorter & Bongers, 2006; Shipley et al., 2006)。综上所述, N、P含量较低的植物会倾向于在N限制或P限制的环境中成为优势种(Tilman, 1997)。在我国内蒙古典型草原, 占单子叶植物主体的多年生禾草类植物, 例如大针茅、羊草等, 因其较低的叶片N、P含量, 从而成为草地的主要优势种。
附录I
内蒙古典型草原18种常见植物叶片碳(C)、氮(N)、磷(P)含量的季节变化
Supplement I Seasonal variation of leaf leaf carbon (C), nitrogen (N), phosphorus (P) concentrations in 18 common plants of typical steppe in Nei Mongol, China
附录II
内蒙古典型草原植物叶片碳(C)、氮(N)、磷(P)含量及其比值季节变化趋势的普通最小二乘回归(OLS)分析参数
Supplement II Parameters of seasonal trends for leaf carbon (C), nitrogen (N), phosphorus (P) concentrations and ratios of typical steppe in Nei Mongol, China, analyzed by Ordinary Least Square (OLS) regression
参考文献
Nutrient resorption from senescing leaves of perennials: Are there general patterns?
DOI:10.2307/2261481 URL [本文引用: 1]
The mineral nutrition of wild plants revisited: a re-evaluation of processes and patterns
Stoichiometry and nutrition of plant growth in natural communities
The research advances and prospect of ecological stoichiometry
生态化学计量学研究进展
A handbook of protocols for standardised and easy measurement of plant functional traits worldwide
A new technique for interpolating the reflectance red edge position
Nutritional constraints in terrestrial and freshwater food webs
Biological stoichiometry of plant production: metabolism, scaling and ecological response to global change
Nutrient limitation reduces food quality for zooplankton: daphnia response to seston phosphorus enrichment
Biological stoichiometry from genes to ecosystems
Leaf N and P stoichiometry of common species in successional stages of the evergreen broad-leaved forest in Tiantong National Forest Park, Zhejiang Province, China
天童常绿阔叶林不同演替阶段常见种叶片N、P化学计量学特征
N:P ratios in terrestrial plants: variation and functional significance
Biomass N:P ratios as indicators of nutrient limitation for plant populations in wetlands
Leaf nitrogen and phosphorus stoichiometry across 753 terrestrial plant species in China
Leaf carbon, nitrogen and phosphorus stoichiometry across plant species in Beijing and its periphery
北京及周边地区植物叶的碳氮磷元素计量特征
Stoichiometry and large-scale patterns of leaf carbon and nitrogen in the grassland biomes of China
DOI:10.1007/s00442-006-0425-0
URL
PMID:16639565
[本文引用: 4]

Nitrogen (N) and carbon-nitrogen (C:N) ratio are key foliar traits with great ecological importance, but their patterns across biomes have only recently been explored. We conducted a systematic census of foliar C, N and C:N ratio for 213 species, from 41 families over 199 research sites across the grassland biomes of China following the same protocol, to explore how different environmental conditions and species composition affect leaf N and C:N stoichiometry. Leaf C:N stoichiometry is stable in three distinct climatic regions in Inner Mongolia, the Tibetan Plateau, and Xinjiang Autonomous Region, despite considerable variations among co-existing species and among different vegetation types. Our results also show that life form and genus identity explain more than 70% of total variations of foliar N and C:N ratio, while mean growing season temperature and growing season precipitation explained only less than 3%. This suggests that, at the biome scale, temperature affects leaf N mainly through a change in plant species composition rather than via temperature itself. When our data were pooled with a global dataset, the previously observed positive correlation between leaf N and mean annual temperature (MAT) at very low MATs, disappeared. Thus, our data do not support the previously proposed biogeochemical hypothesis that low temperature limitations on mineralization of organic matter and N availability in soils lead to low leaf N in cold environments.
Ecological stoichiometry: searching for unifying principles from individuals to ecosystems
生态化学计量学: 探索从个体到生态系统的统一化理论
Leaf nitrogen:phosphorus stoichiometry across Chinese grassland biomes
Plant nitrogen and phosphorus utilization under invasive pressure in a montane ecosystem of tropical China
N and P stoichiometric traits of plant and soil in different forest succession stages in Changbai Mountains
长白山森林不同演替阶段植物与土壤氮磷的化学计量特征
Responses of plant and soil C:N:P stoichiometry to N addition in a desert steppe of Ningxia, Northwest China
N添加对宁夏荒漠草原植物和土壤C: N: P生态化学计量特征的影响
Kjeldahl method and the elemental analyzer method in measurement of total nitrogen in sediments: comparison and its significance
凯氏蒸馏法和元素分析仪法测定沉积物中全氮含量的异同及其意义
Plant allometry, stoichiometry and the temperature-dependence of primary productivity
The vegetation N:P ratio: a new tool to detect the nature of nutrient limitation
Allometric relationships between lamina area, lamina mass and petiole mass of 93 temperate woody species vary with leaf habit, leaf form and altitude
Leaf C, N, and P concentrations and their stoichiometry in peatland plants of Da Hinggan Ling
大兴安岭泥炭地植物叶片碳氮磷含量及其化学计量学特征
Leaf nitrogen and phosphorus stoichiometry in typical desert and desertified regions, north China
北方典型荒漠及荒漠化地区植物叶片氮磷化学计量特征研究
C, N and P stoichiometric characteristics in leaves of Suaeda salsa during different growth phase in coastal wetlands of China
滨海盐地碱蓬不同生长阶段叶片C、N、P化学计量特征
Leaf carbon, nitrogen and phosphorus stoichiometry at different growth stages in dominant tree species of a monsoon broad-leaved evergreen forest in Pu’er, Yunnan Province, China
云南普洱季风常绿阔叶林优势物种不同生长阶段叶片碳、氮、磷化学计量特征
Stoichiometry study of C, N and P in plant and soil at different successional stages of monsoon evergreen broad-leaved forest in Pu’er, Yunnan Province
云南普洱季风常绿阔叶林演替系列植物和土壤C、N、P化学计量特征
N and P stoichiometry of plant and soil in lower subtropical forest successional series in southern China
南亚热带森林不同演替阶段植物与土壤中N、P的化学计量特征
Recent advances in ecological stoichiometry: insights for population and community ecology
Do we underestimate the importance of leaf size in plant economics? Disproportional scaling of support costs within the spectrum of leaf physiognomy
Nitrogen/ phosphorus leaf stoichiometry and the scaling of plant growth
Carbon, nitrogen and phosphorus stoichiometry in leaves and fine roots of dominant plants in Horqin Sandy Land
科尔沁沙地主要植物细根和叶片碳、氮、磷化学计量特征
Seasonal variations of leaf C:N:P stoichiometry of six shrubs in desert of China’s Alxa Plateau
阿拉善荒漠区6种主要灌木植物叶片C:N:P化学计量比的季节变化
Leaf traits are good predictors of plant performance across 53 rain forest species
The biological control of chemical factors in the environment
Global patterns of plant leaf N and P in relation to temperature and latitude
Universal scaling of respiratory metabolism, size and nitrogen in plants
Complementary models for ecosystems
Stoichiometric characteristics of leaf carbon, nitrogen, and phosphorus of 102 dominant species in forest ecosystems along the North-South Transect of East China
中国东部南北样带森林生态系统102个优势种叶片碳氮磷化学计量学统计特征
Leaf nitrogen and phosphorus stoichiometry across 654 terrestrial plant species in NSTEC
中国东部南北样带654种植物叶片氮和磷的化学计量学特征研究
Seasonal variation in nutrient concentration in leaves and branches of Quercus pyrenaica
Fundamental trade-offs generating the worldwide leaf economics spectrum
Leaf nitrogen and phosphorus stoichiometry in 80 herbaceous plant species of Songnen grassland in Northeast China
松嫩草地80种草本植物叶片氮磷化学计量特征
Leaf nutrient dynamics and resorption efficiency of Quercus liaotungensis in the Dongling mountain region
东灵山地区辽东栎叶养分的季节动态与回收效率
A comparative study of leaf nutrient concentrations in a regional herbaceous flora
Mechanisms of plant competiton//Crawley MJ
Stoichiometry of nutrient recycling by vertebrates in a tropical stream: linking species identity biodiversity and ecosystem processes
Nutrient cycling and nutrient use efficiency
Carbon and nitrogen stoichiometry at different growth stages in legumes and grasses
4种牧草不同生长期C、N生态化学计量特征
Common slope tests for bivariate errors-in-variables models
Bivariate line-fitting methods for allometry
The origin of allometric scaling laws in biology from genomes to ecosystems: towards a quantitative unifying theory of biological structure and organization
Why nature chose phosphates
Future productivity and carbon storage limited by terrestrial nutrient availability
The worldwide leaf economics spectrum
Leaf stoichiometry of trees in three forest types in Pearl River Delta, South China
珠江三角洲3种典型森林类型乔木叶片生态化学计量学
Seasonal variations of leaf nitrogen and phosphorus stoichiometry of three herbaceous species in Hangzhou Bay coastal wetlands, China
杭州湾滨海湿地3种草本植物叶片N、P化学计量学的季节变化
N:P stoichiometry in secondary succession in evergreen broad-leaved forest, Tiantong, East China
天童常绿阔叶林演替系列植物群落的N:P化学计量特征
Effects of nitrogen and phosphorus fertilization on leaf carbon, nitrogen and phosphorus stoichiometry of Arabidopsis thaliana
氮磷施肥对拟南芥叶片碳氮磷化学计量特征的影响
An assessment on the uncertainty of the nitrogen to phosphorus ratio as a threshold for nutrient limitation in plants
Canopy leaf N and P stoichiometry in grassland communities of Qinghai-Tibetan Plateau, China
青藏高原草地植物群落冠层叶片氮磷化学计量学分析
Ecological stoichiometry of plant nutrients at different restoration succession stages in typical steppe of Inner Mongolia, China
内蒙古典型草原不同恢复演替阶段植物养分化学计量学
Ecological stoichiometry: a science to explore the complexity of living systems
生态化学计量学: 复杂生命系统奥秘的探索
Determination of mineral elements by ICP-OES in different parts of Gordonia longicarpa
ICP-OES法测定长果大头茶不同部位的矿质元素
Foliar carbon, nitrogen and phosphorus stoichiometry of typical desert plants across the Alashan Desert
阿拉善荒漠典型植物叶片碳、氮、磷化学计量特征
The nitrogen:phosphorus stoichiometry of different plant functional groups for dominant species of typical steppes in China
中国典型草原优势植物功能群氮磷化学计量学特征研究
Changes of the relationships between soil and microbes in carbon, nitrogen and phosphorus stoichiometry during ecosystem succession
生态系统演替过程中土壤与微生物碳氮磷化学计量关系的变化
Within-leaf allometric relationships of mature forests in different bioclimatic zones vary with plant functional types
不同气候带间成熟林植物叶性状间异速生长关系随功能型的变异
