


地表与大气之间的能量平衡影响生物地球化学循环(如碳、氮、水循环)过程, 并调控区域气候(原文文等, 2015; 张翔等, 2017)。作为表面能量平衡的重要组分, 显热通量(H)和潜热通量(LE)通过对温度、水分传输和植被的生长发育的调控驱动区域气候的变化(Chen et al., 2009; 岳平等, 2011)。波文比(β)是H和LE的比值(H/LE), 它能够反映地表能量交换特征(Bowen, 1926; 陈云飞等, 2013; 夏露和张强, 2014; 葛骏等, 2016), 在众多陆面过程相关分析的研究中有所涉及, 在天气预报和气候预测中也有诸多应用(Jo et al., 2004; 何学敏等, 2017)。了解β的变化特征及影响因素, 有助于深入理解陆-气相互作用模式, 准确预测区域或全球尺度的水文循环、能量平衡和气候变化(Chen et al., 2009; Tang et al., 2014; Morwal et al., 2017)。
已有研究表明β受到地理(纬度)、气候(温度、降水、净辐射)和生物(叶面积指数)等因素的影响(Matsumoto et al., 2008; Launiainen, 2010; 张强等, 2014; Launiainen et al., 2016; 王佩等, 2017)。但是, 就目前的研究来说, 地理因素和气候因素与β的关系存在较大不确定性。例如, 孙成(2014)在对亚热带毛竹(Phyllostachys edulis)林能量通量的研究中认为, β的变异受降水量及其他因素的综合影响; Grünwald和Bernhofer (2007)在对德国温带云杉(Picea abies)林长达10年的通量观测研究中也指出, 年β主要受到年降水量的控制。而很多学者在研究之后发现, 年降水量和年β之间并不存在显著的相关关系(Ryu et al., 2008; Liu et al., 2009; Tang et al., 2014; Yue et al., 2018)。在空间尺度上, β的研究相对较少, 目前仅张强等(2014)在黄土高原地表能量通量的研究中表明, β随降水的增加而降低, 但没有明确β随温度的变化。Burakowski等(2017)在研究β对美国东部生态系统能量平衡的作用时提及, β会根据生物群落和纬度而变化, 但是并未明确给出β是如何在生物群落间和纬度上变化的。另外, 由于目前的研究大部分仅在单个的生态系统内进行, 因此生物和非生物因素对β变异的影响以及β在不同生态系统间的差异都不明确, 需要进一步的研究。
本文通过收集基于涡度相关法测定的地表能量平衡的公开发表文献, 构建β与生物和非生物因子数据库, 研究β在生态系统间的差异及其空间分布, 以期揭示β的影响因素, 旨在提高对陆-气间能量交换的理解, 为在区域尺度准确预测能量分配提供重要参数。
1 材料和方法
1.1 数据来源及质量控制
利用中国知网数据库(
(1)为消除方法不一致带来的不确定性, 提高可比性, 数据测量的方法均为涡度相关法。涡度相关法作为一种标准的测量方法, 以其高精度、高时间分辨率的优点被迅速广泛地运用到陆地生态系统的物质和能量交换研究中。本研究检索得到的文献中, 采用涡度相关法测量能量通量的文章占比为147/196。
(2)至少包括完整一年的显热和潜热通量数据。计算波文比的显热和潜热通量时间为年累积值(MJ·m-2·a-1), 排除由时间差导致的气候差异所带来的数据误差, 保证数据的统一性和可比性。
根据上述标准筛选后, 得到有效文献共计49篇。根据筛选得到的文献, 建立本研究的文献数据库。从文献中获取的信息包括: 地理信息(包括研究地点、经度(Lon)、纬度(Lat)和海拔(Alt))、生态系统类型、气候因素(包括多年平均气温(MAT)、年降水量(MAP)、当年平均气温(Ta)、当年降水量(PPT)、净辐射(Rn))、生物因素(叶面积指数(LAI))、能量平衡组分(包括H、LE、β)、能量平衡评价指标(包括能量闭合度(EBC)及能量平衡比率(EBR))、研究期、作者信息及文献信息。数据库中包含的主要信息的名称、英文缩写及单位见表1。LAI为生长季最大值; Rn、G、H、LE均为年总值。对于同一参数单位不同的情况, 按照表1中给出的单位进行转换统一。若文献中没有给出需要的相关信息, 但该文献图中含有相关的数据, 则通过软件GetData Graph Digitizer v2.24 (
表1 中国典型陆地生态系统波文比数据库主要信息
Table 1
| 变量名称 Variable name | 缩写 Abbreviation | 单位 Unit | 变量名称 Variable name | 缩写 Abbreviation | 单位 Unit |
|---|---|---|---|---|---|
| 纬度 Latitude | Lat | ° | 当年降水量 Annual precipitation of the studied year | PPT | mm |
| 经度 Longitude | Lon | ° | 净辐射 Net radiation | Rn | MJ·m-2·a-1 |
| 海拔 Altitude | Alt | m | 土壤热通量 Soil heat flux | G | MJ·m-2·a-1 |
| 年平均气温 Mean annual air temperature | MAT | ℃ | 显热通量 Sensible heat flux | H | MJ·m-2·a-1 |
| 年降水量 Mean annual precipitation | MAP | mm | 潜热通量 Latent heat flux | LE | MJ·m-2·a-1 |
| 生态系统类型 Ecosystem type | - | - | 波文比 Bowen ratio | β | - |
| 叶面积指数 Leaf Area Index | LAI | m2·m-2 | 能量闭合度 Energy balance closure | EBC | - |
| 当年平均气温 Mean annual air temperature of the studied year | Ta | ℃ | 能量平衡比率 Energy balance ratio | EBR | - |
图1
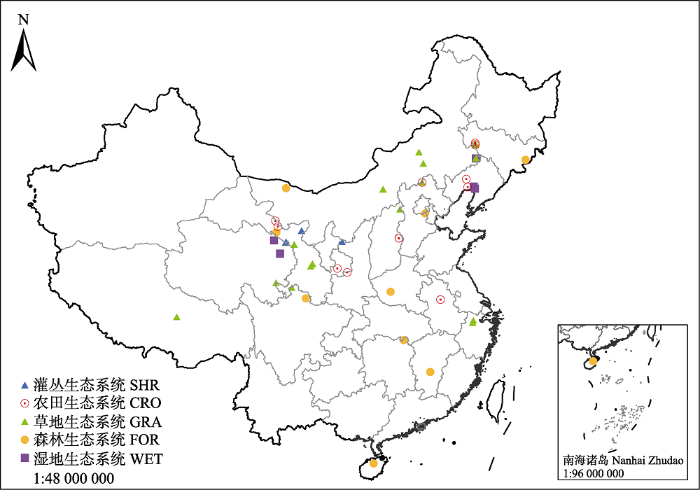
图1
中国典型陆地生态系统波文比数据来源站点分布图。
Fig. 1
Distribution of the data resources of Bowen ratio in typical terrestrial ecosystems in China. CRO, cropland ecosystems; FOR, forest ecosystems; GRA, grassland ecosystems; SHR, shrubland ecosystems; WET, wetland ecosystems.
1.2 数据分析
数据分析时发现, FOR中的离群值(Zhu et al., 2014)会影响分析结果, 即该点会改变FOR中β的整体趋势: 该点使本无显著相关关系的β和Alt显著相关, 使本该有显著相关关系的β和Lat、Lon、MAP、PPT之间无显著相关关系。Zhu等(2014)的研究地处青藏高原, 海拔较高(2 800 m), 地面获得的太阳辐射和净辐射都非常高(高于97%的站点数据), 但是该处降水量却相对较少(平均年降水量435 mm, 研究期当年降水量428 mm)。水分亏缺导致蒸散发不足, 因此用于驱动蒸散发的能量较少, 大部分净辐射分配给显热通量, 导致该地区波文比值异常地高。在数据分析中去掉了此异常值点。
所有的数据分析使用R 3.5.2完成。采用单因素方差分析法检验5种生态系统类型之间β差异的显著性。方差分析前, 对β进行了对数化处理, 以符合数据正态分布和方差齐性。采用图凯忠实显著性差异(Turkey HSD)法对不同植被类型之间的β差异进行多重比较。采用线性回归和非线性回归分析β和地理因素、环境因素及生物因素之间的相关关系, 选择最优模型以描述β随各影响因素的变化情况。由于数据量不足(样本量N < 4), 灌木生态系统中, 无法分析与 LAI、PPT、Ta之间的关系, 森林和湿地生态系统中无法分析与LAI之间的关系。采用协方差分析分析生态系统类型和环境因素对β是否存在交互影响(生态系统类型为固定因子, 环境因素为协变量)。采用结构方程模型(SEM)评价气候因素(MAP、MAT及Rn)和生物因素(LAI)对β的直接和间接影响。在气候因素中, 选择MAP和MAT代表降水量和温度, 因为MAP和MAT具有更充足的数据(NMAP = 52, NPPT = 39; NMAT = 51, NTa= 33), 且MAP和PPT显著相关(p < 0.01), MAT和Ta显著相关(p < 0.01)。SEM的结果以标准化的路径系数呈现。直接路径系数是由多元回归给出的标准化偏回归系数(-1-1之间), 间接路径系数是路径上所有直接系数的乘积之和。总路径系数是直接系数和间接系数的总和。根据已知理论和前人研究建立初始模型, 去除不显著路径( p > 0.05)后重新计算, 得到最终模型。
为确定能量闭合程度以及能量平衡校正是否会对β产生影响, 文章中收集了能量平衡闭合度(包括30 min和日尺度)、能量平衡比率以及土壤热通量的数据。但是有关能量闭合程度评估的数据量较少, 仅42%的文章中报道了相关数据, 导致无法进行能量平衡校正。并且后续的分析中发现能量闭合程度对β无显著影响, 因此在文后不再对能量闭合程度进行分析和讨论。
2 结果
2.1 波文比分布特征
图1显示, β在纬度方向(从南至北)上及经度方向(由西至东)上有明显分布。另外, 草地和农田生态系统的位置主要偏北, 森林生态系统更多地分布在南方, 灌木和湿地生态系统样本数较少分布规律不显著。所有生态系统类型的β平均值(±标准差)为0.95 ± 0.64 (n = 105), 在0.07-3.43之间变化, 大多(87%)分布在0-1.5之间(图2)。β变异系数为67%, 偏度1.58, 峰度3.07, 整体服从对数正态分布。β在生态系统类型间差异显著(F4,98 = 26, p < 0.01)( 图3), 灌木生态系统最高(1.26), 湿地生态系统最低(0.49)。森林和湿地生态系统β无显著差异, 灌丛生态系统β显著高于草地生态系统, 草地生态系统β显著高于森林和湿地生态系统。农田生态系统β介于草地生态系统和森林、湿地生态系统之间。
图2
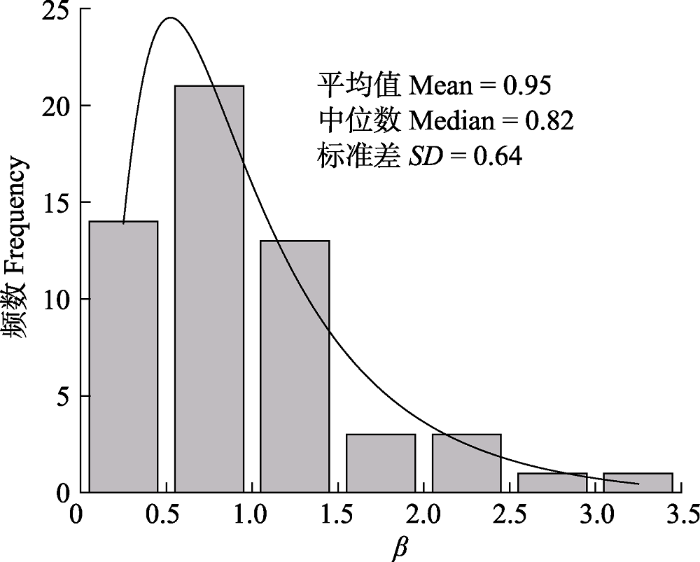
图2
中国典型陆地生态系统波文比(β)频数分布。
Fig. 2
Frequency distribution of Bowen ratio (β) in typical terrestrial ecosystems in China.
图3
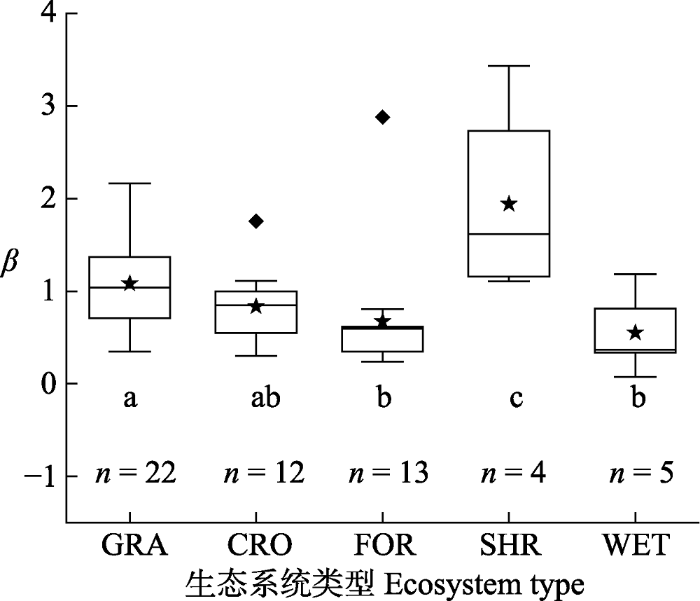
图3
不同生态系统类型波文比(β)分布箱线图。小写字母表示多重比较的结果, 相同的字母表示生态系统之间的β差异不显著(p > 0.5), 不同的字母表示生态系统之间的β差异显著(p < 0.5)。n为样本量。CRO, 农田生态系统; FOR, 森林生态系统; GRA, 草地生态系统; SHR, 灌丛生态系统; WET, 湿地生态系统。
Fig. 3
Boxing diagram of the Bowen ratio (β) of different ecosystem types. Lowercase letters indicate the results of multiple comparisons. The same letter indicates that the difference of β between ecosystems is not significant (p > 0.5), while different letters indicate significant differences in β between ecosystems (p < 0.5). n is the sample size. CRO, cropland ecosystems; FOR, forest ecosystems; GRA, grassland ecosystems; SHR, shrubland ecosystems; WET, wetland ecosystems.
2.2 波文比影响因素
2.2.1 地理因素
图4
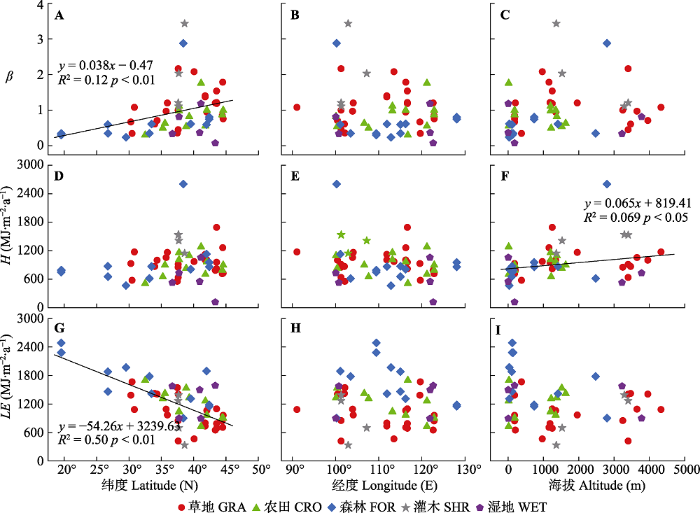
图4
中国陆地生态系统的波文比(β)、显热通量(H)、潜热通量(LE)与纬度、经度和海拔高度之间的关系。
Fig. 4
Relationships between the Bowen ratio (β), sensible heat flux (H), latent heat flux (LE) and latitude, longitude and altitude of terrestrial ecosystems in China. CRO, cropland ecosystems; FOR, forest ecosystems; GRA, grassland ecosystems; SHR, shrubland ecosystems; WET, wetland ecosystems.
表2 波文比(β)与地理、气候及生物因素在不同生态系统中的线性回归结果
Table 2
| 影响因素 Influencing factor | 生态系统类型 Ecosystem type | 回归方程 Regression equation | 样本数 Sample size | R2 |
|---|---|---|---|---|
| 纬度 Lat | FOR | β= 0.016Lat - 0.02 | 12 | 0.57** |
| 经度 Lon | FOR | β= 0.014Lon -1.13 | 12 | 0.32* |
| 年降水量 MAP | GRA | β= -0.00076MAP + 1.46 | 22 | 0.22* |
| FOR | β= -0.00021MAP + 0.73 | 12 | 0.36* | |
| SHR | β= -0.0046MAP + 3.73 | 4 | 0.91* | |
| 当年降水量 PPT | GRA | β= -0.00082PPT + 1.43 | 15 | 0.41** |
| FOR | β= -0.00025PPT + 0.77 | 10 | 0.42* | |
| 年平均气温 MAT | FOR | β= -0.017MAT + 0.74 | 11 | 0.45* |
| 当年平均气温 Ta | FOR | β= -0.020Ta + 0.77 | 8 | 0.48* |
| 净辐射 Rn | GRA | β= -000063Rn + 2.54 | 20 | 0.34*** |
| SHR | β= -0.0021Rn + 7.09 | 4 | 0.97* | |
| 叶面积指数 LAI | GRA | β= -0.20LAI + 1.45 | 12 | 0.34* |
FOR, 森林生态系统; GRA, 草地生态系统; SHR, 灌丛生态系统。*,p < 0.05; **, p < 0.01; ***, p < 0.001。
LAI, Leaf Area Index;Lat, latitude; Lon, longitude; MAP, mean annual precipitation; MAT, mean annual air temperature; PPT, annual precipitation of the studied year; Rn, net radiation; Ta, mean annual air temperature of the studied year. FOR, forest ecosystems; GRA, grassland ecosystems; SHR, shrubland ecosystems. *, p < 0.05; **, p < 0.01; ***, p < 0.001.
表3 显热通量(H)与地理、气候及生物因素在不同生态系统中的线性回归结果
Table 3
| 影响因素 Influencing factor | 生态系统类型 Ecosystem type | 回归方程 Regression equation | 样本数 Sample size | R2 |
|---|---|---|---|---|
| 纬度 Lat | SHR | H =-373.96Lat + 15579.69 | 4 | 0.90* |
| 当年降水量 PPT | FOR | H =-0.20PPT + 1015.80 | 10 | 0.41* |
| 净辐射 Rn | SHR | H= 0.36Rn + 521.99 | 4 | 0.99** |
FOR, 森林生态系统; SHR, 灌丛生态系统。*,p < 0.05; **, p < 0.01。
Lat, latitude; PPT, annual precipitation of the studied year; Rn, net radiation. FOR, forest ecosystems; SHR, shrubland ecosystems. *, p < 0.05; **, p < 0.01.
表4 潜热通量(LE)与地理、气候及生物因素在不同生态系统中的线性回归结果
Table 4
| 影响因素 Influencing factor | 生态系统类型 Ecosystem type | 回归方程 Regression equation | 样本数 Sample size | R2 |
|---|---|---|---|---|
| 纬度 Lat | GRA | LE= -45.40Lat +2767.46 | 22 | 0.36** |
| CRO | LE= -57.21Lat + 3424.40 | 12 | 0.48** | |
| FOR | LE= -40.80Lat + 3032.86 | 12 | 0.62** | |
| 经度 Lon | CRO | LE= -21.36Lon -3604.25 | 12 | 0.30* |
| FOR | LE =-36.92Lon +5944.80 | 12 | 0.39* | |
| 海拔 Alt | SHR | LE= 0.43Alt -116.08 | 4 | 0.89* |
| 年降水量 MAP | GRA | LE =0.64MAP +683.66 | 22 | 0.34** |
| CRO | LE =1.18MAP +500.76 | 10 | 0.52* | |
| FOR | LE= 0.50MAP + 1203.54 | 12 | 0.36* | |
| SHR | LE= 2.19MAP - 78.90 | 4 | 0.97** | |
| 当年降水量 PPT | GRA | LE= 0.65PPT + 725.23 | 15 | 0.44** |
| 年平均气温 MAT | FOR | LE =45.30MAT +1122.30 | 11 | 0.61** |
| SHR | LE= -80.99MAT + 1200.72 | 4 | 0.90* | |
| 当年平均气温 Ta | FOR | LE= 54.34Ta + 1024.19 | 8 | 0.62* |
| 净辐射 Rn | GRA | LE= 0.47Rn - 53.39 | 20 | 0.51*** |
| FOR | LE= 0.58Rn + 39.06 | 12 | 0.61** | |
| WET | LE= 0.69Rn - 441.67 | 5 | 0.77* |
CRO, 农田生态系统; FOR, 森林生态系统; GRA, 草地生态系统; SHR, 灌丛生态系统; WET, 湿地生态系统。*,p < 0.05; **, p < 0.01; ***, p < 0.001。
Lat, latitude; Lon, longitude; MAP, mean annual precipitation; MAT, mean annual air temperature; PPT, annual precipitation of the studied year; Rn, net radiation; Ta, mean annual air temperature of the studied year. CRO, cropland ecosystems; FOR, forest ecosystems; GRA, grassland ecosystems; SHR, shrubland ecosystems; WET, wetland ecosystems. *, p < 0.05; **, p < 0.01; ***, p < 0.001.
2.2.2 气候因素
在所有的生态系统类型中, 气候因素的影响表现为MAP、MAT、Rn、PPT和Ta增加时, β显著降低(图5)。β与MAP的关系呈对数形式, 拟合结果具有相对较高的决定系数(R2= 0.38)。β随着PPT增加呈线性降低, PPT每增加100 mm, β降低0.071。MAT和Ta对β的影响都呈线性, β随着MAT和Ta的增加而降低。相对来说, β对MAT变化比对Ta更加敏感: MAT每增加1 ℃, β降低0.035, 而Ta每增加1 ℃, β降低0.032。β与Rn的关系为幂函数, 有38%的结果可以被该方程解释。
图5
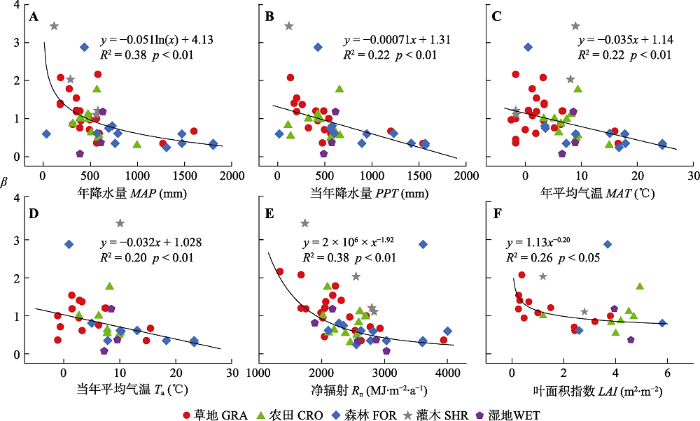
图5
中国陆地生态系统的波文比(β)与年降水量(MAP)、当年降水量(PPT)、年平均气温(MAT)、当年平均气温(Ta)、净辐射(Rn)和叶面积指数(LAI)的关系。
Fig. 5
Relationships between Bowen ratio (β) and mean annual precipitation (MAP), annual precipitation of the studied year (PPT), mean annual air temperature (MAT), mean annual air temperature of the studied year (Ta), net radiation (Rn) and Leaf Area Index (LAI) of China's terrestrial ecosystems. CRO, cropland ecosystems; FOR, forest ecosystems; GRA, grassland ecosystems; SHR, shrubland ecosystems; WET, wetland ecosystems.
图6
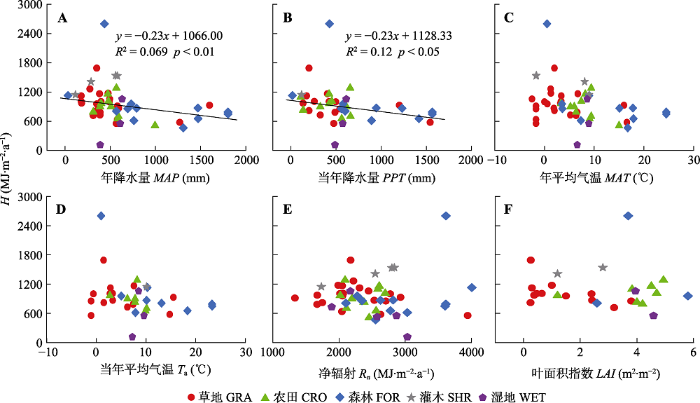
图6
中国陆地生态系统的显热通量(H)与年降水量(MAP)、当年降水量(PPT)、多年平均气温(MAT)、当年平均气温(Ta)、净辐射(Rn)和叶面积指数(LAI)之间的关系。
Fig. 6
Relationships between sensible heat flux (β) and mean annual precipitation (MAP), annual precipitation of the studied year (PPT), mean annual air temperature (MAT), mean annual air temperature of the studied year (Ta), net radiation (Rn) and Leaf Area Index (LAI) of China's terrestrial ecosystems. CRO, cropland ecosystems; FOR, forest ecosystems; GRA, grassland ecosystems; SHR, shrubland ecosystems; WET, wetland ecosystems.
图7
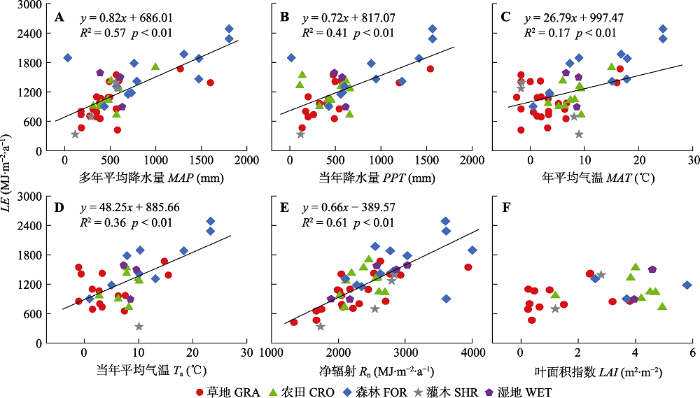
图7
中国陆地生态系统的潜热通量(LE)与年降水量(MAP)、当年降水量(PPT)、多年平均气温(MAT)、当年平均气温(Ta)、净辐射(Rn)和叶面积指数(LAI)之间的关系。
Fig. 7
The relationships between latent heat flux (LE) and mean annual precipitation (MAP), annual precipitation of the studied year (PPT), mean annual air temperature (MAT), mean annual air temperature of the studied year (Ta), net radiation (Rn) and Leaf Area Index (LAI) of China's terrestrial ecosystems. CRO, cropland ecosystems; FOR, forest ecosystems; GRA, grassland ecosystems; SHR, shrubland ecosystems; WET, wetland ecosystems.
气候因素对β的影响因生态系统中的植被类型而异。生态系统植被的类型和MAP对β存在交互影响(MAP, F1,41 = 46.77, p < 0.01; 植被类型, F5,41 = 8.18, p < 0.01; MAP ×植被类型, F4,41 = 6.35, p < 0.01)。草地、灌木和森林生态系统中 β随MAP的增加而显著降低, 农田和湿地生态系统中β与MAP无相关关系(表2)。其中, 灌木生态系统MAP对β影响的解释度最高(R2= 0.91), β对的变化MAP也最为敏感(MAP每增加100 mm, 灌木生态系统β降低0.46, 而草地和森林生态系统分别降低0.076和0.021)。相似地, 生态系统类型和PPT对β也存在交互效应(PPT, F1,30= 31.17, p < 0.01; 植被类型, F4,30 = 13.82, p < 0.01; PPT ×植被类型, F3,30 = 3.72, p < 0.05)。 PPT增加时, 草地和森林生态系统中β显著降低, 但PPT对农田、灌木和湿地生态系统β没有影响(表2)。相较于森林生态系统, 草地生态系统β对PPT的变化更敏感。
不同生态系统的植被类型和Rn对β同样存在交互影响(Rn, F1,41 = 54.31, p < 0.01; 植被类型, F4,41 = 11.59, p < 0.01; Rn ×植被类型, F4,41 = 5.61, p < 0.01): 草地和灌木生态系统 β随Rn增加而降低, 农田、森林和湿地生态系统β与Rn无显著相关关系(表2)。其中, 灌木生态系统中Rn对β变化的解释度高达97%, β对Rn变化的敏感性也较高(Rn每增加100 MJ·m-2·a-1, 草地生态系统β降低0.063, 而灌木生态系统β降低0.21)。
2.2.3 生物因素
2.3 气候及生物因素的直接和间接影响
结构方程的结果证明, β受气候因素和生物因素的综合影响。MAP和Rn是β的直接影响因素, LAI和MAT是β变化的间接影响因素。除直接影响以外, MAP还通过影响Rn、MAT和LAI对β产生复杂的间接影响, 同样地, Rn也通过影响MAP和MAT对β产生间接影响。LAI通过影响Rn (p < 0.01)间接影响 β, 而MAT则通过对MAP、Rn和LAI的影响, 而间接影响β(图8)。
图8
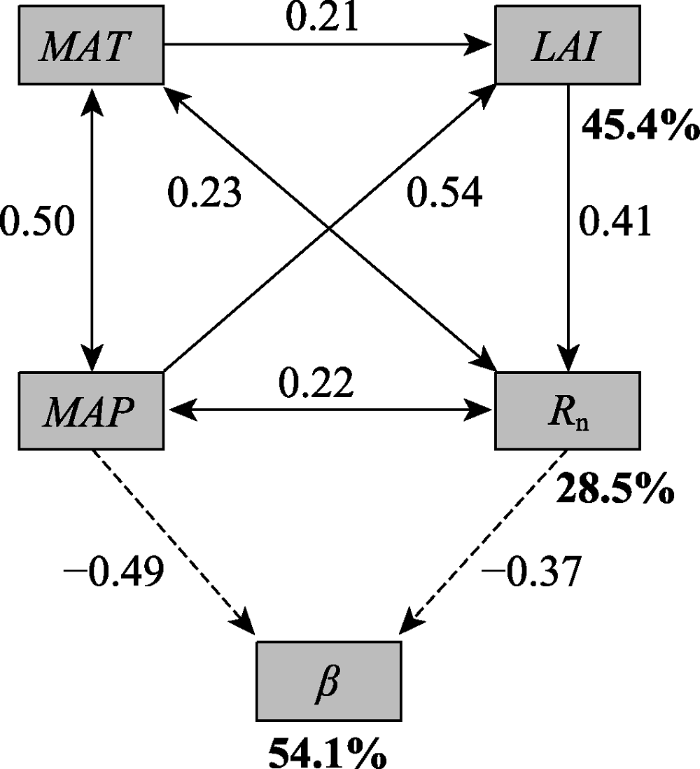
图8
年降水量(MAP)、年平均气温(MAT)、净辐射(Rn)和叶面积指数(LAI)对波文比(β)影响的路径分析图。结构方程模型(SEM)的统计结果为χ2= 1.75, df = 2, p = 0.093, RMSEA = 0.038。实线和虚线箭头分别代表正相关和负相关。每个箭头上的数字为标准化路径系数。粗体数字分别为LAI、Rn和β统计结果的解释度R2。
Fig. 8
Path diagrams for the effects of mean annual precipitation (MAP), mean annual air temperature (MAT), net radiation (Rn) and Leaf Area Index (LAI). The statistical results of the structural equation model (SEM) are χ2 = 1.75, df = 2, p = 0.093, RMSEA = 0.038. Solid and dashed arrows represent positive and negative correlations, respectively. The figure for each arrow is the standardized path coefficient. The bold numbers are the explained variance (R2) of LAI, Rn and β, respectively.
3 讨论
3.1 中国典型陆地生态系统波文比变异特征
不同生态系统类型间的β的差异表现为灌木林的β高于草地高于森林和湿地, 而农田介于草地和森林与湿地之间, 这种差异来源于生态系统间冠层结构和水分条件的不同。冠层结构能够通过影响LAI、地面粗糙度和地表反照率影响能量分配(Bonan, 2008; Boisier et al., 2012), 与冠层结构简单的生态系统相比, 冠层结构复杂的生态系统具有更强的蒸散发和冷却效应(即更低的β)(Juang et al., 2007; Kueppers et al., 2007; Li et al., 2015)。而水分直接影响生态系统的蒸散发(即LE)。我们的研究结果也证实了这一点(图5)。相对其他生态系统来说, 森林和湿地具有更复杂的冠层结构和更充足的水分条件, 因此β显著较低。灌木生态系统由于分布在干旱地区, 水分稀缺, 且植被覆盖度低, 冠层结构简单, 因此β均值最高。草地生态系统的水分条件介于灌木生态系统与森林和湿地生态系统之间, 其植被覆盖度远低于森林和湿地生态系统。由于数据样本点问题, 草地和灌木生态系统难以进行LAI的比较, 但从结构方程的结果可知, 水分的影响远高于叶面积指数对β的影响, 所以在无法比较植被覆盖时, 认为水分对β的影响占主导。因此, 草地生态系统的β均值高于森林和湿地生态系统而低于灌木生态系统。而与草地和森林、湿地差异都不显著的农田生态系统, 其β变异主要受人类活动影响。
3.2 中国典型陆地生态系统波文比影响因素
3.2.1 地理因素
β随着Lat的增加而增加, 是由LE与Lat负相关导致, 因为H与Lat无显著相关关系(图4)。Lat的变化伴随着气候的空间变化(Zhu et al., 2015), 影响了生态系统类型中β的空间分布。张强等(2014)在黄土高原的研究表明, H从南至北逐渐增加, 而LE从南向北逐渐降低, 即β从南到北增加, 本文的结果与之基本一致。张强等认为, LE随纬度的变化受夏季风降水的影响, β随纬度的变化受夏季风降水和Rn的影响。我们的研究中, 气候因素(MAP、MAT、Rn)随Lat显著变化(p < 0.01, 结果未显示), LE也受气候因素(MAP、MAT、Rn)的显著影响(图7)。而LE与气候因素的多元回归结果显示, LE受MAP和Rn影响显著(p < 0.01, 结果未显示), MAT对LE影响不显著, 因此MAT对LE的影响主要是通过MAP和Rn的协同变化实现。由此我们认为, β在纬度方向上的变化是MAP和Rn共同作用的结果, 这是由于降水充沛且净辐射较高的地区多以森林生态系统为主, 具有丰富的冠层结构, 气孔能够完全张开促进蒸腾和呼吸, 并且有足够的能量和水分用于植被蒸腾和土壤水分蒸发, 因此能量更多地分配给了LE, 使β降低。
尽管H随海拔的增加而增加, LE不随海拔变化, 但是β并没有随海拔变化的趋势。张强等(2014)的结果显示H和LE随海拔的增加而降低, 并且认为该趋势受辐射和温度的影响。而我们的研究结果中, 海拔方向上MAP逐渐减少(p < 0.05, 结果未显示), 而 H随MAP减少而增加(图6A), 因此H随Alt的增加而增加。海拔越高, 温度越低, 降水越稀少, 越容易限制植被生长, 因此森林、湿地和农田等植被组成较为丰富、生长过程中用水较多的生态系统更多分布在低海拔地区, 而高海拔地区更容易分布灌木和草地生态系统(图4)。所以高海拔地区植被蒸腾和土壤蒸发较少, 能量更多地用于H的消耗。而LE由于受多种气候因素影响, 不随Alt的变化而变化, 导致β与Alt没有显著相关关系。
3.2.2 气候因素
另外, 不同生态系统的β对气候因素的响应存在很大差异(表2)。其中, 森林生态系统中β对气候因素的变化最为敏感, 当降水、温度、净辐射增加时, 森林生态系统的β都会随之降低, 而农田和湿地生态系统的β对气候因素的变化没有任何响应。
3.2.3 生物因素
4 结论
通过文献数据整合, 分析了中国典型陆地生态系统β变异特征及影响因素, 得到以下主要结论: (1)中国地区β均值为0.95, 大多(87%)分布在0.0-1.5之间, 且β在5种生态系统类型之间具有显著差异(F4,98= 26, p < 0.01): 森林和湿地生态系统的 β显著小于草地小于灌木, 而农田生态系统β和森林、湿地和草地之间差异都不显著; (2)地理因素(纬度)、气候因素和生物因素都影响β的变化, 气候因素的影响因生态系统类型而异; (3) MAP和Rn是β变化的直接影响因素, LAI是β变化的间接影响因素, 其中降水是最主要的影响因素, 其他因素都会通过降水影响β。我们的研究阐明了β的空间分布状况以及空间格局上生物和非生物因素对其的影响, 分析得出植被类型与气候因素对β的影响具有交互作用。我们的结果还表明, 空间尺度上的能量分配主要受降水影响, 以及, 尽管叶面积指数对能量分配具有调节作用, 但这种调节作用并不显著。全球气候模型预测未来的降水会更加多变, 根据我们的研究结果, 未来空间尺度能量分配的格局也会更加多变, 因此, 我们需要更多的研究数据来进行更大尺度的调查和研究以加深对能量平衡和气候变化的理解。另外, 未来的研究应侧重于细化水分对能量分配的影响。
参考文献
Attributing the impacts of land-cover changes in temperate regions on surface temperature and heat fluxes to specific causes: results from the first LUCID set of simulations
DOI:10.1029/2011JD017106 [本文引用: 1]
Forests and climate change: forcings, feedbacks, and the climate benefits of forests
The ratio of heat losses by conduction and by evaporation from any water surface
DOI:10.1103/PhysRev.27.779 URL [本文引用: 1]
The role of surface roughness, albedo, and Bowen ratio on ecosystem energy balance in the Eastern United States
DOI:10.1016/j.agrformet.2017.11.030 URL [本文引用: 1]
Adapting observationally based metrics of biogeophysical feedbacks from land cover/land use change to climate modeling
DOI:10.1088/1748-9326/11/3/034002 URL [本文引用: 1]
Energy balance and partition in Inner Mongolia steppe ecosystems with different land use types
DOI:10.1016/j.agrformet.2009.06.009 URL [本文引用: 2]
Energy flux and energy balance closure of intensively managed Lei bamboo forest ecosystem
高效经营雷竹林生态系统能量通量过程及闭合度
Impacts of freeze/thaw processes on land surface energy fluxes in the permafrost region of Qinghai-Xizang Plateau
青藏高原多年冻土区土壤冻融过程对地表能量通量的影响研究
A decade of carbon, water and energy flux measurements of an old spruce forest at the Anchor Station Tharandt
Global land surface climate analysis based on the calculation of a modified Bowen ratio
DOI:10.1007/s00376-016-6175-y URL [本文引用: 2]
Surface energy balance of an arid desert wetland in Ebinur Lake basin, Xinjiang, China
新疆艾比湖流域干旱荒漠区湿地地表能量收支特征
Energy partitioning over a semi-arid shrubland in northern China
DOI:10.1002/hyp.v30.6 URL [本文引用: 3]
Sensible and latent heat flux in the tropical Pacific from satellite multi-sensor data
DOI:10.1016/j.rse.2003.12.003 URL [本文引用: 1]
Separating the effects of albedo from eco-physiological changes on surface temperature along a successional chronosequence in the southeastern United States
DOI:10.1029/2007GL031296 URL [本文引用: 1]
Irrigation cooling effect: regional climate forcing by land-use change
DOI:10.1029/2006GL028679 [本文引用: 1]
Seasonal and inter-annual variability of energy exchange above a boreal Scots pine forest
DOI:10.5194/bg-7-3921-2010 URL [本文引用: 1]
Do the energy fluxes and surface conductance of boreal coniferous forests in Europe scale with leaf area
DOI:10.1111/gcb.13497
PMID:27614117
[本文引用: 2]

Earth observing systems are now routinely used to infer leaf area index (LAI) given its significance in spatial aggregation of land surface fluxes. Whether LAI is an appropriate scaling parameter for daytime growing season energy budget, surface conductance (G ), water- and light-use efficiency and surface-atmosphere coupling of European boreal coniferous forests was explored using eddy-covariance (EC) energy and CO fluxes. The observed scaling relations were then explained using a biophysical multilayer soil-vegetation-atmosphere transfer model as well as by a bulk G representation. The LAI variations significantly alter radiation regime, within-canopy microclimate, sink/source distributions of CO , H O and heat, and forest floor fluxes. The contribution of forest floor to ecosystem-scale energy exchange is shown to decrease asymptotically with increased LAI, as expected. Compared with other energy budget components, dry-canopy evapotranspiration (ET) was reasonably 'conservative' over the studied LAI range 0.5-7.0 m m . Both ET and G experienced a minimum in the LAI range 1-2 m m caused by opposing nonproportional response of stomatally controlled transpiration and 'free' forest floor evaporation to changes in canopy density. The young forests had strongest coupling with the atmosphere while stomatal control of energy partitioning was strongest in relatively sparse (LAI ~2 m m ) pine stands growing on mineral soils. The data analysis and model results suggest that LAI may be an effective scaling parameter for net radiation and its partitioning but only in sparse stands (LAI <3 m m ). This finding emphasizes the significance of stand-replacing disturbances on the controls of surface energy exchange. In denser forests, any LAI dependency varies with physiological traits such as light-saturated water-use efficiency. The results suggest that incorporating species traits and site conditions are necessary when LAI is used in upscaling energy exchanges of boreal coniferous forests.© 2016 John Wiley & Sons Ltd.
Local cooling and warming effects of forests based on satellite observations
DOI:10.1038/ncomms7603 URL [本文引用: 1]
Surface energy exchanges above two grassland ecosystems on the Qinghai-Tibetan Plateau
Energy consumption and evapotranspiration at several boreal and temperate forests in the Far East
DOI:10.1016/j.agrformet.2008.09.008 URL [本文引用: 1]
Intra-seasonal and inter-annual variability of Bowen ratio over rain- shadow region of north peninsular India
DOI:10.1007/s00704-016-1745-6 URL [本文引用: 1]
Interannual variability of evapotranspiration and energy exchange over an annual grassland in California
DOI:10.1029/2007JD009263 [本文引用: 1]
The Study on the CO2 Flux and Energy Balance Variations in a Phyllostachys edulis Forest Ecosystem
PhD dissertation,
毛竹林生态系统CO2通量和能量平衡的观测研究
博士学位论文,
Interannual variation of the Bowen ratio in a subtropical coniferous plantation in southeast China, 2003-2012
DOI:10.1371/journal.pone.0088267 [本文引用: 3]
Comparison of evapotranspiration and Bowen ratio method by eddy correlation and Bowen ratio system in a temperate grassland
温带草地蒸散发及波文比观测与比较: 涡动相关及波文比系统
Plateau surface energy balance components and interannual variability in response to climate fluctuations
黄土高原地表能量平衡分量年际变化及其对气候波动的响应
Characteristics of energy balance of a mixed plantation in the Xiaolangdi area in the growing season
黄河小浪底人工混交林生长季能量平衡特征
Surface heat flux and energy budget for semi- arid grassland on the Loess Plateau
黄土高原半干旱草地地表能量通量及闭合率
Seasonal and inter-annual variability of the Bowen smith ratio over a semi-arid grassland in the Chinese Loess Plateau
DOI:10.1016/j.agrformet.2018.01.006 URL [本文引用: 1]
Spatial distribution of surface energy fluxes over the Loess Plateau in China and its relationship with climate and the environment
我国黄土高原地区陆面能量的空间分布规律及其与气候环境的关系
Energy balance of an artificial grassland in the Three-River Source Region of the Qinghai-Tibet Plateau
青藏高原三江源区人工草地能量平衡的变化特征
Energy flux partitioning and evapotranspiration in a sub-alpine spruce forest ecosystem
DOI:10.1002/hyp.9995 URL [本文引用: 3]
Spatial patterns and climate drivers of carbon fluxes in terrestrial ecosystems of China
DOI:10.1111/gcb.2013.19.issue-3 URL
