


植物地上生物量(AGB)通常指特定时刻单位面积上植物地上部分的干质量, 对生态系统碳、水和能量的平衡有着重要作用(Scurlock et al., 2002; Piao et al., 2007)。同时, 地上生物量影响着草地饲料供给, 决定了草原的畜牧养殖承载力(Yahdjian & Sala, 2006)。因此, 准确估算草地地上生物量对于评估草地生产力、优化草地资源管理以及维持草地生态系统稳定性等具有重要意义(Parton et al., 1995; Liang et al., 2016)。
野外收获法是测量草地地上生物量最为准确的方法, 但费时、费力, 且受到地形、交通等多种因素的限制, 难以实现对生物量高频率、大范围的监测。随着科学技术的发展, 卫星遥感因其观测覆盖范围广、空间连续且受地形限制小等特点(Xu et al., 2013), 越来越多被用于植物地上生物量的估算。遥感归一化植被指数(NDVI)能够有效反映植物绿度的年内和年际变化, 在基于卫星遥感的地上生物量研究中被广泛应用(Huete et al., 2002; Craine et al., 2012; 刘帆等, 2018)。通常, 基于NDVI的地上生物量估算法可分为物理模型和经验模型两类。物理模型主要借助植被二向性反射与生物量之间的关系估算地上生物量, 但结构较为复杂, 且估算精度偏低(Zhu & Liu, 2015)。相比之下, 经验模型是通过NDVI和实测地上生物量数据建立函数关系来实现; 该方法操作简单, 在实际工作中较多使用(王维枫等, 2008)。
基于经验模型估算法的前人研究多使用生长季单一时期(一般不多于3个月)卫星遥感NDVI和实测地上生物量数据建立关系(金云翔等, 2011; 除多等, 2013a; Main-Knorn et al., 2013; Jin et al., 2014; 张旭琛等, 2015)。然而, 已有研究表明, NDVI与地上生物量之间的关系在生长季内可能并不恒定。例如, 在西藏高寒草地, 地上生物量与NDVI在5月呈现为一元线性关系; 在生长季其他月则呈现为指数函数关系, 且函数参数随月份而变化(除多等, 2013b)。因此, 仅使用单一时期数据构建经验模型对地上生物量季节动态的估算将会引起较大的不确定性, 而基于生长季不同时期建模的估算可能更为准确。
此外, 基于卫星NDVI的生物量估算受到大气条件和卫星观测时空分辨率的影响。前人研究发现, 云和气溶胶会降低卫星遥感NDVI估算地上生物量的准确性(葛静等, 2017)。卫星影像因其空间分辨率低, 对异质性较强的草地生物量估算能力有限(Piao et al., 2019); 另外, 卫星遥感获取影像的时间间隔较长, 难以实现生物量的实时估算(Jin et al., 2014)。近年来, 近地遥感如物候相机和手持式植物冠层光谱仪, 能够连续地获取高时空分辨率的植被光谱信息(Petach et al., 2014; Filippa et al., 2018), 且受大气条件影响较小(Sonnentag et al., 2012; 周宇庭等, 2013), 很大程度上弥补了卫星观测的不足, 为植物地上生物量的准确实时估算提供了新手段。目前, 北美和欧洲已经建立了物候相机观测网, 用于中小尺度的植被生长监测(Wingate et al., 2015; Klosterman et al., 2018)。然而, 物候相机在我国还处于起步阶段, 较少被应用于植被生长研究。
青藏高原面积约为250万km2, 平均海拔在4 000 m以上, 是世界上海拔最高、面积最大的高原, 被称为“世界屋脊” “地球第三极” (Qiu, 2008)。高寒草地占据了青藏高原面积的60%, 为当地畜牧业养殖提供了优质的牧草资源(Xu et al., 2018)。近50年来, 青藏高原年平均气温每10年上升0.3-0.4 ℃, 是全球同期平均升温速率的2倍左右(陈德亮等, 2015); 降水格局也在发生改变, 呈现北部增加、南部减少的趋势(Shen et al., 2015)。如此快速的气候变化已经对青藏高原高寒草地植物的生长产生了巨大的影响(Xu et al., 2018; 杨元合, 2018)。最新研究表明, 气候变暖使高寒草地快速生长期提前开始, 导致春季地上生物量生产增加; 而土壤水分降低加速快速生长期结束, 导致秋季地上生物量生产降低(Wang et al., 2020)。因此, 亟需建立遥感NDVI和地上生物量之间的最优模型, 为气候变化背景下高寒草地地上生物量变化的面上评估提供支持, 这将有利于制定科学合理的高寒草地管理制度和保证当地畜牧业的可持续发展。本研究以青藏高原东北部的高寒草地为研究对象, 基于2018-2019年物候相机和手持式光谱仪NDVI时间序列以及野外调查地上生物量季节动态数据, 以期评估近地遥感监测草地地上生物量季节变化的有效性, 并通过构建经验模型, 比较单一时期建模和生长季不同时期建模两种方法在草地地上生物量估算中的效率。
1 材料和方法
1.1 研究区概况
研究样地位于青海海北高寒草地生态系统国家野外科学观测研究站(简称海北站)。海北站地处青藏高原东北部、祁连山南麓, 37.50°-37.75° N, 101.20°-101.38° E, 海拔3 200 m。在本研究的两年中(2018-2019年), 海北站年平均气温为-1.1 ℃, 最冷月为1月(-15.1 ℃), 最暖月为8月(11.0 ℃); 年降水量为403.9 mm, 且大约80%的降水集中于生长季(5-9月)(图1A)。样地植被类型为高寒草甸, 常见物种包括垂穗披碱草(Elymus nutans)、矮嵩草(Kobresia humilis)、异针茅(Stipa aliena)、草地早熟禾(Poa pratensis)、高山豆(Tibetia himalaica)、青藏扁蓿豆(Medicago archiducis-nicolai)、麻花艽(Gentiana straminea)、线叶龙胆(Gentiana farreri)、美丽风毛菊(Saussurea pulchra)和羊茅(Festuca ovina)等。
图1
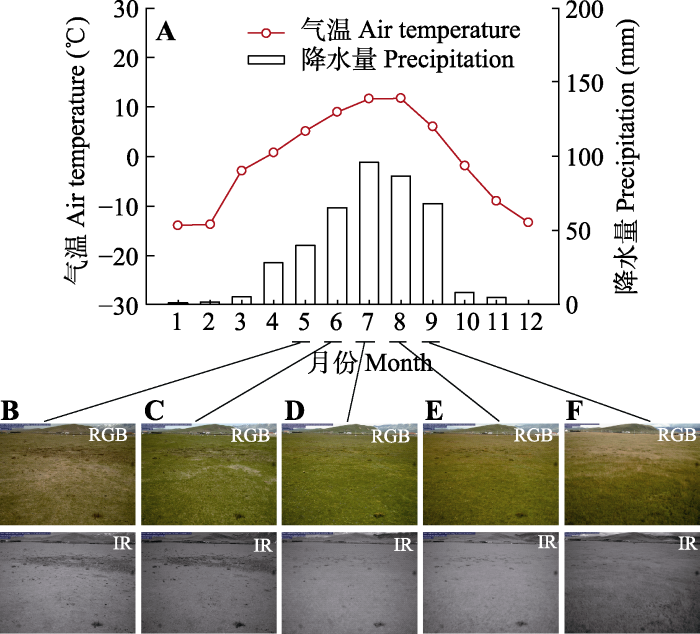
图1
海北站气温和降水的季节动态以及生长季各时期高寒草地植被生长状况。A, 2018和2019年的月平均气温和月降水量。B-F, 5-9月高寒草地植被生长的物候相机图像。NIR, 近红外图像; RGB, 红绿蓝图像。
Fig. 1
Seasonal dynamics of air temperature and precipitation, and the alpine grassland vegetation growth in different phases of the growing season at Haibei Station. A, Mean monthly air temperature and precipitation in 2018 and 2019. B-F, Pictures of plant growth from May to September as photographed by phenology camera. NIR, near-infrared images; RGB, red-green-blue images.
1.2 物候相机NDVI时间序列的获取
在2018年, 采用NetCam SC物候相机(StarDot Technologies, California, USA)收集多光谱图像。物候相机安装于约3.0 m高的支架上; 安装过程中最大程度固定相机, 避免拍摄角度的变化。同时, 为了避免周围物体的阴影进入, 相机拍摄范围选择地势较为平坦且植被类型均一的区域。图像拍摄时间设置为8:00-18:00, 拍摄频率为每小时一次。每次拍摄均获得红绿蓝(RGB)图像以及近红外(NIR)图像各一张(图1B-1F), 以JPEG格式储存于数据采集器(CR6, Campbell Scientific, Utah, USA)中, 全年共获取8 030幅图像。
使用Python 2.7软件, 在图像中选择目标区域(ROI), 并提取ROI中红光波段(RDN)以及近红外波段(NIRDN)的平均像元值(DN)用于计算物候相机NDVI (NDVICam)。计算公式如下:
为减少太阳高度角、光照条件以及露水等因素造成的影响, 我们进一步分析了NDVICam的日动态。考虑到10:00-14:00的NDVICam最为稳定且达到最大值, 本研究选取3 650幅该时间段的相机图像进行分析(图2A; Sonnentag et al., 2012)。
图2
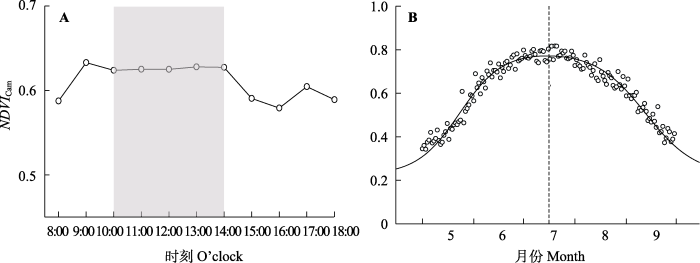
图2
海北站2018年5-9月物候相机归一化植被指数(NDVICam)的平均日动态(A)和季节动态(B)。A中阴影部分表示10:00-14:00物候相机的NDVI最为稳定。
Fig. 2
Diurnal (A) and seasonal patterns (B) of normalized difference of vegetation index measured by NetCam (NDVICam) from May to September in 2018 at Haibei Station. The shaded part in A indicates that the NDVI of the phenology camera from 10:00-14:00 is the most stable.
1.3 植物地上生物量的测定
在2018和2019年分别开展高寒草地地上生物量的野外测定。在生长季(5-9月), 每月对物候相机拍摄范围内的草地进行一至两次的地上生物量监测。每次监测先随机选取4个大样方(5 m × 5 m), 并在每个大样方内设置5个小样方(0.5 m × 0.5 m); 然后, 用RapidSCAN CS-45手持植物冠层光谱仪(Holland Scientific, Nebraska, USA)获取每个小样方内植物的NDVI (NDVIRS), 并收获植物地上绿色部分。植物样品在65 ℃恒温下烘干48 h至恒质量, 随后称质量获得地上生物量。在本研究的两年间, 每次测定15-20个小样方, 共计270个样本数据。
1.4 经验模型的构建及精度验证
本研究在生长季(5-9月)中每个月分别构建以NDVIRS为自变量的生物量估算经验模型; 模型类别包括回归模型、对数函数模型、幂函数模型、指数函数模型和多项式模型。实际操作中, 先随机选取2/3的样方数据用于构建模型, 剩下的样方数据用于模型的精度检验。本研究中, 最优模型的选择基于以下3个统计指标: 复相关系数(R2)、均方根误差(RMSE)和相对均方根误差(RMSEr)。其中, RMSE和RMSEr的计算公式如下:
式中, yi为实测草地地上生物量, ${\hat y_i}$为模型估算的地上生物量, n为样本数量, ${\bar y_i}$为实测地上生物量的平均值。RMSE越小, 表明估算模型拟合效果越好; RMSEr越小, 表示估算结果越接近真实值。
1.5 植物地上生物量季节动态的曲线拟合
基于物候相机NDVICam时间序列和最优经验模型, 本研究实现高寒草地地上生物量的季节动态估算。考虑到植物在春季和秋季生长上的非对称性(Beck et al., 2006; Busetto et al., 2010), 采用双参数逻辑斯蒂函数对估算生物量的季节动态进行拟合。双逻辑斯蒂函数如下:
式中, AGB(t)是一年中t时间的地上生物量; AGBmax和AGBmin分别是每年地上生物量的最大值和最小值; mS和mA分别表示生长季中期的最大增长速率和生长季后期的最大降低速率; S和A分别表示最大生长速率和最大降低速率发生的时间。本研究中, 使用SPSS 20.0软件实现统计分析, 通过SigmaPlot 14.0软件完成制图。
2 结果和分析
2.1 高寒草地地上生物量与NDVI的季节变化
图3
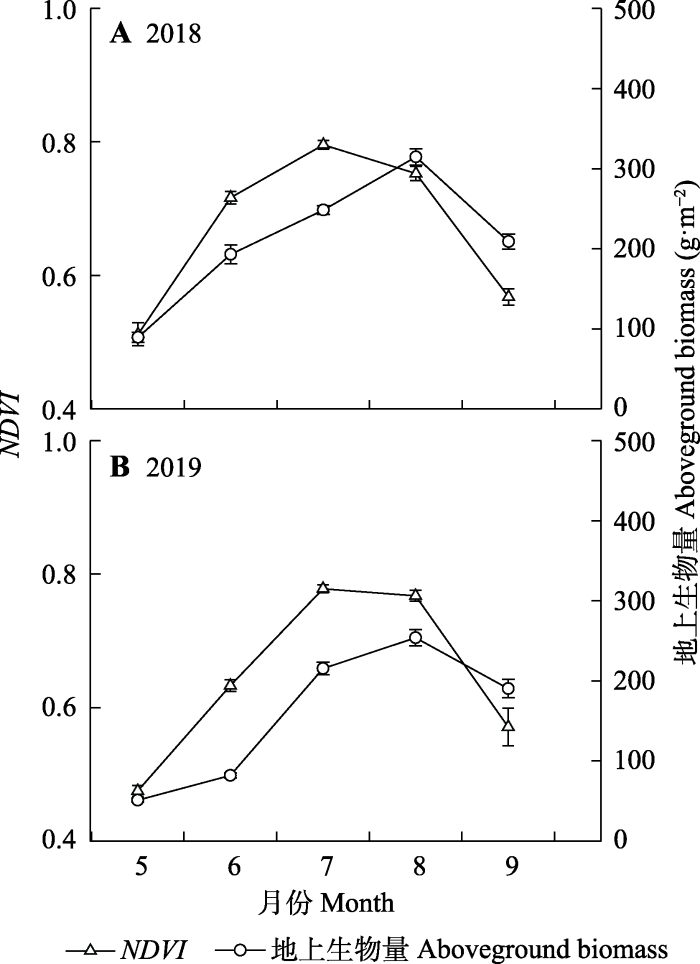
图3
海北站2018 (A)和2019年(B)生长季高寒草地手持式植物冠层光谱仪测量的归一化植被指数(NDVI)与地上生物量的变化(平均值±标准误)。
Fig. 3
Dynamics of the normalized difference of vegetation index (NDVI) measured by RapidSCAN and aboveground biomass (mean ± SE) of alpine grassland in the growing seasons of 2018 (A) and 2019 (B) at Haibei Station.
NDVICam和NDVIRS均在7月达到峰值, 而地上生物量在8月达到峰值。相关性分析结果表明, 生长季不同月份NDVIRS与地上生物量之间均呈显著正相关关系(p < 0.05); 并且, 除8月外, 其余月份的相关系数均高于0.6 (表1)。
表1 生长季不同月份高寒草地手持式植物冠层光谱仪测量的归一化植被指数与地上生物量之间的相关性
Table 1
| 月份 Month | 样本数 No. of samples | r | p |
|---|---|---|---|
| 5 | 56 | 0.80 | <0.001 |
| 6 | 34 | 0.88 | <0.001 |
| 7 | 64 | 0.67 | <0.001 |
| 8 | 51 | 0.31 | 0.03 |
| 9 | 63 | 0.78 | <0.001 |
2.2 高寒草地地上生物量与NDVI之间的经验模型构建
在2018和2019年5-9月, 分别构建了NDVIRS与地上生物量的各类经验模型。总体来说, 除8月外, 其余月份不同模型的拟合度均较高(R2 > 0.6)(表2)。按照R2的大小, 在5、7和9月, 幂函数模型的R2最高; 在6和8月, 多项式模型的拟合度优于其他模型。
表2 2018和2019年生长季高寒草地手持式植物冠层光谱仪测量的归一化植被指数(NDVIRS)(x)与地上生物量(y)之间的经验模型构建
Table 2
| 月份 Month | 模型 Model | 回归方程 Regression equation | R2 | RMSE | RMSEr (%) |
|---|---|---|---|---|---|
| 5月 May (n = 56) | 线性 Linear | y = 397.3x - 130.6 | 0.67 | 13.62 | 25.38 |
| 对数 Logarithm | y = 186.0ln(x) + 198.3 | 0.65 | 14.32 | 26.68 | |
| 指数 Exponent | y = 2.0e6.9x | 0.65 | 13.03 | 24.28 | |
| 乘幂 Power | y = 615.1x3.3 | 0.67 | 12.45 | 23.19 | |
| 多项式 Quadratic | y = 491.7x2 - 83.7x - 14.7 | 0.65 | 12.88 | 24.00 | |
| 6月 June (n = 34) | 线性 Linear | y = 1080.5x - 595.7 | 0.75 | 24.99 | 21.12 |
| 对数 Logarithm | y = 730.4ln(x) + 423.1 | 0.73 | 26.82 | 22.66 | |
| 指数 Exponent | y = 0.7e7.7x | 0.74 | 22.25 | 18.80 | |
| 乘幂 Power | y = 939.7x5.2 | 0.74 | 21.95 | 18.55 | |
| 多项式 Quadratic | y = 3363.7x2 - 3537.5x + 979.2 | 0.77 | 20.04 | 16.94 | |
| 7月 July (n = 64) | 线性 Linear | y = 952.0x - 508.5 | 0.72 | 39.94 | 18.54 |
| 对数 Logarithm | y = 730.2ln(x) + 416.7 | 0.71 | 40.35 | 18.73 | |
| 指数 Exponent | y = 8.4e4.2x | 0.73 | 38.00 | 17.64 | |
| 乘幂 Power | y = 517.6x3.3 | 0.73 | 37.65 | 17.48 | |
| 多项式 Quadratic | y = 1422.3x2 - 1248.1x + 339.51 | 0.72 | 38.95 | 18.08 | |
| 8月 August (n = 51) | 线性 Linear | y = 532.0x - 105.1 | 0.18 | 38.72 | 13.43 |
| 对数 Logarithm | y = 375.4ln(x) + 403.0 | 0.16 | 39.01 | 13.53 | |
| 指数 Exponent | y = 81.9e1.7x | 0.16 | 34.73 | 12.04 | |
| 乘幂 Power | y = 402.3x1.2 | 0.14 | 35.28 | 12.23 | |
| 多项式 Quadratic | y = 5968.0x2 - 8287.3x + 3134.3 | 0.29 | 31.70 | 10.99 | |
| 9月 September (n = 63) | 线性 Linear | y = 507.3x - 85.5 | 0.61 | 38.17 | 19.30 |
| 对数 Logarithm | y = 292.5ln(x) + 371.7 | 0.61 | 38.18 | 19.31 | |
| 指数 Exponent | y = 48.0e2.5x | 0.62 | 37.92 | 19.18 | |
| 乘幂 Power | y = 448.2x1.4 | 0.63 | 37.68 | 19.06 | |
| 多项式 Quadratic | y = -48.0x2 + 563.9x - 101.8 | 0.61 | 37.87 | 19.15 |
n, 样本量。加粗项是生长季各月份的最优拟合模型。RMSE, 均方根误差; RMSEr, 相对均方根误差。
n, sample size. The bold parts are the optimal models in different months of the growing season. RMSE, root mean square error; RMSEr, relative root mean square error.
同时, 5、7和9月中幂函数模型的RMSE和RMSEr均最低; 在6和8月, 多项式模型的RMSE和RMSEr最低(表2)。整体而言, 各月份最优模型的估算值与实测值之间的RMSE平均约为27.90 g·m-2, RMSEr在10.99%-23.19%之间, 平均预测精度大于80%。结合R2、RMSE和RMSEr 3个指标, 本研究定义高寒草地植物地上生物量估算的最优模型在5、7和9月为幂函数模型, 在6和8月为多项式模型。
2.3 高寒草地地上生物量季节动态的估算
图4
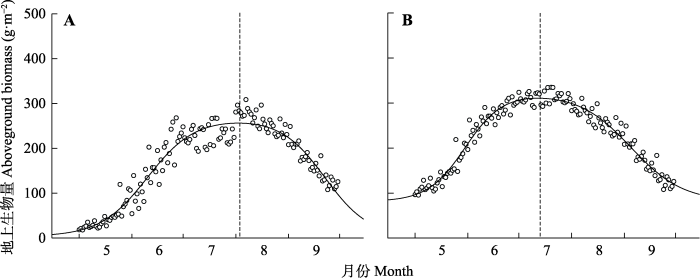
图4
基于物候相机归一化植被指数时间序列数据, 利用生长季不同阶段建模(A)和单一时期(9月)建模(B)分别估算2018年高寒草地生物量的季节动态。
Fig. 4
Seasonal dynamics of alpine grassland biomass estimated by the normalized difference of vegetation index measured by NetCam time series and the models in different phases of growing season (A) and at a single time (September)(B) in 2018.
图5
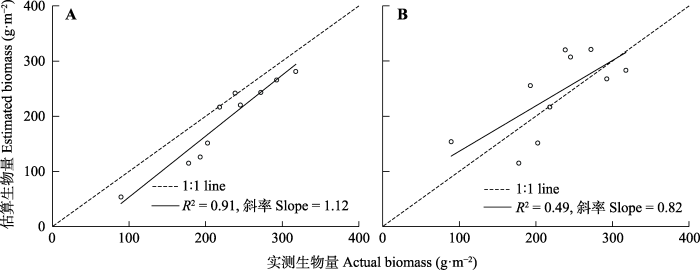
图5
生长季不同时期建模(A)和单一时期(9月)建模(B)下高寒草地地上生物量的估算精度。实测生物量值是2018年生长季每次野外测定生物量的平均值(n = 10); 估算生物量值通过最优经验拟合模型和物候相机归一化植被指数计算获得。
Fig. 5
Estimation of alpine grassland aboveground biomass using models in different phases of growing season (A) and at a single time (September)(B). The actual biomass is the averaged biomass for each measurement during the growing season of 2018 (n = 10). The estimated biomass is calculated by the optimal model and normalized difference of vegetation index measured by NetCam.
3 讨论
本研究基于NDVICam和NDVIRS时间序列数据, 结合野外测定地上生物量季节动态, 发现: (1) NDVIRS能够较好地捕捉高寒草地地上生物量的季节动态, 但NDVI峰值时间较地上生物量峰值时间更早; (2) NDVICam有助于高寒草地地上生物量季节动态的准确估算; (3)生长季不同时期建模比单一时期建模具有更高的地上生物量估算精度。
3.1 近地遥感能够有效捕捉地上生物量的季节动态
研究发现, 高寒草地NDVIRS与地上生物量在生长季期间均呈现相似的单峰变化格局。这一结果表明近地遥感NDVI能够有效捕捉高寒草地植被生长的季节动态。我们发现的单峰型植被生长格局与其他高寒地区研究结果(杨淑霞等, 2018)基本相同, 这主要是由于高原季风性气候所致(刘艾和刘德福, 2005)。然而, 本研究进一步发现地上生物量相比于NDVIRS更晚达到最大值, 即NDVI在7月达到峰值, 而地上生物量峰值发生在8月。这一现象可能与两方面原因有关。第一, NDVI在7月的植物冠层密度较高时产生饱和现象(杨嘉等, 2008), 导致比生物量更早达到峰值。通常, 在生长季前期植被盖度较低时, 随植物生长, 红光波段反射持续减弱, 近红外波段反射持续增强, NDVI随之呈现持续增长的趋势。然而, 当生长季中期植被覆盖度较高时, 叶绿素对红光波段的吸收达到饱和, 仅近红外波段的反射率随着植物的生长继续升高, 从而导致NDVI增加速率随着地上绿色生物量的增加而减缓, 呈现饱和现象(王正兴等, 2003)。第二, NDVI更多反映了植物光合活性的季节变化, 这与群落尺度上叶片生物量和叶片氮含量直接相关。最新研究表明, 杂类草具有较大的叶面积和更高的叶片氮含量, 且生长速率达到峰值的时间比禾本科植物更早(He et al., 2006; Wang et al., 2020)。因此, 较早的杂类草生长峰值时间可能导致了较早的NDVI峰值时间, 而较晚的禾本科植物生长导致生物量达到峰值时间更晚。
3.2 物候相机对地上生物量季节动态估算的实现
本研究结果表明, NDVICam具有明显的日动态变化, 其在10:00-14:00达到峰值, 且数值最为稳定, 能够有效反映高寒草地植物生物量的季节动态。相比之下, 卫星遥感合成NDVI的时间分辨率通常在8-30天(范德芹等, 2016; Zhang et al., 2016), 且卫星过境很难保证出现在植物光合作用达到日最大值时段内。因此, 物候相机能够有效弥补卫星遥感NDVI低时间分辨率的缺陷, 实现对植物生长过程的高频率监测。此外, 本研究结果也显示, 物候相机NDVICam在2018年生长季中基本没有出现异常值(图2B), 这表明物候相机能够在高寒地区实现植被光谱信息变化的高质量监测。然而, 大量研究表明, 卫星遥感NDVI时间序列易受云层覆盖、大气气溶胶等因素影响, 常常存在大量噪声(陈效逑和王林海, 2009); 即使经过复杂的数据预处理过程, NDVI的噪声也难以完全消除, 这在很大程度上影响了卫星遥感植被生长监测的准确性(夏传福等, 2013)。所以, “高空-近地”遥感结合是实现大范围、高频率、高质量植被生长过程监测的重要手段。
3.3 生长季不同时期建模较单一时期建模具有更高的地上生物量估算精度
本研究评估了生长季不同时期建模和单一时期建模估算得到的地上生物量结果, 发现基于生长季不同时期建模的估算效率更高。这可能是由于生长季各时期不同水热条件导致NDVI与地上生物量的关系发生改变所致。在本研究观测的两年中, 生长季不同时期表现出不同的最优模型, 并且在不同时期的模型参数也呈现出明显变化。相比于单一时期模型的固定参数, 不同时期模型以及模型参数的变化能够包含更多的植物生长过程信息(除多等, 2013b; Zhu & Liu, 2015), 因此能够较好地反映生长季各个时期NDVI与地上生物量之间的关系。这一研究结果表明, 传统使用的单一时期模型在高寒草地植物地上生物量的估算中可能引入较大误差。未来的高寒草地地上生物量估算研究应该注重地上生物量和NDVI的季节动态变化, 构建更为准确的生长季不同时期经验模型。
4 总结
基于近地遥感(物候相机和手持式光谱仪)和野外调查数据, 本研究发现近地遥感能够有效用于高寒草地地上生物量的估算, 且能够提供高频率、高质量的植被生长信息。因此, 建立“地面-近地遥感-卫星遥感”的立体观测结构将有助于地上生物量季节动态的准确估算。另外, 本研究也发现较之于单一时期建模, 生长季不同时期建模能够有效提高地上生物量季节动态的估算效率。因此, 未来的研究应该关注不同季节的时间序列数据, 从而实现提高生物量动态估算的准确性。本研究结果将为准确评估高寒草地生产力提供理论基础, 有助于草地资源的科学利用和农牧区生态建设与环境保护管理。
参考文献
Improved monitoring of vegetation dynamics at very high latitudes: a new method using MODIS NDVI
.DOI:10.1016/j.rse.2005.10.021 URL [本文引用: 1]
Remote sensing of larch phenological cycle and analysis of relationships with climate in the Alpine region
.
Assessment of past, present and future environmental changes on the Tibetan Plateau
.
青藏高原环境变化科学评估: 过去、现在与未来
.
Progress in remote sensing phenological research
.
遥感物候学研究进展
.
Aboveground biomass in the North Tibet and estimate model using remote sensing data
.
藏北草地地上生物量及遥感监测模型研究
.
Aboveground biomass estimate methods of grassland in the Central Tibet
.
西藏高原中部草地地上生物量遥感估算方法
.
Timing of climate variability and grassland productivity
.
Review of influencing factors of accuracy of plant phenology monitoring based on remote sensing data
.
植物物候遥感监测精度影响因素研究综述
.
NDVI derived from near-infrared-enabled digital cameras: applicability across different plant functional types
.DOI:10.1016/j.agrformet.2017.11.003 URL [本文引用: 1]
Monitoring of above-ground biomass in alpine grassland based on agricultural digital camera and MODIS remote sensing data: a case study in the Yellow River Headwater Region
.
基于ADC和MODIS遥感数据的高寒草地地上生物量监测研究——以黄河源区为例
.
A test of the generality of leaf trait relationships on the Tibetan Plateau
.DOI:10.1111/nph.2006.170.issue-4 URL [本文引用: 1]
Overview of the radiometric and biophysical performance of the MODIS vegetation indices
.DOI:10.1016/S0034-4257(02)00096-2 URL [本文引用: 1]
Remote sensing-based biomass estimation and its spatio-temporal variations in temperate grassland, northern China
.DOI:10.3390/rs6021496 URL [本文引用: 2]
Remote sensing dynamic estimation of grass production in Xilinguole, Inner Mongolia
.DOI:10.1360/052011-228 URL [本文引用: 1]
内蒙古锡林郭勒盟草原产草量动态遥感估算
.
Later springs green-up faster: the relation between onset and completion of green-up in deciduous forests of North America
.
DOI:10.1007/s00484-018-1564-9
PMID:29855702
[本文引用: 1]

In deciduous forests, spring leaf phenology controls the onset of numerous ecosystem functions. While most studies have focused on a single annual spring event, such as budburst, ecosystem functions like photosynthesis and transpiration increase gradually after budburst, as leaves grow to their mature size. Here, we examine the "velocity of green-up," or duration between budburst and leaf maturity, in deciduous forest ecosystems of eastern North America. We use a diverse data set that includes 301 site-years of phenocam data across a range of sites, as well as 22 years of direct ground observations of individual trees and 3 years of fine-scale high-frequency aerial photography, both from Harvard Forest. We find a significant association between later start of spring and faster green-up: - 0.47 ± 0.04 (slope ± 1 SE) days change in length of green-up for every day later start of spring within phenocam sites, - 0.31 ± 0.06 days/day for trees under direct observation, and - 1.61 ± 0.08 days/day spatially across fine-scale landscape units. To explore the climatic drivers of spring leaf development, we fit degree-day models to the observational data from Harvard Forest. We find that the default phenology parameters of the ecosystem model PnET make biased predictions of leaf initiation (39 days early) and maturity (13 days late) for red oak, while the optimized model has biases of 1 day or less. Springtime productivity predictions using optimized parameters are closer to results driven by observational data (within 1%) than those of the default parameterization (17% difference). Our study advances empirical understanding of the link between early and late spring phenophases and demonstrates that accurately modeling these transitions is important for simulating seasonal variation in ecosystem productivity.
Multi-factor modeling of above-ground biomass in alpine grassland: a case study in the Three-River Headwaters Region, China
.DOI:10.1016/j.rse.2016.08.014 URL [本文引用: 1]
A review of grassland biomass research in China
.
我国草地生物量研究概述
.
Application of near-surface remote sensing in monitoring the dynamics of forest canopy phenology
.
近地遥感在森林冠层物候动态监测中的应用
.
Monitoring coniferous forest biomass change using a Landsat trajectory-based approach
.DOI:10.1016/j.rse.2013.08.010 URL [本文引用: 1]
Impact of climate change on grassland production and soil carbon worldwide
.DOI:10.1111/gcb.1995.1.issue-1 URL [本文引用: 1]
Monitoring vegetation phenology using an infrared-enabled security camera
.
Changes in biomass carbon stocks in Chinaʼs grasslands between 1982 and 1999
.DOI:10.1029/2005GB002634 [本文引用: 1]
Plant phenology and global climate change: current progresses and challenges
.DOI:10.1111/gcb.2019.25.issue-6 URL [本文引用: 1]
Estimating net primary productivity from grassland biomass dynamics measurements
.DOI:10.1046/j.1365-2486.2002.00512.x URL [本文引用: 1]
Plant phenological responses to climate change on the Tibetan Plateau: research status and challenges
.DOI:10.1093/nsr/nwv058 URL [本文引用: 1]
Digital repeat photography for phenological research in forest ecosystems
.DOI:10.1016/j.agrformet.2011.09.009 URL [本文引用: 2]
Alpine grassland plants grow earlier and faster but biomass remains unchanged over 35 years of climate change
.
DOI:10.1111/ele.13474
PMID:32052555
[本文引用: 2]
Satellite data indicate significant advancement in alpine spring phenology over decades of climate warming, but corresponding field evidence is scarce. It is also unknown whether this advancement results from an earlier shift of phenological events, or enhancement of plant growth under unchanged phenological pattern. By analyzing a 35-year dataset of seasonal biomass dynamics of a Tibetan alpine grassland, we show that climate change promoted both earlier phenology and faster growth, without changing annual biomass production. Biomass production increased in spring due to a warming-induced earlier onset of plant growth, but decreased in autumn due mainly to increased water stress. Plants grew faster but the fast-growing period shortened during the mid-growing season. These findings provide the first in situ evidence of long-term changes in growth patterns in alpine grassland plant communities, and suggest that earlier phenology and faster growth will jointly contribute to plant growth in a warming climate.© 2020 The Authors. Ecology Letters published by CNRS and John Wiley & Sons Ltd.
A review of forest biomass models
.
森林生物量模型综述
.
From AVHRR-NDVI to MODIS-EVI: advances in vegetation index research
.
植被指数研究进展: 从AVHRR-NDVI到MODIS-EVI
.
Interpreting canopy development and physiology using a European phenology camera network at flux sites
.DOI:10.5194/bg-12-5995-2015 URL [本文引用: 1]
Review of advances in vegetation phenology monitoring by remote sensing
.
植被物候遥感监测研究进展
.
MODIS-based remote-sensing monitoring of the spatiotemporal patterns of China’s grassland vegetation growth
.DOI:10.1080/01431161.2012.762696 URL [本文引用: 1]
Experimentally simulating warmer and wetter climate additively improves rangeland quality on the Tibetan Plateau
.DOI:10.1111/jpe.2018.55.issue-3 URL [本文引用: 2]
Vegetation structure constrains primary production response to water availability in the Patagonian Steppe
.Grassland aboveground net primary production (ANPP) increases linearly with precipitation in space and time, but temporal models relating time series of ANPP and annual precipitation for single sites show lower slopes and regression coefficients than are shown by spatial models. The analysis of several ANPP time series showed lags in the ecosystem response to increased water availability, which may explain the difference between spatial and temporal models. The lags may result from constraints that ecosystems experience after drought. Our objective was to explore the structural constraints of the ANPP response to rainfall variability in a semiarid ecosystem, the Patagonian steppe, in southern Argentina. We designed a 3-yr rainfall manipulation experiment where we decreased water input with rainout shelters during two consecutive years, which included three levels of rainfall interception (30%, 55%, and 80%) and a control. In the third year, we irrigated one-half of the plots of each rainfall-interception treatment. We evaluated the immediate effects of drought on current-year ANPP and the effects of previous-year drought on vegetation recovery after water supplementation. ANPP (g x m(-2) x yr(-1)) was linearly related to annual precipitation input (APPT; mm/yr) along the experimental precipitation gradient (ANPP = 0.13 x APPT + 58.3; r2 = 0.34, P < 0.01), and this relationship was mostly accounted for by changes in the ANPP of grasses. Plant density (D; no. individuals/mm2) was related to the precipitation received during the drought period (D = 0.11 x APPT + 18; r2 = 0.39, P < 0.05). The recovery of plants after irrigation was lower for those plots that had experienced experimental drought the previous years relative to controls, and the lags were proportional to the intensity of drought. Therefore, our results suggest that the density of plants may constrain the recovery of vegetation after drought, and these constraints may determine lags that limit the capacity of the ecosystem to take advantage of wet years after dry years.
Analyses on MODIS-NDVI index saturation in northwest China
.
西北地区MODIS-NDVI指数饱和问题分析
.
Temporal and spatial dynamics of alpine grassland biomass in the Three-River Headwater Region
.
三江源地区高寒草地地上生物量时空动态变化
.
Ecological processes in alpine ecosystems under changing environment
.DOI:10.17521/cjpe.2018.0048 URL [本文引用: 1]
全球变化背景下的高寒生态过程
.
Application of synthetic NDVI time series blended from Landsat and MODIS data for grassland biomass estimation
.DOI:10.3390/rs8010010 URL [本文引用: 1]
Assessment of above-ground biomass of grassland using remote sensing, Yili, Xinjiang
.
新疆伊犁地区草地植被地上生物量遥感反演
.
Estimation model of aboveground biomass in the Northern Tibet Plateau based on remote sensing date
.
藏北典型高寒草甸地上生物量的遥感估算模型
.
Improving forest aboveground biomass estimation using seasonal Landsat NDVI time-series
.DOI:10.1016/j.isprsjprs.2014.08.014 URL [本文引用: 2]
