


气候变化对生态环境的影响是众多专家学者关注的热点问题(Cook et al., 2014; Shi et al., 2016)。气候变化不仅包括平均值的变化, 还包括极端气候的变化(Fischer & Knutti, 2015)。
极端温度事件的发生随着气候变暖发生了显著的变化(Donat et al., 2013)。在全球大部分地区, 极端暖事件逐渐增多, 极端冷事件逐渐减少(Boccolari & Malmusi, 2013; Keggenhoff et al., 2014; Tong et al., 2019)。例如, 1961-2015年期间, 兴都库什-喜马拉雅地区的极端冷事件显著减少, 极端暖事件显著增多(Sun et al., 2017); 2000-2010年蒙古高原冬季极端严寒事件频发(John et al., 2013); 中国西北地区呈现暖化趋势(Deng et al., 2014); Qin等(2015)在其研究中指出, 1960-2009年间中国西南部地区呈暖化趋势。
极端降水的变化具有区域差异性。例如, 在北半球的中高纬度地区, 极端降水事件增加(Alexander et al., 2006); 伊朗大多数地区的极端降水值、降水强度和降水频率都有明显的增加趋势(Rahimi & Fatemi, 2019); 印度极端降水事件呈现增多的趋势(Ali & Mishra, 2018)。武文博等(2016)就中国1961-2012年间的极端降水指数展开讨论, 指出极端降水指数从2000年开始呈现增加的趋势; 而1982-2015年期间内蒙古春夏的1日最大降水量和5日最大降水量呈现下降趋势, 但并不显著(Ying et al., 2020); 1962-2012年间中国西南部地区年极端降水事件呈现增多趋势(袁文德等, 2014), 而王昊(2019)的研究则表示, 1971-2013年间云南、广西和贵州交界处呈现偏干的趋势。综上, 不难发现极端气候变化存在不确定性, 还需要进行更多的探究。
气候变化对植被的影响一直是众多学者关注的热点(徐浩杰和杨太保, 2014; 刘丹和于成龙, 2017), 而近些年来, 极端气候对生态系统影响的研究越来越受到重视。2003年欧洲热浪对欧洲生态系统造成了严重影响, 使其初级生产力下降了大约30% (Ciais et al., 2005), 但在美国和欧洲一些地区, 日最高气温的升高使得植被展叶提前(Piao et al., 2015); 鄱阳湖地区极端温度在月尺度上对植被生长影响显著(Tan et al., 2015); 青藏高原地区植被对5月发生的极端温度事件响应敏感(Liu et al., 2019)。极端降水有助于蒙古高原植被生长(Li et al., 2018a), 在内蒙古地区, 年尺度上植被生长对极端降水敏感(Li et al., 2018b); 而黄土高原地区的植被在季节尺度上对极端降水事件响应强烈(Zhao et al., 2018); Yao等(2018)在研究中提到, 极端降水对新疆植被的影响分为两个阶段, 在1982-2010年期间, 极端降水对植被覆盖的影响不太强烈, 在1998年之后, 植被生长对于极端降水的响应加强。极端气候事件对农业发展也存在影响, 有学者发现, 极端温度的升高会降低农作物的产量(Hatfield & Prueger, 2015; Lesk et al., 2016)。因此进行极端气候对生态系统影响的研究, 对探究未来生态系统的变化具有重要的意义。
中国西南部地区(84°-112° E, 21.25°-36.5° N)包括广西、贵州、云南、重庆、四川、青海南部以及西藏东部, 地势起伏, 包含高原、丘陵、盆地等地形, 同时分布有喀斯特地区以及干热河谷等特殊地带(Lian et al., 2015), 生态系统多样。西南部地区处于季风交汇区, 气候类型多样, 包括热带季风气候、亚热带季风气候、高原山地气候等。由于特殊的地理位置, 西南部地区的陆地生态系统易受到气候变化的影响(何敏等, 2019)。目前越来越多的研究着眼于探讨气候变化背景下西南部地区的植被变化, 但有关极端气候对于西南部地区植被影响的研究较少, 因此, 本研究将进一步探究西南部地区植被对于极端气候事件的响应, 以期为西南部地区的生态修复工程以及可持续发展提供一定的科学依据。
1 材料和方法
1.1 数据来源
归一化植被指数(NDVI)为美国国家航空航天局(NASA)发布的GIMMS NDVI 3g V1.0数据(
气候数据来源于CN05.1格点化气候数据(吴佳和高学杰, 2013)。该数据包含日最高气温、日最低气温、日平均气温以及日降水量4个变量, 数据空间分辨率为0.25° × 0.25°。本研究利用1961年1月1日至2016年12月31日的气候数据, 计算了1961-2016年的极端气候指数。为了与NDVI的研究时长对应, 极端气候数据选取的时间长度为1982-2015年。
1.2 研究方法
世界气象组织委员会(WMO)为了有效推动世界对极端气候事件的研究, 定义了27个极端指数(李红梅和李林, 2015), 现已广泛应用于国内外极端气候研究中(Chen et al., 2019; Fallah-Ghalhari et al., 2019)。这27个指数包含16个极端温度指数以及11个极端降水指数(表1)。
表1 极端气候指数的选择及定义
Table 1
| 气候指数 Climate variables | 缩写(单位) Abbreviation (Units) | 定义 Definition |
|---|---|---|
| 年平均气温 Mean annual air temperature | TM (℃) | 日平均气温的年平均值 Yearly mean value of daily mean air temperature |
| 日最高气温的最大值 Maximum value of daily maximum air temperature | TXx (℃) | 日最高气温的年最大值 Yearly maximum value of daily maximum air temperature |
| 暖昼日数 Warm days | TX90 (d) | 日最高气温>90%分位值的日数 Number of days when daily maximum air temperature >90th percentile |
| 夏季日数 Summer days | SU (d) | 日最高气温大于25 ℃的全部天数 Annual count of days when daily maximum air temperature >25 °C |
| 日最高气温的最小值 Minimum value of daily maximum air temperature | TXn (℃) | 日最高气温的年最小值 Yearly minimum value of daily maximum air temperature |
| 冷昼日数 Cool days | TX10 (d) | 日最高气温<10%分位值的日数 Number of days when daily maximum air temperature <10th percentile |
| 冰冻日数 Icing days | ID (d) | 日最高气温<0 ℃的全部天数 Annual count of days when daily maximum air temperature <0 °C |
| 日最低气温的最大值 Maximum value of daily minimum air temperature | TNx (℃) | 日最低气温的年最大值 Yearly maximum value of daily minimum air temperature |
| 暖夜日数 Warm nights | TN90 (d) | 日最低气温>90%分位值的日数 Number of days when daily minimum air temperature >90th percentile |
| 热带夜数 Tropical nights | TR (d) | 日最低气温大于20 ℃的全部天数 Annual count of days when daily minimum air temperature >20 °C |
| 日最低气温的最小值 Minimum value of daily minimum air temperature | TNn (℃) | 日最低气温的年最小值 Yearly minimum value of daily minimum temperature |
| 冷夜日数 Cool nights | TN10 (d) | 日最低气温<10%分位值的日数 Number of days when daily minimum air temperature <10th percentile |
| 霜冻日数 Frost days | FD (d) | 日最低气温小于0 ℃的全部天数 Annual count of days when daily minimum air temperature <0 °C |
| 持续冷期指数 Cold spell duration index | CSDI (d) | 至少连续6天最低气温小于基准期内10%分位值的天数 Annual count of days with at least 6 consecutive days when daily minimum air temperature <10th percentile |
| 持续暖期指数 Warm spell duration index | WSDI (d) | 至少连续6天最高气温大于基准期内90%分位值的天数 Annual count of days with at least 6 consecutive days when daily maximum air temperature >90th percentile |
| 生长季长度 Growing season length | GSL (d) | 第一次连续6天以上日平均气温大于5 ℃至第一次(6月1日后)连续6天日平均气温小于5 ℃的天数 Annual count between first span of at least 6 days with daily mean air temperature >5 °C and first span after June 1st of 6 days with daily mean air temperature <5 °C |
| 气温日较差 Diel temperature range | DTR (℃) | 日最高气温与最低气温的差的平均值 Yearly mean difference between daily maximum air temperature and daily minimum air temperature |
| 年降水量 Annual precipitation | PRE (mm) | 年总降水量 Total annual precipitation |
| 湿日总降水量 Annual total precipitation on wet days | PRCPTOT (mm) | 大于等于1 mm的日降水量的总和 Annual total precipitation on wet days (daily precipitation ≥1 mm) |
| 强降水量 Precipitation amount on very wet days | R95 (mm) | 大于基准期内95%分位点的日降水量的总和 Annual total precipitation on days when daily precipitation >95th percentile |
| 极端强降水量 Precipitation amount on extremely wet days | R99 (mm) | 大于基准期内99%分位点的日降水量的总和 Annual total precipitation on days when daily precipitation >99th percentile |
| 降水强度 Simple daily intensity index for precipitation | SDII (mm·d-1) | 降水量与降水日数的比值 Annual total precipitation divided by the number of wet days (defined as daily precipitation ≥1.0 mm) in the year |
| 1日最大降水量 Maximum 1-day precipitation | Rx1day (mm) | 最大的日降水量 Yearly maximum value of daily precipitation |
| 5日最大降水量 Maximum 5-day consecutive precipitation | Rx5day (mm) | 最大的连续5天降水量 Yearly maximum 5-day consecutive precipitation |
| 连续湿日数 Consecutive wet days | CWD (d) | 最长连续降水日数 Yearly maximum number of consecutive days with a daily precipitation ≥1 mm |
| 连续干日数 Consecutive dry days | CDD (d) | 最长连续无降水日数 Yearly maximum number of consecutive days with daily precipitation <1 mm |
| 降水日数 Number of wet days | R1mm (d) | 日降水量≥1 mm的天数 Number of days when daily precipitation ≥1 mm |
| 中雨日数 Number of heavy precipitation days | R10mm (d) | 日降水量≥10 mm的天数 Annual count of days when daily precipitation ≥10 mm |
| 大雨日数 Number of very heavy precipitation days | R20mm (d) | 日降水量≥20 mm的天数 Annual count of days when daily precipitation ≥20 mm |
本文选用27个极端气候指数, 运用趋势分析法、Pearson相关性分析方法来探究西南部地区植被对极端气候事件的响应。目前, 植被对极端气候事件响应的研究大多采取了使用原始数据直接相关的方法(Na et al., 2018; Zhao et al., 2018; Luo et al., 2020), 然而不可否认的是, 使用原始数据直接进行简单相关分析, 混淆了多种因素(而不只是极端气候)对植被的影响。为了降低这些因素对结果的影响, 本研究加入了年平均气温和年降水量这两个变量, 与植被对极端气候指数的响应进行对比。同时, 还对极端气候指数和植被NDVI进行去趋势处理, 计算去趋势后的极端气候指数与NDVI的相关性。
1.2.1 突变分析
利用Pettitt (1979)检验判断西南部地区植被NDVI的突变时间。计算Mann-Whitney统计量Ut,n的公式如下:
式中, xt和xj为第t、j个时序样本, n为数据资料长度。
定义统计量kt, 当t时刻满足:
则t时刻很可能是突变点,对t时刻进行显著性检验, 定义显著性检验统计量为pt:
$P_{t}=2exp[-6k^{2}_{t}/(n^{3}+n^{2})]$
若pt ≤ 0.05, 则认为突变点t具有统计学意义。
1.2.2 一阶差分法
植被的生长和发育受气候和非气候因素(人类活动)的交互影响, 去趋势从统计上去除了长期变化的复杂影响(Tao et al., 2008; 王柳等, 2014; Lu et al., 2017), 可将植被和气候的年际变化与非气候因素的长期变化解耦(Anderson et al., 2012; Iler et al., 2017)。一阶差分是去趋势的主要方法(徐向英, 2019), 常用于评估气候因素对植被的影响, 可在一定程度上减小人类活动对植被生长发育的影响(史文娇等, 2012; 王柳等, 2014), 被广泛应用(任庆民, 1984; Nicholls, 1997)。公式如下:
式中, $\hat{y}’_{i}$d为第i年气象因素对植被的影响, yi为第i年植被实际增长量。
1.2.3 相关性分析法
利用Pearson相关系数法, 计算NDVI与极端气候指数之间的相关系数(r), 公式如下:
式中, xi为第i年极端气候指数,yi为第i年NDVI,$\bar{x}$为极端气候指数的年平均值, ,$\bar{y}$为NDVI的年平均值。
2 结果和分析
2.1 西南部地区植被NDVI的动态变化
西南部地区植被NDVI在空间上表现为东高西低(图1A), 其中, NDVI的高值(0.8-0.9)主要集中在云南南部地区以及西藏的东南部地区, 低值(0-0.1)集中在青藏高原的西北部地区。图1B为西南部地区区域平均NDVI的变化趋势, 从图中可以看出, 西南部地区1982-2015年间NDVI的最低值出现在1983年(0.445), 最高值出现在2013年(0.477), 西南部地区区域平均NDVI在1982-2015年间呈现显著上升的趋势(每10年0.006, p < 0.001)。为进一步了解西南部地区植被NDVI的变化, 对其进行突变分析, 结果表明西南部地区NDVI在1994年发生了突变, 1994年以前NDVI上升不显著, 1994年以后NDVI呈现显著增加的趋势(p < 0.05), 增加速率为每10年0.005。Hou等(2015)发现西南喀斯特地区的NDVI也在1994年发生了变化。1959-1993年期间, 有5个时间段西南部地区旱灾频繁发生且时间最长(刘建刚等, 2011), 即在1994年以前西南部地区频繁发生的旱灾可能是植被活动不强的原因。
图1
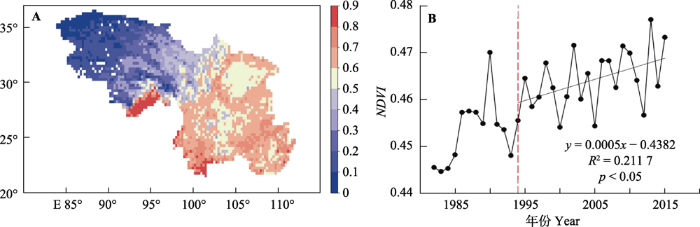
图1
1982-2015年中国西南部地区归一化植被指数(NDVI)多年平均空间分布(A)和区域平均多年变化(B)。
Fig. 1
Spatial pattern of mean annual normalized differential vegetation index (NDVI)(A) and inter-annual variations in regional average NDVI (B) in southwestern China from 1982 to 2015.
1982-2015年西南部地区105° E以东的NDVI以显著增长为主要变化, 以西虽也以显著增长为主要表现, 但增长速率较低(图2A)。NDVI在青藏高原中部地区(90°-95° E, 26°-35° N)的北部呈现显著增长趋势, 但增长速率较低, 南部表现为显著负增长, 与蒋元春等(2020)在同一区域、同一时间段内生长季NDVI的变化相反。蒋元春等(2020)是对生长季NDVI的变化进行探究, 而本研究则是在年尺度上对NDVI的变化进行探究, 这可能是产生差异的原因。1982-1993年西南部地区植被NDVI在空间上主要呈现显著增加的趋势(图2B)。
图2
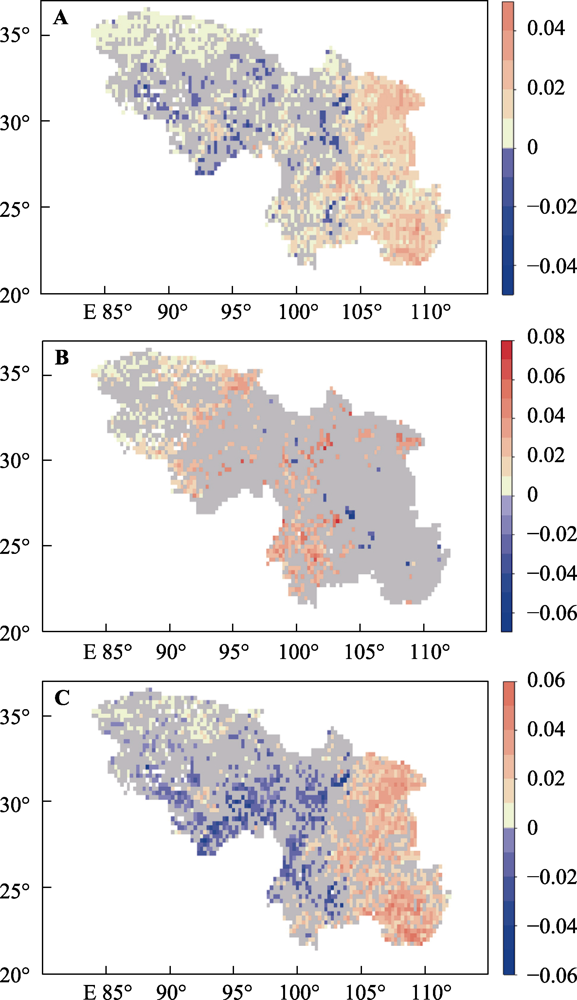
图2
1982-2015 (A)、1982-1993 (B)和1994-2015年(C)中国西南部地区归一化植被指数(NDVI)变化趋势的空间分布。灰色表示未通过显著性检验(p > 0.05)。
Fig. 2
Spatial patterns of changes in normalized differential vegetation index (NDVI) in southwestern China during periods 1982-2015 (A), 1982-1993 (B) and 1994-2015 (C). Gray-coded areas are where no significant changes in NDVI were detected (p > 0.05).
1994-2015年间, 105° E以东的NDVI整体表现为显著增加的趋势(图2C), 这与1982-2015年间105° E以东的NDVI变化类似, 不同的是, 1994-2015年的NDVI增长速率比1982-2015年的增长速率大。而在105° E以西, 四川中部和西部、云南中部和西北部、喜马拉雅山脉东部、山南错那县南部、林芝察隅县和墨脱县南部的NDVI的变化趋势以显著下降为主, 这与1982-2015年和1982-1993年NDVI的变化存在差异。彭文甫等(2019)在其研究中指出, 2000-2015年NDVI减少的区域主要集中在川西北高原和成都平原; 2000-2016年云南植被覆盖减少的区域主要在中部的大理、玉溪和昆明等迅速发展的城市以及西北部的高海拔地区(何云玲等, 2019); 喜马拉雅山脉东部的植被在2001-2015年间退化较为严重(马磊等, 2017); 山南错那县的植被覆盖在2002-2013年间呈下降趋势(白淑英等, 2015); 1983-2012年林芝察隅县因人类活动和自然因素导致森林资源减少较多, 墨脱县则以耕地资源减少为主(魏梦莹, 2018)。
2.2 西南部地区区域平均极端气候事件的变化特征
正如之前提到的, 西南部地区区域平均植被NDVI在1994年发生突变, 1982-2015、1982-1993和1994-2015年区域平均NDVI的变化和其在空间上的变化存在差异, 因此本节将探究1982-2015、1982- 1993和1994-2015年极端气候事件的变化是否也存在不同。
表2为西南部地区区域平均极端气候指数变化趋势。1982-2015年间, 极端降水指数均变化不显著, 极端温度指数除日最高气温最小值(TXn)和气温日较差(DTR)外, 其他指数均变化显著, 日最高气温最大值(TXx)、日最低气温最大值(TNx)、日最低气温最小值(TNn)显著增高; 暖昼日数(TX90)、暖夜日数(TN90)、夏季日数(SU)和热带夜数(TR)分别以每10年6.840、9.127、3.387和1.753 d的速率显著增加; 冷昼日数(TX10)、冷夜日数(TN10)、冰冻日数(ID)和霜冻日数(FD)则以每10年6.077、6.239、3.338和5.374 d的速率显著下降; 持续暖期指数(WSDI)以每10年0.950 d的速率显著增加, 持续冷期指数(CSDI)以每10年0.807 d的速率显著减少, 生长季长度(GSL)以每10年4.316 d的速率显著增加。
表2 1982-2015、1982-1993和1994-2015年中国西南部地区区域平均极端气候指数的变化趋势
Table 2
| 气候指数 Climate variables | 气候指数变化趋势(每10年) Trends of climate indicators (per 10 a) | ||
|---|---|---|---|
| 1982-2015 | 1982-1993 | 1994-2015 | |
| TM (℃) | 0.375** | 0.221 | 0.368** |
| TXx (℃) | 0.305** | -0.243 | 0.248 |
| TX90 (d) | 6.840** | -1.209 | 8.914** |
| SU (d) | 3.387** | 0.671 | 4.129** |
| TXn (℃) | 0.262 | 0.391 | -0.099 |
| TX10 (d) | -6.077** | -4.626 | -5.243 |
| ID (d) | -3.338** | -3.583 | -3.795** |
| TNx (℃) | 0.359** | 0.356 | 0.486** |
| TN90 (d) | 9.127** | 6.265 | 10.896** |
| TR (d) | 1.753** | -1.061 | 2.159** |
| TNn (℃) | 0.462** | 0.660 | 0.287 |
| TN10 (d) | -6.239** | -5.590 | -4.777* |
| FD (d) | -5.374** | -4.716 | -4.468** |
| CSDI (d) | -0.807* | -1.164 | -1.058 |
| WSDI (d) | 0.950** | -0.620 | 1.012 |
| GSL (d) | 4.316** | 0.273 | 3.482** |
| DTR (℃) | -0.005 | -0.085 | 0.012 |
| PRE (mm) | 0.699 | -21.112 | -11.668 |
| PRCPTOT (mm) | 2.825 | -20.346 | -6.832 |
| R95 (mm) | 2.461 | -17.008 | -3.946 |
| R99 (mm) | 1.567 | -13.383 | 5.835 |
| SDII (mm·d-1) | 0.014 | -0.068 | -0.041 |
| Rx1day (mm) | 0.623 | -1.490 | 1.752* |
| Rx5day (mm) | 0.652 | -3.921 | 1.102 |
| CWD (d) | 0.141 | 0.745 | -0.042 |
| CDD (d) | -0.603 | -5.610 | 3.480* |
| R1mm (d) | -0.002 | 0.454 | -1.947 |
| R10mm (d) | -0.215 | -1.307 | -0.702 |
| R20mm (d) | 0.092 | -0.724 | -0.088 |
气候指数含义参照
Definitions of climate variables see
1982-1993年间年平均气温(TM)、年降水量(PRE)和极端气候指数的变化都不显著。1994-2015年间TNx显著增加, 暖指数(TX90、SU、TN90、TR)也呈现显著增加的趋势, 而冷指数(TN10、ID、FD)则呈现显著降低的趋势, GSL以每10年3.482 d的速率显著增加。极端降水指数仅有1日最大降水量(Rx1day)和最长连续干日数(CDD)呈现显著增长的趋势, 其他极端降水指数变化不显著, 即1994-2015年间西南部地区单日降水量在增加, 但同时连续无降水日在延长。
1982-2015和1994-2015年两个时段都表现为暖指数(TX90、TN90、SU、TR)显著上升, 冷指数(TN10、ID、FD)显著降低, TXn和DTR变化不显著。刘琳和徐宗学(2014)指出, 在1951-2010年期间, 西南部5省(区)市的TX90上升不显著, TN90显著上升, TX10、TN10和DTR显著降低, 其结果与本研究存在差异, 这些差异可能是由研究区域和研究时长不一致引起的。
与1982-2015年对比, 1994-2015年期间TNx、TX90、SU、TN90、TR以及ID的变化速率更大。1982-2015和1994-2015年TNx的增长速率分别为每10年0.359、0.486 ℃, TX90的增长速率分别为每10年6.840和8.914 d, SU的增长速率分别为每10年3.387和4.129 d, TN90的增长速率分别为每10年9.127、10.896 d, TR的增长速率分别为每10年1.753、2.159 d, 1982-2015年期间ID以每10年3.338 d的速率在减少, 1994-2015年期间ID的减少速率为每10年3.795 d。相对于1982-2015年, 植被NDVI发生突变后, 西南部地区的极端暖事件发生的天数增加、程度加强, 0 ℃以下的日数减少。Zhou等(2019)在其研究中提到, 在中国东部南北样带, 大部分植被活动的增强可能与极端暖事件的增多和极端冷事件的减少有关, 1994年以后西南部地区植被活动增强可能也与极端暖事件的频发和极端冷事件的减少有关。
2.3 西南部地区植被NDVI对极端气候事件的响应
为探究植被对极端气候事件的响应, 将NDVI与极端气候指数进行相关性分析。同时, 为了进一步评价西南部地区植被NDVI对极端气候事件的响应程度, 还对极端气候指数和NDVI进行去趋势处理, 在此基础上对去趋势后的极端气候指数与NDVI进行Pearson相关性分析, 深入探究植被NDVI对极端气候事件的响应。
表3为1982-2015、1982-1993和1994-2015年去趋势前后极端气候指数与NDVI的相关性分析结果。去趋势前, 1982-2015年间极端降水指数仅Rx1day与NDVI显著相关(p < 0.05), 相关系数为0.366, 即西南部地区植被对单日强降水有积极的响应, 这与冯磊等(2020)在其研究中得出的结论类似。极端温度指数除DTR之外, 其他极端温度指数和年平均气温都与NDVI显著相关, 年平均气温与NDVI的相关性最强, 相关系数为0.743。TXx、TNx、TNn和TXn与NDVI显著正相关(0.547、0.544、0.622、0.395), 极端暖指数(TX90、SU、TN90、TR)与NDVI呈现显著正相关的关系, 极端冷指数(TX10、ID、TN10、FD)与NDVI显著负相关, CSDI与NDVI显著负相关(-0.342), WSDI和GSL与NDVI显著正相关(0.481, 0.695)。1982-1993年间极端降水指数和年降水量与NDVI的相关性都不显著, TNn与NDVI显著正相关(0.600), TN10与NDVI显著负相关(-0.606)。1994- 2015年间, Rx1day与NDVI显著正相关, R1mm与NDVI显著负相关, TM与NDVI显著正相关, TNx、TX90、SU、GSL和DTR与NDVI显著正相关, TX10、ID、TN10和FD与NDVI显著负相关。1994-2015年间, 年平均气温与NDVI的相关系数为0.589, 而SU和DTR与NDVI的相关系数分别为0.648、0.617, TM与NDVI的相关系数低于SU和DTR与NDVI的相关系数。可以发现在1994年以后, 植被对年平均气温的响应弱于其对暖指数的响应, 冯磊(2020)也发现, 在川渝地区, 2000-2018年间, NDVI与年平均气温的相关系数低于其与暖指数的相关系数。
表3 1982-2015、1982-1993和1994-2015年中国西南部地区去趋势前后区域平均尺度上极端气候指数与归一化植被指数(NDVI)的相关性
Table 3
| 气候指数 Climate variables | 1982-2015 | 1982-1993 | 1994-2015 | |||
|---|---|---|---|---|---|---|
| 去趋势前 Before data detrending | 去趋势后 After data detrending | 去趋势前 Before data detrending | 去趋势后 After data detrending | 去趋势前 Before data detrending | 去趋势后 After data detrending | |
| TM (℃) | 0.743** | 0.348* | 0.536 | 0.154 | 0.589** | 0.408 |
| TXx (℃) | 0.547** | 0.357* | 0.193 | 0.213 | 0.400 | 0.449* |
| TX90 (d) | 0.638** | 0.504** | 0.291 | 0.382 | 0.533* | 0.552** |
| SU (d) | 0.692** | 0.437* | 0.056 | 0.003 | 0.648** | 0.546* |
| TXn (℃) | 0.395* | 0.255 | 0.482 | 0.566 | 0.131 | 0.119 |
| TX10 (d) | -0.670** | -0.346* | -0.586 | 0.475 | -0.460* | -0.288 |
| ID (d) | -0.616** | -0.241 | -0.299 | -0.040 | -0.522* | -0.348 |
| TNx (℃) | 0.662** | 0.022 | 0.382 | -0.388 | 0.524* | 0.222 |
| TN90 (d) | 0.551** | -0.100 | 0.098 | -0.459 | 0.364 | 0.037 |
| TR (d) | 0.496** | -0.087 | -0.063 | -0.046 | 0.318 | -0.106 |
| TNn (℃) | 0.544** | 0.298 | 0.600* | 0.634* | 0.164 | 0.114 |
| TN10 (d) | -0.688** | -0.329 | -0.606* | -0.414 | -0.448* | -0.312 |
| FD (d) | -0.710** | -0.075 | -0.487 | 0.253 | -0.470* | -0.219 |
| CSDI (d) | -0.342* | -0.038 | -0.531 | -0.320 | -0.106 | 0.062 |
| WSDI (d) | 0.481** | 0.229 | 0.230 | 0.260 | 0.287 | 0.234 |
| GSL (d) | 0.695** | 0.242 | 0.522 | 0.176 | 0.482* | 0.273 |
| DTR (℃) | 0.283 | 0.670** | 0.015 | 0.494 | 0.617** | 0.749** |
| PRE (mm) | 0.033 | -0.028 | -0.128 | 0.043 | -0.024 | -0.063 |
| PRCPTOT (mm) | 0.071 | -0.011 | -0.118 | 0.043 | 0.024 | -0.035 |
| R95 (mm) | 0.132 | 0.049 | -0.219 | -0.041 | 0.156 | 0.081 |
| R99 (mm) | 0.209 | 0.154 | -0.038 | 0.029 | 0.355 | 0.191 |
| SDII (mm·d-1) | 0.164 | 0.044 | -0.026 | 0.016 | 0.133 | 0.053 |
| Rx1day (mm) | 0.366* | 0.281 | -0.038 | 0.117 | 0.522* | 0.320 |
| Rx5day (mm) | 0.144 | 0.046 | -0.437 | -0.265 | 0.294 | 0.147 |
| CWD (d) | -0.009 | -0.267 | 0.029 | -0.321 | -0.125 | -0.252 |
| CDD (d) | -0.122 | -0.022 | -0.355 | -0.307 | 0.342 | 0.113 |
| R1mm (d) | -0.103 | -0.243 | 0.022 | -0.087 | -0.455* | -0.354 |
| R10mm (d) | -0.016 | 0.100 | -0.213 | 0.158 | 0.037 | 0.077 |
| R20mm (d) | 0.156 | 0.161 | -0.368 | 0.195 | 0.192 | 0.150 |
气候指数含义参照
Definitions of climate variables see
对比1982-2015和1994-2015年两个时段, 可以发现大多数指数在1994-2015年段与NDVI的相关性减弱(相关系数降低), 仅有DTR与NDVI的相关性由不显著转换为显著, 且相关性很强(0.617)。
去趋势后极端降水指数和年降水量与NDVI的相关性在1982-2015、1982-1993和1994-2015年3个时段都不显著。1982-2015年去趋势后NDVI与TM、TXx、TX90、SU和DTR都呈现显著正相关的关系(0.348、0.357、0.504、0.437、0.670), 而NDVI与TX10呈现显著负相关的关系(-0.346)。去趋势后, TM与NDVI的相关系数低于TXx、TX90、SU和DTR与NDVI的相关系数。
1982-1993年去趋势后仅TNn与NDVI显著正相关(0.634)。1982-1993年间去趋势前后TNn都与NDVI显著相关, 且去趋势后TNn与NDVI的相关系数比去趋势前的相关系数高。
1994-2015年去趋势后TXx、TX90、SU和DTR与NDVI显著正相关(0.449、0.552、0.546、0.749), TM与NDVI的相关性不显著(0.408)。1994-2015年间TXx与NDVI的相关性在去趋势前为不显著正相关, 去趋势后为显著正相关。
可以发现在1982-2015和1994-2015这两个时段在去趋势前后TXx和暖指数(TX90、SU)对植被的生长具有促进作用, 冷指数(TX10)会抑制植被的生长。相对于其他指数与NDVI相关分析的结果, TXx 与NDVI的相关分析的结果较为不同, 去趋势前, 其与NDVI的相关性在1982-2015年间显著正相关, 而在1994-2015年间的相关性不显著, 但去趋势后两个时段都与NDVI显著相关。
在1982-2015年以及1994-2015年两个时段植被生长对TX90、SU去趋势前后都有积极的响应。本研究结论和Chen等(2018)以及王晓利和侯西勇(2019)分别在湖南和江淮以南水资源相对丰富的区域得出的结论类似。这可能是因为这两个地区与本研究区都属于降水充沛的地区, 高温促进水分蒸发, 能够防止植被水分过多, 避免因土壤水分过多造成缺氧, 根系呼吸作用减弱, CO2积累过多, 产生多种有毒物质, 土壤养分流失, 从而对植被生长造成不利影响。同时, 在全球CO2浓度逐年升高(何江浩等, 2020)的背景下, 在较高温度下生长的植被通常具有较高的光合能力(Hikosaka et al., 2006), 这可能是因为, 高温会增强光合酶的活性, 从而使得植被的光饱和点和光补偿点更高(Xu et al., 2018), 能够促进植被积累干物质, 从而对植被的生长起到积极作用。除此之外, 生长季前发生高温事件能够促进冰雪消融, 降低植被遭受冻害的风险, 对植被组织起到保护作用(He et al., 2018)。Inouye (2008)的研究中提到, 在生长季前发生极端低温事件会造成植被的芽死亡, 从而导致植被生长遭受不利影响。
相对于其他指数与NDVI相关分析的结果, DTR与NDVI的相关分析的结果很特殊。去趋势前, 1982-2015年间DTR与NDVI的相关性不显著, 在1994-2015年间显著正相关; 去趋势后, 两个时段DTR与NDVI的关系都为显著正相关。1994-2015年DTR与NDVI的相关系数高于1982-2015年DTR与NDVI的相关系数, 且这两个时段DTR与NDVI的相关系数都高于其他极端温度指数和年平均气温与NDVI的相关系数。即在去趋势前, DTR对植被的影响分为两个阶段, 在1982-2015年间DTR对植被的影响程度弱, 但在植被NDVI发生突变后, DTR对植被的影响加强, 且影响程度高。去趋势后, 在两个时段内DTR对植被的影响都很强, 且在1994-2015年, DTR对植被的影响更强。本研究结果与王昊(2019)在同一研究区得出的结果并不完全一致, 存在差异的原因可能与研究时长有关。DTR对植被的光合器官有着调节的作用, 能够促进植被的光合作用、降低呼吸作用, 净光合积累高(江爱良等, 1990; 吴姝等, 1998; 朱凯, 2014), 为植被的生长提供有利的条件。但过大的温差可能会不利于植被的生长(朱凯, 2014)。
根据去趋势后极端气候指数与NDVI相关分析的结果, 在1982-2015 (1994-2015)年间TM、TXx、TX90、SU、TX10以及DTR (TM、TXx、TX90、SU以及DTR)与NDVI显著相关(由于1982-1993年间去趋势后与NDVI的显著相关的极端气候指数仅有TNn, 所以不在此部分进行讨论), 为了进一步探讨其与NDVI的关系, 图3和图4展示了去趋势后极端气候指数与NDVI相关系数的空间分布特征。图3为1982-2015年去趋势后年平均气温和极端温度指数与NDVI相关系数的空间分布, TM与NDVI的相关性在空间上以显著正相关为主(显著正相关的面积占比为40%, 显著负相关的面积占比为1.44%); DTR与植被NDVI的关系以正相关为主, 正相关的面积占比为93.31%, 其中有53.37%的面积通过了显著性检验, 指数与NDVI间呈显著负相关关系的面积占比仅0.29%。TXx、TX90、SU与NDVI的相关性在空间上都以正相关为主, 通过显著性的区域分别占研究区域的12.82%、18.33%、12.67%, 显著负相关分别占7.24%、3.52%、1.47%。TX10与NDVI的相关性在空间上表现为以负相关为主, 显著负相关占区域的40.79%, 显著正相关仅为0.35%。在NDVI与极端温度相关性的空间分布图上发现, TXx、TX90和SU在云南干热河谷地区与NDVI的相关性主要表现为显著负相关, 在此区域TXx与NDVI显著负相关的面积比最大。
图3
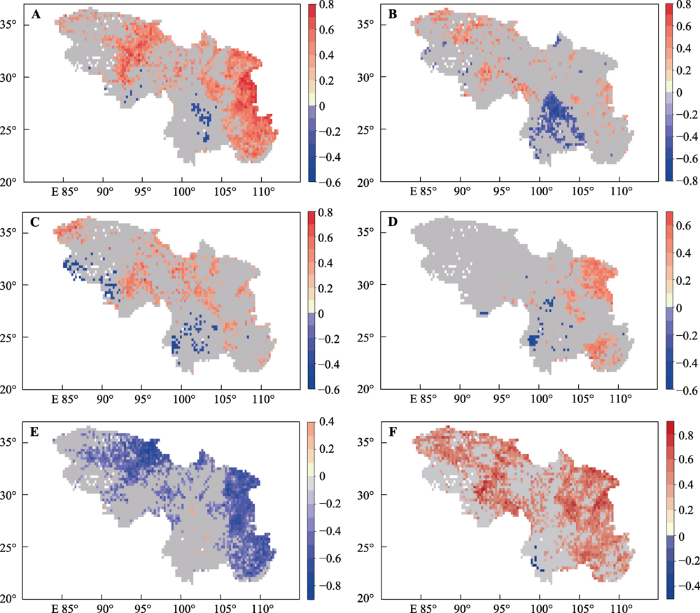
图3
中国西南部地区1982-2015年归一化植被指数(NDVI)与极端温度指数去趋势后的相关关系空间分布。A, 年平均气温。B, 日最高气温的最大值。C, 暖昼日数。D, 夏季日数。E, 冷昼日数。F, 气温日较差。灰色表示没有通过显著性检验(p > 0.05), 暖色表示显著正相关(r > 0, p < 0.05), 冷色表示显著负相关(r < 0, p < 0.05)。
Fig. 3
Spatial patterns of correlation between normalized differential vegetation index (NDVI) and temperature-extreme variables after data detrending in southwestern China from 1982 to 2015. A, Mean annual air temperature. B, Maximum value of daily maximum air temperature. C, Warm days. D, Summer days. E, Cool days. F, Diel temperature range. Gray-coded areas are where no significant correlation was detected between NDVI and temperature-extreme variables (p > 0.05). The warm tone indicates positive significance (r > 0, p < 0.05), and the cold tone indicates negative significance (r < 0, p < 0.05).
图4
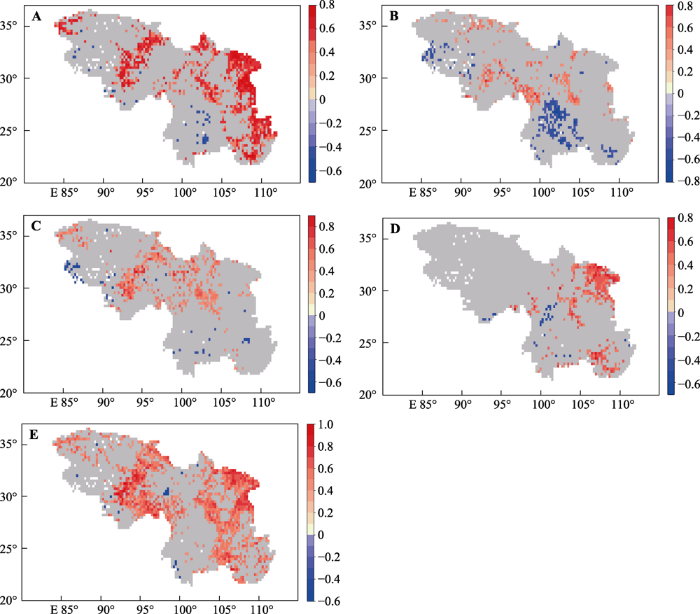
图4
中国西南部地区1994-2015年归一化植被指数(NDVI)与极端温度指数去趋势后的相关关系空间分布。A, 年平均气温。B, 日最高气温的最大值。C, 暖昼日数。D, 夏季日数。E, 冷昼日数。F, 气温日较差。灰色表示没有通过显著性检验(p > 0.05), 暖色表示显著正相关(r > 0, p < 0.05), 冷色表示显著负相关(r < 0, p < 0.05)。
Fig. 4
Spatial patterns of correlation between normalized differential vegetation index (NDVI) and temperature-variables after data detrending in southwestern China from 1994 to 2015. A, Mean annual air temperature. B, Maximum value of daily maximum air temperature. C, Warm days. D, Summer days. E, Diel temperature range. Gray-coded areas are where no significant correlation was detected between NDVI and temperature-extreme variables (p > 0.05). The warm tone indicates positive significance (r > 0, p < 0.05), and the cold tone indicates negative significance (r < 0, p < 0.05).
3 结论
本研究利用1982年1月-2015年12月的GIMMS NDVI 3g V1.0数据, 以及1961年1月1日-2016年12月31日CN05.1格点化的日最高气温、日最低气温、日平均气温和日降水量数据集计算1961-2016年的极端气候指数, 选取1982-2015年的极端气候指数数据, 采用趋势分析法、相关系数法、一阶差分去趋势法以及Pettitt突变探究西南部地区植被与极端气候事件的关系。得出的主要结论如下:
(1) 1982-2015年西南部地区植被NDVI呈现显著上升的趋势(每10年0.006, p < 0.001), 在1994年发生突变, 突变前变化不显著, 突变后呈现显著上升趋势(每10年0.005, p < 0.05)。
(2) 1982-2015年间, 极端降水指数均变化不显著; 极端温度指数除TXn和DTR外, 其他指数均变化显著, TXx、TNx、TNn、暖指数(TX90、TN90、SU、TR)、WSDI以及GSL呈现显著增高的趋势, 冷指数(TX10、TN10、ID、FD)以及CSDI呈现显著降低的趋势。
(3) 1994-2015年间, 极端降水指数仅有Rx1day和CDD呈现显著增长的趋势, 其他极端降水指数变化不显著。极端温度指数中TNx、TX90、SU、TN90、TR以及GSL呈现显著增加的趋势, TN10、ID以及FD呈现显著降低的趋势。
(4) 去趋势前, 1982-2015年间极端降水指数仅Rx1day与NDVI显著相关, 其与NDVI显著正相关, 其他极端降水指数与NDVI的相关性不显著; 1994-2015年Rx1day与NDVI显著正相关, R1mm与NDVI显著负相关, 去趋势后, 两个时段的极端降水指数与NDVI的相关性都不显著。
(5) 去趋势前, 1982-2015年间, TM与NDVI的相关系数最高, NDVI的变化主要是由年平均气温引起的。而在1994-2015年, SU和DTR与NDVI的相关系数高于TM与NDVI的相关系数, 即在1994-2015年间, NDVI的变化主要是由SU和DTR引起的。
(6) 去趋势后, 年平均气温在1982-2015年和1994-2015年两个时段对植被的影响都低于TXx、TX90、SU和DTR对植被的影响; TXx、TX90、SU和DTR在1982-2015年间对植被生长有积极的影响, 且在1994-2015年间其对植被生长的影响加强; DTR在两个时段与NDVI的相关系数都最高, 是NDVI变化的主要因素。
(7) 空间上, 热量的增加对西南部地区105° E以东的林地、耕地、云贵高原和四川接壤地区的灌木, 以及青藏高原西北部(85°-87° E, 34°-36° N)地区的高山草原有积极的作用。而极端暖事件对云南干热河谷地区植被的生长起抑制作用, TXx对此区域的负面影响尤为强烈。
参考文献
Global observed changes in daily climate extremes of temperature and precipitation
DOI:10.1029/2005JD006290 [本文引用: 1]
Contributions of dynamic and thermodynamic scaling in subdaily precipitation extremes in India
DOI:10.1002/grl.v45.5 URL [本文引用: 1]
Phenotypic plasticity and adaptive evolution contribute to advancing flowering phenology in response to climate change
Analysis on vegetation coverage change in Shannan, Tibet, China based on remotely sensed data
基于时间序列遥感数据的西藏山南地区植被覆盖变化特征分析
Changes in temperature and precipitation extremes observed in Modena, Italy
DOI:10.1016/j.atmosres.2012.10.022 URL [本文引用: 1]
Climate change characteristics of extreme temperature in the Minjiang River Basin
DOI:10.1155/2019/1935719 [本文引用: 1]
Climate extremes and their impacts on interannual vegetation variabilities: a case study in Hubei Province of central China
DOI:10.3390/rs10030477 URL [本文引用: 1]
Europe-wide reduction in primary productivity caused by the heat and drought in 2003
DOI:10.1038/nature03972 URL [本文引用: 1]
Global warming and 21st century drying
DOI:10.1007/s00382-014-2075-y URL [本文引用: 1]
Dynamics of temperature and precipitation extremes and their spatial variation in the arid region of northwest China
DOI:10.1016/j.atmosres.2013.12.001 URL [本文引用: 1]
Updated analyses of temperature and precipitation extreme indices since the beginning of the twentieth century: the HadEX2 dataset
Impacts of climate changes on the maximum and minimum temperature in Iran
DOI:10.1007/s00704-019-02906-9 URL [本文引用: 1]
Study on the Characteristics of Extreme Climate Change in Sichuan-Chongqing Region and Its Impact on NDVI
川渝地区极端气候变化特征及其对NDVI的影响研究
Vegetation NDVI characteristics and response to extreme climate in Sichuan and Chongqing from 2000 to 2017
2000-2017年川渝地区植被NDVI特征及其对极端气候的响应
Anthropogenic contribution to global occurrence of heavy-precipitation and high-temperature extremes
Fischer, E. M.; Knutti, R. ETH, Inst Atmospher & Climate Sci, CH-8092 Zurich, Switzerland.
Temperature extremes: effect on plant growth and development
DOI:10.1016/j.wace.2015.08.001 URL [本文引用: 1]
Spatial and temporal variations of carbon dioxide and its influencing factors
二氧化碳的时空变化规律与影响因素分析
Characters of ecosystem vulnerability in southwestern China based on vegetation productivity
基于植被生产力的西南地区生态系统脆弱性特征
Adaptability of vegetation ecosystem to climate change based on the NDVI in Yunnan Province, China
基于NDVI云南地区植被生态系统对气候变化的适应性分析
Impacts of recent climate extremes on spring phenology in arid-mountain ecosystems in China
Temperature acclimation of photosynthesis: mechanisms involved in the changes in temperature dependence of photosynthetic rate
Growth temperature alters temperature dependence of the photosynthetic rate (temperature acclimation). In many species, the optimal temperature that maximizes the photosynthetic rate increases with increasing growth temperature. In this minireview, mechanisms involved in changes in the photosynthesis-temperature curve are discussed. Based on the biochemical model of photosynthesis, change in the photosynthesis-temperature curve is attributable to four factors: intercellular CO2 concentration, activation energy of the maximum rate of RuBP (ribulose-1,5-bisphosphate) carboxylation (Vc max), activation energy of the rate of RuBP regeneration (Jmax), and the ratio of Jmax to Vc max. In the survey, every species increased the activation energy of Vc max with increasing growth temperature. Other factors changed with growth temperature, but their responses were different among species. Among these factors, activation energy of Vc max may be the most important for the shift of optimal temperature of photosynthesis at ambient CO2 concentrations. Physiological and biochemical causes for the change in these parameters are discussed.
Interannual variations in growing-season NDVI and its correlation with climate variables in the southwestern Karst region of China
DOI:10.3390/rs70911105 URL [本文引用: 1]
Detrending phenological time series improves climate-phenology analyses and reveals evidence of plasticity
DOI:10.1002/ecy.1690
PMID:27984645
[本文引用: 1]

Time series have played a critical role in documenting how phenology responds to climate change. However, regressing phenological responses against climatic predictors involves the risk of finding potentially spurious climate-phenology relationships simply because both variables also change across years. Detrending by year is a way to address this issue. Additionally, detrending isolates interannual variation in phenology and climate, so that detrended climate-phenology relationships can represent statistical evidence of phenotypic plasticity. Using two flowering phenology time series from Colorado, USA and Greenland, we detrend flowering date and two climate predictors known to be important in these ecosystems: temperature and snowmelt date. In Colorado, all climate-phenology relationships persist after detrending. In Greenland, 75% of the temperature-phenology relationships disappear after detrending (three of four species). At both sites, the relationships that persist after detrending suggest that plasticity is a major component of sensitivity of flowering phenology to climate. Finally, simulations that created different strengths of correlations among year, climate, and phenology provide broader support for our two empirical case studies. This study highlights the utility of detrending to determine whether phenology is related to a climate variable in observational data sets. Applying this as a best practice will increase our understanding of phenological responses to climatic variation and change.© 2016 by the Ecological Society of America.
Effects of climate change on phenology, frost damage, and floral abundance of montane wildflowers
The timing of life history traits is central to lifetime fitness and nowhere is this more evident or well studied as in the phenology of flowering in governing plant reproductive success. Recent changes in the timing of environmental events attributable to climate change, such as the date of snowmelt at high altitudes, which initiates the growing season, have had important repercussions for some common perennial herbaceous wildflower species. The phenology of flowering at the Rocky Mountain Biological Laboratory (Colorado, USA) is strongly influenced by date of snowmelt, which makes this site ideal for examining phenological responses to climate change. Flower buds of Delphinium barbeyi, Erigeron speciosus, and Helianthella quinquenervis are sensitive to frost, and the earlier beginning of the growing season in recent years has exposed them to more frequent mid-June frost kills. From 1992 to 1998, on average 36.1% of Helianthella buds were frosted, but for 1999-2006 the mean is 73.9%; in only one year since 1998 have plants escaped all frost damage. For all three of these perennial species, there is a significant relationship between the date of snowmelt and the abundance of flowering that summer. Greater snowpack results in later snowmelt, later beginning of the growing season, and less frost mortality of buds. Microhabitat differences in snow accumulation, snowmelt patterns, and cold air drainage during frost events can be significant; an elevation difference of only 12 m between two plots resulted in a temperature difference of almost 2 degrees C in 2006 and a difference of 37% in frost damage to buds. The loss of flowers and therefore seeds can reduce recruitment in these plant populations, and affect pollinators, herbivores, and seed predators that previously relied on them. Other plant species in this environment are similarly susceptible to frost damage so the negative effects for recruitment and for consumers dependent on flowers and seeds could be widespread. These findings point out the paradox of increased frost damage in the face of global warming, provide important insights into the adaptive significance of phenology, and have general implications for flowering plants throughout the region and anywhere climate change is having similar impacts.
Characteristics of diurnal temperature range in Xishuangbanna and its significance in Agriculture
西双版纳气温日较差的特点及其在农业上的意义
Climate and land use influences on changing spatiotemporal patterns of mountain vegetation cover in southwest China
DOI:10.1016/j.ecolind.2020.107193 URL
Variation characteristics of snow cover and frozen soil and their relationships with vegetation in the Tibetan Plateau from 1971 to 2016
1971-2016年青藏高原积雪冻土变化特征及其与植被的关系
Vegetation response to extreme climate events on the Mongolian Plateau from 2000 to 2010
DOI:10.1088/1748-9326/8/3/035033 URL [本文引用: 1]
Trends in daily temperature and precipitation extremes over Georgia, 1971-2010
DOI:10.1016/j.wace.2014.05.001 URL [本文引用: 1]
Influence of extreme weather disasters on global crop production
DOI:10.1038/nature16467 URL [本文引用: 1]
An assessment of the impacts of climate extremes on the vegetation in Mongolian Plateau: using a scenarios-based analysis to support regional adaptation and mitigation options
DOI:10.1016/j.ecolind.2018.08.031 URL [本文引用: 1]
Relationship between vegetation change and extreme climate indices on the Inner Mongolia Plateau, China, from 1982 to 2013
DOI:10.1016/j.ecolind.2018.01.066 URL [本文引用: 1]
Mean and extreme climate change on the Qinghai-Tibetan Plateau with a 2 °C global warming
2 ℃全球变暖背景下青藏高原平均气候和极端气候事件变化
Characteristics of climate change in southwest China karst region and their potential environmental impacts
DOI:10.1007/s12665-014-3847-8 URL [本文引用: 1]
Deciphering impacts of climate extremes on Tibetan grasslands in the last fifteen years
DOI:10.1016/j.scib.2019.03.012 URL [本文引用: 1]
Effects of climate change on the distribution of main vegetation types in Northeast China
气候变化对东北主要地带性植被类型分布的影响
Drought in southwest China from autumn 2009 to spring 2010 and its comparative analysis with historical drought events
2009年秋至2010年春我国西南地区干旱及与历史场次干旱对比分析
Spatiotemporal distribution of the extreme climate indices in the five southwestern provinces of China
西南5省市极端气候指数时空分布规律研究
Detrending crop yield data for spatial visualization of drought impacts in the United States, 1895-2014
Assessing extreme climatic changes on a monthly scale and their implications for vegetation in Central Asia
DOI:10.1016/j.jclepro.2020.122396 URL [本文引用: 1]
Vegetation changes in south Himalayas areas based on remote sensing monitoring during 2001-2015
2001-2015年喜马拉雅南麓地区植被变化遥感监测
New discussion on dry valley formation in the Three Parallel Rivers Region
三江并流区干热河谷成因新探析
Vegetation dynamics and diverse responses to extreme climate events in different vegetation types of Inner Mongolia
DOI:10.3390/atmos9100394 URL [本文引用: 1]
Increased Australian wheat yield due to recent climate trends
DOI:10.1038/387484a0 URL [本文引用: 1]
Influence of natural factors on vegetation NDVI using geographical detection in Sichuan Province
自然因子对四川植被NDVI变化的地理探测
A non-parametric approach to the change-point problem
Leaf onset in the northern hemisphere triggered by daytime temperature
DOI:10.1038/ncomms7911 URL [本文引用: 1]
Spatial and temporal variations of extreme precipitation and temperature events for the Southwest China in 1960-2009
DOI:10.1186/s40677-015-0014-9 URL [本文引用: 1]
Mean versus extreme precipitation trends in Iran over the period 1960-2017
DOI:10.1007/s00024-019-02165-9 URL [本文引用: 1]
Crop “Climate Yield” algorithm: discussion on difference method
作物“气候产量”算法: 差值法的探讨
World regionalization of climate change (1961-2010)
DOI:10.1007/s13753-016-0094-5 URL [本文引用: 1]
Identifying contributions of climate change to crop yields based on statistical models: a review
基于统计模型识别气候变化对农业产量贡献的研究进展
Changes in extreme temperature events over the Hindu Kush Himalaya during 1961-2015
DOI:10.1016/j.accre.2017.07.001 URL [本文引用: 1]
Influences of climate extremes on NDVI (normalized difference vegetation index) in the Poyang Lake Basin, China
DOI:10.1007/s13157-015-0692-9 URL [本文引用: 1]
Climate-crop yield relationships at provincial scales in China and the impacts of recent climate trends
DOI:10.3354/cr00771 URL [本文引用: 1]
Spatial and temporal variability in extreme temperature and precipitation events in Inner Mongolia (China) during 1960-2017
DOI:10.1016/j.scitotenv.2018.08.262 URL [本文引用: 1]
Temporal and Spatial Variation of Extreme Climate Indices and Its Impact on NDVI in Southwestern China
西南地区极端气候指数时空变化及其对NDVI的影响特征研究
Effect of climatic factors such as temperature, precipitation on maize production in China
温度降水等气候因子变化对中国玉米产量的影响
Variation of normalized difference vegetation index and its response to extreme climate in coastal China during 1982-2014
1982-2014年中国沿海地区归一化植被指数(NDVI)变化及其对极端气候的响应
Study on Forest Vegetation Distribution and Forest Resources Change Monitoring in Linzhi Area
林芝地区森林植被分布及动态变化监测研究
Effects of vegetation restoration on regional soil moisture content in the humid Karst areas—A case study of southwest China
DOI:10.3390/w13030321 URL
A gridded daily observation dataset over China region and comparison with the other datasets
一套格点化的中国区域逐日观测资料及与其它资料的对比
The effect of day and night temperature difference on photosynthetic characteristics in wheat
昼夜温差对小麦光合特性的影响
Characteristics of extreme precipitation in China based on homogenized precipitation data
基于均一化降水资料的中国极端降水特征分析
Spatial-temporal variations of vegetation activities and its responses to climatic factors in the Qaidam Basin
柴达木盆地植被生长时空变化特征及其对气候要素的响应
Photosynthetic response of Scirpus validus and Typha orientalis to elevated temperatures in Dianchi Lake, Southwestern China
DOI:10.1007/s11629-018-4853-1 URL [本文引用: 1]
Prediction and Analysis of Wheat Yield Changes Based on an Integrated Climatic Assessment Indicator for Wheat Production in Jiangsu Province
江苏小麦综合气象指数构建与产量变化预测和分析
Response of vegetation NDVI to climatic extremes in the arid region of Central Asia: a case study in Xinjiang, China
DOI:10.1007/s00704-017-2058-0 URL [本文引用: 1]
Effects of spring and summer extreme climate events on the autumn phenology of different vegetation types of Inner Mongolia, China, from 1982 to 2015
DOI:10.1016/j.ecolind.2019.105974 URL [本文引用: 1]
Spatial and temporal variation in extreme precipitation events in southwestern China during 1962-2012
1962-2012年西南地区极端降水事件的时空变化特征
Characteristics of grassland plants and protection and utilization of grassland resources in the dry-hot valley river of Yunnan
云南干热河谷草地植物特征及草地资源保护和利用
Content and impact factors of soil organic carbon and total nitrogen on the Qinghai-Tibet Plateau
青藏高原表土有机碳、全氮含量分布及其影响因素
Spatiotemporal changes of normalized difference vegetation index (NDVI) and response to climate extremes and ecological restoration in the Loess Plateau, China
DOI:10.1007/s00704-017-2107-8 URL [本文引用: 2]
Assessing the impacts of extreme climate events on vegetation activity in the north south transect of eastern China (NSTEC)
DOI:10.3390/w11112291 URL [本文引用: 1]
Effects of Difference Between Day and Night Temperature on Photosynthetic Characteristics and Antioxidant Enzyme Activity of Greenhouse Tomatoes
昼夜温差对设施番茄光合特性及抗氧化酶活性的影响
