


现有研究表明植被与气候之间存在着不对称的时间关系(Anderegg et al., 2015), 也就是气候对植被生长具有时间滞后效应和时间累加效应(Wu et al., 2015; Ivits et al., 2016)。在气候对植被生长的时间滞后效应方面, Wen等(2018)采用偏相关分析法分析了日最高气温和日最低气温月平均值在特定时间滞后下与净初级生产力之间的关系, 结果表明考虑滞后影响时植被对不对称变暖的响应在全球范围内有近12个月的延迟; Yang等(1997)研究了归一化植被指数(NDVI)与累积生长日、土壤温度、降水和潜在蒸散量的关系, 结果发现NDVI与降水、潜在蒸散表现出明显的时间滞后关系; Chen等(2014)分析了澳大利亚土壤水分与NDVI之间的关系, 结果发现植被对土壤水分的响应大约滞后1个月; Li等(2020)分析了严重干旱事件对青藏高原植被绿化的滞后影响。在气候对植被生长的时间累加效应方面, Evans和Geerken (2004)在量化气候与人类活动对旱区草地退化影响时, 发现降水对植被NDVI具有最大7个月的累加效应; Zhang等(2018)指出累加的温度可显著促进植物叶片的生长发育; Peng等(2019a)报道北半球植被生长季结束时间主要受累加4个月的干旱指数影响。然而, 气候的时间滞后或累加效应并不是独立存在的, 需要考虑它们对植被生长的联合影响, 才能更加全面解释气候对植被生长的时间效应。例如, Guo等(2017, 2019)在样地尺度上发现草地生产力会受到前几个月累积气候条件的显著影响; Ding等(2020)在全球尺度上证实了气候因子对植被生长具有显著的时间滞后与累加效应。
青藏高原是全球变化下最为敏感的一个地区(李依婵等, 2018)。该地区植被是支撑高原生态屏障结构与功能的重要基础, 不仅会影响高原本身的生态环境和区域发展, 同时也会对全球环境效应产生巨大作用(张镱锂等, 2019); 并且青藏高原气温的升高比同纬度其他地区出现的时间更早且增长趋势更大, 导致该区植被对气候变化的响应比其他地区更提前(Liu & Chen, 2000)。因此, 在青藏高原开展气候对植被生长影响的研究, 有利于理解该区植被对全球变暖的响应机制。尽管Ding等(2020)在全球尺度上分析了气候对植被生长的时间滞后与累加效应, 但是该研究将青藏高原大部分地区视为无植被区, 并且采用了较低空间分辨率的植被数据, 导致其研究结果在解释青藏高原地区气候对植被生长的时间效应时存在片面性。
因此, 本研究以青藏高原为研究区, 采用高空间分辨率的植被与气候数据, 首先利用多元回归方程构建4种时间效应下植被-气候关系(即无时间效应(No)、时间滞后效应(Lag)、时间累加效应(Acc)、同时考虑滞后和累加效应(Lagacc)), 然后对比分析不同时间效应下气候变化对植被生长的解释度, 识别影响植被生长的最佳时间效应, 最后通过计算最佳时间效应下植被与气候因子的偏相关系数, 确定影响青藏高原植被生长的主要气候因素。
1 材料和方法
1.1 研究区概况
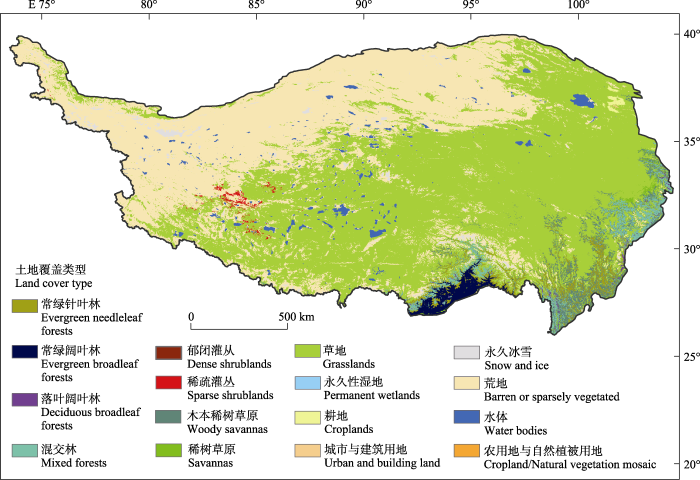
图1
1.2 数据来源
1.2.1 NDVI数据
NDVI数据来自美国国家航天局(NASA), 是MODIS陆地标准产品MOD13A2 (
1.2.2 植被类型数据
植被类型数据来源于MODIS陆地覆盖产品MCD12Q1 (
1.2.3 气候数据
气候数据(逐月平均气温与降水)来自黄土高原科学数据中心(
1.3 研究方法
1.3.1 气候因子与植被生长之间的时间效应方程
本研究分4种情况建立了年最大NDVI与月平均气温(TMP)、月降水量(PRE)之间的多元线性回归方程, 详见公式(1)-(4)。本研究中TMP和PRE的滞后或累加时间是从年最大NDVI对应的月份往前计算。已有研究发现, 植被生长对气候响应的月尺度滞后一般小于一个季度(Vicente-Serrano et al., 2010; Chen et al., 2014; Wu et al., 2015; Hua et al., 2017; Schwalm et al., 2017), 并且植被生长可能与之前11个月累加的气候因子有关(Peng et al., 2019a; Ding et al., 2020), 因此本研究考虑的时间滞后效应最长为4个月、时间累加效应最长为12个月(包含年最大NDVI所在月份)。
式中, a、b、c为回归系数, t为年最大NDVI所在月份, e为残差, Tlag、Plag分别表示TMP和PRE对应的滞后月份, Tacc、Pacc分别表示TMP和PRE对应的累积月份。公式(1)代表没有时间效应; 公式(2)中0 ≤ Tlag ≤ 3, 0 ≤ Plag ≤ 3代表仅考虑滞后效应; 公式(3)中0 ≤ Tacc ≤ 11, 0 ≤ Pacc ≤ 11代表仅考虑累加效应; 公式(4)中0 ≤ Tlag ≤ 3且0 ≤ Tacc ≤ 11, 0 ≤ Plag ≤ 3且0 ≤ Pacc ≤ 11代表同时考虑滞后与累加效应。对于每种时间效应, 本研究采用拟合方程的最大决定系数(R2, 95%显著性水平)识别各效应下最佳滞后或(和)累加月份。另外, 在Lagacc下, 在一个栅格上气候对植被生长的影响可能是无时间效应、只有滞后效应、只有累加效应, 或者滞后与累加的联合效应。
1.3.2 偏相关分析
式中, rxy-z是在固定z变量值后, x和y之间的偏相关系数, rxy是变量x和变量y之间的相关系数, rxz是变量x和变量z之间的相关系数, ryz是变量y和变量z之间的相关系数。当rxy-z为正值时, 表示两变量呈正相关关系; rxy-z为负值时, 表示两变量呈负相关关系。本研究中的3个变量分别为NDVI、气温、降水, 逐网格进行偏相关分析(95%显著性水平), 得到NDVI分别与气温和降水的相关性。通过计算青藏高原NDVI与气温和降水的偏相关系数的绝对值, 在同一栅格上比较植被与两种气候因子的相关性, 偏相关系数的绝对值越大, 表示相关性越强。有些栅格上只有一个气候因子的偏相关系数显著, 其即为主导因子。
1.4 数据处理
本研究采用MATLAB 9.3软件对栅格数据进行处理, 并编写气候与植被时间效应方程以及偏相关分析代码, 最后用ArcGIS 10.5软件分植被类型进行结果统计并制图。
2 结果和分析
2.1 不同时间效应下气候因子对植被生长的解释度
4种时间效应(即No、Lag、Acc和Lagacc)下, 气候因子对植被生长的平均解释度为0.42 ± 0.10、0.43 ± 0.10、0.44 ± 0.11、0.47 ± 0.12 (表1)。对于每种植被类型, 气候因子的解释度基本沿着No、Lag、Acc、Lagacc的顺序升高。No下气候因子解释度在37%- 49%, Lag下在40%-48%, Acc效应下在41%-48%, Lagacc下在44%-51%。相比于No, Lagacc下各植被类型的决定系数高出0.04-0.07 (解释度相对增加了4%-18%), 其中常绿阔叶林、稀疏灌丛、草地和耕地分别相对增加了18%、17%、17%、17%。本研究进一步分析了最优时间效应(即Lagacc)下气候因子对植被生长解释度的空间差异(图2A), 可以看出多元线性回归模型较高的决定系数主要分布在青藏高原东北部、东南部和西南部。另外, 相比于No, Lagacc下解释度提升较高的地区主要集中在东北部(图2B)。由表1和图2可以看出Lagacc可明显提高气候因子对植被生长的解释度。
表1 青藏高原不同植被类型在4种时间效应下的平均决定系数
Table 1
| 土地覆盖类型 Land cover type | R2_No | R2_Lag | R2_Acc | R2_Lagacc |
|---|---|---|---|---|
| 常绿针叶林 Evergreen needleleaf forests | 0.45 | 0.46 | 0.47 | 0.50 |
| 常绿阔叶林 Evergreen broadleaf forests | 0.39 | 0.42 | 0.43 | 0.47 |
| 落叶阔叶林 Deciduous broadleaf forests | 0.41 | 0.41 | 0.43 | 0.46 |
| 混交林 Mixed forests | 0.45 | 0.45 | 0.45 | 0.49 |
| 稀疏灌丛 Sparse shrublands | 0.37 | 0.40 | 0.41 | 0.44 |
| 木本稀树草原 Woody savannas | 0.42 | 0.43 | 0.44 | 0.47 |
| 稀树草原 Savannas | 0.42 | 0.41 | 0.43 | 0.47 |
| 草地 Grasslands | 0.40 | 0.41 | 0.44 | 0.47 |
| 永久性湿地 Permanent wetlands | 0.49 | 0.48 | 0.48 | 0.51 |
| 耕地 Croplands | 0.40 | 0.42 | 0.43 | 0.47 |
R2_No、R2_Lag、R2_Acc和R2_Lagacc分别表示不考虑时间效应、只考虑时间滞后效应、只考虑时间累积效应、同时考虑时间滞后与累积效应时的决定系数。
R2_No, R2_Lag, R2_Acc, and R2_Lagacc represent the determination coefficients without considering the time effect, only considering the time lag effects, only considering the time accumulation effects, and considering both time lag and accumulation effects, respectively.
图2
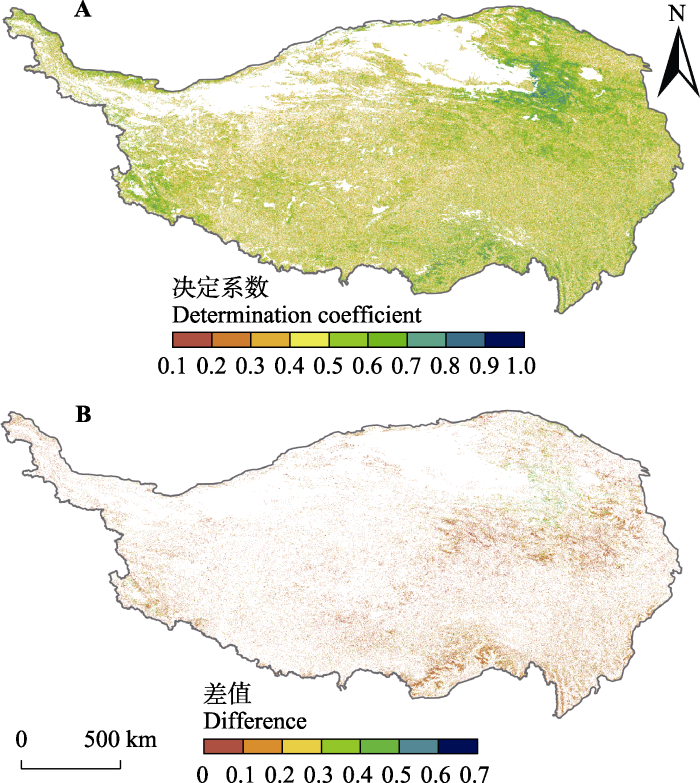
图2
青藏高原不同植被类型在同时考虑时间滞后与累积效应(Lagacc)下多元线性回归模型决定系数的空间格局(A)以及在Lagacc与不考虑时间效应(No)下决定系数的空间差异(B)。
Fig. 2
Spatial pattern of determination coefficients (R2) evaluated by models considering both time lag and accumulation effects (Lagacc)(A), and spatial difference of R2 values between Lagacc model and that without considering the time effect (No)(B) of different vegetation types on the Qingzang Plateau.
2.2 气候因子对植被生长的时间效应
在Lagacc下, 气温对于青藏高原地区植被生长的平均滞后与累加月份分别为(1.58 ± 0.14)月和(4.55 ± 0.28)月(表2)。并且, 在Lagacc下气温的无时间效应、只有滞后效应、只有累加效应、滞后与累加的联合效应均存在, 面积占比分别为10.05%、13.32%、14.89%、43.42% (表3; 图3)。具体而言, 气温在各植被类型上滞后时间为1-2个月, 其中在稀疏灌丛上表现出1.94个月的时滞, 而在永久性湿地上表现出1.41个月的时滞; 气温在各植被类型上累加时间为4-5个月, 其中在稀疏灌丛上表现出4.89个月累加, 而在耕地上表现出3.91个月的累加。在Lagacc下, 降水对于青藏高原地区植被生长的平均滞后与累加月份分别为(1.57 ± 0.16)个月和(4.94 ± 0.35)个月(表2)。并且, 在Lagacc下降水的无时间效应、只有滞后效应、只有累加效应, 滞后与累加的联合效应均存在, 面积占比分别为6.47%、10.56%、18.87%、45.78% (表3; 图3)。具体而言, 降水在各植被类型上滞后时间为1-2个月, 其中在常绿阔叶林上表现出1.70个月的时滞, 而在耕地上表现出1.19个月的时滞; 降水在各植被类型上累加时间为4-6个月, 其中在常绿阔叶林上表现出5.66个月累加, 而在永久性湿地上表现出4.49个月的累加。整体来看, 气温与降水对青藏高原植被生长具有Lagacc, 并且超过43%的区域内植被生长受到滞后与累加联合效应影响; 在Lagacc下, 气候对植被生长的时间效应随着植被类型、气候因子以及区域的不同而发生变化。
表2 同时考虑时间滞后与累积效应下气温与降水在青藏高原各植被类型上的滞后和累加月份
Table 2
| 土地覆盖类型 Land cover type | 样本数 No. of samples | 气温 Air temperature | 降水 Precipitation | ||
|---|---|---|---|---|---|
| 滞后月份 Lag months | 累加月份 Accumulation months | 滞后月份 Lag months | 累加月份 Accumulation months | ||
| 常绿针叶林 Evergreen needleleaf forests | 48 030 | 1.54 | 4.60 | 1.63 | 4.69 |
| 常绿阔叶林 Evergreen broadleaf forests | 29 667 | 1.51 | 4.72 | 1.70 | 5.66 |
| 落叶阔叶林 Deciduous broadleaf forests | 4 519 | 1.66 | 4.81 | 1.68 | 4.91 |
| 混交林 Mixed forests | 50 746 | 1.56 | 4.72 | 1.69 | 5.20 |
| 稀疏灌丛 Sparse shrublands | 7 125 | 1.94 | 4.89 | 1.50 | 4.72 |
| 木本稀树草原 Woody savannas | 60 536 | 1.54 | 4.55 | 1.65 | 4.66 |
| 热带草原 Savannas | 10 940 | 1.60 | 4.48 | 1.68 | 5.13 |
| 草地 Grasslands | 1 433 101 | 1.61 | 4.32 | 1.45 | 5.19 |
| 永久性湿地 Permanent wetlands | 404 | 1.41 | 4.48 | 1.51 | 4.49 |
| 耕地 Croplands | 5 755 | 1.47 | 3.91 | 1.19 | 4.76 |
表3 同时考虑时间滞后与累积效应下气温与降水在青藏高原各植被类型上呈现的时间效应所占面积比例(%)
Table 3
| 土地覆盖类型 Land cover type | 气温 Air temperature | 降水 Precipitation | ||||||
|---|---|---|---|---|---|---|---|---|
| 无时间 效应 No | 滞后 效应 Lag | 累加 效应 Acc | 滞后与累加 的联合效应 Combined | 无时间 效应 No | 滞后 效应 Lag | 累加 效应 Acc | 滞后与累加 的联合效应 Combined | |
| 常绿针叶林 Evergreen needleleaf forests | 12.55 | 13.25 | 19.88 | 54.32 | 6.86 | 17.42 | 18.42 | 57.30 |
| 常绿阔叶林 Evergreen broadleaf forests | 8.06 | 17.53 | 21.84 | 52.57 | 7.07 | 14.74 | 16.66 | 61.53 |
| 落叶阔叶林 Deciduous broadleaf forests | 10.87 | 14.25 | 16.33 | 58.55 | 6.40 | 15.71 | 16.33 | 61.56 |
| 混交林 Mixed forests | 11.30 | 14.64 | 19.19 | 54.86 | 5.92 | 14.45 | 16.59 | 63.04 |
| 稀疏灌丛 Sparse shrublands | 7.00 | 18.68 | 14.04 | 60.28 | 6.68 | 14.47 | 22.44 | 56.41 |
| 木本稀树草原 Woody savannas | 12.51 | 14.04 | 19.89 | 53.56 | 7.06 | 16.62 | 17.20 | 59.12 |
| 稀树草原 Savannas | 10.55 | 17.88 | 19.18 | 52.39 | 6.72 | 12.49 | 14.95 | 65.84 |
| 草地 Grasslands | 13.55 | 17.43 | 18.22 | 50.81 | 8.07 | 12.57 | 24.65 | 54.71 |
| 永久性湿地 Permanent wetlands | 11.88 | 13.86 | 24.75 | 49.50 | 7.67 | 14.11 | 23.51 | 54.70 |
| 耕地 Croplands | 15.79 | 19.29 | 18.45 | 46.46 | 8.44 | 12.23 | 29.17 | 50.15 |
Acc, time accumulation effect; Lag, time lag effect; Combined, combined effect of time lag and accumulation; No, no time effect.
2.3 影响植被生长的主导气候因子
在Lagacc下, NDVI与气温的平均偏相关系数为0.08 ± 0.60, 正相关区域主要分布在青藏高原中部和东南部, 面积占比为28.92%, 负相关区域主要分布在青藏高原东部和南部, 面积占比为22.09%; NDVI与降水的平均偏相关系数为0.25 ± 0.56, 正相关区域主要分布在青藏高原东北部和西南部, 面积占比为41.23%, 负相关区域主要分布在青藏高原中西部和东南部, 面积占比为17.74% (图4)。在地理空间上比较分析NDVI与气温和降水偏相关系数的绝对值(图5), 可以看出气温主导植被生长的区域主要分布在青藏高原的中西部、东南部, 面积占比为29.70%; 降水主导植被生长的区域主要分布在青藏高原东北部和西南部, 面积占比为40.06%。
3 讨论
本研究通过分析气候因子对植被生长的4种时间效应, 证实了青藏高原地区气候与植被之间存在非对称的时间关系。结果表明, 相比于No、Lag、Acc, 考虑Lagacc可明显提高气候因子对植被生长的解释度(表1; 图2); 在Lagacc下, 有超过43%的区域内植被生长受到滞后与累加的联合效应的影响, 气候对植被生长的时间效应随着植被类型、气候因子以及区域的不同而发生变化(表3; 图3)。这些研究结果与Ding等(2020)在全球尺度上的研究结果基本一致。累加效应是气温、降水等植物生长所必需的环境因子在一定时间段内的总和, 这个时间可能是几个小时、几天、几个月, 甚至是几年, 这是由于植物生长发育需要积累一定的温度与水分才能分化、发芽、开花(Cleland et al., 2007; Shi et al., 2014)。降水对植被生长具有滞后效应, 是因为降水要经过植被的截留后才能到达地表, 再通过土壤入渗到达植物根部, 然后被植物的细根吸收输送到叶片以供生长, 最后植被变化被卫星传感器捕捉, 这一系列的过程都是需要时间的(Chen et al., 2014; Ding et al., 2020)。植被生长对气温表现滞后效应是由于气温升高会引起水分蒸散发, 而这一过程会产生类似降水影响植被生长的时间滞后现象(Ding et al., 2020)。
图3
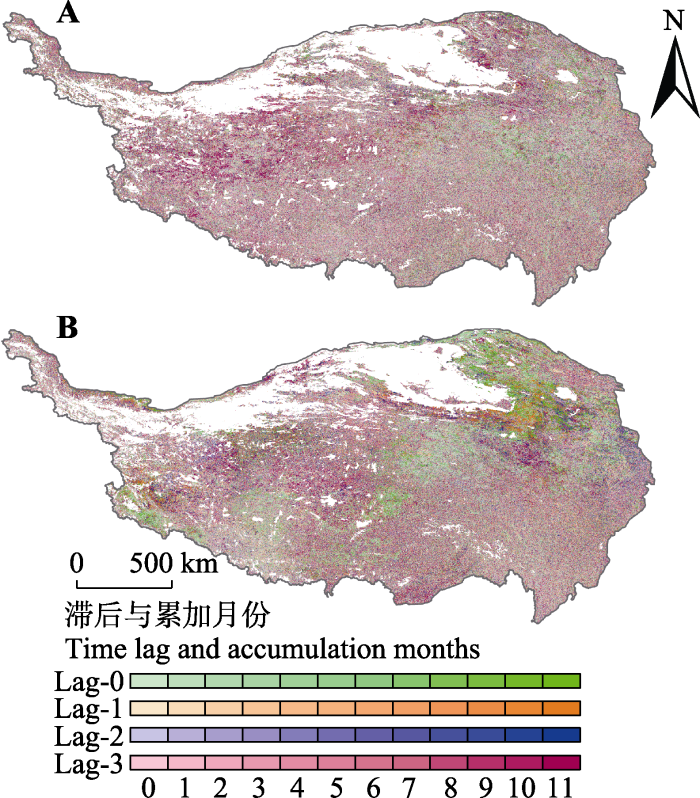
图3
同时考虑时间滞后与累积效应下气温(A)和降水(B)对青藏高原植被生长的滞后与累加月份。Lag-0、Lag-1、Lag-2、Lag-3分别表示滞后0、1、2、3个月, 0-11表示累加月。
Fig. 3
Time lag and accumulation months of air temperature (A) and precipitation (B) on vegetation growth on the Qingzang Plateau evaluated by models considering both time lag and accumulation effects. Lag-0, Lag-1, Lag-2 and Lag-3 represent the lag of 0, 1, 2 and 3 months, respectively, and 0-11 represent the accumulation months.
图4
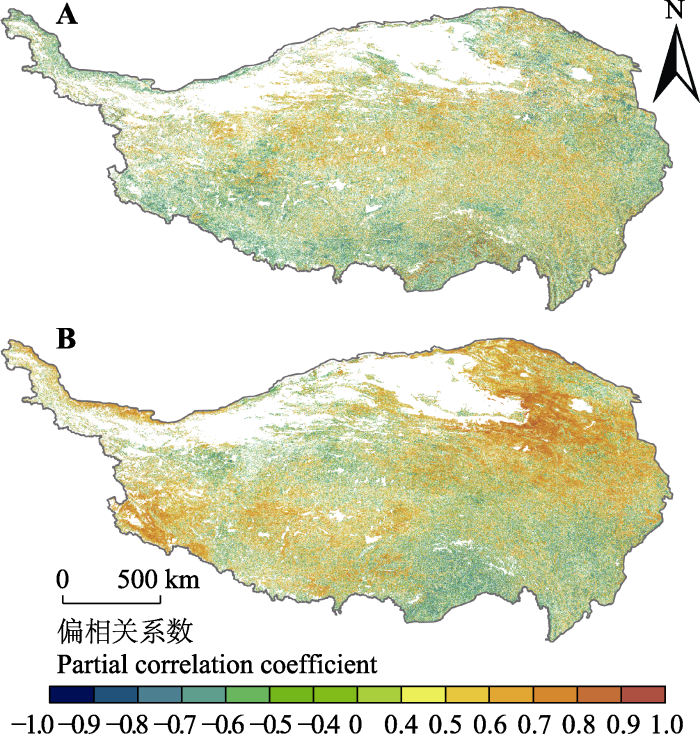
图4
同时考虑时间滞后与累积效应下青藏高原归一化植被指数(NDVI)与气温(A)和降水(B)偏相关系数的青藏高原空间分布。
Fig. 4
Spatial distribution of partial correlation coefficients between normalized difference vegetation index (NDVI) and air temperature (A)/precipitation (B) on the Qingzang Plateau evaluated by models considering both time lag and accumulation effects.
青藏高原水热条件和植被类型的空间差异导致限制该区植被生长的条件有所不同(王青霞等, 2014)。在本研究中, NDVI与降水的相关性明显高于其与气温的相关性, 且NDVI与降水正相关的区域主要分布在青藏高原东北部和西南部, 而NDVI与气温正相关的区域主要分布在青藏高原中东部, 这些区域对应的植被类型均是草地(图4)。这与王志鹏等(2018)以及赵倩倩等(2021)的研究得出的结果基本一致。同时, 本研究表明在水分较充足的青藏高原中东部高寒地区植被生长与气温的相关性较高; 在水分充足且气温较高的青藏高原东北部植被生长与降水主要表现出正相关关系, 而与气温主要表现出负相关关系, 这是由于增温会促进水分蒸散(才吉和谢民生, 2011; Wu et al., 2015), 导致降水表现出正影响(图4)。另外, 本研究发现在青藏高原地区降水主导植被生长的区域面积(40.06%)明显大于气温主导植被生长的区域面积(29.70%)(图5), 而薛宇轩和卢宏玮(2020)的研究表明气温是驱动青藏高原植被生长的首要气候因子, 造成这种差异的原因可能是由于该研究没有考虑气候因子的时间滞后与累加效应, 并将一些NDVI极小的地区纳入研究中, 而在这些地区NDVI与气温呈现出大面积的正相关关系(薛宇轩和卢宏玮, 2020)。
图5
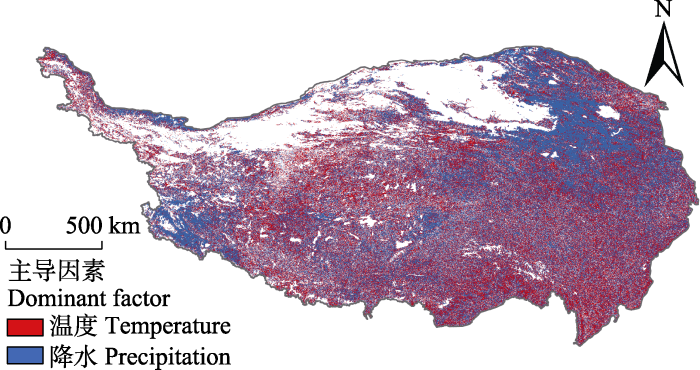
图5
同时考虑时间滞后与累积效应下主导青藏高原植被生长的气候因子空间分布。
Fig. 5
Spatial distribution of dominant climate factors on vegetation growth on the Qingzang Plateau evaluated by models considering both time lag and accumulation effects.
4 结论
本研究分析了气候对青藏高原地区植被生长的4种时间效应, 明确了联合考虑气候滞后与累加效应的重要性, 并探讨了影响该区植被生长的主导气候因子。结果表明: (1) No、Lag、Acc、Lagacc 4种时间效应下气候对植被生长的解释度分别为42%、43%、44%、47%; 相比于No, Lagacc对植被生长的解释度整体提高了4%-18%, 因而考虑Lagacc可显著提高气候因子对植被生长的解释度; (2)在Lagacc下, 气温、降水对于青藏高原地区植被生长的平均滞后与累加月份分别为(1.58 ± 0.14)和(4.55 ± 0.28)个月、(1.57 ± 0.16)和(4.94 ± 0.35)个月, 并且有超过43%的区域内植被生长受到气候滞后与累加的联合效应影响; (3)在整个青藏高原地区NDVI与降水的相关性高于其与气温的相关性, 而且降水主导植被生长的区域面积(40.06%)明显大于气温主导植被生长的区域面积(29.70%), 降水在青藏高原东北部和西南部的植被生长中占主导地位, 而气温在青藏高原中部和东南部的植被生长中占主导地位。
责任编委: 张扬建 编辑: 赵航
参考文献
Pervasive drought legacies in forest ecosystems and their implications for carbon cycle models
DOI:10.1126/science.aab1833
PMID:26228147
[本文引用: 1]

The impacts of climate extremes on terrestrial ecosystems are poorly understood but important for predicting carbon cycle feedbacks to climate change. Coupled climate-carbon cycle models typically assume that vegetation recovery from extreme drought is immediate and complete, which conflicts with the understanding of basic plant physiology. We examined the recovery of stem growth in trees after severe drought at 1338 forest sites across the globe, comprising 49,339 site-years, and compared the results with simulated recovery in climate-vegetation models. We found pervasive and substantial "legacy effects" of reduced growth and incomplete recovery for 1 to 4 years after severe drought. Legacy effects were most prevalent in dry ecosystems, among Pinaceae, and among species with low hydraulic safety margins. In contrast, limited or no legacy effects after drought were simulated by current climate-vegetation models. Our results highlight hysteresis in ecosystem-level carbon cycling and delayed recovery from climate extremes. Copyright © 2015, American Association for the Advancement of Science.
The relationship between grassland biomass and precipitation, temperature in alpine pastoral area
高寒牧区草原生物量与降水、温度的关系
Attribution analyses of changes in alpine grasslands on the Qinghai- Tibetan Plateau
青藏高原高寒草地生态系统变化的归因分析
Using satellite based soil moisture to quantify the water driven variability in NDVI: a case study over mainland Australia
DOI:10.1016/j.rse.2013.08.022 URL [本文引用: 3]
Shifting plant phenology in response to global change
DOI:10.1016/j.tree.2007.04.003 URL [本文引用: 1]
A review of the cause of rangeland degradation on Qinghai-Tibet Plateau
青藏高原草地退化原因述评
Climate impacts of anthropogenic land use changes on the Tibetan Plateau
DOI:10.1016/j.gloplacha.2005.07.006 URL [本文引用: 1]
Global analysis of time-lag and -accumulation effects of climate on vegetation growth
DOI:10.1016/j.jag.2020. 102179 URL [本文引用: 6]
Discrimination between climate and human-induced dryland degradation
DOI:10.1016/S0140-1963(03)00121-6 URL [本文引用: 2]
Critical climate periods for grassland productivity on China’s Loess Plateau
DOI:10.1016/j.agrformet.2016.11.006 URL [本文引用: 1]
Distribution margins as natural laboratories to infer species’ flowering responses to climate warming and implications for frost risk
DOI:10.1016/j.agrformet.2019.01.038 URL [本文引用: 1]
Responses of vegetation activity to drought in Northern China
DOI:10.1002/ldr.2709 URL [本文引用: 1]
Assessing European ecosystem stability to drought in the vegetation growing season
DOI:10.1111/geb.12472 URL [本文引用: 1]
Elevation dependence of drought legacy effects on vegetation greenness over the Tibetan Plateau
DOI:10.1016/j.agrformet.2020.108190 URL [本文引用: 1]
A new definition method of climate- sensitive region and its prediction
一种新的气候变化敏感区的定义方法与预估
DOI:10.11821/dlxb201807008
[本文引用: 1]
气候变化敏感区的研究是气候变化研究的一个重要方向,前人对气候变化敏感区的定义大多基于单一的指标,而对综合性指标研究较少。基于柯本气候分类法所划分出的中国气候类型分布及其变化频次,提出一种新的气候变化敏感区定义方法,并使用该方法划分中国的气候变化敏感区,气候类型变化频繁的区域被认为是敏感区。选取CESM模型中等碳排放(RCP 4.5)下的模拟数据计算2006-2013年、21世纪40年代和90年代气候类型的变化,以此预估未来30~80年间气候变化敏感带的变化。结果显示:依据本文提出的方法划分的气候变化敏感区,与降水变化敏感区有较好拟合;中国气候变化最敏感的区域分布在黑河腾冲线附近、秦岭淮河一线、青藏高原西部和天山以北部分地区,气候最为稳定的区域分布在青藏高原中东部、昆仑山、祁连山以北、天山以南、贺兰山以西的大片区域和大兴安岭附近;未来30~80年间,西部(贺兰山、横断山以西)地区气候变化敏感区基本不变,而东部地区的气候变化敏感区则逐渐向北偏移。
Monitoring and assessment of vegetation variation in North China based on SPOT/NDVI
基于SPOT/NDVI华北地区植被变化动态监测与评价
Climatic warming in the Tibetan Plateau during recent decades
DOI:10.1002/1097-0088(20001130)20:14<1729::AID-JOC556>3.0.CO;2-Y URL [本文引用: 1]
Greening and browning of the Himalaya: spatial patterns and the role of climatic change and human drivers
Effects of warming on chlorophyll degradation and carbohydrate accumulation of alpine herbaceous species during plant senescence on the Tibetan Plateau
DOI:10.1371/journal.pone.0107874 URL [本文引用: 1]
Variability of the seasonally integrated normalized difference vegetation index across the north slope of Alaska in the 1990s
DOI:10.1080/0143116021000020144 URL [本文引用: 1]
Variation of vegetation coverage and its relationship with climate change in north China from 1982 to 2006
1982-2006年华北植被覆盖变化及其与气候变化的关系
Assessment of the impacts of climate change and human activities on vegetation cover change in the Haihe River basin, China
DOI:10.1016/j.pce.2019.102834 [本文引用: 1]
A multiscalar drought index sensitive to global warming: the standardized precipitation evapotranspiration index
DOI:10.1175/2009JCLI2909.1 URL [本文引用: 1]
Grassland coverage changes and analysis of the driving forces in Maqu County
DOI:10.1016/j.phpro.2012.05.213 URL [本文引用: 1]
Characteristics of vegetation change and its relationship with climate factors in different time-scales on Qinghai-Xizang Plateau
青藏高原不同时间尺度植被变化特征及其与气候因子的关系分析
DOI:10.7522/j.issn.1000-0534.2014.00002
[本文引用: 1]
利用1982-2006年GIMMS NDVI数据,以多种统计方法为基础,探讨了青藏高原(下称高原)不同时间尺度(年际、季节及月)植被变化的时空特征及其与气候因子的关系。结果表明:高原整体年平均NDVI变化呈波动上升趋势,其中夏季趋势最大,达0.004(10a)-1。不同覆盖度像元变化对总体植被变化的贡献不同,低植被覆盖像元变化对各季节总体植被变化贡献均较大,其中冬季最大;中等植被覆盖像元变化的贡献主要在秋季;高植被覆盖像元的贡献则夏季最明显。青藏高原植被变化存在显著的空间差异,其中夏季呈增加和减少趋势的面积均最大,分别达30.51%,10.52%,增加的区域主要位于高原东部,减少的区域主要在高原中部的藏北高原。进一步分析高原植被和气候因子的相关性表明,中等植被覆盖区植被与气候因子的相关性最高,其次是高植被覆盖区,低植被覆盖区的相关性则最低。在年际和季节尺度上,植被生长主要与温度和降水的累积效应有关,其中在植被生长较好的季节和区域更明显。而在月尺度上,中低植被覆盖区植被生长受短期降水事件影响较大,高植被覆盖区则仍是温度的累积效应占主导。
Responses of normalized difference vegetation index (NDVI) to precipitation changes on the grassland of Tibetan Plateau from 2000 to 2015
2000-2015年青藏高原草地归一化植被指数对降水变化的响应
Non-uniform time-lag effects of terrestrial vegetation responses to asymmetric warming
DOI:10.1016/j.agrformet.2018.01.016 URL [本文引用: 1]
New insights on plant phenological response to temperature revealed from long-term widespread observations in China
DOI:10.1111/gcb.14002 URL [本文引用: 1]
A discussion on the boundary and area of the Tibetan Plateau in China
论青藏高原范围与面积
Spatial and temporal characteristics of land use and cover changes in the Tibetan Plateau
青藏高原土地利用与覆被变化的时空特征
Vegetation changes and its response to climate change in China since 2000
2000年以来中国区域植被变化及其对气候变化的响应
DOI:10.7522/j.issn.1000-0534.2020.00025
[本文引用: 1]
气候是植被变化的主要驱动因子, 研究全球增暖背景下中国区域植被变化及其对气候的响应对于国家开展重大生态恢复评估和未来植被保护政策制定具有重要意义。利用2000 -2016年MODIS植被指数(Normalized Difference Vegetation Index, NDVI)数据集, 运用统计分析方法, 从平均态、 线性趋势、 时间序列、 相关性等方面系统分析了2000年以来中国区域植被变化及其对气候变化的响应。结果表明: 中国区域NDVI在平均态上呈现从东南向西北递减的空间分布, 受降水生长季的影响, 东部地区植被指数明显较大; 我国大部分地区NDVI呈现增加的趋势, 其中湿润半湿润地区NDVI增长幅度为0.037·(10a)-1, 而在干旱半干旱地区变化较小[0.013·(10a)-1]。NDVI的变化与气候驱动因素的相关性存在一定的区域差异, 其中: NDVI与气温变化在东南沿海、 东北东部以及青藏高原北部等地区呈现出显著正相关, 而在青藏高原南部等地区呈现微弱的负相关; 除青藏高原、 塔里木盆地和东北北部等地区外, NDVI与降水量在全国大多数地区呈正相关。从全国平均来看, 温度和降水变化对NDVI的贡献分别为7.5%和9.1%, 其中温度对NDVI变化的贡献主要体现在湿润半湿润地区(9.3%), 而降水的贡献则在干旱半干旱地区(12.2%)。植被变化对气候要素驱动的响应也呈现出明显的区域差异性, 在我国东南沿海、 云贵高原东部、 四川盆地等南方地区以及黄河中下游、 东北东部等部分地区, NDVI变化对气温的敏感性最强; 而在中国北方干旱半干旱大部分地区, NDVI变化则是对降水驱动具有很显著的响应特征。总体而言, 气温是驱动南方地区植被变化的主导因子, 而降水则调控着北方地区植被生长变化。
Research on the natural territory system of the Qinghai-Tibet Plateau
近30年来呼伦贝尔地区草地植被变化对气候变化的响应
Responses of vegetation changes to climatic variations in Hulun Buir Grassland in past 30 years
An assessment of AVHRR/NDVI-ecoclimatological relations in Nebraska, USA.
DOI:10.1080/014311697217819 URL [本文引用: 1]
青藏高原植被覆盖变化及气候驱动因子分析
Analysis of vegetation cover change and climate driving factors on the Qinghai-Tibet Plateau
Time-lag effects of global vegetation responses to climate change
DOI:10.1111/gcb.12945 URL [本文引用: 3]
Global patterns of drought recovery
DOI:10.1038/nature23021 URL [本文引用: 1]
Long-term studies of vegetation dynamics
DOI:10.1126/science.1062586
PMID:11474101
[本文引用: 1]
By integrating a wide range of experimental, comparative, and theoretical approaches, ecologists are starting to gain a detailed understanding of the long-term dynamics of vegetation. We explore how patterns of variation in demographic traits among species have provided insight into the processes that structure plant communities. We find a common set of mechanisms, derived from ecological and evolutionary principles, that underlie the main forces shaping systems as diverse as annual plant communities and tropical forests. Trait variation between species maintains diversity and has important implications for ecosystem processes. Hence, greater understanding of how Earth's vegetation functions will likely require integration of ecosystem science with ideas from plant evolutionary, population, and community ecology.
1 km monthly temperature and precipitation dataset for China from 1901 to 2017
DOI:10.5194/essd-11-1931-2019 URL [本文引用: 1]
Satellite detection of cumulative and lagged effects of drought on autumn leaf senescence over the Northern Hemisphere
DOI:10.1111/gcb.14627 URL [本文引用: 2]
