


植物的功能性状是多样的, 每种功能性状可以用多个性状指标来度量, 例如叶结构性状可以用比叶面积(SLA)、叶面积(LA)、叶干物质含量(LDMC)等指标来度量, 化学性状可以用叶片氮含量(LNC)、叶片磷含量(LPC)来度量。性状或性状指标之间通常存在共变关系(He et al., 2020), 尤其是与资源获取和生长速率相关的特征之间(Laughlin et al., 2017), 例如, SLA、LA、LNC表征了植物对光能的捕获能力和同化CO2的能力, 与植物光合作用和生长速率关系密切, 彼此之间常表现为正相关关系, 但与叶寿命之间呈负相关关系(Wright et al., 2004; Bowsher et al., 2016; Bruelheide et al., 2018; Jardine et al., 2020)。这种共变关系反映了因环境压力或资源供应的限制, 植物在生长、繁殖过程中对资源“投资”与“回报”之间存在权衡(Grime, 1977; Stearns, 1989; Westoby, 1998; Wright et al., 2004), 是植物在长期演化过程中形成的进化或生理上的适应策略。
尽管这种权衡被认为广泛存在, 但以往的研究主要是基于不同科、不同生活型或不同生态系统的物种间的功能性状关系得到的(Wright et al., 2004; Chave et al., 2009; Freschet et al., 2010; Bowsher et al., 2016; Jardine et al., 2020)。很少有研究检验相同植物分类学等级(如科或属)内不同物种的生活策略是否存在类似的权衡关系。分类是研究植物的基本方法, 其中种作为分类的基本单位, 根据亲缘关系共同性较多的若干种归纳成属。同属内的一些物种在形态结构和生理生态特征以及亲缘关系上十分相近, 且分布在不同的环境或区域中, 在空间上相互替代, 形成地理替代分布(Korall & Pryer, 2014)。这些植物的功能性状是否在属水平或种内存在共变关系以及沿着环境梯度具有怎样的变化, 目前研究还很少。以往研究表明, 植物功能性状之间的共变性依赖于尺度, 在更大尺度或更高的分类学等级上表现出的强相关关系在更低的分类学等级上(如属内或种内)会减弱, 甚至出现相反的关系(Anderegg et al., 2018)。因为植物在更低的分类学等级上, 物种个体通常具有较强的表型可塑性(Sultan, 2000; Albert et al., 2010), 导致植物功能性状随着局域尺度微环境改变而变化, 因而影响性状受进化或生理机制调控的权衡。但目前这方面的证据还较少, 需要更多属内或种内的研究。
植物生活在环境中, 其功能性状通常与植物在长期进化中与环境的适应性有关(Wilson et al., 1999; Ordoñez et al., 2009)。环境对不同物种的选择和过滤作用决定了植物功能性状沿着环境梯度呈现出可预测的、有方向的变化(Yang et al., 2019)。例如, 在资源供应丰富的环境中, 植物一般具有较高的SLA、较低的LDMC, 而在资源贫瘠的环境中, 植物的SLA较低而LDMC较高(Wilson et al., 1999; 刘晓娟和马克平, 2015)。很多大尺度(包含不同科、生活型或生态系统的物种)的植物功能性状研究发现, 降水量、温度、海拔以及土壤养分含量都对植物功能性状有较好的预测性(Ordoñez et al., 2009; Bruelheide et al., 2018; Yang et al., 2019; Kemppinen et al., 2021)。但这类研究大多是基于物种的平均功能性状, 没有考虑种内变异带来的影响。尽管植物功能性状的种内变异通常小于种间变异, 但个体间的差异仍然会影响植物性状-环境关系, 导致在种或属水平上的功能性状-环境关系减弱或不同于大尺度上的关系(Anderegg et al., 2018)。例如, 对同一物种的研究发现, 土壤养分含量对种内植物叶片性状的影响强于气候(Ordoñez et al., 2009); 对不同物种的研究则显示, 气候因子对植物SLA的解释率大于土壤养分含量(Liu et al., 2017)。因此, 在属和种水平上研究并理解植物性状-性状关系和性状-环境关系, 能够帮助我们更好地理解植物功能性状对环境的响应。
1 材料和方法
1.1 研究区概况
内蒙古自治区地处欧亚大陆腹地, 自东北向西南延伸, 东西直线距离2 400 km, 南北跨度约1 700 km, 地貌类型多样, 有山地、丘陵、高平原和平原。本研究区从东部大兴安岭低山丘陵区, 到中部草原区, 向西延伸至荒漠区, 覆盖的地理范围为37.92°-45.27° N, 103.98°-122.35° E, 海拔186-3 472 m。研究区以温带大陆性气候为主, 年平均气温从东北到西南递增, 约为-1.37-9.48 ℃, 年降水量从西南到东北递增, 约为97-483 mm。本区的灌丛群落分布范围广, 生境类型多样, 从东部的大兴安岭南部山地, 经中部广阔的沙地、草原, 到西部荒漠区的贺兰山均有生长。
1.2 植物调查和功能性状测定
图1
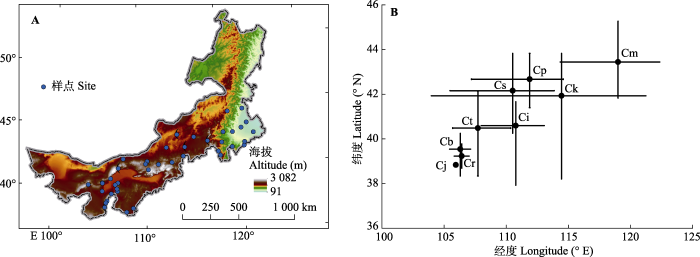
图1
内蒙古锦鸡儿属植物样点分布图(A)和取样地理范围(B)。B中黑色圆点代表经纬度平均值。Cb, 矮脚锦鸡儿; Ci, 中间锦鸡儿; Cj, 鬼箭锦鸡儿; Ck, 柠条锦鸡儿; Cm, 小叶锦鸡儿; Cp, 矮锦鸡儿; Cr, 荒漠锦鸡儿; Cs, 狭叶锦鸡儿; Ct, 毛刺锦鸡儿。
Fig. 1
Distribution map of observation sites (A) and geographical range of observation sites (B) of Caragana species in Nei Mongol. Black solid points in B represent the average latitude and longitude of the site locations of different species of Caragana species. Cb, C. brachypoda; Ci, C. intermedia; Cj, C. jubata; Ck, C. korshinskii; Cm, C. microphylla; Cp, C. pygmaea; Cr, C. roborovskyi; Cs, C. stenophylla; Ct, C. tibetica.
表1 内蒙古锦鸡儿属物种列表
Table 1
| 物种 Species | 干燥度指数范围 Aridity index range | 土壤氮含量范围 Soil nitrogen content range (mg·g-1) | 土壤pH范围 Soil pH range | 样点数 Sample number |
|---|---|---|---|---|
| 矮脚锦鸡儿 C. brachypoda | 0.17-0.33 | 0.2-0.5 | 8.49-8.90 | 5 |
| 毛刺锦鸡儿 C. tibetica | 0.25-0.43 | 0.3-3.2 | 8.55-8.86 | 4 |
| 荒漠锦鸡儿 C. roborovskyi | 0.31-0.45 | 0.7-3.7 | 8.07-8.78 | 2 |
| 矮锦鸡儿 C. pygmaea | 0.30-0.49 | 0.3-0.3 | 8.69-8.87 | 3 |
| 柠条锦鸡儿 C. korshinskii | 0.15-0.75 | 0.2-1.3 | 8.01-9.12 | 12 |
| 狭叶锦鸡儿 C. stenophylla | 0.22-0.69 | 0.5-1.2 | 8.54-8.57 | 4 |
| 中间锦鸡儿 C. intermedia | 0.30-0.59 | 0.3-3.0 | 8.62-8.87 | 5 |
| 小叶锦鸡儿 C. microphylla | 0.52-0.75 | 0.3-4.4 | 6.39-8.57 | 10 |
| 鬼箭锦鸡儿 C. jubata | 0.88 | 6.3 | 7.17 | 1 |
植物功能性状的测定参考Pérez-Harguindeguy等(2013)。在每个样地, 随机选取3-5株长势良好、未被遮阴的植物个体进行测定和采样。首先在野外测量植株从最高点到地面之间的垂直自然距离作为植株的株高(h, cm), 再从每株个体上采集10-15片完全展开、健康、完整的成熟叶片(对于叶片较小的植物, 从每株植物个体上另外采集了>3 g干质量的叶片), 用湿纸巾将叶片包裹后装进塑封袋, 装袋时排除袋子中的空气再将其密封, 从而提高CO2的浓度和空气湿度, 以减少叶片水分的流失, 然后将其放入便携简易冷藏箱贮存。将叶片带回室内后, 吸掉多余水分, 使用佳能Lide 120扫描仪(Lide 120, Canon, Tokyo, Japan)获得叶片图像后用Adobe Photoshop CS6计算得到每片复叶(包含叶柄)的叶面积, 复叶叶面积除以叶片数得到每片小叶面积(LA, cm2)。测量叶面积后的叶片用千分之一天平称鲜质量, 之后于65 ℃烘干至少24 h至恒质量, 用千分之一天平称量干质量(LM)。SLA (cm2·g-1) = LA/LM; LDMC =叶片干质量(g)/叶片鲜质量(g)。烘干的叶片粉碎后用于植物化学属性(氮(N)、磷(P)含量)的测定。烘干的叶片样品用高速万能粉碎机粉碎过60目筛, 用元素分析仪(vario EL III, Elementar, Hauau, Germany)测定LNC (mg·g-1); 使用电感耦合等离子体发射光谱仪(ICAP-6300, Thermo Fisher, Waltham, USA)测定LPC (mg·g-1)。叶化学属性的测定由中国科学院植物研究所分析测试中心完成。由于灌木植物的木质部多分枝, 在距地面10 cm处截断, 获取10 cm左右的一截茎秆, 放入塑封袋, 带回室内后用排水法测定茎体积(V), 在65 ℃烘干至恒质量后称量, 测得茎干质量(m), 进而计算出STD (g·cm-3) = m/V。
1.3 环境数据
1.3.1 土壤取样和室内分析
选择群落内部物种组成、群落结构和生境相对均匀且群落面积充足、地势相对平缓的样地。每个样地设置3个5 m × 5 m的样方, 样方边缘两两之间的距离不小于5 m, 不超过50 m。在各样地中心位置使用手持式GPS测定经纬度。
选取样方一条对角线两端及样方中心共3个点, 去除未分解及半分解凋落物层, 用土钻采集0-20 cm深度土壤样品, 将每个样方的土壤样品混合均匀后取1/4装入塑封袋, 带回实验室, 土壤自然风干后, 用2 mm筛除去根系和砾石, 取部分样品进一步去除较细的根系并粉碎后, 用元素分析仪(vario MACRO cube, Elementar, Hanau, Germany)测定土壤全N含量; 一部分风干土壤用METTLER TOLEDO台式pH仪(Fe20-K, METTLER TOLEDO, Zurich, Switzerland)测定土壤酸碱度(水:土质量比为 2.5:1)。
1.3.2 气候数据获取
气候数据来自WorldClim网站(Fick & Hijmans, 2017), 采用干燥度指数(年降水量/年潜在蒸散量)来表示环境的湿润状况, 数值越小表示越干旱。
1.3.3 数据分析
采用多元线性回归分析气候、土壤因子与植物功能性状的关系及不同环境变量对植物功能性状的影响程度。采用最小二乘法(OLS)对各功能性状和环境因子进行回归分析, 探讨各功能性状随环境因子的变化。根据多元线性回归结果, 采用残差回归的方法分析功能性状与具有解释率的土壤因子之间的关系, 即使用功能性状数据与干燥度指数进行简单线性回归后, 使用剔除了干燥度影响的残差与土壤因子进行简单线性回归与非线性回归, 保留拟合效果最好的模型。为了解不同功能性状的共变关系, 将原始功能性状数据以10为底进行对数转换, 然后采用标准主轴回归法(SMA)进行分析。为了探讨功能性状之间的共变关系是否与植物在种内和种间的变异程度有关, 计算了变异系数(CV) = 标准差/平均值× 100%。其中, 种内变异使用各物种所有个体的性状实测值计算, 种间变异使用每个物种的平均性状值计算。
所有数据分析和制图均在R 4.0.3软件中完成。
2 结果
2.1 功能性状和环境之间的关系
多元线性回归结果(表2)表明, 在属水平上, 气候因子是影响锦鸡儿属功能性状的关键因素, 干燥度指数对各功能性状的影响程度均大于土壤因子。干燥度指数解释了锦鸡儿属性状变异的8.42%- 67.39%, 除对叶片N:P没有显著影响外, 对其余7个性状的影响均显著, 解释率达到29%以上, 其中, 对LA的解释率高达67.39%。土壤N含量对h、LDMC、SLA、STD、LNC具有显著影响, 解释率在8.71%-23.21%之间, 对LA、LPC和N:P没有显著影响。土壤pH对锦鸡儿属植物的8个性状均无显著影响。
表2 内蒙古锦鸡儿属植物功能性状变异来源
Table 2
| 变异来源 Source of variation | h | LDMC | SLA | STD | LA | LNC | LPC | N:P | ||||||||
|---|---|---|---|---|---|---|---|---|---|---|---|---|---|---|---|---|
| F | SS% | F | SS% | F | SS% | F | SS% | F | SS% | F | SS% | F | SS% | F | SS% | |
| AI | 24.70 | 31.06*** | 32.72 | 40.80*** | 21.57 | 33.68*** | 16.61 | 29.76*** | 87.13 | 67.39*** | 20.45 | 31.80*** | 16.69 | 34.89*** | 2.77 | 8.42 |
| SN | 15.70 | 19.74*** | 6.99 | 8.71* | 5.61 | 8.76* | 8.41 | 15.07** | 0.26 | 0.20 | 14.93 | 23.21*** | 0.82 | 1.72 | 1.17 | 3.54 |
| SpH | 0.00 | 0.00 | 2.26 | 2.81 | 0.26 | 0.40 | 0.87 | 1.56 | 0.20 | 0.15 | 0.32 | 0.50 | 0.24 | 0.51 | 0.00 | 0.00 |
| AI × SN | 1.10 | 1.38 | 2.21 | 2.76 | 0.38 | 0.60 | 0.32 | 0.57 | 7.74 | 5.99** | 2.49 | 3.87 | 0.63 | 1.32 | 0.03 | 0.08 |
| AI × SpH | 1.17 | 1.47 | 1.38 | 1.72 | 2.52 | 3.94 | 0.04 | 0.07 | 0.79 | 0.61 | 0.07 | 0.11 | 1.18 | 2.48 | 3.25 | 9.85 |
| SN × SpH | 0.28 | 0.35 | 0.01 | 0.02 | 0.18 | 0.28 | 0.39 | 0.70 | 0.60 | 0.46 | 0.25 | 0.39 | 0.17 | 0.35 | 0.01 | 0.03 |
| AI × SN × SpH | 4.59 | 5.77* | 2.62 | 3.27 | 1.54 | 2.40 | 0.18 | 0.32 | 0.58 | 0.45 | 0.81 | 1.25 | 0.09 | 0.20 | 0.73 | 2.20 |
各性状的解释变量按照表中顺序依次输入模型中。AI, 干燥度指数; h, 株高; LA, 叶面积; LDMC, 叶干物质含量; LNC, 叶片氮含量; LPC, 叶片磷含量; N:P, 叶片氮磷比; SLA, 比叶面积; SN, 土壤氮含量; SpH, 土壤酸碱度; STD, 茎组织密度。SS%, 变量解释率。*, p < 0.05; **, p < 0.01; ***, p < 0.001。
Explanatory terms are listed in the order of their entry into the models. AI, aridity index; h, height; LA, leaf area; LDMC, leaf dry matter content; LNC, leaf nitrogen content; LPC, leaf phosphorus content; N:P, leaf nitrogen content to phosphorus content ratio; SLA, specific leaf area; SN, soil nitrogen content; SpH, soil pH; STD, stem tissue density. SS%, percentage of variation explained. *, p < 0.05; **, p < 0.01; ***, p < 0.001.
锦鸡儿属植物功能性状随着干燥度指数和土壤N含量的变化大多具有一定的趋势(图2, 图3), 随着干燥度指数增大(湿润程度增大), 锦鸡儿属h、SLA、LA、LNC和LPC均显著增大, LDMC和STD显著减小。由于干燥度指数与土壤N含量之间具有较强的相关关系, 使用剔除了干燥度指数影响的性状值残差与土壤N含量做回归分析, 结果(图3)显示, 在土壤N含量较高的地方, 锦鸡儿属植物具有更高的LDMC (p < 0.05, R2 = 0.18)和STD (p < 0.05, R2 = 0.18), 出乎意料的是h (p < 0.05, R2 = 0.23)、SLA (p < 0.05, R2 = 0.11)和LNC (p < 0.05, R2 = 0.35)较低。
图2
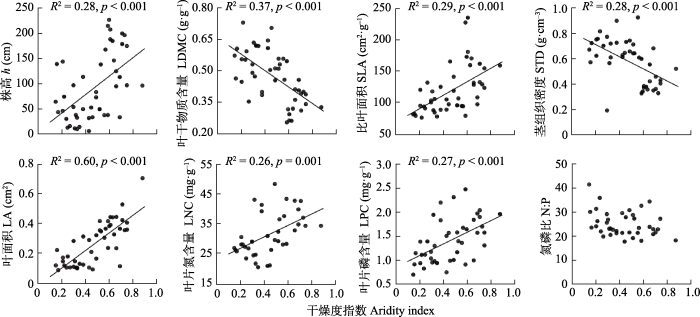
图2
内蒙古锦鸡儿属植物功能性状与干燥度指数的关系。
Fig. 2
Relationships between functional traits of Caragana species and aridity index in Nei Mongol, China. h, height; LA, leaf area; LDMC, leaf dry matter content; LNC, leaf nitrogen content; LPC, leaf phosphorus content; N:P, leaf nitrogen content to phosphorus content ratio; SLA, specific leaf area; STD, stem tissue density.
图3
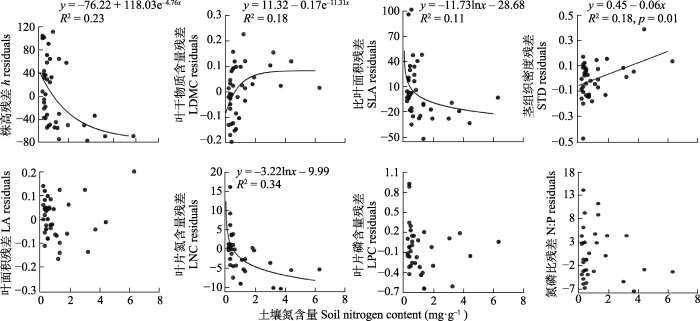
图3
内蒙古锦鸡儿属植物功能性状与土壤氮含量的关系。
Fig. 3
Relationships between functional traits of Caragana species and soil nitrogen content in Nei Mongol. h, height; LA, leaf area; LDMC, leaf dry matter content; LNC, leaf nitrogen content; LPC, leaf phosphorus content; N:P, leaf nitrogen content to phosphorus content ratio; SLA, specific leaf area; STD, stem tissue density.
2.2 功能性状的共变关系
结果表明, 在属水平上, 锦鸡儿属植物的各叶经济谱性状、h以及STD彼此之间存在较强的关系(表3), 除了h-N:P、STD-N:P共变关系不显著外, 其余23对性状共变关系均显著, R2介于0.03-0.59之间, 其中LDMC与SLA之间的权衡关系最为显著(R2 = 0.59)。在种内性状关系上, 地理分布最广的柠条锦鸡儿(图1B)的25组性状共变关系均显著, R2介于0.13-0.84之间, 性状共变关系与在属水平上表现的关系一致(表3), 例如, 在属水平上和柠条锦鸡儿种内, 随着h增大, LDMC均显著减小, SLA均显著增大。地理分布范围仅次于柠条锦鸡儿的小叶锦鸡儿(图1B)有16组性状共变关系显著, R2介于0.11-0.72之间, 性状共变关系也与在属水平上表现的关系一致(表3); 其余7个物种的功能性状间的关系则相对较弱, 且大多数功能性状之间的关系并不显著(图4), 其中只在一个样点出现的鬼箭锦鸡儿性状间的关系均不显著; 而矮锦鸡儿h-LDMC显著正相关, 荒漠锦鸡儿h-SLA、h-LNC、LA-LNC显著负相关, LDMC-LNC显著正相关, 这些在种内的性状关系与在属水平上观察到的相反(表3)。通过计算功能性状在种内和种间的变异系数(表4)发现, h (46.11%, 70.54%)、LDMC (20.42%, 20.55%)、LA (26.49%,75.46%)和LNC (14.26%, 19.59%)这4个性状种内变异小于种间变异, SLA (25.91%, 21.36%)、STD (26.05%, 19.66%)、LPC (29.82%, 22.89%)和N:P (21.19%, 12.72%)种内变异大于种间变异。
表3 内蒙古锦鸡儿属性状间的关系
Table 3
| x | y | 锦鸡儿属 C. species | 矮锦鸡儿 C. pygmaea | 矮脚锦鸡儿 C. brachypoda | 鬼箭锦鸡儿 C. jubata | 荒漠锦鸡儿 C. roborovskyi | 毛刺锦鸡儿 C. tibetica | 柠条锦鸡儿 C. korshinskii | 狭叶锦鸡儿 C. stenophylla | 小叶锦鸡儿 C. microphylla | 中间锦鸡儿 C. intermedia | ||||||||||
|---|---|---|---|---|---|---|---|---|---|---|---|---|---|---|---|---|---|---|---|---|---|
| 斜率 Slope | 截距 Intercept | 斜率 Slope | 截距 Intercept | 斜率 Slope | 截距 Intercept | 斜率 Slope | 截距 Intercept | 斜率 Slope | 截距 Intercept | 斜率 Slope | 截距 Intercept | 斜率 Slope | 截距 Intercept | 斜率 Slope | 截距 Intercept | 斜率 Slope | 截距 Intercept | 斜率 Slope | 截距 Intercept | ||
| h | LDMC | -0.31*** | 0.21 | 0.61 | -1.40 | 0.50* | -1.03 | -0.39 | 0.29 | -0.15** | -0.04 | -0.39 | 0.16 | -0.56*** | 0.80 | 0.86 | -1.66 | -0.45*** | 0.52 | -0.26 | 0.19 |
| SLA | 0.33*** | 1.45 | 0.75 | 0.70 | -0.47 | 2.69 | 0.70 | 0.81 | -0.18* | 2.27 | -0.51 | 2.43 | 0.69*** | 0.62 | -0.79 | 3.24 | 0.54*** | 1.00 | 0.23** | 1.56 | |
| STD | -0.43*** | 0.52 | -1.40 | 2.33 | 0.43 | -0.76 | -0.49 | 0.69 | 0.21 | -0.55 | -0.23 | -0.02 | -0.75** | 1.29 | 0.95 | -1.74 | -0.65*** | 0.97 | -0.83 | 1.16 | |
| LA | 0.64*** | -1.83 | 1.02 | -2.71 | 0.51 | -1.75 | -0.89 | 1.60 | 0.24* | -1.10 | 0.64* | -1.53 | 0.98*** | -2.64 | 0.42 | -1.66 | 0.38** | -1.21 | 0.47 | -1.36 | |
| LNC | 0.25*** | 1.06 | 0.68 | 0.37 | 0.19 | 1.15 | 0.38 | 0.77 | -0.10** | 1.49 | 0.17 | 1.16 | 0.42* | 0.65 | -0.54 | 2.41 | 0.26*** | 1.04 | 0.20 | 1.12 | |
| LPC | 0.37*** | -0.55 | 1.14 | -1.76 | -0.46 | 0.72 | 0.79 | -1.27 | 0.51 | -0.65 | 0.41** | -0.44 | 0.88*** | -1.74 | -0.80 | 1.45 | 0.36*** | -0.55 | 0.44 | -0.71 | |
| N:P | -0.26 | 1.82 | -0.75 | 2.65 | 0.45 | 0.72 | -0.60 | 2.44 | -0.55 | 2.06 | -0.33** | 1.69 | -0.58*** | 2.64 | 0.31 | 0.87 | -0.23 | 1.84 | 0.38 | 0.74 | |
| LDMC | SLA | -1.07*** | 1.67 | -1.24 | 1.58 | -0.95*** | 1.71 | -1.79 | 1.33 | 1.21 | 2.32 | -1.28 | 1.67 | -1.23*** | 1.60 | -0.92 | 1.71 | -1.20*** | 1.62 | -0.87 | 1.72 |
| STD | 1.32*** | 0.20 | 2.23 | 0.64 | -0.85 | -0.41 | -1.26 | -0.90 | -0.75 | -0.41 | -0.49 | -0.31 | 1.33*** | 0.22 | 1.11 | 0.11 | 1.35*** | 0.20 | 3.19 | 0.55 | |
| LA | -2.07*** | -1.39 | 1.69 | -0.34 | -1.03 | -1.32 | -2.27 | -1.26 | -1.61* | -1.16 | -1.51 | -1.24 | -1.74*** | -1.26 | 0.49 | -0.85 | -0.83* | -0.78 | 1.79 | -0.06 | |
| LNC | -0.86*** | 1.21 | -1.13 | 1.18 | -0.37 | 1.31 | -0.98 | 1.05 | 0.66** | 1.51 | -0.43 | 1.24 | -0.74*** | 1.23 | -0.64*** | 1.35 | -0.75*** | 1.27 | -0.77 | 1.27 | |
| LPC | -1.32*** | -0.33 | -1.88** | -0.43 | -0.91* | -0.22 | -2.01 | -0.69 | -3.36 | -0.78 | -1.04 | -0.27 | -1.69*** | -0.55 | -0.94*** | -0.11 | -1.06** | -0.22 | 1.69 | 0.52 | |
| N:P | 0.88*** | 1.67 | 1.23** | 1.77 | 0.90 | 1.64 | 1.54 | 2.00 | 3.66 | 2.21 | 0.83 | 1.56 | 1.04*** | 1.83 | 0.37*** | 1.48 | 0.68 | 1.63 | -1.46 | 1.02 | |
| SLA | STD | -1.21*** | 2.22 | -1.84 | 3.57 | 0.90 | -1.94 | -0.70 | 1.26 | -0.28 | 0.36 | 0.34 | -0.89 | -1.08*** | 1.96 | 1.21 | -2.57 | -1.13** | 2.03 | -3.66 | 6.85 |
| LNC | 0.82*** | -0.18 | 0.91 | -0.26 | 0.39 | 0.64 | 0.55 | 0.33 | 0.55 | 0.24 | -0.34 | 1.99 | 0.59*** | 0.30 | -0.70 | 2.91 | 0.69* | 0.11 | 0.89* | -0.26 | |
| LPC | 1.25*** | -2.42 | 1.51 | -2.81 | 0.96 | -1.87 | 1.12 | -2.18 | 2.79 | -5.58 | -0.81 | 1.53 | 1.31*** | -2.62 | -1.03 | 2.19 | 0.99* | -1.87 | 1.95* | -3.74 | |
| N:P | -0.85*** | 3.09 | -1.00 | 3.34 | -0.94 | 3.25 | 0.86 | -0.64 | -3.04 | 7.44 | 0.64 | 0.13 | -0.83*** | 3.14 | -0.40 | 2.16 | -0.63 | 2.68 | -1.67 | 4.68 | |
| STD | LA | -1.62*** | -1.11 | 0.75 | -0.84 | 1.20 | -0.83 | 1.80 | 0.36 | 2.33 | -0.25 | -1.46 | -1.32 | -1.31** | -0.96 | 0.44 | -0.90 | -0.63 | -0.67 | 0.56 | -0.37 |
| LNC | -0.57** | 1.35 | 0.49 | 1.62 | -0.44 | 1.36 | -0.78 | 1.31 | -0.58 | 1.21 | 0.64 | 1.46 | -0.54* | 1.36 | -0.57 | 1.42 | -0.37 | 1.43 | 0.24 | 1.55 | |
| LPC | -0.92* | -0.12 | 0.85 | 0.33 | 1.07 | 0.22 | -1.60 | -0.17 | -12.72 | -2.28 | 1.85 | 0.31 | -1.16** | -0.25 | -0.85 | 0 | -0.56 | -0.01 | 0.53 | 0.23 | |
| N:P | 0.62 | 1.54 | 0.55 | 1.41 | -1.05 | 1.21 | 1.23 | 1.60 | 12.63 | 3.58 | -1.54 | 1.08 | 0.75* | 1.65 | -0.33 | 1.31 | 0.36 | 1.50 | -0.46 | 1.27 | |
| LA | LNC | 0.38*** | 1.76 | 0.67 | 2.19 | 0.36 | 1.78 | 0.43 | 1.60 | -0.41* | 1.03 | 0.27 | 1.58 | 0.44*** | 1.78 | 1.29 | 2.81 | 0.74* | 1.88 | 0.43 | 1.71 |
| LPC | 0.57*** | 0.51 | 1.11 | 1.26 | 0.89 | 0.96 | -0.89 | 0.14 | 2.09 | 1.65 | 0.65* | 0.55 | 0.87*** | 0.59 | 1.91 | 2.04 | 1.05 | 0.65 | 0.94* | 0.57 | |
| N:P | -0.39* | 1.10 | 0.73 | 2.02 | 0.87 | 2.24 | 0.68 | 1.36 | -2.28 | -0.44 | -0.51 | 0.91 | -0.61*** | 1.06 | -0.74 | 0.64 | -0.67 | 1.08 | -0.81* | 0.97 | |
| LNC | LPC | 1.56*** | -2.21 | 1.66** | -2.38 | 2.46 | -3.44 | 2.05 | -2.86 | -5.05 | 6.87 | 2.40** | -3.24 | 2.24*** | -3.31 | 1.48*** | -2.11 | 1.42*** | -2.03 | 2.19* | -3.17 |
h, 株高; LA, 叶面积; LDMC, 叶干物质含量; LNC, 叶片氮含量; LPC, 叶片磷含量; N:P, 叶片氮磷比; SLA, 比叶面积; STD, 茎组织密度。*, p < 0.05; **, p < 0.01; ***, p < 0.001。
h, height; LA, leaf area; LDMC, leaf dry matter content; LNC, leaf nitrogen content; LPC, leaf phosphorus content; N:P, leaf nitrogen content to phosphorus content ratio; SLA, specific leaf area; STD, stem tissue density. *, p < 0.05; **, p < 0.01; ***, p < 0.001.
表4 内蒙古锦鸡儿属植物功能性状在种内和种间的变异系数
Table 4
| h | LDMC | SLA | STD | LA | LNC | LPC | N:P | |
|---|---|---|---|---|---|---|---|---|
| 种内变异 Intraspecies variation | 46.11% | 20.42% | 25.91% | 26.05% | 26.49% | 14.26% | 29.82% | 21.19% |
| 种间变异 Interspecies variation | 70.54% | 20.55% | 21.36% | 19.66% | 75.46% | 19.59% | 22.89% | 12.72% |
h, 株高; LA, 叶面积; LDMC, 叶干物质含量; LNC, 叶片氮含量; LPC, 叶片磷含量; N:P, 叶片氮磷比; SLA, 比叶面积; STD, 茎组织密度。
h, height; LA, leaf area; LDMC, leaf dry matter content; LNC, leaf nitrogen content; LPC, leaf phosphorus content; N:P, leaf nitrogen content to phosphorus content ratio; SLA, specific leaf area; STD, stem tissue density.
图4
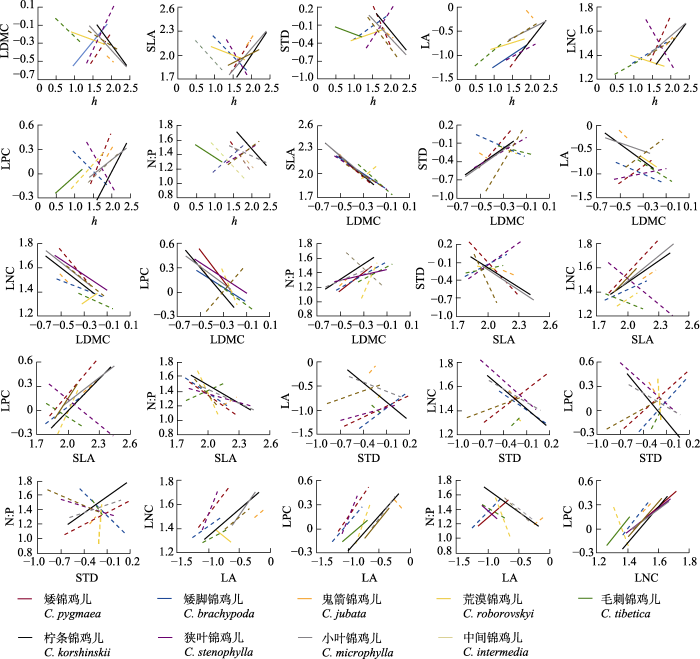
图4
内蒙古锦鸡儿属植物性状间的关系。实线表示p < 0.05, 虚线表示p ≥ 0.05。h, 株高; LA, 叶面积; LDMC, 叶干物质含量; LNC, 叶片氮含量; LPC, 叶片磷含量; N:P, 叶片氮磷比; SLA, 比叶面积; STD, 茎组织密度。
Fig. 4
Relationships between traits of Caragana species in Nei Mongol, China. Solid line represents p < 0.05, and dashed line represents p ≥ 0.05. h, height; LA, leaf area; LDMC, leaf dry matter content; LNC, leaf nitrogen content; LPC, leaf phosphorus content; N:P, leaf nitrogen content to phosphorus content ratio; SLA, specific leaf area; STD, stem tissue density.
3 讨论
3.1 功能性状在环境梯度上的变化
在干旱、半干旱地区, 植物的生长受到水分有效性的限制(Wei et al., 2011), 为了适应干旱特征, 植物大多发育了适应干旱的形态结构、生理生态等特征(Liu et al., 2017)。例如, 本研究中锦鸡儿属植物在干旱环境中具有较大的STD, 有利于提高水分利用效率并抵御不利环境(刘晓娟和马克平, 2015), 同时通过较小的LA减少蒸腾作用丢失的水分(England & Attiwill, 2006)。随着干燥度指数增大, 水分对植物的限制减弱, 植物权衡开始偏向“投资”:此时h增大可以增加对光照、空间等资源的竞争能力(Westoby et al., 1998), SLA和LNC增大可有效增强光合作用(Wei et al., 2011; Liu et al., 2017); 而P是细胞核酸和蛋白质的重要组成成分, 能够影响细胞分裂等植物生理过程(Lambers et al., 1998), 在湿润环境中锦鸡儿属较高的LPC反映了植物生长迅速。在本研究中, 干燥度指数对锦鸡儿属植物的h、STD以及叶形态和化学特征的变化都具有较好的解释力。这一结果与Xie等(2014)对内蒙古锦鸡儿属12个物种的叶片结构、生理特征以及化学组成特征的研究结果类似, 该研究也发现在较湿润的区域, 植物具有较高的SLA和叶绿素含量, 以维持较高的生长速率。在属水平上, 锦鸡儿属植物功能性状与干燥度指数之间的关系和多数在种间观察到的性状-气候关系一致, 尤其是在包含了更高分类等级物种的研究中, 气候的调控作用更明显(Wright et al., 2004; Reich et al., 2007)。但有研究发现, 种内功能性状-气候关系可能不同于在更大尺度上种间的性状-气候关系(Niinemets, 2015; Turtureanu et al., 2020; Di Biase et al., 2021), 这意味着不同物种对局域尺度短期环境变化的响应模式可能存在较大差异(Fyllas et al., 2020)。因此, 根据一般的性状-气候关系不一定能准确地预测某个物种对未来气候变化的响应, 并且在区域或更大的尺度上研究性状-气候关系可能需要考虑种内变异的影响(Meng et al., 2017)。
土壤条件也是影响植物功能性状的重要因子。但出乎意料的是, 本研究在剔除了干燥度对锦鸡儿属植物功能性状的影响后, h、LNC和SLA分别与土壤N含量负相关。一方面可能是因为土壤总N含量, 并不能很好地代表土壤有效N的供应; 另一方面, 植物有其特殊的适应土壤N环境变化的机制。本研究中的锦鸡儿属是豆科植物, 可以通过自身的固氮能力来提高对N的吸收, 其LNC不完全依赖于环境中的N供应。杨士梭等(2014)对科水平上植物功能性状与土壤因子间相关性的研究也发现, 豆科植物LNC和SLA均与土壤N的供应无关。而土壤pH一般通过影响土壤养分来间接影响植物功能性状(Hinsinger, 2001), 本研究中土壤N含量与土壤pH没有显著相关性(r = -0.32, p = 0.05), 这可能是土壤pH对性状解释率较低的原因。
3.2 植物功能性状之间的关系在属和种水平上的差异
本研究的分析结果表明, 在属水平上, 植物功能性状之间具有较好的共变性, 这与基于较大尺度, 包含科水平的多物种数据观测到的植物性状关系(Reich et al., 1999; Wilson et al., 1999; Wright et al., 2004; Wei et al., 2011)基本一致, 这意味着锦鸡儿属植物的功能性状的变化支持植物经济谱假说(Wright et al., 2004)。体型较高的植物, 通常具有更大的SLA、LA, 和更高的LNC、LPC, 同时LDMC和STD较低, 这类植物权衡偏向快速投资-收益端, 即资源被更多地投资在增加h和LA上, 以获取更多的空间和光照等资源; 但LA增大意味着蒸腾散失更多的水分(England & Attiwill, 2006), 因此, 需要降低STD以提高导水能力, 从而运输更多的水分到叶片(Sack et al., 2003), 以满足植物生长需求。而在干旱地区分布的锦鸡儿属植物, 具有更高的LDMC和STD, 叶干物质含量能够反映植物的耐旱性(Blumenthal et al., 2020), 具有高STD的植物通常也具有更坚硬的细胞壁, 这允许植物在较低的水势下维持叶片膨压, 从而适应干旱环境, 植物权衡此时偏向慢速投资-收益端。在属水平上观察到的功能性状之间的关系与多数木本植物的规律(Pietsch et al., 2014; de la Riva et al., 2016)一致。但也有研究报道了相反的关系, 例如Jin等(2014)在常绿、落叶森林的研究中, 发现木本植物的株高与比叶质量(LMA = 1/SLA)呈正相关关系, 与LNC、LPC则没有显著的相关关系。这可能是因为物种特异性或生活环境的差异导致乔木与灌木物种的生存策略不同。
在包含不同物种的更高的分类学等级(如属、科)上, 功能性状沿着环境梯度的变化主要受植物对环境的进化适应所主导(Bruelheide et al., 2018), 而种内性状的变化主要反映了植物对短期环境变化或微环境的适应(表型可塑性)(Lusk et al., 2008; Laughlin et al., 2017)。尽管植物的表型可塑性大多与进化响应相似, 植物性状关系在种内和种间通常一致, 但也有例外。例如, 本研究中, 与在属水平相反, 荒漠锦鸡儿LA和LNC显著负相关, 可能是因为在较干旱的地区, 植物个体通过减小LA以减小蒸腾(England & Attiwill, 2006), 增大LNC以提高渗透压(Liu et al., 2017), 从而缓解干旱对植物生长的影响。近年来有不少研究都发现, 植物功能性状间的关系依赖于研究尺度, 尤其是分类学尺度, 在更低级的分类学水平上(如种内), 某些性状间的关系一般比更高级分类学水平(如种间)弱(Messier et al., 2017; Anderegg et al., 2018)。在本研究中, 锦鸡儿属不同种在环境梯度上形成了替代分布, 不同的物种长期生存在不同环境下形成了相对稳定的生存策略, 而柠条锦鸡儿和小叶锦鸡儿在种内功能性状之间具有较强的共变性, 反映了它们可以通过采取不同的策略以适应不同的环境条件, 这可能是它们分布范围更广的原因。而一些物种分布的环境范围较窄, 如鬼箭锦鸡儿和荒漠锦鸡儿(图1B), 这类物种通常稳定于经济型谱的某一点附近, 功能性状间的共变关系较弱, 表明这些物种已经形成了适应特定环境的相对稳定的生活策略(Liao et al., 2012)。虽然很多研究证据显示, 植物功能性状的种内变异性低于种间变异(Garnier et al., 2001; Meng et al., 2017)。但在本研究中, 有的性状种内性状变异较大, 如SLA、STD、LPC和N:P的种内变异甚至超过了种间变异(表4)。这体现了植物在个体水平上的功能性状具有较强的可塑性。这种可塑性在一定程度上也会削弱在种内观察到的植物功能性状间的关系(Laughlin et al., 2017), 因此, 植物个体水平上对环境响应的差异可能导致种内性状关系不同于种间性状关系, 在更高一级的分类学尺度上研究植物功能性状关系如果采用物种平均性状, 在一定程度上忽略了种内变异带来的影响。
4 结论
本研究通过对在内蒙古形成替代分布的锦鸡儿属物种的功能性状研究, 发现在属水平上, 锦鸡儿属植物功能性状主要受到气候因子影响, 土壤N含量也能够解释一部分功能性状变异。而植物功能性状关系在属水平和种内水平存在一定差异: 在属水平上, 性状之间具有较好的共变关系, 而在种内水平, 分布广的物种(如柠条锦鸡儿)性状间的共变关系较显著, 分布范围较小的物种性状间的关系微弱。这意味着, 在更高分类等级上观察到的植物功能性状间的关系可能并不适合理解或预测在局域尺度物种种内水平的适应策略, 基于物种平均功能性状的植被模型来预测植物特征对气候等环境变化的响应可能并不准确。未来的研究可能需要更多考虑种内变异, 但是, 在何种程度上, 什么时候需要考虑种内变异还需要更多研究。
致谢
感谢蒙古高原生态学与资源利用教育部重点实验室开放基金课题(KF2020010)的资助。
参考文献
A multi-trait approach reveals the structure and the relative importance of intra- vs. interspecific variability in plant traits
DOI:10.1111/j.1365-2435.2010.01727.x URL [本文引用: 1]
Within-species patterns challenge our understanding of the leaf economics spectrum
DOI:10.1111/ele.12945
PMID:29569818
[本文引用: 3]

The utility of plant functional traits for predictive ecology relies on our ability to interpret trait variation across multiple taxonomic and ecological scales. Using extensive data sets of trait variation within species, across species and across communities, we analysed whether and at what scales leaf economics spectrum (LES) traits show predicted trait-trait covariation. We found that most variation in LES traits is often, but not universally, at high taxonomic levels (between families or genera in a family). However, we found that trait covariation shows distinct taxonomic scale dependence, with some trait correlations showing opposite signs within vs. across species. LES traits responded independently to environmental gradients within species, with few shared environmental responses across traits or across scales. We conclude that, at small taxonomic scales, plasticity may obscure or reverse the broad evolutionary linkages between leaf traits, meaning that variation in LES traits cannot always be interpreted as differences in resource use strategy.© 2018 John Wiley & Sons Ltd/CNRS.
Traits link drought resistance with herbivore defence and plant economics in semi-arid grasslands: the central roles of phenology and leaf dry matter content
DOI:10.1111/1365-2745.13454 URL [本文引用: 1]
Fine root tradeoffs between nitrogen concentration and xylem vessel traits preclude unified whole-plant resource strategies in Helianthus
DOI:10.1002/ece3.1947
PMID:26941942
[本文引用: 2]
Recent work suggests variation in plant growth strategies is governed by a tradeoff in resource acquisition and use, ranging from a rapid resource acquisition strategy to a resource-conservative strategy. While evidence for this tradeoff has been found in leaves, knowledge of root trait strategies, and whether they reflect adaptive differentiation across environments, is limited. In the greenhouse, we investigated variation in fine root morphology (specific root length and tissue density), chemistry (nitrogen concentration and carbon:nitrogen), and anatomy (root cross-sectional traits) in populations of 26 Helianthus species and sister Phoebanthus tenuifolius. We also compared root trait variation in this study with leaf trait variation previously reported in a parallel study of these populations. Root traits varied widely and exhibited little phylogenetic signal, suggesting high evolutionary lability. Specific root length and root tissue density were weakly negatively correlated, but neither was associated with root nitrogen, providing little support for a single axis of root trait covariation. Correlations between traits measured in the greenhouse and native site characteristics were generally weak, suggesting a variety of equally viable root trait combinations exist within and across environments. However, high root nitrogen was associated with lower xylem vessel number and cross-sectional area, suggesting a tradeoff between nutrient investment and water transport capacity. This led to correlations between root and leaf traits that were not always consistent with an acquisition-conservation tradeoff at the whole-plant level. Given that roots must balance acquisition of water and nutrients with functions like anchorage, exudation, and microbial symbioses, the varied evidence for root trait covariation likely reflects the complexity of interacting selection pressures belowground. Similarly, the lack of evidence for a single acquisition-conservation tradeoff at the whole-plant level likely reflects the vastly different selection pressures shaping roots and leaves, and the resources they are optimized to obtain.
Global trait-environment relationships of plant communities
Towards a worldwide wood economics spectrum
DOI:10.1111/j.1461-0248.2009.01285.x
PMID:19243406
[本文引用: 1]
Wood performs several essential functions in plants, including mechanically supporting aboveground tissue, storing water and other resources, and transporting sap. Woody tissues are likely to face physiological, structural and defensive trade-offs. How a plant optimizes among these competing functions can have major ecological implications, which have been under-appreciated by ecologists compared to the focus they have given to leaf function. To draw together our current understanding of wood function, we identify and collate data on the major wood functional traits, including the largest wood density database to date (8412 taxa), mechanical strength measures and anatomical features, as well as clade-specific features such as secondary chemistry. We then show how wood traits are related to one another, highlighting functional trade-offs, and to ecological and demographic plant features (growth form, growth rate, latitude, ecological setting). We suggest that, similar to the manifold that tree species leaf traits cluster around the 'leaf economics spectrum', a similar 'wood economics spectrum' may be defined. We then discuss the biogeography, evolution and biogeochemistry of the spectrum, and conclude by pointing out the major gaps in our current knowledge of wood functional traits.
A plant economics spectrum in Mediterranean forests along environmental gradients: Is there coordination among leaf, stem and root traits?
The role of inter-and intraspecific variations in grassland plant functional traits along an elevational gradient in a Mediterranean Mountain area
DOI:10.3390/plants10020359 [本文引用: 1]
Changes in leaf morphology and anatomy with tree age and height in the broadleaved evergreen species, Eucalyptus regnans F.
DOI:10.1007/s00468-005-0015-5 URL [本文引用: 3]
WorldClim 2: new 1-km spatial resolution climate surfaces for global land areas
DOI:10.1002/joc.5086 URL [本文引用: 1]
Evidence of the ‘plant economics spectrum’ in a subarctic flora
DOI:10.1111/j.1365-2745.2009.01615.x URL [本文引用: 1]
Functional trait variation among and within species and plant functional types in mountainous Mediterranean forests
DOI:10.3389/fpls.2020.00212 [本文引用: 1]
A standar- dized protocol for the determination of specific leaf area and leaf dry matter content
DOI:10.1046/j.0269-8463.2001.00563.x URL [本文引用: 1]
Evidence for the existence of three primary strategies in plants and its relevance to ecological and evolutionary theory
DOI:10.1086/283244 URL [本文引用: 1]
Plant trait networks: improved resolution of the dimensionality of adaptation
DOI:10.1016/j.tree.2020.06.003 URL [本文引用: 1]
Bioavailability of soil inorganic P in the rhizosphere as affected by root-induced chemical changes: a review
DOI:10.1023/A:1013351617532 URL [本文引用: 1]
The global distribution of grass functional traits within grassy biomes
DOI:10.1111/jbi.13764 URL [本文引用: 2]
Leaf functional traits vary with the adult height of plant species in forest communities
DOI:10.1093/jpe/rtt023 URL [本文引用: 1]
Consistent trait-environment relationships within and across tundra plant communities
Global biogeography of scaly tree ferns (Cyatheaceae): evidence for Gondwanan vicariance and limited transoceanic dispersal
Scaly tree ferns, Cyatheaceae, are a well-supported group of mostly tree-forming ferns found throughout the tropics, the subtropics and the south-temperate zone. Fossil evidence shows that the lineage originated in the Late Jurassic period. We reconstructed large-scale historical biogeographical patterns of Cyatheaceae and tested the hypothesis that some of the observed distribution patterns are in fact compatible, in time and space, with a vicariance scenario related to the break-up of Gondwana.Tropics, subtropics and south-temperate areas of the world.The historical biogeography of Cyatheaceae was analysed in a maximum likelihood framework using Lagrange. The 78 ingroup taxa are representative of the geographical distribution of the entire family. The phylogenies that served as a basis for the analyses were obtained by Bayesian inference analyses of mainly previously published DNA sequence data using MrBayes. Lineage divergence dates were estimated in a Bayesian Markov chain Monte Carlo framework using beast.Cyatheaceae originated in the Late Jurassic in either South America or Australasia. Following a range expansion, the ancestral distribution of the marginate-scaled clade included both these areas, whereas is reconstructed as having its origin only in Australasia. Within the marginate-scaled clade, reconstructions of early divergences are hampered by the unresolved relationships among the, and lineages. Nevertheless, it is clear that the occurrence of the and lineages in South America may be related to vicariance, whereas transoceanic dispersal needs to be inferred for the range shifts seen in and.The evolutionary history of Cyatheaceae involves both Gondwanan vicariance scenarios as well as long-distance dispersal events. The number of transoceanic dispersals reconstructed for the family is rather few when compared with other fern lineages. We suggest that a causal relationship between reproductive mode (outcrossing) and dispersal limitations is the most plausible explanation for the pattern observed.
Intraspecific trait variation can weaken interspecific trait correlations when assessing the whole-plant economic spectrum
DOI:10.1002/ece3.3447
PMID:29152189
[本文引用: 3]
The worldwide plant economic spectrum hypothesis predicts that leaf, stem, and root traits are correlated across vascular plant species because carbon gain depends on leaves being adequately supplied with water and nutrients, and because construction of each organ involves a trade-off between performance and persistence. Despite its logical and intuitive appeal, this hypothesis has received mixed empirical support. If traits within species diverge in their responses to an environmental gradient, then interspecific trait correlations could be weakened when measured in natural ecosystems. To test this prediction, we measured relative growth rates (RGR) and seven functional traits that have been shown to be related to fluxes of water, nutrients, and carbon across 56 functionally diverse tree species on (1) juveniles in a controlled environment, (2) juveniles in forest understories, and (3) mature trees in forests. Leaf, stem, and fine root traits of juveniles grown in a controlled environment were closely correlated with each other, and with RGR. Remarkably, the seven leaf, stem, and fine root tissue traits spanned a single dimension of variation when measured in the controlled environment. Forest-grown juveniles expressed lower leaf mass per area, but higher wood and fine root tissue density, than greenhouse-grown juveniles. Traits and growth rates were decoupled in forest-grown juveniles and mature trees. Our results indicate that constraints exist on the covariation, not just the variation, among vegetative plant organs; however, divergent responses of traits within species to environmental gradients can mask interspecific trait correlations in natural environments. Correlations among organs and relationships between traits and RGR were strong when plants were compared in a standardized environment. Our results may reconcile the discrepancies seen among studies, by showing that if traits and growth rates of species are compared across varied environments, then the interorgan trait correlations observed in controlled conditions can weaken or disappear.
Leaf traits and persistence of relict and endangered tree species in a rare plant community
DOI:10.1071/FP11291
PMID:32480802
[本文引用: 1]
The rare plant communities, located in Houhe Nature Reserve, Hubei, China, are remnant evergreen and deciduous mixed broadleaved forest where many tree species have been identified as Tertiary relict and endangered plants and environmental conditions are typically characterised by low light and high rainfall. Knowledge of their patterns of leaf traits would contribute to our understanding of persistence of relict and endangered species. Here, we measured leaf mass per unit area (LMA), mass-based photosynthetic capacity (Amass), nitrogen content (Nmass), construction cost (CCmass) and photosynthetic nitrogen-use efficiency (PNUE) of 20 major tree species in a typical rare plant community. Correlations among leaf traits in the community were consistent with those from the global dataset, but they had lower Amass at any given Nmass and lower Amass and PNUE at any given LMA. Such results suggested the capacity and efficiency of photosynthetic gain from a unit investment in leaf tissue tend to be lower in the community. Moreover, they had lower LMA, CCmass and PNUE but higher Nmass than global broadleaved tree species. For relict and endangered species, the common limited factors (such as low light and high rainfall), similar leaf traits as coexisting deciduous non-endangered species and significant leaf trait relationships may allow them to persist in the community.
Changes in specific leaf area of dominant plants in temperate grasslands along a 2500-km transect in Northern China
DOI:10.1038/s41598- 017-11133-z [本文引用: 5]
Plant functional traits—Concepts, applications and future directions
植物功能性状研究进展
Why are evergreen leaves so contrary about shade?
DOI:10.1016/j.tree.2008.02.006 URL [本文引用: 1]
Geographical variation and the role of climate in leaf traits of a relict tree species across its distribution in China
DOI:10.1111/plb.12564
PMID:28294500
[本文引用: 2]
Intraspecific trait variation and trait-climate relationships are crucial for understanding a species' response to climate change. However, these phenomena have rarely been studied for tree species. Euptelea pleiospermum is a relict tree species with a wide distribution in China that offers a novel opportunity to examine such relationships. Here, we measured 13 leaf traits of E. pleiospermum in 20 sites across its natural distribution in China. We investigated the extent of trait variation at local and regional scales, and developed geographic and climate models to explain trait variation at the regional scale. We documented intraspecific trait variation among leaf traits of E. pleiospermum at local and regional scales. Five traits exhibited relatively high trait variation: leaf area, leaf density and three leaf economic traits (leaf dry matter content, specific leaf area [SLA] and leaf phosphorus concentration). Significant trait-geography correlations were mediated by local climate. Most leaf trait variation could be explained (from 24% to 64%) by geographic or climate variables, except leaf width, leaf thickness, leaf dry matter content and leaf length-width ratio. Latitude and temperature were the strongest predictors of trait variation throughout the distribution of E. pleiospermum in China, and temperature explained more leaf trait variation than precipitation. In particular, we showed that leaves had longer petiole lengths, higher SLA and lower densities in northern E. pleiospermum populations. We suggest that northern E. pleiospermum populations are adapting to higher latitudinal environments via high growth rate (higher SLA) and low construction investment strategies (lower leaf densities), benefitting northern migration. Overall, we demonstrate that intraspecific trait variation reflects E. pleiospermum response to the local environment. We call for consideration of intraspecific trait variation to examine specific climate response questions. In addition, provenance experiments using widely distributed species are needed to separate trait variation resulting from genetic differentiation and plastic responses to environmental change.© 2017 German Botanical Society and The Royal Botanical Society of the Netherlands.
Trait variation and integration across scales: Is the leaf economic spectrum present at local scales?
DOI:10.1111/ecog.02006 URL [本文引用: 1]
Is there a species spectrum within the world-wide leaf economics spectrum? Major variations in leaf functional traits in the Mediterranean sclerophyll Quercus ilex
The leaf economics spectrum is a general concept describing coordinated variation in foliage structural, chemical and physiological traits across resource gradients. Yet, within this concept,the role of within-species variation, including ecotypic and plastic variation components, has been largely neglected. This study hypothesized that there is a within-species economics spectrum within the general spectrum in the evergreen sclerophyll Quercus ilex which dominates low resource ecosystems over an exceptionally wide range. An extensive database of foliage traits covering the full species range was constructed, and improved filtering algorithms were developed. Standardized data filtering was deemed absolutely essential as additional variation sources can result in trait variation of 10–300%,blurring the broad relationships. Strong trait variation, c. two-fold for most traits to up to almost an order of magnitude, was uncovered.Although the Q. ilex spectrum is part of the general spectrum, within-species trait and climatic relationships in this species partly differed from the overall spectrum. Contrary to world-wide trends, Q. ilex does not necessarily have a low nitrogen content per mass and can increase photosynthetic capacity with increasing foliage robustness. This study argues that the within-species economics spectrum needs to be considered in regional- to biome-level analyses.
A global study of relationships between leaf traits, climate and soil measures of nutrient fertility
DOI:10.1111/j.1466-8238.2008.00441.x URL [本文引用: 3]
New handbook for standardised measurement of plant functional traits worldwide
DOI:10.1071/BT12225 URL [本文引用: 1]
Global relationship of wood and leaf litter decomposability: the role of functional traits within and across plant organs
DOI:10.1111/geb.12172 URL [本文引用: 1]
Wood density and vessel traits as distinct correlates of ecological strategy in 51 California coast range angiosperms
Wood density and vessel characteristics are functionally interrelated, yet they may have distinct ecological associations. In a comparative study of 51 angiosperm species ranging from chaparral shrubs to riparian trees, we examined relationships among wood density and vessel traits and their ecological correlates. Mean vessel lumen area and vessel density (number mm(-2)) varied widely (7- to 10-fold). In multivariate analyses, both vessel traits were negatively correlated with wood density, which varied more narrowly (< 2-fold). Vessel density and lumen area were inversely related across species, allowing a broad range of vessel traits within a narrow range of wood density. Phylogenetic independent contrasts indicated correlated inverse evolutionary change in vessel traits. Each trait had a distinct pattern of ecological correlation -- wood density was most strongly associated with soil water, and vessel traits showed contrasting relationships with plant height. Within a narrow range of wood density, there was significant variation in vessel traits. Given their particular ecological associations, the results suggest that wood density and vessel traits describe two distinct ecological axes.
Generality of leaf trait relationships: a test across six biomes
DOI:10.1890/0012-9658(1999)080[1955:GOLTRA]2.0.CO;2 URL [本文引用: 1]
Predicting leaf physiology from simple plant and climate attributes: a global GLOPNET analysis
DOI:10.1890/06-1803.1 URL [本文引用: 1]
The “hydrology” of leaves: co-ordination of structure and function in temperate woody species
Trade-offs in life-history evolution
DOI:10.2307/2389364 URL [本文引用: 1]
Phenotypic plasticity for plant development, function and life history
DOI:10.1016/s1360-1385(00)01797-0
PMID:11120476
[本文引用: 1]
A single genotype can produce different phenotypes in different environments. This fundamental property of organisms is known as phenotypic plasticity. Recently, intensive study has shown that plants are plastic for a remarkable array of ecologically important traits, ranging from diverse aspects of morphology and physiology to anatomy, developmental and reproductive timing, breeding system, and offspring developmental patterns. Comparative, quantitative genetics and molecular approaches are leading to new insights into the adaptive nature of plasticity, its underlying mechanisms and its role in the ecological distribution and evolutionary diversification of plants.
Biogeography of intraspecific trait variability in matgrass (Nardus stricta): high phenotypic variation at the local scale exceeds large scale variability patterns
DOI:10.1016/j.ppees. 2020.125555 [本文引用: 1]
DOI:10.1111/j.0030-1299.2007.15559.x URL [本文引用: 1]
Low rainfall-induced shift in leaf trait relationship within species along a semi-arid sandy land transect in northern China
DOI:10.1111/j.1438-8677.2010.00321.x
PMID:21143729
[本文引用: 3]
It is unclear whether the shift in leaf traits between species of high- and low-rainfall sites is caused by low rainfall or by species replacement, because leaf traits vary substantially among species and sites. Our objective was to test if the within-species relationship between specific leaf area (SLA) and leaf N concentration (N(mass) ) shifts across a rainfall gradient in the semi-arid sandy lands of northern China. Data for SLA and N(mass) of dominant species and related canopy and soil variables were collected from 33 plots along a rainfall transect (270-390 mm) having similar temperatures in the Mu Us, Inner Mongolia. We further investigated the generality of Mu Us data using 12 additional plots in the southeastern Qaidam Basin, Qinghai. Artemisia ordosica is a widespread species in both regions. Across and within species, the positive SLA-N(mass) relationship shifted between two plant groups in the lowest rainfall plots (270 mm) and other higher rainfall plots (320-390 mm), which was confirmed by additional data from Qinghai. For A. ordosica populations, leaf area index (LAI) decreased and N(mass) increased with decreasing rainfall, while the foliage N pool and SLA varied little. Rainfall was the limiting factor that determined variations in N(mass) and LAI. Accordingly, N(mass) /SLA ratios continually increased with decreasing LAI along the rainfall gradient (r = -0.76, P < 0.001). Results indicate a low rainfall-induced shift in the SLA-N(mass) relationship associated with changes in LAI and foliage N pool, suggesting a link between leaf characteristics and ecosystem function.© 2010 German Botanical Society and The Royal Botanical Society of the Netherlands.
A leaf-height-seed (LHS) plant ecology strategy scheme
DOI:10.1023/A:1004327224729 URL [本文引用: 2]
Specific leaf area and leaf dry matter content as alternative predictors of plant strategies
DOI:10.1046/j.1469-8137.1999.00427.x URL [本文引用: 3]
The worldwide leaf economics spectrum
DOI:10.1038/nature02403 URL [本文引用: 6]
Distribution pattern of Caragana species under the influence of climate gradient in the Inner Mongolia region, China
DOI:10.1007/s40333-013-0227-2 URL [本文引用: 2]
Responses of plant functional traits to micro-topographical changes in hilly and gully region of the Loess Plateau, China
黄土丘陵区植物功能性状对微地形变化的响应
植物功能性状是连接植物与环境的桥梁,可以反映植物对环境的适应能力.在地形复杂地区,研究不同水平上的植物功能性状随微地形的变化规律,对认识不同物种对复杂地形条件下多变环境的适应策略具有重要意义.以黄土丘陵区森林草原区自然植被为对象,分析土壤养分以及植物各功能性状值在科属和群落水平上微地形的响应关系.结果表明: 不同植物的功能性状差异较大,植物科属组成差异是影响植物功能性状的主要因素,其次是坡向,而坡位对其影响较小;群落水平的性状值在微地形上无显著差异;豆科和菊科植物的叶氮含量和根氮含量在不同坡位上均存在显著差异,禾本科只有根组织密度在不同坡位上存在显著差异;群落水平性状值的根组织密度与土壤氮含量和土壤有机质含量呈显著正相关;豆科植物的叶氮含量和根氮含量与土壤磷含量呈显著正相关,菊科和禾本科叶氮含量和根氮含量与土壤氮含量呈显著正相关.这表明不同科属植物在对环境变化响应上存在较大差异,不同科属物种对环境适应策略不同.
Quantifying leaf-trait covariation and its controls across climates and biomes
DOI:10.1111/nph.15422
PMID:30272817
[本文引用: 2]
Plant functional ecology requires the quantification of trait variation and its controls. Field measurements on 483 species at 48 sites across China were used to analyse variation in leaf traits, and assess their predictability. Principal components analysis (PCA) was used to characterize trait variation, redundancy analysis (RDA) to reveal climate effects, and RDA with variance partitioning to estimate separate and overlapping effects of site, climate, life-form and family membership. Four orthogonal dimensions of total trait variation were identified: leaf area (LA), internal-to-ambient CO ratio (χ), leaf economics spectrum traits (specific leaf area (SLA) versus leaf dry matter content (LDMC) and nitrogen per area (N )), and photosynthetic capacities (V, J at 25°C). LA and χ covaried with moisture index. Site, climate, life form and family together explained 70% of trait variance. Families accounted for 17%, and climate and families together 29%. LDMC and SLA showed the largest family effects. Independent life-form effects were small. Climate influences trait variation in part by selection for different life forms and families. Trait values derived from climate data via RDA showed substantial predictive power for trait values in the available global data sets. Systematic trait data collection across all climates and biomes is still necessary.© 2018 The Authors. New Phytologist © 2018 New Phytologist Trust.
Study on distribution of the genus Caragana Fabr
