


土壤中存在多种不同功能的胞外酶, 其中β-葡萄糖苷酶、纤维素二糖水解酶和木聚糖水解酶代表C转化相关的酶, N-乙酰氨基葡萄糖苷酶和亮氨酸氨基肽酶代表了N转化相关的酶(Allison et al., 2007)。根据C、N转化酶的活性比值计算的C、N酶化学计量比, 可用于评估微生物新陈代谢从养分到能量流的转变, 以此来确定土壤能量和养分限制状况(Sinsabaugh et al., 2009)。在全球范围内, 表层微生物的C、N酶转化比趋向于1:1 (Sinsabaugh et al., 2008)。对纬度梯度上的中国森林样地研究发现, 土壤微生物的C、N酶转化比低于1:1 (Zhou et al., 2020), 暗示微生物可能受到一定程度的N限制。此外, 土壤中的多酚氧化酶和过氧化氢酶可氧化土壤中难降解的酚类物质, 根据氧化酶和C水解酶计算的C质量指数(CQI)可用于评估土壤中难分解C的百分比。CQI越高表明土壤中难分解碳的占比越高(Hill et al., 2018)。可见, 土壤胞外酶活性及其计量比的变化可以指示微生物的养分需求和土壤养分状况(Sinsabaugh et al., 2009), 揭示了土壤C、N循环过程的差异, 是近年来土壤生态学研究的热点。
树线过渡带是地球上最脆弱的生态过渡带之一, 是连接亚高山森林和高山灌丛的生态边界, 由于其独特的生境, 对全球变暖具有预警作用(Sigdel et al., 2020), 是当前生态学研究的热点区域。树线过渡带内, 植被类型在短距离内从森林转变为灌丛。已有研究表明, 植被类型是影响亚高山森林土壤酶活性及其化学计量比的主要因素(He et al., 2020)。高山树线过渡带植被受N限制(Müller et al., 2017; Zhang et al., 2019), 且森林凋落物的木质素含量高于灌丛(史学军等, 2009)。这些差异是否影响树线过渡带内土壤胞外酶活性及其化学计量比尚不清晰。探明树线过渡带上土壤胞外酶活性及其计量比的变化, 对揭示未来气候变化条件下高山土壤C、N循环过程具有重要的指示意义。
本研究选取青藏高原东南部的川西贡嘎山树线过渡带上森林、树线和灌丛土壤作为研究对象, 测定土壤中5种水解酶和2种氧化酶的活性。研究高山树线林灌过渡带土壤胞外酶活性及其化学计量比的变化特征, 并进一步分析土壤微生物的能量和养分限制情况, 为明确高山树线过渡带土壤C、N循环过程提供数据支持。
1 材料和方法
1.1 研究区概况和样品采集
本研究区为四川甘孜藏族自治州贡嘎山, 位于青藏高原的东南边缘, 最高海拔7 556 m。本研究的采样点位于贡嘎山东坡雅家埂东西两侧的树线过渡带(29.85°-29.88° N, 102.02°-102.05° E), 海拔3 500- 3 700 m, 年平均气温3.8 ℃, 年降水量1 960 mm, 属于寒温带气候。本研究区林线、树线和树种线重叠, 用树线表征林灌交错点位置, 树线以下为森林, 树线以上为灌丛。乔木以冷杉(Abies fabri)为主, 灌丛以毡毛栎叶杜鹃(Rhododendron phaeochrysum var. levistratum)为主。土壤类型为山地暗棕壤(冉飞等, 2014)。
在树线过渡带选取5条样带, 样带间距大于50 m。在每条样带内, 沿海拔梯度设置7个采样位置, 样带长度约120 m, 包含3个森林样方(F1-F3)和3个灌丛样方(S1-S3), 以及1个树线样方(图1)。样方大小为10 m × 10 m, 总计35个样方(7个位置× 5条样带)。对样方内乔木、灌木和草本进行调查, 并测量树高和胸径(DBH > 5 cm), 同时采集优势树种的健康无虫蛀的向阳叶片。在每个样方随机选取3个取样点, 挖出40 cm × 40 cm × 40 cm土壤剖面, 各剖面采集同等量的矿质A层土壤, 并混合成一个土壤样品。土壤样品立即带回实验室, 过2 mm筛, 去除石砾及动植物残体。过筛后的样品分为两部分: 一部分风干, 用于测定土壤理化性质; 另一部分保存在4 ℃下, 一周内进行微生物生物量、可溶性碳氮含量和土壤胞外酶活性测定。植物叶片带回实验室后105 ℃杀青30 min, 随后65 ℃烘干。
图1
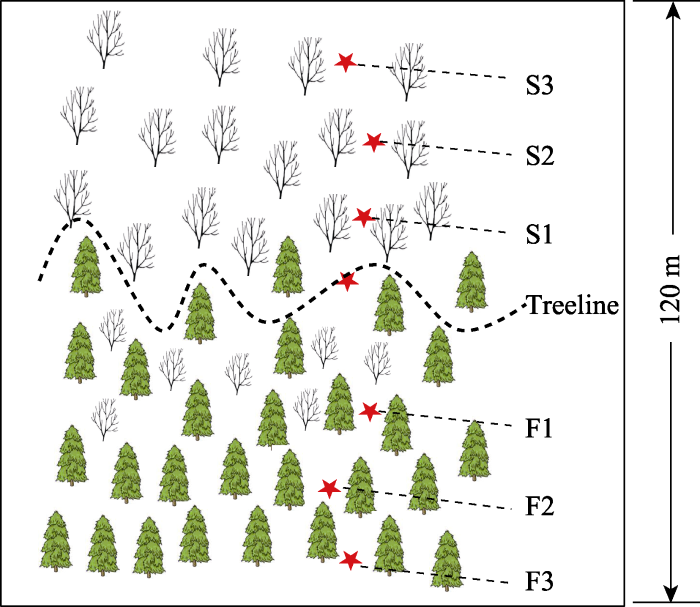
图1
贡嘎山树线过渡带样地示意图。F1、F2、F3为树线下方的森林样方; S1、S2、S3为灌丛样方; Treeline为树线处样方。从F3到S3海拔依次升高。
Fig. 1
Schematic diagram of the sample sites in the alpine treeline ecotones in Gongga Mountain. F1, F2, F3 are the forest samples; S1, S2, S3 are the shrub samples; Treeline is the sample at the treeline. Altitude rises from F3 to S3 in ascending order.
1.2 土壤理化性质及微生物和叶片元素含量测定
植物叶片和土壤中全碳和全氮(TN)含量用元素分析仪(vario MACRO cube, Elementar, Hanau, Germany)测定。由于本研究区土壤中无机碳含量极低, 土壤全碳即为土壤有机碳(SOC)。叶片中木质素含量采用碱性CuO氧化-气相色谱法测定, 木质素含量为所提取的木质素单体总和(Thevenot et al., 2010)。土壤可溶性有机碳(DOC)和可溶性总氮(DN)用去离子水(土水质量比为1:4)为浸提液, 振荡0.5 h后, 用0.45 μm微孔膜抽滤, 用TOC自动分析仪(Vario TOC, Elementar, Hanau, Germany)测定含量; 微生物生物量碳(MBC)利用氯仿熏蒸法, 用0.05 mol·L-1 K2SO4 (土水质量比为1:4)浸提, 振荡离心过滤后, 用TOC自动分析仪测定含量, 取0.45作为MBC含量的转换系数进行计算。NH4+-N和NO3--N用2 mol·L-1的KCl为提取液(土水质量比为1:10), 采用水杨酸盐法和硫酸肼还原法分别测定含量; 土壤机械组成用激光粒度粒形分析仪(Mastersizer 3000, Malvern Panalytical, Malvern, UK)测定; pH用pH计(土水质量比为1:2.5)测量。
1.3 土壤胞外酶活性测定
选取与C、N循环相关的5种水解酶(β-葡萄糖苷酶(BG)、纤维素二糖水解酶(CBH)、木聚糖水解酶(XYL)、N-乙酰氨基葡萄糖苷酶(NAG)、亮氨酸氨基肽酶(LAP))和2种氧化酶(多酚氧化酶(POX)、过氧化氢酶(CAT))进行分析和测定(Saiya-Cork et al., 2002; German et al., 2011)。以伞形酮和香豆素为标示底物指示水解酶活性, 土壤悬浊液与底物培养4 h后, 在365 nm激发波长和450 nm发射波长下采用全波长酶标仪(M200 PRO, Tecan, Männedorf, Switzerland)进行荧光测定; 用L-二羟苯丙氨酸为底物指示氧化酶活性, 在对CAT进行测定时, 额外添加0.3% H2O2溶液, 培养24 h, 在450 nm波长下测定吸光值。
1.4 数据处理
采取两种不同的指标来量化微生物C、N酶活性比(Ecn)和C质量指数(CQI), 使用以下公式计算(Hill et al., 2018):
式中, lnBG表示微生物对C的相对需求, lnLAP、ln(NAG + LAP)均表示微生物对N的相对需求。
式中, lnPOX、ln(POX + CAT)均表示稳定性碳的相对丰度, lnBG表示不稳定性碳的相对丰度, CQI和土壤中稳定性碳的含量成正比。
所有数据的统计分析均在R软件中进行, 显著性水平设定为p < 0.05。利用“lme4”软件包的线性混合效应模型来估计过渡带内不同位置的植物、土壤理化性质和胞外酶活性的差异, 其中过渡带内位置为固定效应, 样带为随机效应。使用Tukey方法进行线性混合效应模型的多重比较。用“Hmisc”包的Spearman相关分析研究土壤胞外酶活性及其化学计量比与环境因子的关系。运用“Vegan”包进行非度量多维尺度分析(NMDS)对土壤胞外酶及其化学计量比特征分别进行排序, 并通过envfit函数进行环境因子的拟合, 分析影响树线过渡带土壤酶活性及其化学计量比的主要因素。
2 结果和分析
2.1 树线过渡带植被特征和土壤理化性质差异
表1 贡嘎山树线过渡带不同位置优势树种植被属性及叶片养分特征(平均值±标准误)
Table 1
| 森林(峨眉冷杉) Forest (Abies fabri) | 树线(峨眉冷杉) Treeline (Abies fabri) | 灌丛(毡毛栎叶杜鹃) Shrub (Rhododendron phaeochrysum var. levistratum) | 位置 Location | |||||||
|---|---|---|---|---|---|---|---|---|---|---|
| F3 | F2 | F1 | S1 | S2 | S3 | |||||
| 单位面积胸高断面积 BA (m2·hm-2) | 291.0 ± 49.0a | 235.7 ± 42.2ab | 171.1 ± 47.9abc | 110.1 ± 22.9c | 135.6 ± 17.3bc | 149.9 ± 14.7bc | 124.8 ± 19.2bc | ** | ||
| 叶片碳含量 Leaf carbon (C) content (mg·g-1) | 429.4 ± 35.5ab | 457.9 ± 41.1a | 431.0 ± 28.8a | 397.2 ± 25.0abc | 361.8 ± 34.3bc | 369.0 ± 26.1bc | 354.8 ± 20.2c | *** | ||
| 叶片氮含量 Leaf nitrogen (N) content (mg·g-1) | 13.2 ± 0.3a | 12.7 ± 0.8a | 13.1 ± 0.8a | 12.2 ± 0.5a | 8.6 ± 0.8b | 8.3 ± 0.5b | 7.9 ± 0.7b | *** | ||
| 叶片碳氮比 Leaf C:N | 32.5 ± 2.2c | 36.0 ± 1.4bc | 33.2 ± 2.2bc | 32.7 ± 2.4bc | 42.3 ± 2.6ab | 44.8 ± 3.4a | 45.8 ± 3.3a | *** | ||
| 叶片木质素:氮 Leaf lignin:N | 1.7 ± 0.1b | 1.9 ± 0.1ab | 2.0 ± 0.1ab | 2.1 ± 0.1a | 0.8 ± 0.1c | 0.7 ± 0.0c | 0.7 ± 0.1c | *** | ||
括号中物种为优势树种。同一行中不同小写字母表示过渡带不同位置间差异显著(p < 0.05)。星号表示过渡带不同位置对各指标的线性混合效应模型分析结果: **, p < 0.01; ***, p < 0.001。
Species in brackets are dominant species. BA, basal area. Different lowercase letters in the same row indicate significant differences (p < 0.05) among different locations in the treeline ecotone. Asterisks indicate the results of linear mixed-effects model analysis of different locations in the treeline ecotone for each indicator: **, p < 0.01; ***, p < 0.001.
表2 贡嘎山树线过渡带不同位置土壤基本理化性质(平均值±标准误)
Table 2
| 土壤指标 Soil index | 森林 Forest | 树线 Treeline | 灌丛 Shrub | 位置 Location | ||||
|---|---|---|---|---|---|---|---|---|
| F3 | F2 | F1 | S1 | S2 | S3 | |||
| 有机碳含量 SOC content (mg·g-1) | 218.8 ± 34.0a | 185.8 ± 23.7ab | 171.1 ± 24.6ab | 173.9 ± 16.2ab | 139.9 ± 27.1b | 160.3 ± 7.0ab | 118.3 ± 12.3b | * |
| 全氮含量 TN content (mg·g-1) | 11.0 ± 1.9a | 8.7 ± 1.2ab | 9.1 ± 1.4ab | 8.5 ± 0.7ab | 7.4 ± 1.3ab | 7.9 ± 0.5ab | 6.0 ± 0.8b | * |
| 碳氮比 C:N | 20.2 ± 0.6a | 21.5 ± 1.5a | 18.9 ± 0.8a | 20.5 ± 0.5a | 19.0 ± 0.7a | 20.4 ± 0.7a | 19.9 ± 0.7a | NS |
| 可溶性有机碳含量 DOC content (μg·g-1) | 317.7 ± 53.3a | 3 109.8 ± 84.1a | 241.3 ± 29.8ab | 265.2 ± 42.5ab | 199.9 ± 56.6ab | 227.9 ± 18.8ab | 142.3 ± 23.4b | ** |
| 可溶性氮含量 DN content (μg·g-1) | 30.5 ± 2.3a | 34.1 ± 13.1a | 21.9 ± 3.7ab | 22.2 ± 4.1ab | 16.8 ± 3.0ab | 28.7 ± 7.7a | 11.6 ± 0.7b | ** |
| 可溶性碳氮比 DOC:DN | 10.4 ± 1.6a | 10.2 ± 0.8a | 11.3 ± 0.6a | 12.8 ± 2.0a | 11.4 ± 1.7a | 10.1 ± 2.4a | 12.2 ± 1.9a | NS |
| 铵态氮含量 NH4+-N content (μg·g-1) | 41.2 ± 11.4a | 40.5 ± 9.2a | 36.2 ± 6.9a | 36.8 ± 3.4a | 42.3 ± 15.0a | 48.1 ± 15.0a | 26.5 ± 6.3a | NS |
| 硝态氮含量 NO3--N content (μg·g-1) | 5.8 ± 0.5a | 5.6 ± 0.5a | 5.0 ± 0.4ab | 5.0 ± 0.5ab | 4.3 ± 0.5b | 4.5 ± 0.4ab | 3.8 ± 0.4b | *** |
| pH | 4.0 ± 0.1b | 3.9 ± 0.1b | 4.3 ± 0.1a | 4.1 ± 0.1ab | 4.2 ± 0.1ab | 4.1 ± 0.1ab | 4.1 ± 0.1ab | * |
| 黏粒含量 Clay content (%) | 5.1 ± 0.8a | 4.9 ± 0.5a | 4.7 ± 0.9a | 3.9 ± 0.6a | 4.8 ± 0.8a | 4.3 ± 0.4a | 5.1 ± 0.6a | NS |
| 砂粒含量 Sand content (%) | 27.6 ± 6.2a | 28.1 ± 3.5a | 33.8 ± 7.6a | 37.3 ± 5.5a | 38.9 ± 3.8a | 33.8 ± 2.2a | 29.0 ± 4.1a | NS |
| 微生物生物量碳含量 MBC content (μg·g-1) | 2 905 ± 611a | 2 672 ± 203a | 2 141 ± 386a | 2 696 ± 323a | 2 242 ± 605a | 2 717 ± 142a | 1 859 ± 239a | NS |
同一行中不同小写字母表示过渡带不同位置间差异显著(p < 0.05)。星号表示树线过渡带不同位置对各指标的线性混合效应模型分析结果: *, p < 0.05; **, p < 0.01; ***, p < 0.001; NS, 无显著差异。
DN, soil dissolved nitrogen; DOC, soil dissolved organic carbon; MBC, microbial biomass carbon; NH4+-N, ammonium nitrogen; NO3--N, nitrate nitrogen; SOC, soil organic carbon; TN, total nitrogen. Different lowercase letters in the same row indicate significant differences (p < 0.05) among different locations in the treeline ecotone. Asterisks indicate the results of linear mixed-effects model analysis of different locations in the treeline ecotone for each indicator: *, p < 0.05; **, p < 0.01; ***, p < 0.001; NS, no significant difference.
2.2 树线过渡带土壤胞外酶活性差异
图2
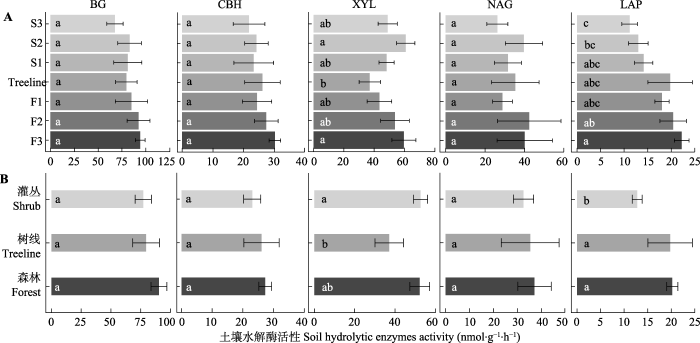
图2
贡嘎山树线过渡带不同位置土壤水解酶活性的变化(平均值±标准误)。BG, β-葡萄糖苷酶; CBH, 纤维素二糖水解酶; LAP, 亮氨酸氨基肽酶; NAG, N-乙酰氨基葡萄糖苷酶; XYL, 木聚糖水解酶。F1、F2、F3为树线下方的森林样方; S1、S2、S3为灌丛样方; Treeline为树线处样方。不同小写字母表示过渡带不同位置(植被类型)差异显著(p < 0.05)。
Fig. 2
Soil hydrolytic enzyme activities at different locations in the treeline ecotone in Gongga Mountain (mean ± SE). BG, β-1,4-glucosidase; CBH, cellobiohydrolase; LAP, leucine aminopeptidase; NAG, β-N-acetyl glucosaminidase; XYL, xylosidase. F1, F2, F3 are forest samples; S1, S2, S3 are shrub samples; Treeline is the sample at the tree line. Different lowercase letters indicate significant differences (p < 0.05) among different locations or vegetation types in the treeline ecotone.
图3
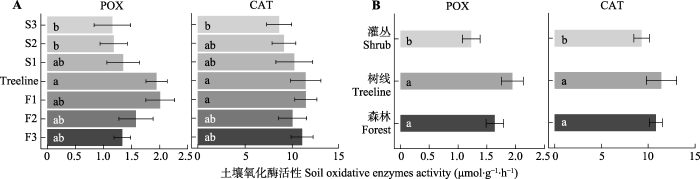
图3
贡嘎山树线过渡带不同位置土壤氧化酶活性的变化(平均值±标准误)。CAT, 过氧化氢酶; POX, 多酚氧化酶。F1、F2、F3为树线下方的森林样方; S1、S2、S3为灌丛样方; Treeline为树线处样方。不同小写字母表示过渡带不同位置(植被类型)差异显著(p < 0.05)。
Fig. 3
Soil oxidative enzyme activities at different locations in the treeline ecotone in Gongga Mountain (mean ± SE). CAT, Catalase; POX, phenol oxidase. F1, F2, F3 are forest samples; S1, S2, S3 are shrub samples; Treeline is the sample at the tree line. Different lowercase letters indicate significant differences (p < 0.05) among different locations or vegetation types in the treeline ecotone.
2.3 树线过渡带土壤胞外酶化学计量比的差异
Ecn1和CQI2在过渡带不同位置差异不显著(图4), Ecn2和CQI1在不同位置差异显著。Ecn2从森林到灌丛显著升高。CQI1在树线和F1土壤显著高于F3土壤。从森林、树线、灌丛样地进行考虑, Ecn2大小表现为: 灌丛≥树线≥森林, CQI1大小为: 树线≥森林≥灌丛。
图4
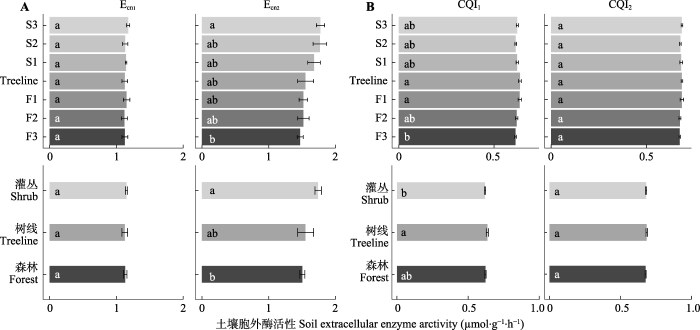
图4
贡嘎山树线过渡带土壤胞外酶化学计量比的变化(平均值±标准误)。CQI1、CQI2表示碳质量指数; Ecn1、Ecn2表示微生物碳、氮酶活性计量比。F1、F2、F3为树线下方的森林样方; S1、S2、S3为灌丛样方; Treeline为树线处样方。不同小写字母表示过渡带不同位置(植被类型)差异显著(p < 0.05)。
Fig. 4
Soil extracellular enzyme stoichiometry at different locations in the treeline ecotone in Gongga Mountain (mean ± SE). CQI1, CQI2 indicate carbon quality index; Ecn1, Ecn2 indicate microbial carbon and nitrogen enzyme activity stoichiometry ratios. F1, F2, F3 are the forest samples; S1, S2, S3 are the shrub samples; Treeline is the sample at the tree line. Different lowercase letters indicate significant differences (p < 0.05) between different locations or vegetation types in the treeline ecotone.
2.4 环境因子对土壤胞外酶活性及其化学计量比的影响
Spearman相关分析表明, BG、CBH、XYL活性和土壤SOC、TN、MBC、NO3--N含量呈显著正相关关系, NAG、POX、CAT活性和土壤SOC、TN、DOC含量显著正相关(表3)。此外, DOC含量和BG活性显著正相关, DOC:DN和BG、CBH、POX、CAT活性显著正相关, NAG活性和MBC含量显著正相关, CAT活性和NO3--N含量、pH显著正相关, LAP活性与SOC、NO3--N含量和叶片的lignin:N显著正相关, LAP活性与叶片C:N显著负相关, POX活性和lignin:N显著正相关。
表3 贡嘎山树线过渡带土壤酶活性及其化学计量比与环境变量之间的相关关系
Table 3
| 变量 Variable | BG | CBH | XYL | LAP | NAG | POX | CAT | Ecn1 | Ecn2 | CQI1 | CQI2 |
|---|---|---|---|---|---|---|---|---|---|---|---|
| SOC | 0.62*** | 0.52** | 0.55*** | 0.37* | 0.51** | 0.38* | 0.49** | -0.15 | -0.15 | -0.31 | -0.51** |
| TN | 0.63*** | 0.52** | 0.62*** | 0.32 | 0.44** | 0.45** | 0.57*** | -0.05 | -0.13 | -0.26 | -0.49** |
| C:N | -0.09 | -0.09 | -0.21 | -0.23 | -0.07 | -0.24 | -0.25 | 0.11 | 0.31 | -0.17 | 0.01 |
| DOC | 0.43** | 0.32 | 0.34 | 0.18 | 0.36* | 0.37* | 0.50** | -0.11 | -0.08 | -0.07 | -0.25 |
| DN | 0.16 | 0.04 | 0.25 | 0.14 | 0.12 | 0.02 | 0.18 | -0.14 | -0.12 | -0.21 | -0.08 |
| DOC:DN | 0.43* | 0.46** | 0.15 | 0.23 | 0.24 | 0.51** | 0.56*** | 0.12 | -0.08 | 0.07 | -0.24 |
| MBC | 0.52** | 0.34* | 0.48** | 0.25 | 0.55*** | 0.23 | 0.29 | -0.29 | -0.04 | -0.30 | -0.50** |
| NO3--N | 0.59*** | 0.47** | 0.42* | 0.48** | 0.27 | 0.34 | 0.51** | -0.06 | -0.29 | -0.21 | -0.43** |
| NH4+-N | 0.04 | -0.21 | -0.07 | -0.02 | -0.04 | -0.15 | -0.19 | -0.01 | -0.06 | -0.19 | -0.12 |
| pH | 0.09 | 0.27 | 0.07 | 0.03 | 0.18 | 0.29 | 0.41* | -0.04 | 0.01 | 0.19 | 0.05 |
| Clay | 0.08 | 0.01 | 0.10 | 0.02 | -0.23 | -0.01 | 0.09 | 0.22 | -0.11 | -0.03 | -0.01 |
| Leaf C:N | -0.04 | -0.05 | 0.23 | -0.38* | 0.07 | -0.25 | -0.20 | 0.03 | 0.45** | -0.13 | -0.02 |
| Leaf lignin:N | 0.10 | 0.20 | -0.32 | 0.48** | -0.09 | 0.43** | 0.07 | 0.06 | -0.50** | 0.35* | -0.06 |
| CQI1 | -0.52** | -0.38* | -0.53*** | -0.15 | -0.36* | 0.39* | 0.00 | 0.04 | -0.14 | ||
| CQI2 | -0.90*** | -0.76*** | -0.58*** | -0.38* | -0.63*** | -0.29 | -0.22 | 0.00 | -0.04 |
BG, β-葡萄糖苷酶; CAT, 过氧化氢酶; CBH, 纤维素二糖水解酶; Clay, 黏粒含量; C:N, 土壤碳氮比; DN, 土壤可溶性氮含量; DOC, 土壤可溶性有机碳含量; LAP, 亮氨酸氨基肽酶; Leaf C:N, 优势树种叶片碳氮比; Leaf lignin:N, 叶片木质素:氮; MBC, 微生物生物量碳含量; NAG, N-乙酰氨基葡萄糖苷酶; NH4+-N, 铵态氮含量; NO3--N, 硝态氮含量; POX, 多酚氧化酶; SOC, 土壤有机碳含量; TN, 全氮含量; XYL, 木聚糖水解酶。Ecn1、Ecn2表示微生物碳、氮酶活性计量比; CQI1、CQI2表示碳质量指数。数字加粗表示显著相关: *, p < 0.05; **, p < 0.01; ***, p < 0.001。
BG, β-1,4-glucosidase; CAT, catalase; CBH, cellobiohydrolase; Clay, clay content; C:N, soil carbon to nitrogen ratio; DN, soil dissolved nitrogen content; DOC, soil dissolved organic carbon content; LAP, leucine aminopeptidase; Leaf C:N, carbon to nitrogen ratio of leaves of dominant species; Leaf lignin:N, leaf lignin to nitrogen ratio; MBC, microbial biomass carbon content; NAG, β-N-acetyl glucosaminidase; NH4+-N, ammonium nitrogen content; NO3--N, nitrate nitrogen content; POX, phenol oxidase; SOC, soil organic carbon content; TN, total nitrogen content; XYL, xylosidase. Ecn1, Ecn2 indicate microbial carbon and nitrogen enzyme activity stoichiometry ratios; CQI1, CQI2 indicate carbon quality index. Bold numbers indicate siginificant correlation: *, p < 0.05; **, p < 0.01; ***, p < 0.001.
Ecn2和植物叶片C:N显著正相关, 和叶片lignin:N显著负相关。CQI1和lignin:N极显著正相关, 和BG、CBH、XYL、NAG活性显著负相关。CQI1和POX活性显著正相关。CQI2和上述全部水解酶显著负相关, CQI2和SOC、TN、MBC、NO3--N含量极显著负相关。
NMDS分析显示树线过渡带土壤胞外酶活性及其化学计量比的变化(图5)。其中SOC、TN、MBC、NO3--N、DOC、DN含量、DOC:DN和叶片lignin:N都可显著影响树线过渡带土壤酶活性(p < 0.05), 其中以SOC、TN、NO3--N含量和植物叶片的lignin:N最为显著(p < 0.01)。DN含量、植物叶片C:N和lignin:N是影响树线过渡带土壤胞外酶化学计量比的主要因素(p < 0.05)。
图5
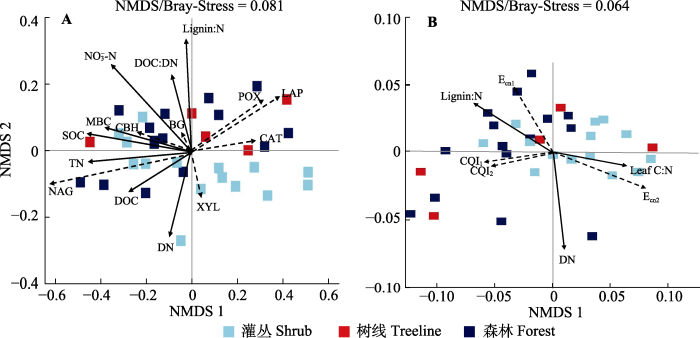
图5
贡嘎山树线过渡带土壤胞外酶活性(A)及其化学计量比(B)的非度量多维尺度(NMDS)分析。应力函数可以检验NMDS分析结果的优劣, 通常认为stress < 0.2时可用NMDS的二维点图表示, 其图形有一定的解释意义; 当stress < 0.1时, 可认为是一个好的排序。图中仅显示有显著影响的因素。BG, β-葡萄糖苷酶; CAT, 过氧化氢酶; CBH, 纤维素二糖水解酶; DN, 土壤可溶性氮含量; DOC, 土壤可溶性有机碳含量; LAP, 亮氨酸氨基肽酶; Leaf C:N, 优势树种叶片碳氮比; Lignin:N, 叶片木质素比氮; MBC, 微生物生物量碳含量; NAG, N-乙酰氨基葡萄糖苷酶; NO3--N, 硝态氮含量; POX, 多酚氧化酶; SOC, 土壤有机碳含量; TN, 全氮含量; XYL, 木聚糖水解酶。Ecn1、Ecn2表示微生物碳、氮酶活性计量比; CQI1、CQI2表示碳质量指数。
Fig. 5
Bray-Curtis-based non-metric multidimensional scaling (NMDS) of the soil enzyme activities (A) and enzyme stoichiometry (B) in the treeline ecotone in Gongga Mountain. The stress function can test the merit of NMDS analysis results. It is generally considered that stress < 0.2 can be represented by a two-dimensional point diagram of NMDS, and its graph has some interpretative significance; when stress < 0.1, it can be considered a good ranking. Only significant factors (p < 0.05) were showed in the figure. BG, β-1,4-glucosidase; CAT, catalase; CBH, cellobiohydrolase; DN, soil dissolved nitrogen content; DOC, soil dissolved organic carbon content; LAP, leucine aminopeptidase; Leaf C:N, carbon to nitrogen ratio of leaves of dominant species; Lignin:N, leaf lignin to nitrogen ratio; MBC, microbial biomass carbon content; NAG, β-N-acetyl glucosaminidase; NO3--N, nitrate nitrogen content; POX, phenol oxidase; SOC, soil organic carbon content; TN, total nitrogen content; XYL, xylosidase. Ecn1, Ecn2 indicate microbial carbon and nitrogen enzyme activity stoichiometry ratios; CQI1, CQI2 indicate carbon quality index.
3 讨论
3.1 树线过渡带土壤胞外酶活性差异及其影响因素
由于微生物通过分泌胞外酶从有机物中获取营养, 这种活动被解释为微生物的营养需求。而这种需求是由环境营养物质可用性决定的(Caldwell, 2005)。土壤SOC和TN能为微生物生长提供C源和N源, 影响酶的合成(Bowles et al., 2014)。已有的研究表明, 土壤C、N相关指标能解释土壤胞外酶活性的大部分变化(Banerjee et al., 2016)。本研究中, SOC、TN、DOC、DOC:DN、NO3--N等含量和土壤胞外酶活性密切相关(表3; 图5), 这与Kivlin和Treseder (2014)在加利福尼亚州的研究相似, 土壤C和养分浓度可能是在全球尺度和区域尺度上影响土壤酶活性最普遍的因素。本研究还发现LAP活性与植物叶片C:N呈负相关关系。N是植物和微生物生长所需的重要营养元素(LeBauer & Treseder, 2008)。近年来研究发现, 高山树线过渡带植被呈现一定程度的N限制(Müller et al., 2017; Zhang et al., 2019)。在养分受限的生态系统中, 植物和土壤微生物可竞争土壤中的可利用N (蒋婧和宋明华, 2010)。植物叶片C:N越低, 表明植物体对N的需求更大, 与土壤微生物的N竞争可能更为强烈, 微生物需分泌更多的氮水解酶来获取养分以满足自身需求, 进而导致LAP与植物叶片C:N呈负相关关系。此外, 本研究中POX活性与植物叶片lignin:N呈正相关关系。POX和CAT可氧化包括木质素及其衍生物在内的酚类物质(Min et al., 2015), 只有部分特殊的群落才能合成此类胞外酶(Carreiro et al., 2000)。植物叶片lignin:N可以表征叶片化合物组成和叶片质量, 比值越高表明叶片越难降解(Adair et al., 2008), 从而导致土壤中难降解酚类物质的积累(Min et al., 2015)。根据底物刺激模型(Hernández & Hobbie, 2010), 底物越丰富, 相应的酶活性越高, 进而导致POX活性与植物叶片lignin:N呈正相关关系。以往的大量研究发现, pH是影响酶活性的重要因素(Xu et al., 2017; Zuo et al., 2018)。但本研究中, pH对土壤胞外酶酶活性的影响并不显著(图5), 这可能与本研究区内pH变化范围较小(3.9-4.3)有关。
本研究中从森林过渡到灌丛LAP、POX和CAT活性显著下降, 而XYL活性在树线处最低, 表现为植被类型对土壤胞外酶活性的显著影响。植被类型对土壤微生物代谢活动的影响可以归因于两点, 一是植物残体进入土壤对土壤理化和养分状况的影响(Wang et al., 2012; Yin et al., 2014), 二是根系通过根-土壤界面的物质交换对微生物活性、群落结构和土壤微环境的影响(Okubo et al., 2016; Cui et al., 2018)。SOC、TN、NO3--N、植物叶片C:N和lignin:N伴随着植被类型的变化(森林>树线>灌丛), 进一步证实植被类型转变引起的土壤理化性质和植物残体性质差异影响了土壤胞外酶活性。本研究中, 冷杉叶片C:N显著低于毡毛栎叶杜鹃, 且森林样地中植物生物量显著高于灌丛样地(表1)。可见, 森林样地中冷杉与土壤微生物的N竞争可能更为强烈, 微生物分泌更多的氮水解酶来获取养分以满足自身需求, 进而导致LAP活性在森林土壤中显著高于灌丛土壤。冷杉叶片中lignin:N显著高于毡毛栎叶杜鹃, 表明冷杉叶片C质量低, 难分解的酚类物质可在土壤中积累(Adair et al., 2008; Min et al., 2015), 从而导致森林样地中两种氧化酶活性高于灌丛土壤。与氧化酶活性不同, XYL是降解半纤维素的重要水解酶, 大部分微生物都能合成此类胞外酶(Bhardwaj et al., 2019)。树线处植被的单位面积胸高断面积最低(表1), 暗示进入地下的植物残体量较少(Sagar & Singh, 2006), 降低了土壤中半纤维素的积累, 从而使得树线处XYL活性最低。
3.2 树线过渡带土壤胞外酶活性的化学计量比差异及其影响因素
参与C、N循环的胞外酶活性化学计量比, 可反映微生物营养需求与养分有效性之间的平衡。根据资源分配理论(Bloom et al., 1985), 微生物消耗大量的能源产生胞外酶, 以获取相对有限的养分。在全球范围内, 微生物C、N酶活性比例接近于1:1 (Sinsabaugh et al., 2008), 而Liu等(2020)发现中国东南部亚热带林地土壤中C、N酶活性比率为3.4:1, 表明微生物存在C限制, 而中国北方温带草原土壤中C、N酶活性比率为1:2.1, 表现出明显的N限制(Peng & Wang, 2016)。在本研究中, Ecn1平均值为1.14:1, 表明微生物可能受到轻微的C限制。灌丛土壤的C、N酶活性比高于森林(图4B), 表明灌丛土壤微生物代谢对C源的需求高于森林, 而森林土壤微生物对N源的需求高于灌丛。已有研究表明, 微生物的C、N酶化学计量比主要受到土壤(Zuo et al., 2018)和植被(Zheng et al., 2018)养分及其化学计量比的影响, 与土壤C:N (Peng & Wang, 2016)和植物C:N (Xu et al., 2017)呈负相关关系。但本研究中lnBG/lnLAP与土壤C:N无显著相关关系, 与植物C:N表现为正相关关系, 暗示传统的养分限制理论并不是影响本研究区C、N酶化学计量比的主要因素。He等(2020)对贡嘎山冰川退缩区原生演替序列形成的阔叶和针叶林土壤酶活性的研究也发现土壤C、N酶化学计量比与微生物的养分匮缺状况关系不大, 并将冷杉针叶林的低C、N酶化学计量比归因于高丰度的外生菌根真菌, 本研究结果与之相似。外生菌根真菌可以直接获取植物体提供的活性C源, 因而丧失了分解土壤中复杂C源的能力(Tedersoo & Bahram, 2019), 进而降低了了土壤中C转化相关酶的活性。而杜鹃花类植物中常见的杜鹃花类菌根真菌虽可侵染到植物根系中, 但并未丧失腐生能力, 仍可向土壤中分泌大量碳循环相关的酶(Tedersoo & Bahram, 2019)。本研究中树线过渡带内植被从冷杉过渡到毡毛栎叶杜鹃, 菌根类型的差异可能是导致土壤C、N酶化学计量比上升的重要原因。后期需要探明过渡带内植物根系的菌根侵染情况和微生物群落的差异, 以进一步验证实验结果。与lnBG/lnLAP不同, lnBG/ln(NAG + LAP)在过渡带不同位置差异不显著。这可能是由于NAG作为N源, 在C受限时也可成为一种有效的C源(Zeglin et al., 2013)。因此在用酶活性表征C、N获取时, 单独用LAP活性计算的化学计量指标更为敏感。
POX和BG可分解土壤中难降解的酚类物质和易分解的碳水化合物, 两者的比值可用于表征土壤中CQI。土壤中CQI主要受植物叶片C质量的影响, 这与Zhou等(2020)所发现的土壤C质量受植物根系和根系分泌物影响的研究不同, 这种不一致的原因可能是土壤深度的差异(Rumpel & Kögel-Knabner, 2011)。灌丛土壤CQI1显著低于树线土壤, 表明灌丛土壤中难降解碳的比例较低。这与森林和灌丛样地中植物残体的质量密切相关, 毡毛栎叶杜鹃中lignin:N低于冷杉, 进而降低木质素等难降解化合物的相对积累(Carreiro et al., 2000; Hall et al., 2020)。
4 结论
川西高山树线过渡带内不同位置土壤胞外酶活性及其化学计量比存在显著差异。灌丛土壤LAP、POX和CAT活性显著低于树线和森林土壤, XYL活性在树线处最低, 其他胞外酶活性在树线过渡带不同位置差异不显著。树线过渡带土壤胞外酶活性主要受SOC、TN、NO3--N含量和植物叶片lignin:N的影响, C、N酶化学计量比和土壤微生物的营养状况没有明显关系, 植被类型是影响树线过渡带酶化学计量比的主要因素。CQI表明树线处土壤碳的抗分解能力更强。整体而言, 贡嘎山树线过渡带土壤碳氮的矿化在灌丛和森林处存在较明显的区别, 可能主要是由于植物属性和土壤养分含量的差别造成的。未来气候变化背景下, 植物群落的迁移很可能会带来土壤酶活性的变化, 进而引起土壤碳氮循环的变化。
责任编委: 韩文轩 编辑: 赵 航
致谢
感谢中国科学院贡嘎山站王根绪老师、冉飞老师、杨燕老师及全体站上工作人员在本次实验中给予的大力帮助。感谢贡嘎山站提供的帮助与支持。
参考文献
Simple three-pool model accurately describes patterns of long-term litter decomposition in diverse climates
DOI:10.1111/j.1365-2486.2008.01674.x URL [本文引用: 2]
Soil C and N as causal factors of spatial variation in extracellular enzyme activity across grassland-woodland ecotones
DOI:10.1016/j.apsoil.2016.04.002 URL [本文引用: 1]
A detailed overview of xylanases: an emerging biomolecule for current and future prospective
DOI:10.1186/s40643-019-0276-2 URL [本文引用: 1]
Resource limitation in plants-An economic analogy
DOI:10.1146/annurev.es.16.110185.002051 URL [本文引用: 1]
Soil enzyme activities, microbial communities, and carbon and nitrogen availability in organic agroecosystems across an intensively-managed agricultural landscape
Enzyme activities as a component of soil biodiversity: a review
DOI:10.1016/j.pedobi.2005.06.003 URL [本文引用: 1]
Microbial enzyme shifts explain litter decay responses to simulated nitrogen deposition
Extracellular soil enzyme activities in high-elevation mixed red spruce forests in central Appalachia, USA.
DOI:10.3390/ f11040468 URL [本文引用: 1]
Ecoenzymatic stoichiometry and microbial nutrient limitation in rhizosphere soil in the arid area of the northern Loess Plateau, China
DOI:10.1016/j.soilbio.2017.09.025 URL [本文引用: 1]
Optimization of hydrolytic and oxidative enzyme methods for ecosystem studies
DOI:10.1016/j.soilbio.2011.03.017 URL [本文引用: 1]
Lignin lags, leads, or limits the decomposition of litter and soil organic carbon
DOI:10.1002/ecy. 3113 [本文引用: 1]
Vegetation type rather than climate modulates the variation in soil enzyme activities and stoichiometry in subalpine forests in the eastern Tibetan Plateau
DOI:10.1016/j.geoderma.2020.114424 URL [本文引用: 2]
The effects of substrate composition, quantity, and diversity on microbial activity
DOI:10.1007/s11104-010-0428-9 URL [本文引用: 1]
Microbial ecoenzyme stoichiometry, nutrient limitation, and organic matter decomposition in wetlands of the conterminous United States
DOI:10.1007/s11273-017-9584-5 URL [本文引用: 2]
Review of the roles of plants and soil microorganisms in regulating ecosystem nutrient cycling
植物与土壤微生物在调控生态系统养分循环中的作用
DOI:10.3773/j.issn.1005-264x.2010.08.011
[本文引用: 1]

陆地生态系统的地上、地下是相互联系的。植物与土壤微生物作为陆地生态系统中的重要组成部分, 它们之间的相互作用是生态系统地上、地下结合的重要纽带。该文首先介绍了植物在养分循环中对营养元素的吸收、积累和归还等作用, 阐述了土壤微生物对养分有效性及土壤质量具有重要的作用。其次, 重点综述了植物与土壤微生物之间相互依存、相互竞争的关系。植物通过其凋落物与分泌物为土壤微生物提供营养, 土壤微生物作为分解者提供植物可吸收的营养元素, 比如共生体菌根真菌即可使植物根与土壤真菌达到互惠。然而, 植物的养分吸收与微生物的养分固持同时存在, 因而两者之间存在对养分的竞争。通过植物多样性对土壤微生物多样性的影响分析, 以及土壤微生物直接或间接作用于植物多样性和生产力的分析,探讨了植物物种多样性与土壤微生物多样性之间的内在联系。针对当前植物与土壤微生物对养分循环的调控机制的争论, 提出植物凋落物是调节植物与土壤微生物养分循环的良好媒介, 植物与土壤微生物的共同作用对维持整个生态系统的稳定性具有重要意义。也指出了目前在陆地生态系统地上、地下研究中存在的不足和亟待解决的问题。
Soil extracellular enzyme activities correspond with abiotic factors more than fungal community composition
DOI:10.1007/s10533-013-9852-2 URL [本文引用: 2]
Nitrogen limitation of net primary productivity in terrestrial ecosystems is globally distributed
Our meta-analysis of 126 nitrogen addition experiments evaluated nitrogen (N) limitation of net primary production (NPP) in terrestrial ecosystems. We tested the hypothesis that N limitation is widespread among biomes and influenced by geography and climate. We used the response ratio (R approximately equal ANPP(N)/ANPP(ctrl)) of aboveground plant growth in fertilized to control plots and found that most ecosystems are nitrogen limited with an average 29% growth response to nitrogen (i.e., R = 1.29). The response ratio was significant within temperate forests (R = 1.19), tropical forests (R = 1.60), temperate grasslands (R = 1.53), tropical grasslands (R = 1.26), wetlands (R = 1.16), and tundra (R = 1.35), but not deserts. Eight tropical forest studies had been conducted on very young volcanic soils in Hawaii, and this subgroup was strongly N limited (R = 2.13), which resulted in a negative correlation between forest R and latitude. The degree of N limitation in the remainder of the tropical forest studies (R = 1.20) was comparable to that of temperate forests, and when the young Hawaiian subgroup was excluded, forest R did not vary with latitude. Grassland response increased with latitude, but was independent of temperature and precipitation. These results suggest that the global N and C cycles interact strongly and that geography can mediate ecosystem response to N within certain biome types.
Enzyme stoichiometry indicates the variation of microbial nutrient requirements at different soil depths in subtropical forests
DOI:10.1371/journal.pone.0220599 URL [本文引用: 1]
The regulation by phenolic compounds of soil organic matter dynamics under a changing environment
DOI:10.1155/2015/825098 [本文引用: 3]
Himalayan treeline soil and foliar C:N:P stoichiometry indicate nutrient shortage with elevation
DOI:10.1016/j.geoderma.2016.12.015 URL [本文引用: 2]
Impacts of root symbiotic associations on interspecific variation in sugar exudation rates and rhizosphere microbial communities: a comparison among four plant families
DOI:10.1007/s11104-015-2703-2 URL [本文引用: 1]
Stoichiometry of soil extracellular enzyme activity along a climatic transect in temperate grasslands of northern China
DOI:10.1016/j.soilbio.2016.04.008 URL [本文引用: 2]
Spatial-temporal dynamics of an Abies fabri population near the alpine treeline in the Yajiageng area of Gongga Mountain, China
贡嘎山雅家埂峨眉冷杉林线种群的时空动态
Deep soil organic matter -A key but poorly understood component of terrestrial C cycle
DOI:10.1007/s11104-010-0391-5 URL [本文引用: 1]
Tree density, basal area and species diversity in a disturbed dry tropical forest of northern India: implications for conservation
DOI:10.1017/S0376892906003237 URL [本文引用: 1]
The effects of long term nitrogen deposition on extracellular enzyme activity in an Acer saccharum forest soil
DOI:10.1016/S0038-0717(02)00074-3 URL [本文引用: 1]
Effects of different types of litters on soil organic carbon mineralization
不同类型凋落物对土壤有机碳矿化的影响
Tree-to-tree interactions slow down Himalayan treeline shifts as inferred from tree spatial patterns
DOI:10.1111/jbi.13840 URL [本文引用: 1]
Ecoenzymatic stoichiometry and ecological theory
DOI:10.1146/annurev-ecolsys-071112-124414 URL [本文引用: 1]
Ecoenzymatic stoichiometry of microbial organic nutrient acquisition in soil and sediment
DOI:10.1038/nature08632 URL [本文引用: 2]
Stoichiometry of soil enzyme activity at global scale
DOI:10.1111/j.1461-0248.2008.01245.x
PMID:18823393
[本文引用: 3]
Extracellular enzymes are the proximate agents of organic matter decomposition and measures of these activities can be used as indicators of microbial nutrient demand. We conducted a global-scale meta-analysis of the seven-most widely measured soil enzyme activities, using data from 40 ecosystems. The activities of beta-1,4-glucosidase, cellobiohydrolase, beta-1,4-N-acetylglucosaminidase and phosphatase g(-1) soil increased with organic matter concentration; leucine aminopeptidase, phenol oxidase and peroxidase activities showed no relationship. All activities were significantly related to soil pH. Specific activities, i.e. activity g(-1) soil organic matter, also varied in relation to soil pH for all enzymes. Relationships with mean annual temperature (MAT) and precipitation (MAP) were generally weak. For hydrolases, ratios of specific C, N and P acquisition activities converged on 1 : 1 : 1 but across ecosystems, the ratio of C : P acquisition was inversely related to MAP and MAT while the ratio of C : N acquisition increased with MAP. Oxidative activities were more variable than hydrolytic activities and increased with soil pH. Our analyses indicate that the enzymatic potential for hydrolyzing the labile components of soil organic matter is tied to substrate availability, soil pH and the stoichiometry of microbial nutrient demand. The enzymatic potential for oxidizing the recalcitrant fractions of soil organic material, which is a proximate control on soil organic matter accumulation, is most strongly related to soil pH. These trends provide insight into the biogeochemical processes that create global patterns in ecological stoichiometry and organic matter storage.
Mycorrhizal types differ in ecophysiology and alter plant nutrition and soil processes
DOI:10.1111/brv.12538
PMID:31270944
[本文引用: 2]
Mycorrhizal fungi benefit plants by improved mineral nutrition and protection against stress, yet information about fundamental differences among mycorrhizal types in fungi and trees and their relative importance in biogeochemical processes is only beginning to accumulate. We critically review and synthesize the ecophysiological differences in ectomycorrhizal, ericoid mycorrhizal and arbuscular mycorrhizal symbioses and the effect of these mycorrhizal types on soil processes from local to global scales. We demonstrate that guilds of mycorrhizal fungi display substantial differences in genome-encoded capacity for mineral nutrition, particularly acquisition of nitrogen and phosphorus from organic material. Mycorrhizal associations alter the trade-off between allocation to roots or mycelium, ecophysiological traits such as root exudation, weathering, enzyme production, plant protection, and community assembly as well as response to climate change. Mycorrhizal types exhibit differential effects on ecosystem carbon and nutrient cycling that affect global elemental fluxes and may mediate biome shifts in response to global change. We also note that most studies performed to date have not been properly replicated and collectively suffer from strong geographical sampling bias towards temperate biomes. We advocate that combining carefully replicated field experiments and controlled laboratory experiments with isotope labelling and -omics techniques offers great promise towards understanding differences in ecophysiology and ecosystem services among mycorrhizal types.© 2019 Cambridge Philosophical Society.
Fate of lignins in soils: a review
DOI:10.1016/j.soilbio.2010.03.017 URL [本文引用: 1]
Changes in soil nutrient and enzyme activities under different vegetations in the Loess Plateau area, Northwest China
Soil enzyme activity and stoichiometry in forest ecosystems along the North-South Transect in eastern China (NSTEC
).DOI:10.1016/j.soilbio.2016.10.020 URL [本文引用: 2]
Vegetation type affects soil enzyme activities and microbial functional diversity following re-vegetation of a severely eroded red soil in sub-tropical China
DOI:10.1016/j.catena.2013.11.015 URL [本文引用: 1]
The importance of amino sugar turnover to C and N cycling in organic horizons of old-growth Douglas-fir forest soils colonized by ectomycorrhizal mats
DOI:10.1007/s10533-012-9746-8 URL [本文引用: 1]
Linkages of C:N:P stoichiometry between soil and leaf and their response to climatic factors along altitudinal gradients
DOI:10.1007/s11368-018-2173-2
[本文引用: 2]
Purpose Altitudinal gradients have been recognized as a natural experiment to assess the structure and functions of above - and below-ground ecosystem under global climate change. Nutrient stoichiometry is tightly linked both the above- and below-ground functioning, but how the altitudinal gradients affect nutrient stoichiometry among plant and soil systems remains unclear. Materials and methods Soil samples were collected at 17 sites along an altitudinal gradient from 1362 to 3320m in the North Slope of Taibai Mountain. These samples represent three different climate zones, including a warm temperate zone, a cold temperate zone, and an alpine cold zone. Soil moisture (SM), soil temperature (ST), and the concentrations of carbon (C), nitrogen (N), and phosphorus (P) in soil and leaves were determined. Results and discussion The C and N in soil and leaves were higher at medium altitudes than that at low or high altitudes, while P concentrations increased significantly as altitude increased. The C: N ratio in soil and leaves was not significantly affected by altitudinal gradients, but the C: P and N: P ratios were lower at high altitudes. In particular, the leaf N:P ratio at high altitudes was less than 12, suggesting an increase in N limitation along altitudinal gradients. Moreover, except the C: N ratio, soil C: N: P stoichiometry was significantly related to leaf C: N: P stoichiometry, and both showed closed relationships with ST and SM. Conclusions These results suggest that stoichiometric characteristics appear to be closely linked with climatic factors, and improved knowledge of C: N: P stoichiometry patterns along altitudinal gradients will be indispensable to a comprehensive understanding of the influences of climate change on ecosystems.
Factors influencing soil enzyme activity in China’s forest ecosystems
DOI:10.1007/s11258-017-0775-1 URL [本文引用: 1]
Soil extracellular enzyme activity and stoichiometry in Chinaʼs forests
DOI:10.1111/1365-2435.13555 URL [本文引用: 2]
Vertical pattern and its driving factors in soil extracellular enzyme activity and stoichiometry along mountain grassland belts
DOI:10.1007/s10533-018-0499-x URL [本文引用: 3]
