
植物生态学报 ›› 2022, Vol. 46 ›› Issue (2): 232-242.DOI: 10.17521/cjpe.2021.0215
所属专题: 生态化学计量; 青藏高原植物生态学:植物-土壤-微生物; 生物地球化学
李东1,2, 田秋香2, 赵小祥2,3, 林巧玲2,3, 岳朋芸2,3, 姜庆虎2, 刘峰2,*( )
)
收稿日期:2021-06-07
接受日期:2021-09-15
出版日期:2022-02-20
发布日期:2021-10-15
通讯作者:
刘峰
作者简介:(liufeng@wbgcas.cn)基金资助:
LI Dong1,2, TIAN Qiu-Xiang2, ZHAO Xiao-Xiang2,3, LIN Qiao-Ling2,3, YUE Peng-Yun2,3, JIANG Qing-Hu2, LIU Feng2,*()
Received:2021-06-07
Accepted:2021-09-15
Online:2022-02-20
Published:2021-10-15
Contact:
LIU Feng
Supported by:摘要:
土壤胞外酶及其化学计量比是反映土壤养分可用性和微生物底物限制的敏感指标。然而, 对全球变化敏感的高山树线过渡带土壤酶活性和化学计量比的变化特征及其关键驱动因素仍不清楚。该研究在青藏高原东南部的川西贡嘎山高山树线过渡带(森林、树线、灌丛)进行土壤采样, 测定了树线过渡带土壤中5种水解酶(β-葡萄糖苷酶(BG)、纤维素二糖水解酶(CBH)、木聚糖水解酶(XYL)、N-乙酰氨基葡萄糖苷酶(NAG)、亮氨酸氨基肽酶(LAP))和2种氧化酶(多酚氧化酶(POX)、过氧化氢酶(CAT))的活性, 并计算土壤胞外酶活性化学计量比(碳、氮(N)酶活性比和碳质量指数)。结果表明: 灌丛土壤LAP、POX、CAT活性显著低于树线和森林土壤, XYL活性在树线最低, 其他胞外酶活性在树线过渡带不同位置差异不显著。灌丛土壤lnBG/lnLAP显著高于森林和树线处土壤, lnBG/ln(NAG + LAP)在树线过渡带没有显著变化, 碳质量指数在树线处最高。非度量多维尺度分析表明, 土壤有机碳、全氮、硝态氮含量和植物叶片木质素:N是影响树线过渡带土壤酶活性差异的主要因素, 植物叶片碳氮比、木质素:N和土壤可溶性氮含量是影响树线过渡带土壤胞外酶活性化学计量比差异的主要因素。综上所述, 贡嘎山地区的部分土壤酶活性及其化学计量比沿树线过渡带会发生明显的变化, 这种变化可能是由不同植物类型下微生物群落差异导致。这表明, 未来气候变化引起的树线迁移可能会改变胞外酶活性进而影响土壤养分循环。
李东, 田秋香, 赵小祥, 林巧玲, 岳朋芸, 姜庆虎, 刘峰. 贡嘎山树线过渡带土壤胞外酶活性及其化学计量比特征. 植物生态学报, 2022, 46(2): 232-242. DOI: 10.17521/cjpe.2021.0215
LI Dong, TIAN Qiu-Xiang, ZHAO Xiao-Xiang, LIN Qiao-Ling, YUE Peng-Yun, JIANG Qing-Hu, LIU Feng. Soil extracellular enzyme activities and their stoichiometric ratio in the alpine treeline ecotones in Gongga Mountain, China. Chinese Journal of Plant Ecology, 2022, 46(2): 232-242. DOI: 10.17521/cjpe.2021.0215
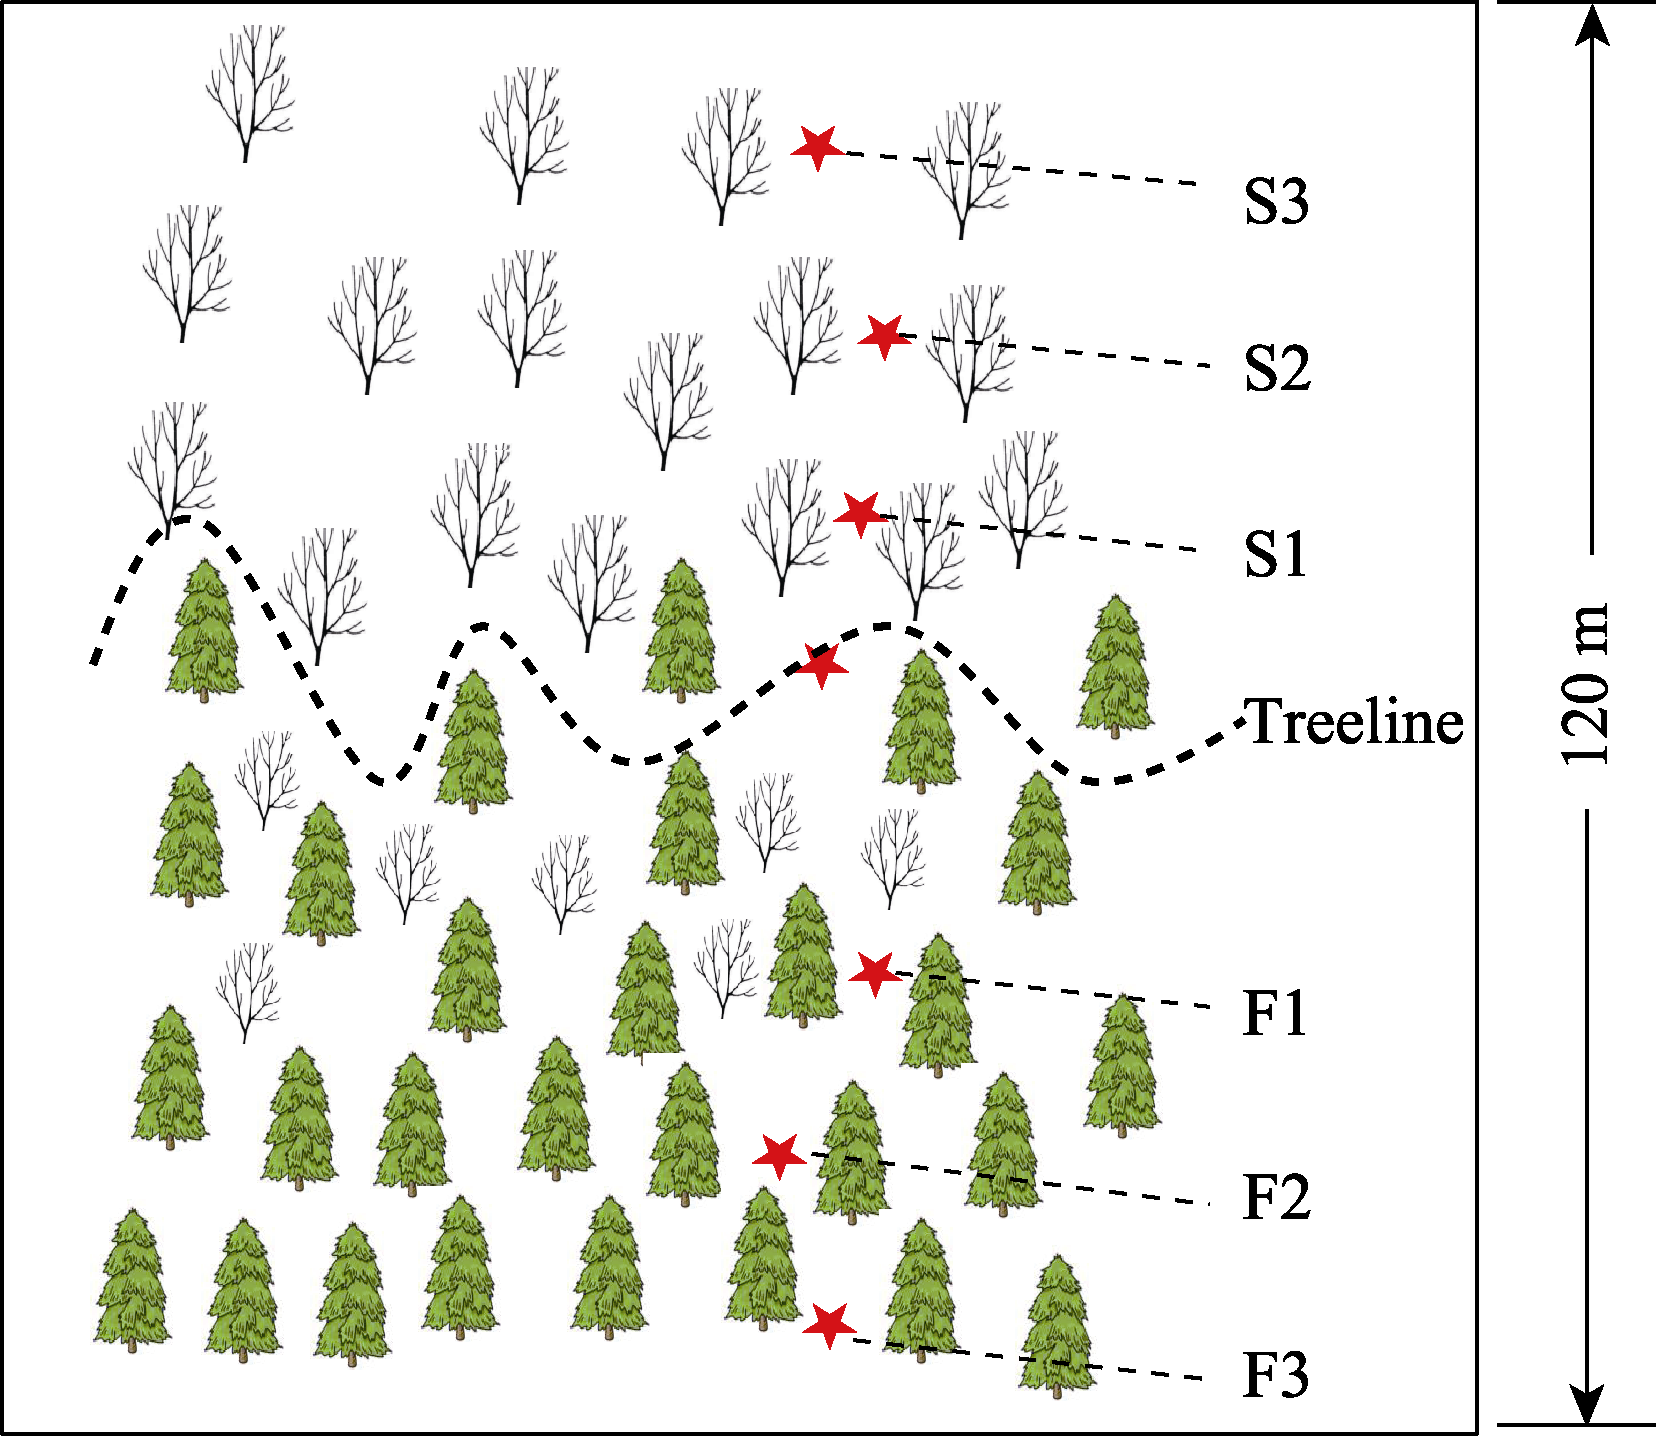
图1 贡嘎山树线过渡带样地示意图。F1、F2、F3为树线下方的森林样方; S1、S2、S3为灌丛样方; Treeline为树线处样方。从F3到S3海拔依次升高。
Fig. 1 Schematic diagram of the sample sites in the alpine treeline ecotones in Gongga Mountain. F1, F2, F3 are the forest samples; S1, S2, S3 are the shrub samples; Treeline is the sample at the treeline. Altitude rises from F3 to S3 in ascending order.
| 森林(峨眉冷杉) Forest (Abies fabri) | 树线(峨眉冷杉) Treeline (Abies fabri) | 灌丛(毡毛栎叶杜鹃) Shrub (Rhododendron phaeochrysum var. levistratum) | 位置 Location | |||||||
|---|---|---|---|---|---|---|---|---|---|---|
| F3 | F2 | F1 | S1 | S2 | S3 | |||||
| 单位面积胸高断面积 BA (m2·hm-2) | 291.0 ± 49.0a | 235.7 ± 42.2ab | 171.1 ± 47.9abc | 110.1 ± 22.9c | 135.6 ± 17.3bc | 149.9 ± 14.7bc | 124.8 ± 19.2bc | ** | ||
| 叶片碳含量 Leaf carbon (C) content (mg·g-1) | 429.4 ± 35.5ab | 457.9 ± 41.1a | 431.0 ± 28.8a | 397.2 ± 25.0abc | 361.8 ± 34.3bc | 369.0 ± 26.1bc | 354.8 ± 20.2c | *** | ||
| 叶片氮含量 Leaf nitrogen (N) content (mg·g-1) | 13.2 ± 0.3a | 12.7 ± 0.8a | 13.1 ± 0.8a | 12.2 ± 0.5a | 8.6 ± 0.8b | 8.3 ± 0.5b | 7.9 ± 0.7b | *** | ||
| 叶片碳氮比 Leaf C:N | 32.5 ± 2.2c | 36.0 ± 1.4bc | 33.2 ± 2.2bc | 32.7 ± 2.4bc | 42.3 ± 2.6ab | 44.8 ± 3.4a | 45.8 ± 3.3a | *** | ||
| 叶片木质素:氮 Leaf lignin:N | 1.7 ± 0.1b | 1.9 ± 0.1ab | 2.0 ± 0.1ab | 2.1 ± 0.1a | 0.8 ± 0.1c | 0.7 ± 0.0c | 0.7 ± 0.1c | *** | ||
表1 贡嘎山树线过渡带不同位置优势树种植被属性及叶片养分特征(平均值±标准误)
Table 1 Vegetation properties and leaf nutrient characteristics of dominant tree species at different locations in the treeline ecotone in Gongga Mountain (mean ± SE)
| 森林(峨眉冷杉) Forest (Abies fabri) | 树线(峨眉冷杉) Treeline (Abies fabri) | 灌丛(毡毛栎叶杜鹃) Shrub (Rhododendron phaeochrysum var. levistratum) | 位置 Location | |||||||
|---|---|---|---|---|---|---|---|---|---|---|
| F3 | F2 | F1 | S1 | S2 | S3 | |||||
| 单位面积胸高断面积 BA (m2·hm-2) | 291.0 ± 49.0a | 235.7 ± 42.2ab | 171.1 ± 47.9abc | 110.1 ± 22.9c | 135.6 ± 17.3bc | 149.9 ± 14.7bc | 124.8 ± 19.2bc | ** | ||
| 叶片碳含量 Leaf carbon (C) content (mg·g-1) | 429.4 ± 35.5ab | 457.9 ± 41.1a | 431.0 ± 28.8a | 397.2 ± 25.0abc | 361.8 ± 34.3bc | 369.0 ± 26.1bc | 354.8 ± 20.2c | *** | ||
| 叶片氮含量 Leaf nitrogen (N) content (mg·g-1) | 13.2 ± 0.3a | 12.7 ± 0.8a | 13.1 ± 0.8a | 12.2 ± 0.5a | 8.6 ± 0.8b | 8.3 ± 0.5b | 7.9 ± 0.7b | *** | ||
| 叶片碳氮比 Leaf C:N | 32.5 ± 2.2c | 36.0 ± 1.4bc | 33.2 ± 2.2bc | 32.7 ± 2.4bc | 42.3 ± 2.6ab | 44.8 ± 3.4a | 45.8 ± 3.3a | *** | ||
| 叶片木质素:氮 Leaf lignin:N | 1.7 ± 0.1b | 1.9 ± 0.1ab | 2.0 ± 0.1ab | 2.1 ± 0.1a | 0.8 ± 0.1c | 0.7 ± 0.0c | 0.7 ± 0.1c | *** | ||
| 土壤指标 Soil index | 森林 Forest | 树线 Treeline | 灌丛 Shrub | 位置 Location | ||||
|---|---|---|---|---|---|---|---|---|
| F3 | F2 | F1 | S1 | S2 | S3 | |||
| 有机碳含量 SOC content (mg·g-1) | 218.8 ± 34.0a | 185.8 ± 23.7ab | 171.1 ± 24.6ab | 173.9 ± 16.2ab | 139.9 ± 27.1b | 160.3 ± 7.0ab | 118.3 ± 12.3b | * |
| 全氮含量 TN content (mg·g-1) | 11.0 ± 1.9a | 8.7 ± 1.2ab | 9.1 ± 1.4ab | 8.5 ± 0.7ab | 7.4 ± 1.3ab | 7.9 ± 0.5ab | 6.0 ± 0.8b | * |
| 碳氮比 C:N | 20.2 ± 0.6a | 21.5 ± 1.5a | 18.9 ± 0.8a | 20.5 ± 0.5a | 19.0 ± 0.7a | 20.4 ± 0.7a | 19.9 ± 0.7a | NS |
| 可溶性有机碳含量 DOC content (μg·g-1) | 317.7 ± 53.3a | 3 109.8 ± 84.1a | 241.3 ± 29.8ab | 265.2 ± 42.5ab | 199.9 ± 56.6ab | 227.9 ± 18.8ab | 142.3 ± 23.4b | ** |
| 可溶性氮含量 DN content (μg·g-1) | 30.5 ± 2.3a | 34.1 ± 13.1a | 21.9 ± 3.7ab | 22.2 ± 4.1ab | 16.8 ± 3.0ab | 28.7 ± 7.7a | 11.6 ± 0.7b | ** |
| 可溶性碳氮比 DOC:DN | 10.4 ± 1.6a | 10.2 ± 0.8a | 11.3 ± 0.6a | 12.8 ± 2.0a | 11.4 ± 1.7a | 10.1 ± 2.4a | 12.2 ± 1.9a | NS |
| 铵态氮含量 NH4+-N content (μg·g-1) | 41.2 ± 11.4a | 40.5 ± 9.2a | 36.2 ± 6.9a | 36.8 ± 3.4a | 42.3 ± 15.0a | 48.1 ± 15.0a | 26.5 ± 6.3a | NS |
| 硝态氮含量 NO3--N content (μg·g-1) | 5.8 ± 0.5a | 5.6 ± 0.5a | 5.0 ± 0.4ab | 5.0 ± 0.5ab | 4.3 ± 0.5b | 4.5 ± 0.4ab | 3.8 ± 0.4b | *** |
| pH | 4.0 ± 0.1b | 3.9 ± 0.1b | 4.3 ± 0.1a | 4.1 ± 0.1ab | 4.2 ± 0.1ab | 4.1 ± 0.1ab | 4.1 ± 0.1ab | * |
| 黏粒含量 Clay content (%) | 5.1 ± 0.8a | 4.9 ± 0.5a | 4.7 ± 0.9a | 3.9 ± 0.6a | 4.8 ± 0.8a | 4.3 ± 0.4a | 5.1 ± 0.6a | NS |
| 砂粒含量 Sand content (%) | 27.6 ± 6.2a | 28.1 ± 3.5a | 33.8 ± 7.6a | 37.3 ± 5.5a | 38.9 ± 3.8a | 33.8 ± 2.2a | 29.0 ± 4.1a | NS |
| 微生物生物量碳含量 MBC content (μg·g-1) | 2 905 ± 611a | 2 672 ± 203a | 2 141 ± 386a | 2 696 ± 323a | 2 242 ± 605a | 2 717 ± 142a | 1 859 ± 239a | NS |
表2 贡嘎山树线过渡带不同位置土壤基本理化性质(平均值±标准误)
Table 2 Soil physic-chemical properties at different locations in the treeline ecotone in Gongga Mountain (mean ± SE)
| 土壤指标 Soil index | 森林 Forest | 树线 Treeline | 灌丛 Shrub | 位置 Location | ||||
|---|---|---|---|---|---|---|---|---|
| F3 | F2 | F1 | S1 | S2 | S3 | |||
| 有机碳含量 SOC content (mg·g-1) | 218.8 ± 34.0a | 185.8 ± 23.7ab | 171.1 ± 24.6ab | 173.9 ± 16.2ab | 139.9 ± 27.1b | 160.3 ± 7.0ab | 118.3 ± 12.3b | * |
| 全氮含量 TN content (mg·g-1) | 11.0 ± 1.9a | 8.7 ± 1.2ab | 9.1 ± 1.4ab | 8.5 ± 0.7ab | 7.4 ± 1.3ab | 7.9 ± 0.5ab | 6.0 ± 0.8b | * |
| 碳氮比 C:N | 20.2 ± 0.6a | 21.5 ± 1.5a | 18.9 ± 0.8a | 20.5 ± 0.5a | 19.0 ± 0.7a | 20.4 ± 0.7a | 19.9 ± 0.7a | NS |
| 可溶性有机碳含量 DOC content (μg·g-1) | 317.7 ± 53.3a | 3 109.8 ± 84.1a | 241.3 ± 29.8ab | 265.2 ± 42.5ab | 199.9 ± 56.6ab | 227.9 ± 18.8ab | 142.3 ± 23.4b | ** |
| 可溶性氮含量 DN content (μg·g-1) | 30.5 ± 2.3a | 34.1 ± 13.1a | 21.9 ± 3.7ab | 22.2 ± 4.1ab | 16.8 ± 3.0ab | 28.7 ± 7.7a | 11.6 ± 0.7b | ** |
| 可溶性碳氮比 DOC:DN | 10.4 ± 1.6a | 10.2 ± 0.8a | 11.3 ± 0.6a | 12.8 ± 2.0a | 11.4 ± 1.7a | 10.1 ± 2.4a | 12.2 ± 1.9a | NS |
| 铵态氮含量 NH4+-N content (μg·g-1) | 41.2 ± 11.4a | 40.5 ± 9.2a | 36.2 ± 6.9a | 36.8 ± 3.4a | 42.3 ± 15.0a | 48.1 ± 15.0a | 26.5 ± 6.3a | NS |
| 硝态氮含量 NO3--N content (μg·g-1) | 5.8 ± 0.5a | 5.6 ± 0.5a | 5.0 ± 0.4ab | 5.0 ± 0.5ab | 4.3 ± 0.5b | 4.5 ± 0.4ab | 3.8 ± 0.4b | *** |
| pH | 4.0 ± 0.1b | 3.9 ± 0.1b | 4.3 ± 0.1a | 4.1 ± 0.1ab | 4.2 ± 0.1ab | 4.1 ± 0.1ab | 4.1 ± 0.1ab | * |
| 黏粒含量 Clay content (%) | 5.1 ± 0.8a | 4.9 ± 0.5a | 4.7 ± 0.9a | 3.9 ± 0.6a | 4.8 ± 0.8a | 4.3 ± 0.4a | 5.1 ± 0.6a | NS |
| 砂粒含量 Sand content (%) | 27.6 ± 6.2a | 28.1 ± 3.5a | 33.8 ± 7.6a | 37.3 ± 5.5a | 38.9 ± 3.8a | 33.8 ± 2.2a | 29.0 ± 4.1a | NS |
| 微生物生物量碳含量 MBC content (μg·g-1) | 2 905 ± 611a | 2 672 ± 203a | 2 141 ± 386a | 2 696 ± 323a | 2 242 ± 605a | 2 717 ± 142a | 1 859 ± 239a | NS |
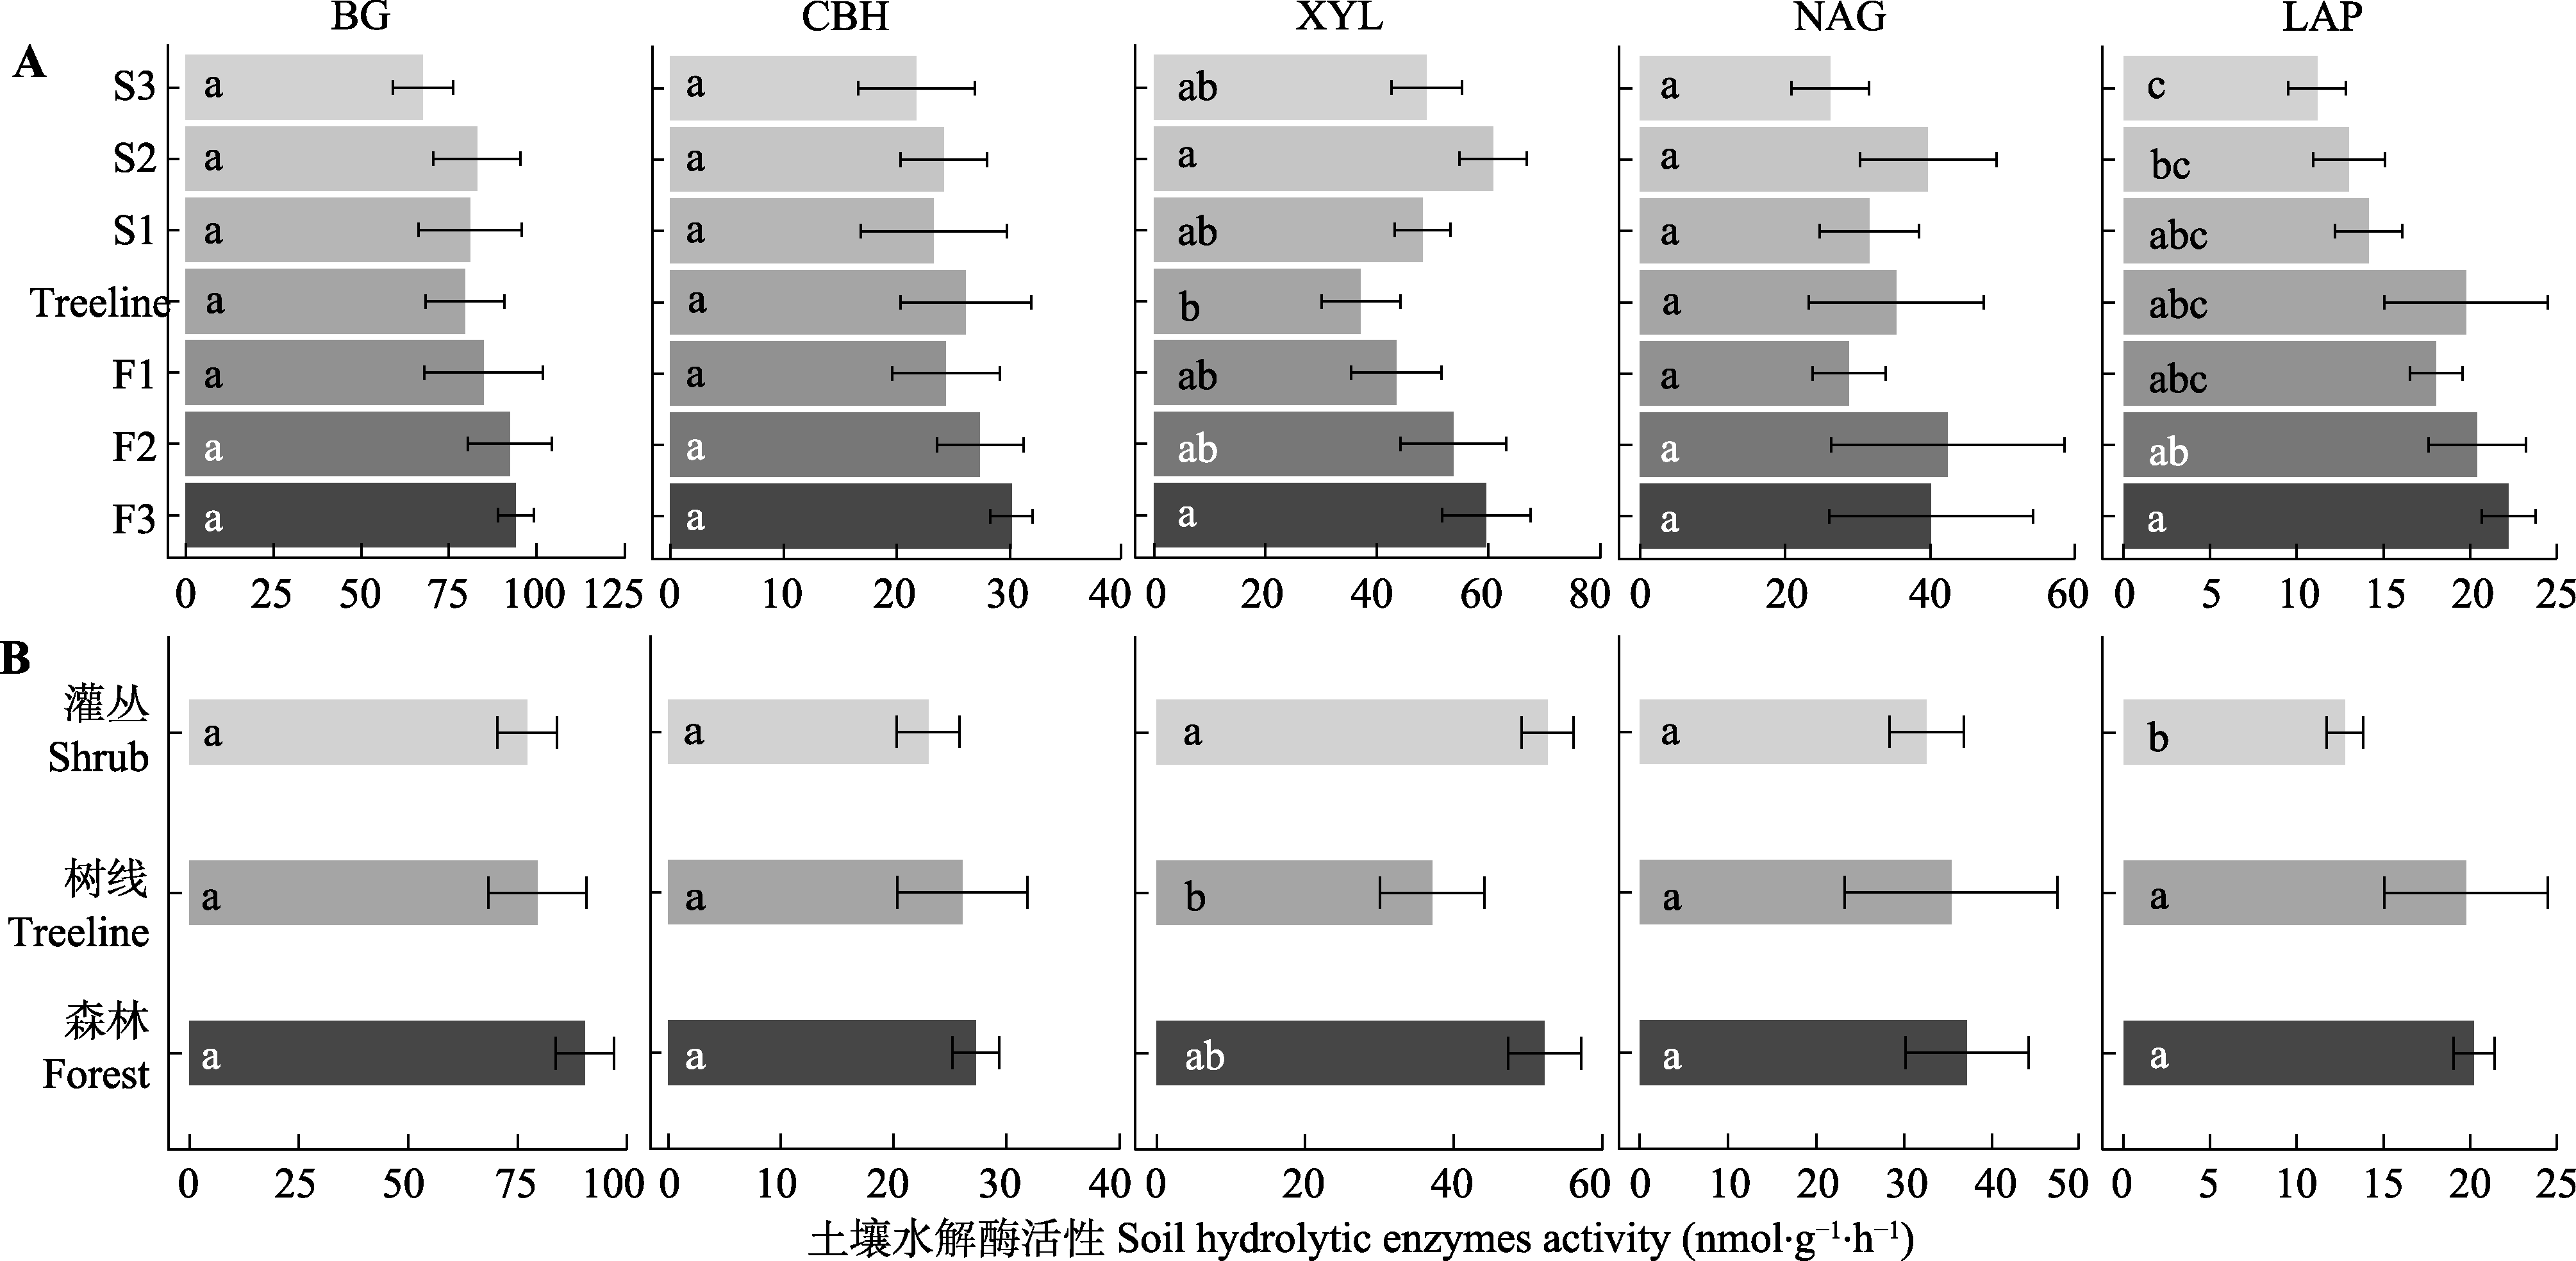
图2 贡嘎山树线过渡带不同位置土壤水解酶活性的变化(平均值±标准误)。BG, β-葡萄糖苷酶; CBH, 纤维素二糖水解酶; LAP, 亮氨酸氨基肽酶; NAG, N-乙酰氨基葡萄糖苷酶; XYL, 木聚糖水解酶。F1、F2、F3为树线下方的森林样方; S1、S2、S3为灌丛样方; Treeline为树线处样方。不同小写字母表示过渡带不同位置(植被类型)差异显著(p < 0.05)。
Fig. 2 Soil hydrolytic enzyme activities at different locations in the treeline ecotone in Gongga Mountain (mean ± SE). BG, β-1,4-glucosidase; CBH, cellobiohydrolase; LAP, leucine aminopeptidase; NAG, β-N-acetyl glucosaminidase; XYL, xylosidase. F1, F2, F3 are forest samples; S1, S2, S3 are shrub samples; Treeline is the sample at the tree line. Different lowercase letters indicate significant differences (p < 0.05) among different locations or vegetation types in the treeline ecotone.
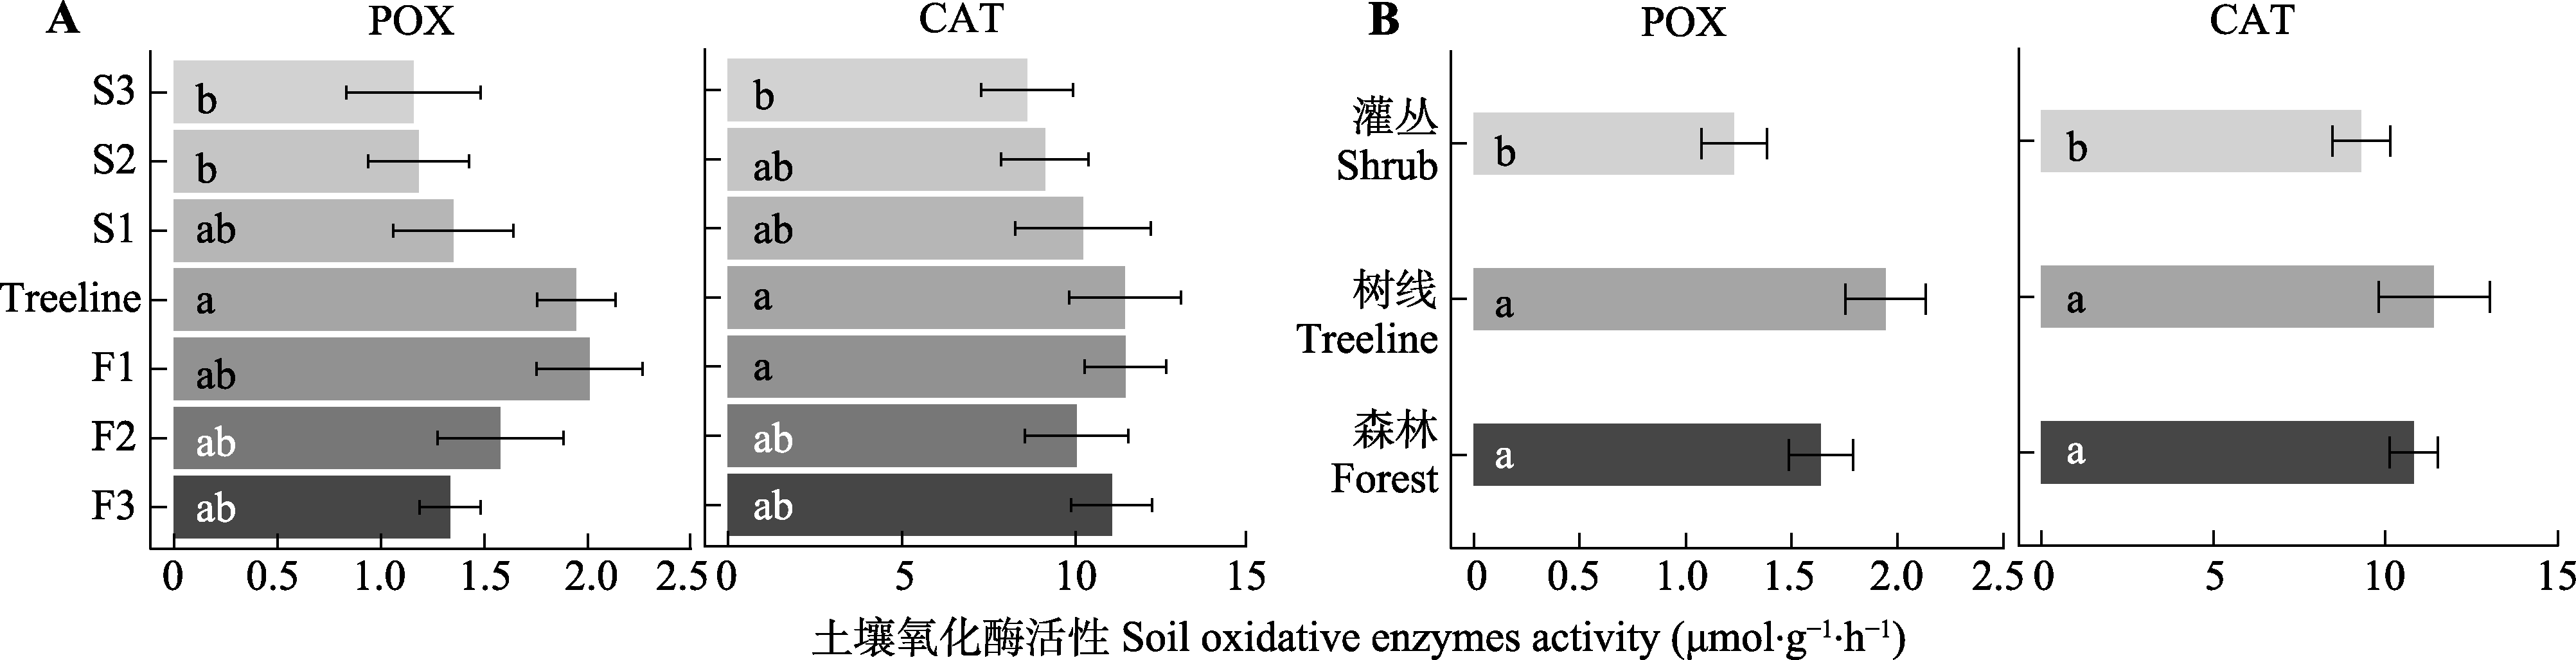
图3 贡嘎山树线过渡带不同位置土壤氧化酶活性的变化(平均值±标准误)。CAT, 过氧化氢酶; POX, 多酚氧化酶。F1、F2、F3为树线下方的森林样方; S1、S2、S3为灌丛样方; Treeline为树线处样方。不同小写字母表示过渡带不同位置(植被类型)差异显著(p < 0.05)。
Fig. 3 Soil oxidative enzyme activities at different locations in the treeline ecotone in Gongga Mountain (mean ± SE). CAT, Catalase; POX, phenol oxidase. F1, F2, F3 are forest samples; S1, S2, S3 are shrub samples; Treeline is the sample at the tree line. Different lowercase letters indicate significant differences (p < 0.05) among different locations or vegetation types in the treeline ecotone.
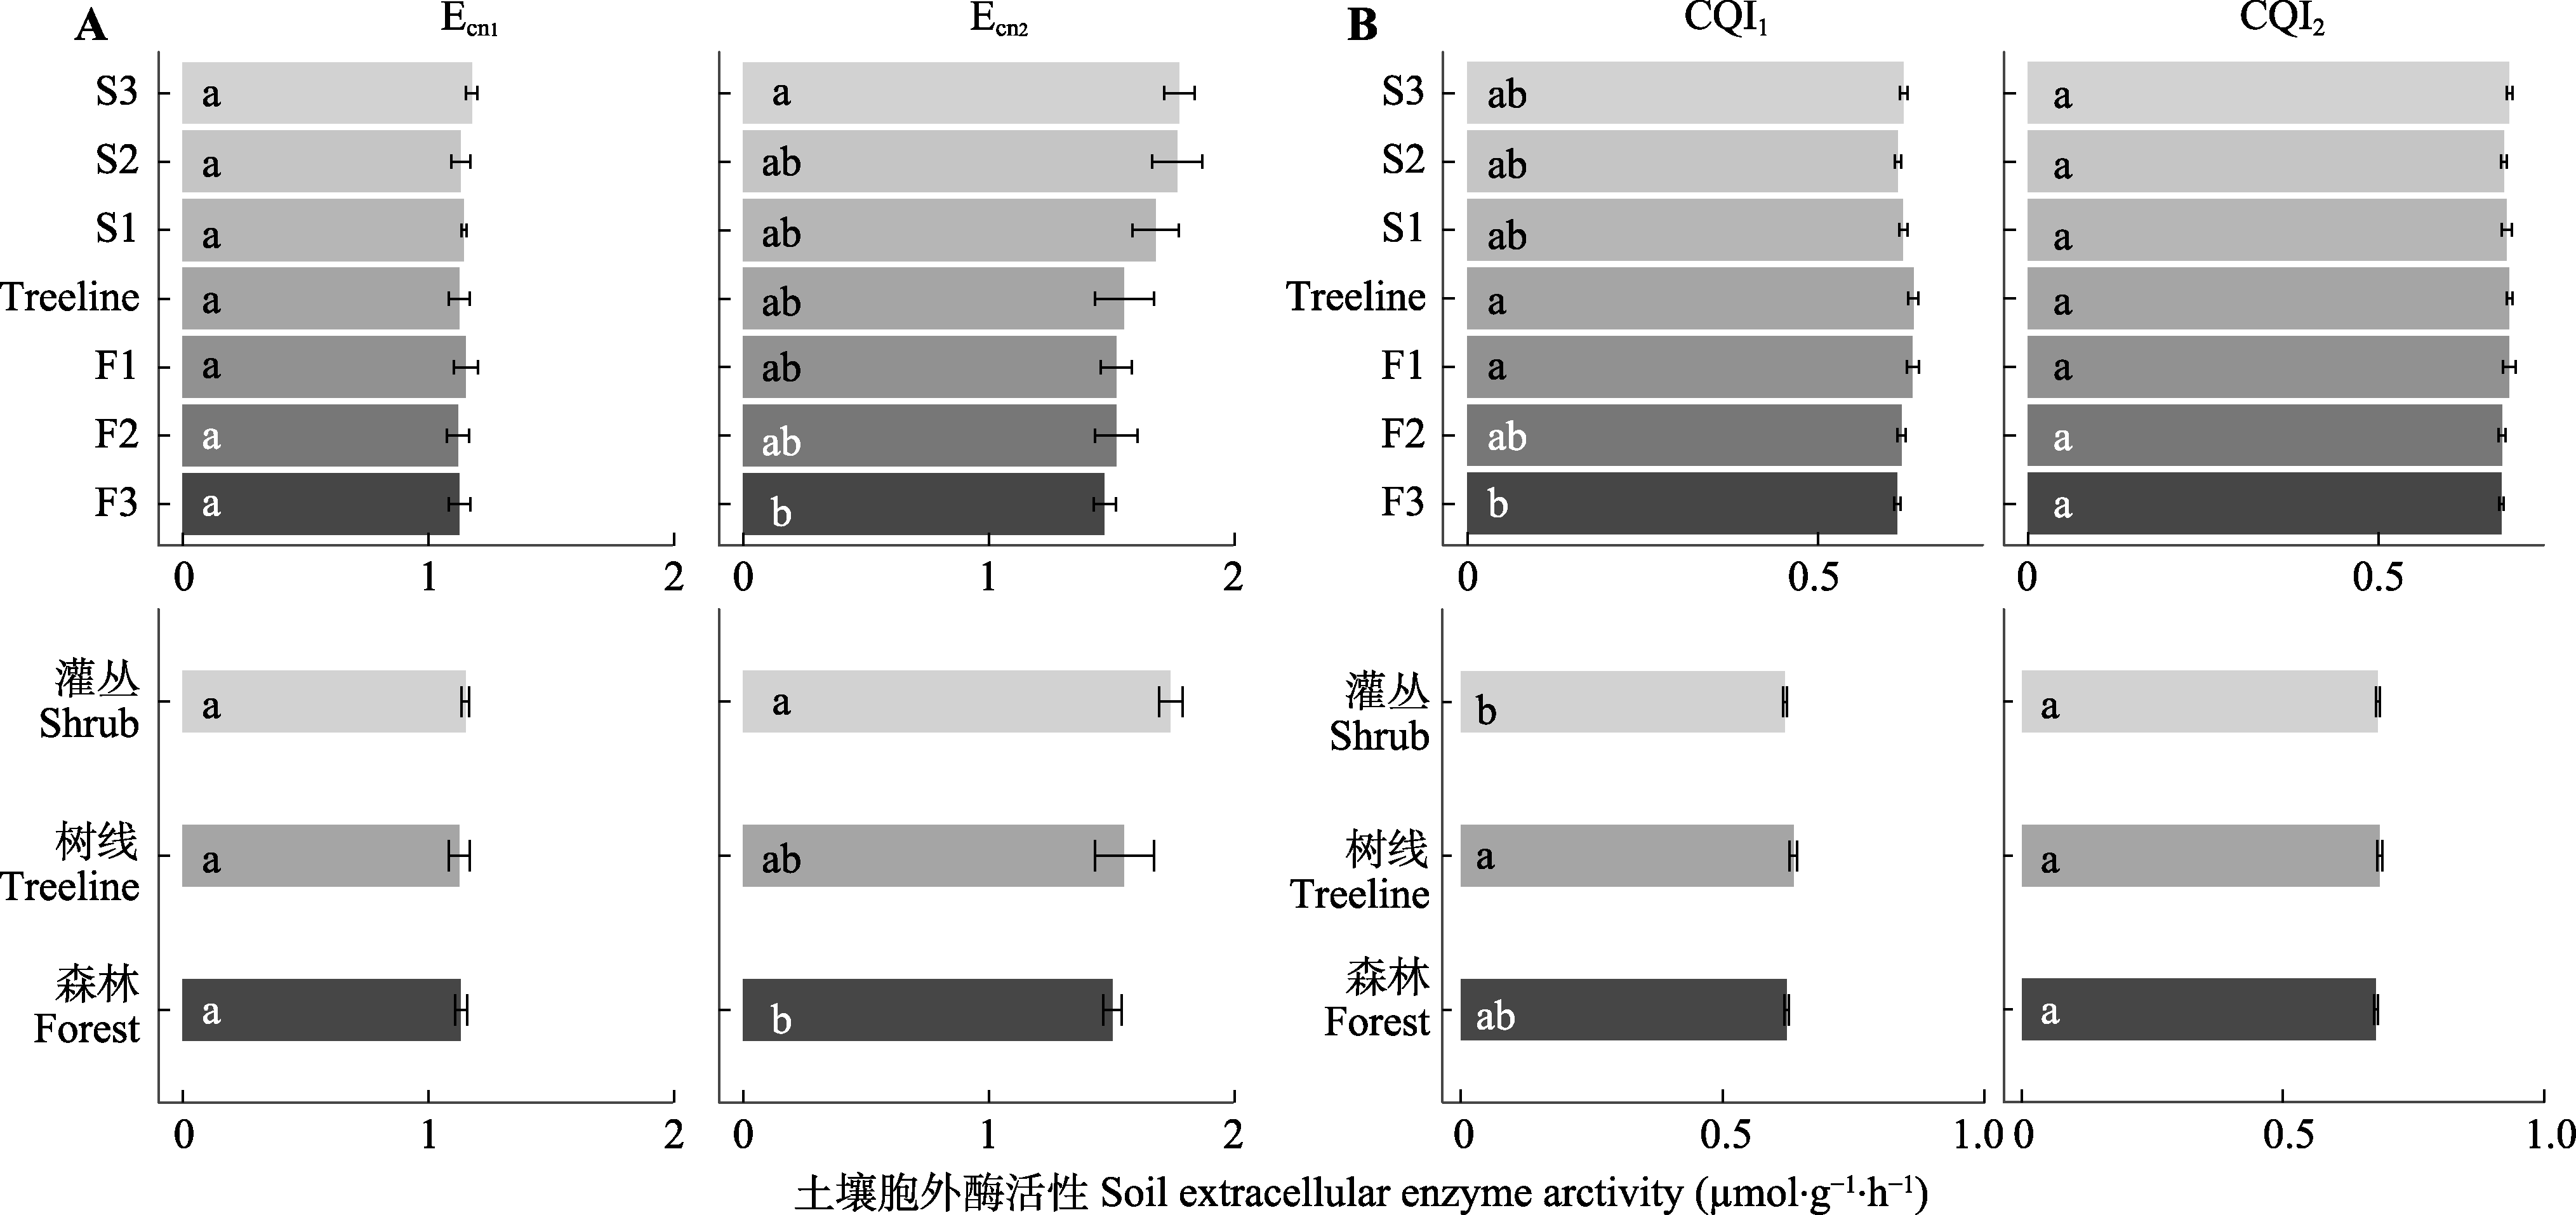
图4 贡嘎山树线过渡带土壤胞外酶化学计量比的变化(平均值±标准误)。CQI1、CQI2表示碳质量指数; Ecn1、Ecn2表示微生物碳、氮酶活性计量比。F1、F2、F3为树线下方的森林样方; S1、S2、S3为灌丛样方; Treeline为树线处样方。不同小写字母表示过渡带不同位置(植被类型)差异显著(p < 0.05)。
Fig. 4 Soil extracellular enzyme stoichiometry at different locations in the treeline ecotone in Gongga Mountain (mean ± SE). CQI1, CQI2 indicate carbon quality index; Ecn1, Ecn2 indicate microbial carbon and nitrogen enzyme activity stoichiometry ratios. F1, F2, F3 are the forest samples; S1, S2, S3 are the shrub samples; Treeline is the sample at the tree line. Different lowercase letters indicate significant differences (p < 0.05) between different locations or vegetation types in the treeline ecotone.
| 变量 Variable | BG | CBH | XYL | LAP | NAG | POX | CAT | Ecn1 | Ecn2 | CQI1 | CQI2 |
|---|---|---|---|---|---|---|---|---|---|---|---|
| SOC | 0.62*** | 0.52** | 0.55*** | 0.37* | 0.51** | 0.38* | 0.49** | -0.15 | -0.15 | -0.31 | -0.51** |
| TN | 0.63*** | 0.52** | 0.62*** | 0.32 | 0.44** | 0.45** | 0.57*** | -0.05 | -0.13 | -0.26 | -0.49** |
| C:N | -0.09 | -0.09 | -0.21 | -0.23 | -0.07 | -0.24 | -0.25 | 0.11 | 0.31 | -0.17 | 0.01 |
| DOC | 0.43** | 0.32 | 0.34 | 0.18 | 0.36* | 0.37* | 0.50** | -0.11 | -0.08 | -0.07 | -0.25 |
| DN | 0.16 | 0.04 | 0.25 | 0.14 | 0.12 | 0.02 | 0.18 | -0.14 | -0.12 | -0.21 | -0.08 |
| DOC:DN | 0.43* | 0.46** | 0.15 | 0.23 | 0.24 | 0.51** | 0.56*** | 0.12 | -0.08 | 0.07 | -0.24 |
| MBC | 0.52** | 0.34* | 0.48** | 0.25 | 0.55*** | 0.23 | 0.29 | -0.29 | -0.04 | -0.30 | -0.50** |
| NO3--N | 0.59*** | 0.47** | 0.42* | 0.48** | 0.27 | 0.34 | 0.51** | -0.06 | -0.29 | -0.21 | -0.43** |
| NH4+-N | 0.04 | -0.21 | -0.07 | -0.02 | -0.04 | -0.15 | -0.19 | -0.01 | -0.06 | -0.19 | -0.12 |
| pH | 0.09 | 0.27 | 0.07 | 0.03 | 0.18 | 0.29 | 0.41* | -0.04 | 0.01 | 0.19 | 0.05 |
| Clay | 0.08 | 0.01 | 0.10 | 0.02 | -0.23 | -0.01 | 0.09 | 0.22 | -0.11 | -0.03 | -0.01 |
| Leaf C:N | -0.04 | -0.05 | 0.23 | -0.38* | 0.07 | -0.25 | -0.20 | 0.03 | 0.45** | -0.13 | -0.02 |
| Leaf lignin:N | 0.10 | 0.20 | -0.32 | 0.48** | -0.09 | 0.43** | 0.07 | 0.06 | -0.50** | 0.35* | -0.06 |
| CQI1 | -0.52** | -0.38* | -0.53*** | -0.15 | -0.36* | 0.39* | 0.00 | 0.04 | -0.14 | ||
| CQI2 | -0.90*** | -0.76*** | -0.58*** | -0.38* | -0.63*** | -0.29 | -0.22 | 0.00 | -0.04 |
表3 贡嘎山树线过渡带土壤酶活性及其化学计量比与环境变量之间的相关关系
Table 3 Spearman’s correlation coefficients between environmental variables and enzyme activities and enzyme stoichiometry in the treeline ecotone in Gongga Mountain
| 变量 Variable | BG | CBH | XYL | LAP | NAG | POX | CAT | Ecn1 | Ecn2 | CQI1 | CQI2 |
|---|---|---|---|---|---|---|---|---|---|---|---|
| SOC | 0.62*** | 0.52** | 0.55*** | 0.37* | 0.51** | 0.38* | 0.49** | -0.15 | -0.15 | -0.31 | -0.51** |
| TN | 0.63*** | 0.52** | 0.62*** | 0.32 | 0.44** | 0.45** | 0.57*** | -0.05 | -0.13 | -0.26 | -0.49** |
| C:N | -0.09 | -0.09 | -0.21 | -0.23 | -0.07 | -0.24 | -0.25 | 0.11 | 0.31 | -0.17 | 0.01 |
| DOC | 0.43** | 0.32 | 0.34 | 0.18 | 0.36* | 0.37* | 0.50** | -0.11 | -0.08 | -0.07 | -0.25 |
| DN | 0.16 | 0.04 | 0.25 | 0.14 | 0.12 | 0.02 | 0.18 | -0.14 | -0.12 | -0.21 | -0.08 |
| DOC:DN | 0.43* | 0.46** | 0.15 | 0.23 | 0.24 | 0.51** | 0.56*** | 0.12 | -0.08 | 0.07 | -0.24 |
| MBC | 0.52** | 0.34* | 0.48** | 0.25 | 0.55*** | 0.23 | 0.29 | -0.29 | -0.04 | -0.30 | -0.50** |
| NO3--N | 0.59*** | 0.47** | 0.42* | 0.48** | 0.27 | 0.34 | 0.51** | -0.06 | -0.29 | -0.21 | -0.43** |
| NH4+-N | 0.04 | -0.21 | -0.07 | -0.02 | -0.04 | -0.15 | -0.19 | -0.01 | -0.06 | -0.19 | -0.12 |
| pH | 0.09 | 0.27 | 0.07 | 0.03 | 0.18 | 0.29 | 0.41* | -0.04 | 0.01 | 0.19 | 0.05 |
| Clay | 0.08 | 0.01 | 0.10 | 0.02 | -0.23 | -0.01 | 0.09 | 0.22 | -0.11 | -0.03 | -0.01 |
| Leaf C:N | -0.04 | -0.05 | 0.23 | -0.38* | 0.07 | -0.25 | -0.20 | 0.03 | 0.45** | -0.13 | -0.02 |
| Leaf lignin:N | 0.10 | 0.20 | -0.32 | 0.48** | -0.09 | 0.43** | 0.07 | 0.06 | -0.50** | 0.35* | -0.06 |
| CQI1 | -0.52** | -0.38* | -0.53*** | -0.15 | -0.36* | 0.39* | 0.00 | 0.04 | -0.14 | ||
| CQI2 | -0.90*** | -0.76*** | -0.58*** | -0.38* | -0.63*** | -0.29 | -0.22 | 0.00 | -0.04 |
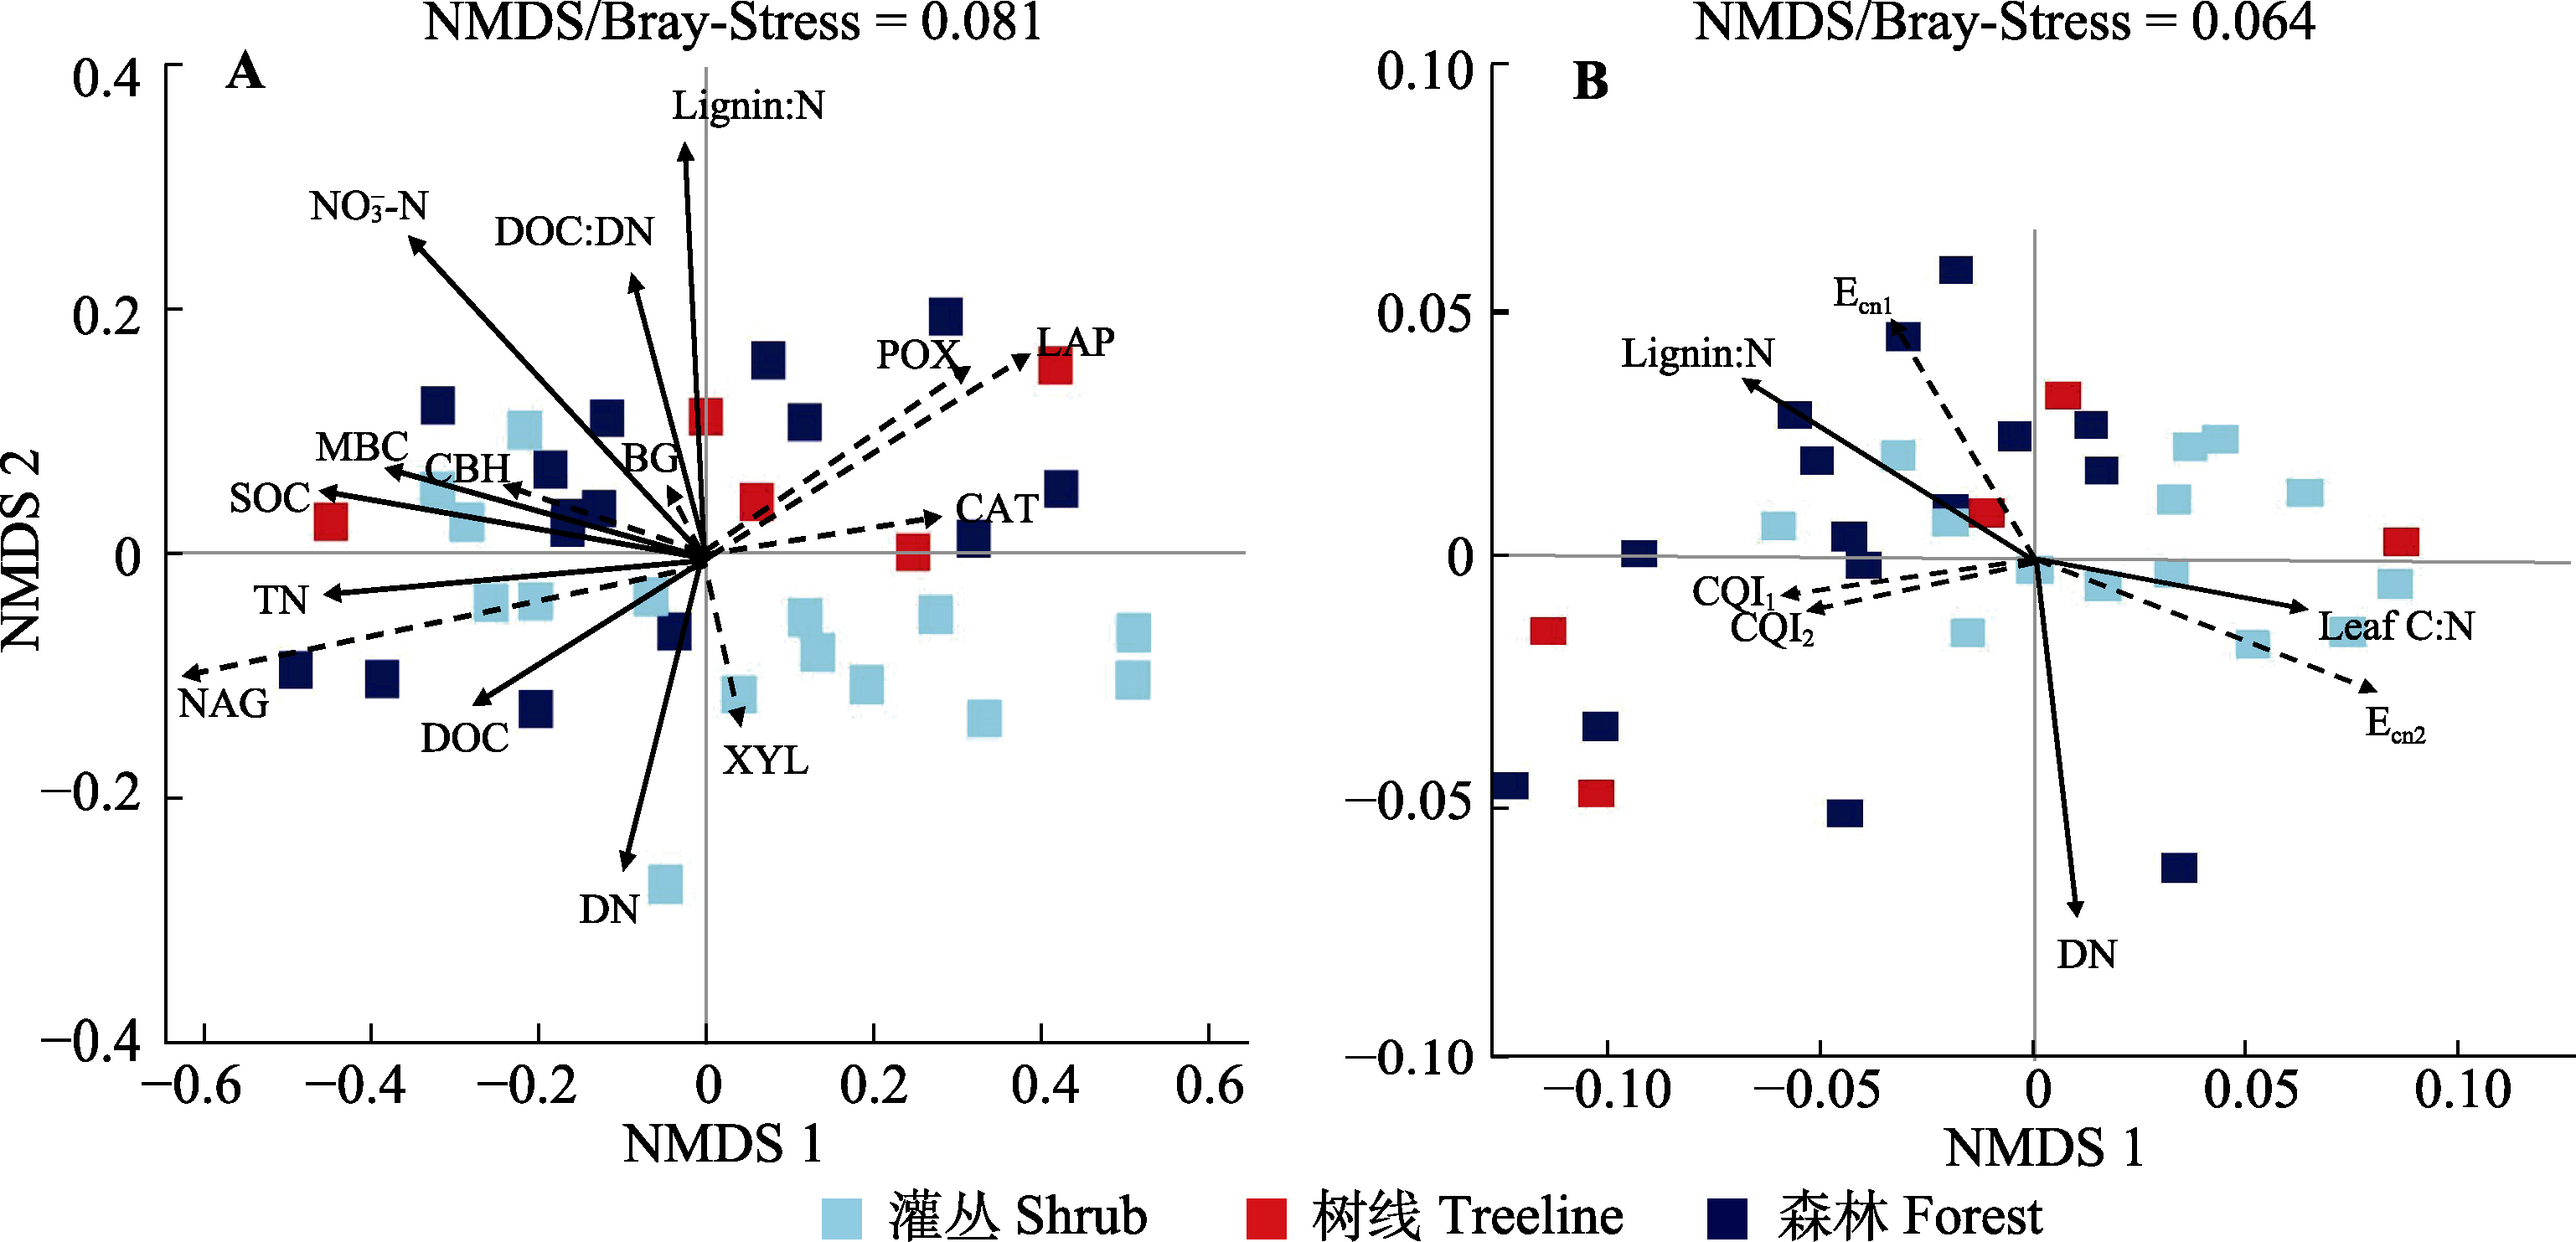
图5 贡嘎山树线过渡带土壤胞外酶活性(A)及其化学计量比(B)的非度量多维尺度(NMDS)分析。应力函数可以检验NMDS分析结果的优劣, 通常认为stress < 0.2时可用NMDS的二维点图表示, 其图形有一定的解释意义; 当stress < 0.1时, 可认为是一个好的排序。图中仅显示有显著影响的因素。BG, β-葡萄糖苷酶; CAT, 过氧化氢酶; CBH, 纤维素二糖水解酶; DN, 土壤可溶性氮含量; DOC, 土壤可溶性有机碳含量; LAP, 亮氨酸氨基肽酶; Leaf C:N, 优势树种叶片碳氮比; Lignin:N, 叶片木质素比氮; MBC, 微生物生物量碳含量; NAG, N-乙酰氨基葡萄糖苷酶; NO3--N, 硝态氮含量; POX, 多酚氧化酶; SOC, 土壤有机碳含量; TN, 全氮含量; XYL, 木聚糖水解酶。Ecn1、Ecn2表示微生物碳、氮酶活性计量比; CQI1、CQI2表示碳质量指数。
Fig. 5 Bray-Curtis-based non-metric multidimensional scaling (NMDS) of the soil enzyme activities (A) and enzyme stoichiometry (B) in the treeline ecotone in Gongga Mountain. The stress function can test the merit of NMDS analysis results. It is generally considered that stress < 0.2 can be represented by a two-dimensional point diagram of NMDS, and its graph has some interpretative significance; when stress < 0.1, it can be considered a good ranking. Only significant factors (p < 0.05) were showed in the figure. BG, β-1,4-glucosidase; CAT, catalase; CBH, cellobiohydrolase; DN, soil dissolved nitrogen content; DOC, soil dissolved organic carbon content; LAP, leucine aminopeptidase; Leaf C:N, carbon to nitrogen ratio of leaves of dominant species; Lignin:N, leaf lignin to nitrogen ratio; MBC, microbial biomass carbon content; NAG, β-N-acetyl glucosaminidase; NO3--N, nitrate nitrogen content; POX, phenol oxidase; SOC, soil organic carbon content; TN, total nitrogen content; XYL, xylosidase. Ecn1, Ecn2 indicate microbial carbon and nitrogen enzyme activity stoichiometry ratios; CQI1, CQI2 indicate carbon quality index.
| [1] |
Adair EC, Parton WJ, del Grosso SJ, Silver WL, Harmon ME, Hall SA, Burke IC, Hart SC (2008). Simple three-pool model accurately describes patterns of long-term litter decomposition in diverse climates. Global Change Biology, 14, 2636-2660.
DOI URL |
| [2] | Allison SD, Gartner TB, Holland K, Weintraub M, Sinsabaugh RL (2007). Soil enzymes: linking proteomics and ecological processes//Hurst CJ, Crawford RL, Garland JL, Lispon DA, Mills AL, Stetzenbach LD. Manual of Environmental Microbiology. 3rd ed. American Society of Microbiology Press, Washington D.C. 704-711. |
| [3] |
Banerjee S, Bora S, Thrall PH, Richardson AE (2016). Soil C and N as causal factors of spatial variation in extracellular enzyme activity across grassland-woodland ecotones. Applied Soil Ecology, 105, 1-8.
DOI URL |
| [4] |
Bhardwaj N, Kumar B, Verma P (2019). A detailed overview of xylanases: an emerging biomolecule for current and future prospective. Bioresources and Bioprocessing, 6, 40. DOI: 10.1186/s40643-019-0276-2.
DOI URL |
| [5] |
Bloom AJ, Chapin III FS, Mooney HA (1985). Resource limitation in plants-An economic analogy. Annual Review of Ecology and Systematics, 16, 363-392.
DOI URL |
| [6] | Bowles TM, Acosta-Martínez V, Calderón F, Jackson LE (2014). Soil enzyme activities, microbial communities, and carbon and nitrogen availability in organic agroecosystems across an intensively-managed agricultural landscape. Soil Biology & Biochemistry, 68, 252-262. |
| [7] |
Caldwell BA (2005). Enzyme activities as a component of soil biodiversity: a review. Pedobiologia, 49, 637-644.
DOI URL |
| [8] | Carreiro MM, Sinsabaugh RL, Repert DA, Parkhurst DF (2000). Microbial enzyme shifts explain litter decay responses to simulated nitrogen deposition. Ecology, 81, 2359-2365. |
| [9] |
Crim PM, Cumming JR (2020). Extracellular soil enzyme activities in high-elevation mixed red spruce forests in central Appalachia, USA. Forests, 11, 468. DOI: 10.3390/ f11040468.
DOI URL |
| [10] |
Cui YX, Fang LC, Guo XB, Wang X, Zhang YJ, Li PF, Zhang XC (2018). Ecoenzymatic stoichiometry and microbial nutrient limitation in rhizosphere soil in the arid area of the northern Loess Plateau, China. Soil Biology & Biochemistry, 116, 11-21.
DOI URL |
| [11] |
German DP, Weintraub MN, Grandy AS, Lauber CL, Rinkes ZL, Allison SD (2011). Optimization of hydrolytic and oxidative enzyme methods for ecosystem studies. Soil Biology & Biochemistry, 43, 1387-1397.
DOI URL |
| [12] |
Hall SJ, Huang W, Timokhin VI, Hammel KE (2020). Lignin lags, leads, or limits the decomposition of litter and soil organic carbon. Ecology, 101, e03113. DOI: 10.1002/ecy. 3113.
DOI |
| [13] |
He QQ, Wu YH, Bing HJ, Zhou J, Wang JP (2020). Vegetation type rather than climate modulates the variation in soil enzyme activities and stoichiometry in subalpine forests in the eastern Tibetan Plateau. Geoderma, 374, 114424. DOI: 10.1016/j.geoderma.2020.114424.
DOI URL |
| [14] |
Hernández DL, Hobbie SE (2010). The effects of substrate composition, quantity, and diversity on microbial activity. Plant and Soil, 335, 397-411.
DOI URL |
| [15] |
Hill BH, Elonen CM, Herlihy AT, Jicha TM, Serenbetz G (2018). Microbial ecoenzyme stoichiometry, nutrient limitation, and organic matter decomposition in wetlands of the conterminous United States. Wetlands Ecology and Management, 26, 425-439.
DOI URL |
| [16] | Jiang J, Song MH (2010). Review of the roles of plants and soil microorganisms in regulating ecosystem nutrient cycling. Chinese Journal of Plant Ecology, 34, 979-988. |
|
[ 蒋婧, 宋明华 (2010). 植物与土壤微生物在调控生态系统养分循环中的作用. 植物生态学报, 34, 979-988.]
DOI |
|
| [17] |
Kivlin SN, Treseder KK (2014). Soil extracellular enzyme activities correspond with abiotic factors more than fungal community composition. Biogeochemistry, 117, 23-37.
DOI URL |
| [18] |
LeBauer DS, Treseder KK (2008). Nitrogen limitation of net primary productivity in terrestrial ecosystems is globally distributed. Ecology, 89, 371-379.
PMID |
| [19] |
Liu JB, Chen J, Chen GS, Guo JF, Li YQ (2020). Enzyme stoichiometry indicates the variation of microbial nutrient requirements at different soil depths in subtropical forests. PLOS ONE, 15, e0220599. DOI: 10.1371/journal.pone.0220599.
DOI URL |
| [20] |
Min K, Freeman C, Kang H, Choi SU (2015). The regulation by phenolic compounds of soil organic matter dynamics under a changing environment. BioMed Research International, 2015, 825098. DOI: 10.1155/2015/825098.
DOI |
| [21] |
Müller M, Oelmann Y, Schickhoff U, Böhner J, Scholten T (2017). Himalayan treeline soil and foliar C:N:P stoichiometry indicate nutrient shortage with elevation. Geoderma, 291, 21-32.
DOI URL |
| [22] |
Okubo A, Matsusaka M, Sugiyama S (2016). Impacts of root symbiotic associations on interspecific variation in sugar exudation rates and rhizosphere microbial communities: a comparison among four plant families. Plant and Soil, 399, 345-356.
DOI URL |
| [23] |
Peng XQ, Wang W (2016). Stoichiometry of soil extracellular enzyme activity along a climatic transect in temperate grasslands of northern China. Soil Biology & Biochemistry, 98, 74-84.
DOI URL |
| [24] | Ran F, Liang YM, Yang Y, Yang Y, Wang GX (2014). Spatial-temporal dynamics of an Abies fabri population near the alpine treeline in the Yajiageng area of Gongga Mountain, China. Acta Ecologica Sinica, 34, 6872-6878. |
| [ 冉飞, 梁一鸣, 杨燕, 杨阳, 王根绪 (2014). 贡嘎山雅家埂峨眉冷杉林线种群的时空动态. 生态学报, 34, 6872-6878.] | |
| [25] |
Rumpel C, Kögel-Knabner I (2011). Deep soil organic matter -A key but poorly understood component of terrestrial C cycle. Plant and Soil, 338, 143-158.
DOI URL |
| [26] |
Sagar R, Singh JS (2006). Tree density, basal area and species diversity in a disturbed dry tropical forest of northern India: implications for conservation. Environmental Conservation, 33, 256-262.
DOI URL |
| [27] |
Saiya-Cork KR, Sinsabaugh RL, Zak DR (2002). The effects of long term nitrogen deposition on extracellular enzyme activity in an Acer saccharum forest soil. Soil Biology & Biochemistry, 34, 1309-1315.
DOI URL |
| [28] | Shi XJ, Pan JJ, Chen JY, Yang ZQ, Zhang LM, Sun B, Li ZP (2009). Effects of different types of litters on soil organic carbon mineralization. Environmental Science, 30, 1832-1837. |
| [ 史学军, 潘剑君, 陈锦盈, 杨志强, 张黎明, 孙波, 李忠佩 (2009). 不同类型凋落物对土壤有机碳矿化的影响. 环境科学, 30, 1832-1837.] | |
| [29] |
Sigdel SR, Liang E, Wang Y, Dawadi B, Camarero JJ (2020). Tree-to-tree interactions slow down Himalayan treeline shifts as inferred from tree spatial patterns. Journal of Biogeography, 47, 1816-1826.
DOI URL |
| [30] |
Sinsabaugh RL, Follstad Shah JJ (2012). Ecoenzymatic stoichiometry and ecological theory. Annual Review of Ecology, Evolution, and Systematics, 43, 313-343.
DOI URL |
| [31] |
Sinsabaugh RL, Hill BH, Follstad Shah JJ (2009). Ecoenzymatic stoichiometry of microbial organic nutrient acquisition in soil and sediment. Nature, 462, 795-798.
DOI URL |
| [32] |
Sinsabaugh RL, Lauber CL, Weintraub MN, Ahmed B, Allison SD, Crenshaw C, Contosta AR, Cusack D, Frey S, Gallo ME, Gartner TB, Hobbie SE, Holland K, Keeler BL, Powers JS, et al. (2008). Stoichiometry of soil enzyme activity at global scale. Ecology Letters, 11, 1252-1264.
DOI PMID |
| [33] |
Tedersoo L, Bahram M (2019). Mycorrhizal types differ in ecophysiology and alter plant nutrition and soil processes. Biological Reviews of the Cambridge Philosophical Society, 94, 1857-1880.
DOI PMID |
| [34] |
Thevenot M, Dignac MF, Rumpel C (2010). Fate of lignins in soils: a review. Soil Biology & Biochemistry, 42, 1200-1211.
DOI URL |
| [35] | Wang B, Xue S, Liu GB, Zhang GH, Li G, Ren ZP (2012). Changes in soil nutrient and enzyme activities under different vegetations in the Loess Plateau area, Northwest China. Catena, 92, 186-195. |
| [36] |
Xu ZW, Yu GR, Zhang XY, He NP, Wang QF, Wang SZ, Wang RL, Zhao N, Jia YL, Wang CY (2017). Soil enzyme activity and stoichiometry in forest ecosystems along the North-South Transect in eastern China (NSTEC). Soil Biology & Biochemistry, 104, 152-163.
DOI URL |
| [37] |
Yin R, Deng H, Wang HL, Zhang B (2014). Vegetation type affects soil enzyme activities and microbial functional diversity following re-vegetation of a severely eroded red soil in sub-tropical China. Catena, 115, 96-103.
DOI URL |
| [38] |
Zeglin LH, Kluber LA, Myrold DD (2013). The importance of amino sugar turnover to C and N cycling in organic horizons of old-growth Douglas-fir forest soils colonized by ectomycorrhizal mats. Biogeochemistry, 112, 679-693.
DOI URL |
| [39] |
Zhang Y, Li C, Wang ML (2019). Linkages of C:N:P stoichiometry between soil and leaf and their response to climatic factors along altitudinal gradients. Journal of Soils and Sediments, 19, 1820-1829.
DOI |
| [40] |
Zheng HF, Liu Y, Zhang J, Chen YM, Yang L, Li HJ, Wang LF (2018). Factors influencing soil enzyme activity in China’s forest ecosystems. Plant Ecology, 219, 31-44.
DOI URL |
| [41] |
Zhou LH, Liu SS, Shen HH, Zhao MY, Xu LC, Xing AJ, Fang JY (2020). Soil extracellular enzyme activity and stoichiometry in Chinaʼs forests. Functional Ecology, 34, 1461-1471.
DOI URL |
| [42] |
Zuo YP, Li JP, Zeng H, Wang W (2018). Vertical pattern and its driving factors in soil extracellular enzyme activity and stoichiometry along mountain grassland belts. Biogeochemistry, 141, 23-39.
DOI URL |
| [1] | 邓文婕, 吴华征, 李添翔, 周丽娜, 胡仁勇, 金鑫杰, 张永普, 张永华, 刘金亮. 洞头国家级海洋公园主要植被类型及其特征[J]. 植物生态学报, 2024, 48(2): 254-268. |
| [2] | 朱玉英, 张华敏, 丁明军, 余紫萍. 青藏高原植被绿度变化及其对干湿变化的响应[J]. 植物生态学报, 2023, 47(1): 51-64. |
| [3] | 王国宏, 郭柯, 谢宗强, 唐志尧, 蒋延玲, 方精云. 《中国植被志》研编规范的若干说明、补充与修订[J]. 植物生态学报, 2022, 46(3): 368-372. |
| [4] | 郑周涛, 张扬建. 1982-2018年青藏高原水分利用效率变化及归因分析[J]. 植物生态学报, 2022, 46(12): 1486-1496. |
| [5] | 刘艳方, 王文颖, 索南吉, 周华坤, 毛旭锋, 王世雄, 陈哲. 青海海北植物群落类型与土壤线虫群落相互关系[J]. 植物生态学报, 2022, 46(1): 27-39. |
| [6] | 张欢, 张云玲, 张彦才, 阎平. 新疆奇台荒漠类草地自然保护区主要植物群落及其特征[J]. 植物生态学报, 2021, 45(8): 918-924. |
| [7] | 牟利, 吴林, 刘雪飞, 李小玲, 王涵, 吴浩, 余玉蓉, 杜胜蓝. 鄂西南亚高山不同覆被类型泥炭藓沼泽湿地甲烷排放特征及其环境影响因子[J]. 植物生态学报, 2021, 45(2): 131-143. |
| [8] | 贺露炎, 侯满福, 唐伟, 刘雨婷, 赵俊. 滇东菌子山喀斯特森林的植被类型及其特征[J]. 植物生态学报, 2021, 45(12): 1380-1390. |
| [9] | 周雄, 孙鹏森, 张明芳, 刘世荣. 西南高山亚高山区植被水分利用效率时空特征及其与气候因子的关系[J]. 植物生态学报, 2020, 44(6): 628-641. |
| [10] | 方精云, 郭柯, 王国宏, 唐志尧, 谢宗强, 沈泽昊, 王仁卿, 强胜, 梁存柱, 达良俊, 于丹. 《中国植被志》的植被分类系统、植被类型划分及编排体系[J]. 植物生态学报, 2020, 44(2): 96-110. |
| [11] | 刘珊杉, 周文君, 况露辉, 刘占锋, 宋清海, 刘运通, 张一平, 鲁志云, 沙丽清. 亚热带常绿阔叶林土壤胞外酶活性对碳输入变化及增温的响应[J]. 植物生态学报, 2020, 44(12): 1262-1272. |
| [12] | 徐文轩, 杨维康, 张弛, 汪沐阳. 准噶尔盆地东部卡拉麦里山有蹄类自然保护区主要植物群落及其特征[J]. 植物生态学报, 2016, 40(5): 502-507. |
| [13] | 陈亚梅, 和润莲, 邓长春, 刘洋, 杨万勤, 张健. 川西高山林线交错带凋落物纤维素分解酶活性研究[J]. 植物生态学报, 2014, 38(4): 334-342. |
| [14] | 汪岱华, 王幼芳, 左勤, 李敏, 吴文英, 黄建花, 赵明水. 浙江西天目山主要森林类型的苔藓多样性比较[J]. 植物生态学报, 2012, 36(6): 550-559. |
| [15] | 余振, 孙鹏森, 刘世荣. 中国东部南北样带主要植被类型物候期的变化[J]. 植物生态学报, 2010, 34(3): 316-329. |
| 阅读次数 | ||||||
|
全文 |
|
|||||
|
摘要 |
|
|||||
Copyright © 2026 版权所有 《植物生态学报》编辑部
地址: 北京香山南辛村20号, 邮编: 100093
Tel.: 010-62836134, 62836138; Fax: 010-82599431; E-mail: apes@ibcas.ac.cn, cjpe@ibcas.ac.cn
备案号: 京ICP备16067583号-19
![]()