


湿地生态系统具有调节气候、均化洪水、涵养水源、维持生物多样性等重要的生态系统服务, 尤其在碳固定方面具有重大意义, 其单位面积碳密度显著高于森林、灌丛、农田等生态系统(Pearse et al., 2018; Yang et al., 2022)。河流湿地是将碳组分从陆地运输到海洋的重要路径, 而湖泊是碳元素汇集地和大气CO2的主要释放源之一, 二者构成了地表碳循环的重要组成部分。包括河流和湖泊等在内的内陆水域可能是水和溶解物质的巨大运输通道, 在生物地球化学循环中扮演着重要角色(Raymond et al., 2013)。从1750到2013年, 全球河流碳的运输量从0.75 Pg·a-1增至0.90-0.95 Pg·a-1, 增加了约20% (Regnier et al., 2013)。近年来的研究发现, 不同纬度与类型的河流碳通量和碳循环的影响因素不同, 主要由当地水循环过程以及水-气交换过程决定(段巍岩和黄昌, 2021)。河流湿地是黄河流域内陕西区域复合生态系统的重要组成部分, 在黄河流域生态保护和高质量发展成为重大国家战略的背景下, 湿地生态系统合理布局、管理和植被配置等直接关系碳增汇和碳中和(方精云, 2021)。黄河流域是我国重要的生态屏障, 是连接三大阶梯重要的生态廊道, 处于“一带一路”陆路的重要地带, 也是我国七大重点生态功能区之一。新中国成立以来, 人类活动导致黄河流域陆续出现了过度放牧、水土流失、水质污染等一系列生态问题(董盼盼等, 2020), 对包括碳在内的物质循环影响巨大(Syvitski et al., 2022)。因此, 开展陕西黄河流域湿地碳汇核算研究具有重要的应用价值, 并极具紧迫性。碳汇核算是研究湿地固碳能力以及湿地在全球变化中的地位和作用的基础, 目前国内外有关碳汇核算多集中于森林和草地两大生态系统(贺少轩等, 2015; 辛晓平等, 2020; 李妙宇等, 2021), 对湿地生态系统则主要是估算沼泽、湖泊、滨海等自然湿地中泥炭或土壤的固碳能力(Xiao et al., 2019; Shen et al., 2021; Yang et al., 2022), 其中对黄河流域的研究主要聚焦于上游的青藏高原和下游的三角洲, 对中游地区关注较少。
黄河流域不同区域的湿地碳储量已有一定的研究积累(杨文焕等, 2018; 杨荣等, 2020; 林春英等, 2021; 刘京涛等, 2021)。湿地碳库主要包括植被碳库、土壤碳库和存在于水体中的溶解性有机碳。湿地植被碳库是由光合作用的碳吸收、呼吸作用和凋落物分解的碳释放间的平衡决定的; 土壤碳库是由植物分解、根际沉积的碳输入和分解过程中的碳输出间的平衡决定; 水体中的碳含量则是由水体内源输入和边界交互作用共同决定的(刘亚男等, 2019)。植被生物量是反映湿地固碳能力的重要指标, 我国9.7 × 10⁴ km2的草本沼泽湿地上承载的地上生物量碳为(22.2 ± 2.2) Tg (Shen et al., 2021)。此外, 土壤碳库作为陆地生态系统碳库的主体, 在调节气候变化方面具有双重作用。在区域生态系统中, 湿地土壤有机碳的固存和变化是一个关键的生态过程和热点研究方向, 其过程及影响机制受到关注(Yao & Kong, 2018; 刘兴华等, 2019)。有研究表明, 如果基于自然气候的解决方案去缓解气候变化, 陆地生态系统土壤碳库的保护和重建可以贡献1/4的潜力, 对湿地来说, 湿地土壤碳库的保护和重建占湿地生态系统可贡献潜力的72%, 远远高于农田和草地的47%和森林的9% (Bossio et al., 2020)。湿地不仅与大气和陆地生态系统有着强烈的碳交换, 而且其内部也存在着活跃的碳产生、分解和沉积。而目前湿地碳储量、固碳潜力以及气候变化和人为活动对湿地碳通量的互作机制等是全球碳循环研究的薄弱环节(王跃思和王迎红, 2008), 需要借助地面观测以及遥感、地理信息技术获取流域陆地生态系统碳储量相关信息, 在典型小流域开展多界面、多过程等长期同步观测和系统研究, 建立统一的观测统计方法和实验方法来研究土壤有机碳储量和动态变化(裴会敏等, 2012; 周苗等, 2018)。
我国正在构建以国家公园为主体的自然保护地体系, 未来自然保护地规模和管理将达到世界先进水平, 碳中和和黄河流域的高质量发展均已成为国家战略, 黄河湿地的碳储量研究亟待深入。陕西黄河湿地是我国黄河中游地区面积最大的湿地之一, 也是陕西省面积最大的河流湿地, 其重要的地理区位和生态价值一直受到国内外科学界的广泛关注。本研究采用湿地生态学、恢复生态学、系统学和数理统计等研究方法, 同时结合野外调查、查阅资料、数据分析等手段, 通过构建陕西省黄河省级自然保护区自然湿地碳储量核算体系; 开展湿地不同植物群落下的碳储量核算, 将有助于全面认识保护区湿地生态系统的固碳作用, 研究成果能服务黄河流域湿地碳汇核算和碳交易需求。
1 材料和方法
1.1 研究样点
研究区陕西黄河湿地省级自然保护区位于关中平原的东端, 北起韩城禹门口(龙门), 南到潼关港口, 东以黄河河道治导控制线的中心线为界与山西省相接, 西界北段大致以黄河老岸为界, 南段以第二道防洪堤为界。包括韩城、合阳、大荔、华阴和潼关的黄河河道、河漫滩、洪泛平原和黄河、渭河、洛河的交汇地区。主要保护对象为湿地生态系统的自然环境和依附湿地生存的相关生物。研究区属暖温带大陆性半湿润季风气候, 四季分明, 雨热同季。春季干燥, 回暖早、升温快; 夏季炎热、日照长; 秋季降温快、多阴雨; 冬季寒冷、多风。年平均气温13.5 ℃, 年降水量529-574 mm, 降水多集中在7-9月, 占全年降水量的51.6%。年平均风速2.5 m·s-1, 无霜期210天。研究区土壤类型有盐土、新积土和沼泽土, 植被类型主要有灌丛沼泽、草丛沼泽、浅水湿地等, 高度差异明显。
1.2 实验设计与数据处理
1.2.1 植物部分采样和测定
选取陕西黄河湿地省级自然保护区的大荔县段、合阳县段和韩城市段作为研究区, 共确定24个30 m × 30 m典型植被大样地作为采样区域, 其中包括大荔县8个, 合阳县7个, 韩城市9个(图1), 用奥维地图软件确定每处样地的经纬度以记录其地理位置。野外采样时间为2021年7月20日到2021年8月15日。在确定样地时, 尽可能保证所选样地为典型的湿地植被群落类型(低草植被、矮灌丛植被和高草植被), 每种类型6个重复样地, 并保证每个类型样地选择一条由水向陆的采样带且未有明显地表积水以防样品难以采集。光滩仅进行土壤采样。在每一个典型植被区域内随机选择3个1 m × 1 m的区域作为样方, 记录样方内植物种的生物生态学特性(种类、高度等), 用收获法齐地面剪下并剔除凋落物后立即称鲜质量, 带回实验室后在65 ℃下烘干48 h并称其干质量(精确至0.01 g), 之后将烘干后的植物样本研磨过筛, 采用元素分析仪(Vario Max CN, Elementary, Hanau, Germany)测定所有植物样本的全碳含量。
图1
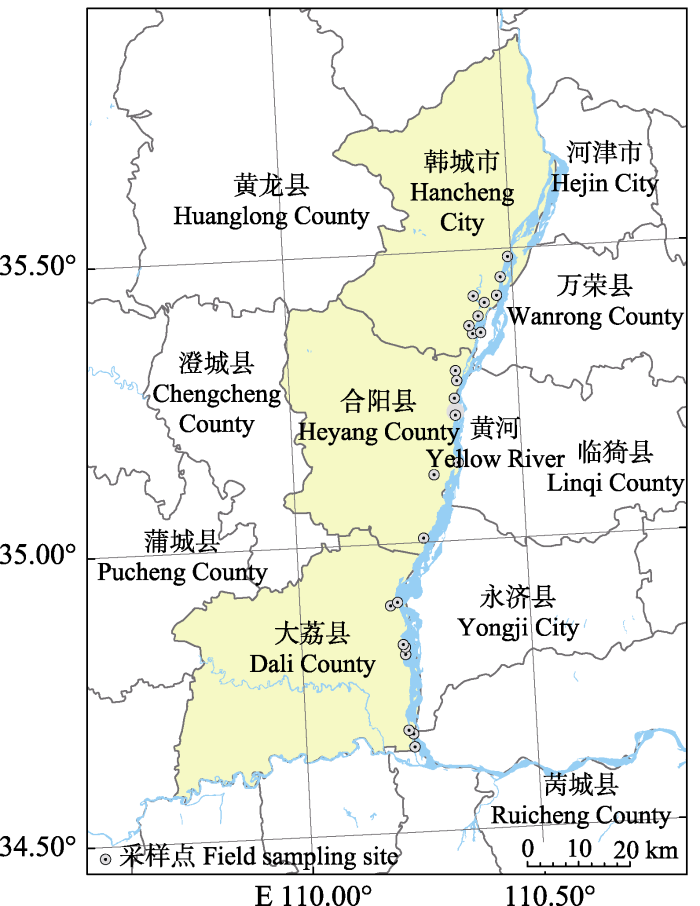
图1
陕西黄河湿地省级自然保护区地理区位及采样点位分布。
Fig. 1
Geographical location and distribution of sampling sites in Shaanxi Yellow River Wetland Provincial Nature Reserve.
1.2.2 土壤部分采样和测定
在光滩、低草植被、矮灌丛植被和高草植被的样方内, 去除枯枝落叶层后, 用5 cm内径的土钻于0-25、25-50 cm分层采集样品, 3次重复。每个样品随机取3钻混合, 以减少土壤异质性带来的实验误差。实验室风干后, 过2 mm筛备用。将采集的不同深度土层样本分别装入不同的铝盒, 并做好土层标记。同时, 用环刀法取每层土样, 带回实验室测定土壤密度。土壤样品室内风干后, 粉碎, 过0.149 mm筛, 采用元素分析仪测定所有土壤样本的全碳含量。
1.2.3 遥感影像数据获取
基于Landsat遥感数据, 本研究从地理空间数据云官网(
表1 陕西黄河湿地省级自然保护区不同土地利用类型基本特征
Table 1
| 土地利用类型分类 Classification of land use type | 土地利用类型 Land use type | 面积 Area (hm2) | 占保护区面积比例 Area proportion of the reserve (%) |
|---|---|---|---|
| 自然生态系统类型 Natural ecosystem type | 光滩 Beach | 2 916.70 | 5.32 |
| 沼泽湿地 Marsh | 8 383.48 | 15.29 | |
| 矮灌丛 Short shrubland | 1 786.34 | 3.26 | |
| 其他土地利用类型 Other land use type | 农田 Farmland | 8 495.16 | 15.49 |
| 坑塘水面 Pond water surface | 15 835.82 | 28.87 | |
| 河流 River | 15 138.42 | 27.60 | |
| 农村宅基地 Rural homestead | 2 289.30 | 4.17 |
1.3 模型方法与构建
1.3.1 植物碳库计算方法
式中, C植物为植物生物量碳库, Ci为第i个样方地上生物量碳库, Sq是样方框面积(m2), S是样地面积(m2), n表示该样地内调查的样方数。
1.3.2 土壤碳库计算方法
式中, C土壤为样地中土壤碳库(kg), Ci土壤为第i个样方土壤碳库(kg), 计算如下:
式中,
环刀取样后将土壤样品进行称质量、烘烤, 最后按以下公式计算土壤密度(ρ, g·cm-3):
式中, m为环刀内湿土质量(g), W为环刀内土壤质量含水率(%), V为环刀体积(cm3)。
1.3.3 数据分析
本研究所有数据的统计分析采用Excel 2003与SPSS 19.0软件进行原始数据的正态性检验和方差分析, 之后进行独立样本的t检验。
2 结果和分析
2.1 陕西黄河湿地省级自然保护区不同植被的空间分布
野外现场调查得知, 研究区的高草植被是以芦苇(Phragmites australis)、香蒲(Typha orientalis)为建群种的植物群落, 平均高度为2.0 m左右, 盖度为90%, 群落内几乎不生长其他植物。低草植被群落平均高度为0.5 m左右, 建群种为碱蓬(Suaeda glauca)、盐地碱蓬(Suaeda salsa)、白茅(Imperata cylindrica)、狗牙根(Cynodon dactylon)、狗尾草(Setaria viridis)、碎米莎草(Cyperus iria)等, 盖度为80%。矮灌丛植被以杠柳(Periploca sepium)、假苇拂子茅(Calamagrostis pseudophragmites)、荻(Miscanthus sacchariflorus)等为建群种, 群落平均高度1.5 m左右, 盖度为75%, 伴生植物有酸模叶蓼(Persicaria lapathifolia)、风毛菊(Saussurea japonica)、阿尔泰狗娃花(Aster altaicus)、马蔺(Iris lactea)、糙叶黄耆(Astragalus scaberrimus)、纤毛鹅观草(Elymus ciliaris)等。结合2021年的TM和DEM等遥感数据, 陕西黄河湿地省级自然保护区的光滩、低草植被、矮灌丛植被、高草植被的面积分别为2 916.70、4 196.63、1 786.34、4 186.85 hm2 (图2)。
图2
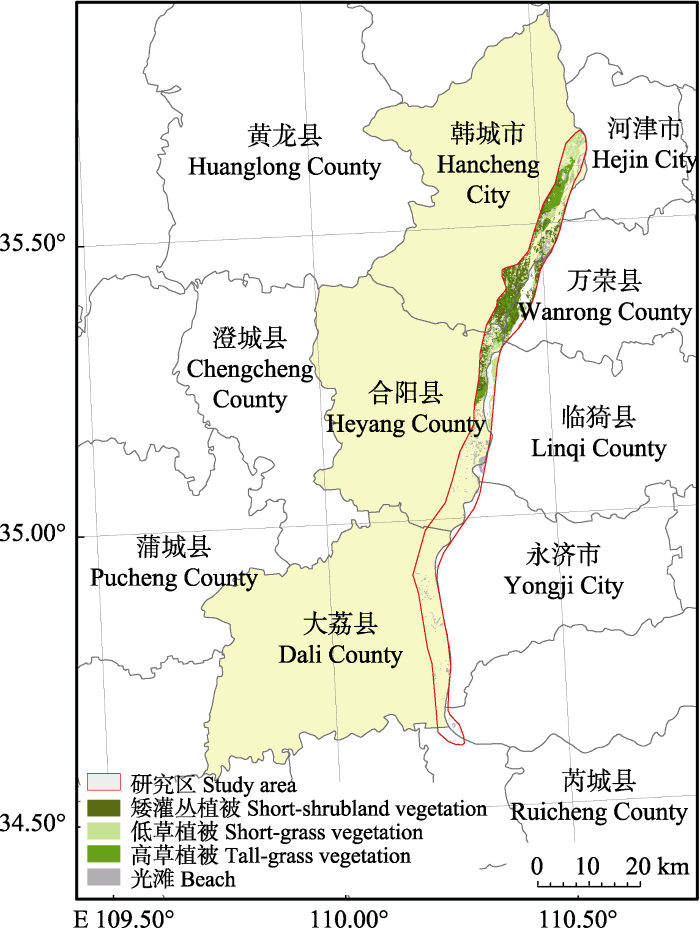
图2
陕西黄河湿地省级自然保护区及周边典型湿地植被类型分布。
Fig. 2
Distribution of vegetation types in Shaanxi Yellow River Wetland Provincial Nature Reserve and surrounding typical wetlands.
2.2 陕西黄河湿地省级自然保护区地上植被碳储量估算
陕西黄河湿地省级自然保护区不同植被类型的固碳能力不同, 高草植被的碳密度显著高于低草植被和矮灌丛植被, 其碳密度分别为(496.73 ± 44.33)、(23.45 ± 2.50)和(138.38 ± 17.98) g·m-2 (图3)。陕西黄河湿地省级自然保护区不同植被类型的地上生物量差异显著(表2)。高草植被的平均生物量达到了1 213.18 g·m-2, 而低草植被和矮灌丛植被的平均生物量为(62.80 ± 6.73)和(340.05 ± 44.96) g·m-2, 均显著低于高草植被的群落生物量。结合遥感识别的分区面积数据, 研究区低草植被、矮灌丛植被、高草植被的地上植被碳储量分别为983.97、2 471.91和20 797.41 t。
图3
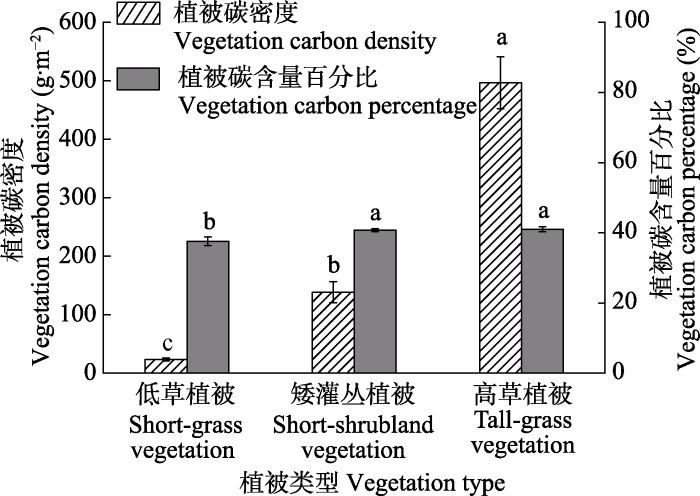
图3
陕西黄河湿地省级自然保护区不同植被类型的碳密度和碳含量百分比(平均值±标准误)。
不同小写字母表示植被类型间差异显著(p < 0.05)。
Fig. 3
Density and proportion of carbon content in different vegetation types in Shaanxi Yellow River Wetland Provincial Nature Reserve (mean ± SE).
Different lowercase letters indicate significant differences among vegetation types (p < 0.05).
表2 陕西黄河湿地省级自然保护区不同植被类型生物量
Table 2
| 湿地植被类型 Wetland vegetation type | 生物量干质量 Biomass dry mass (g·m-2) | 标准误 Standard error (g·m-2) |
|---|---|---|
| 低草植被 Short-grass vegetation | 62.80c | 6.73 |
| 矮灌丛植被 Short-shrubland vegetation | 340.05b | 44.96 |
| 高草植被 Tall-grass vegetation | 1 213.18a | 113.21 |
不同小写字母表示在0.05水平上具有显著差异。
Different lowercase letters mean significant difference at 0.05 level.
2.3 陕西黄河湿地省级自然保护区土壤碳储量估算
如图4所示, 陕西黄河湿地省级自然保护区0-50 cm土壤的碳密度为7.15-11.98 kg·m-2, 高草植被区的土壤碳密度显著高于光滩、低草植被和矮灌丛植被, 而光滩、低草植被和矮灌丛植被的土壤碳密度之间无显著差异。高草植被区的0-25 cm土壤碳密度显著高于光滩、低草植被和矮灌丛植被, 而低草植被和矮灌丛植被之间的土壤碳密度无显著差异, 但均显著高于光滩的土壤碳密度。研究区25-50 cm土壤的碳密度为3.47-5.59 kg·m-2, 高草植被区的土壤碳密度显著高于光滩、低草植被和矮灌丛植被, 而光滩、低草植被和矮灌丛植被之间的土壤碳密度无显著差异。结合遥感统计的相关面积数据可知, 光滩0-50 cm土壤的碳储量为208 622.80 t, 低草植被和矮灌丛植被分别是340 460.00 t和145 254.45 t, 高草区0-50 cm土壤的碳储量为501 630.69 t。
图4
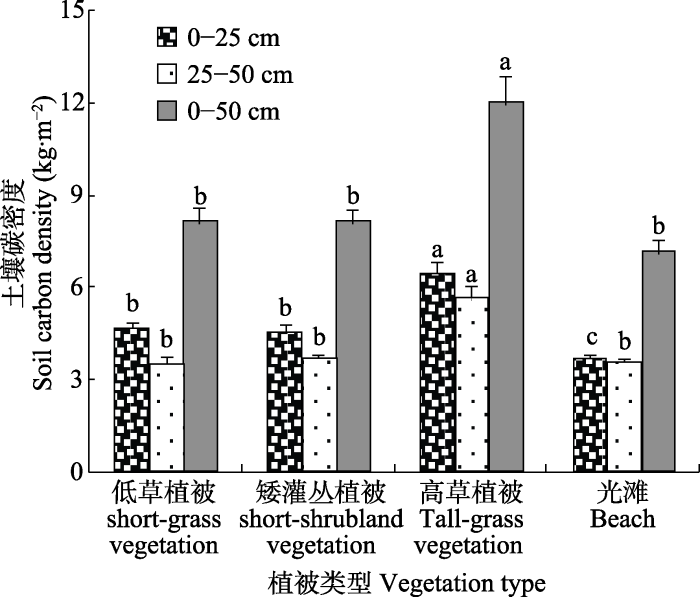
图4
陕西黄河湿地省级自然保护区不同植被类型下的土壤碳密度(平均值±标准误)。
不同小写字母表示植被类型间差异显著(p < 0.05)。
Fig. 4
Soil carbon density under different vegetation types in Shaanxi Yellow River Wetland Provincial Nature Reserve (mean ± SE).
Different lowercase letters indicate significant differences among vegetation types (p < 0.05).
结合植被部分的碳储量计算可知, 研究区低草植被区、矮灌丛植被区、高草植被区的地上植被和0-50 cm土壤的总碳储量分别为3.41 × 10⁵、1.48 × 10⁵和5.22 × 10⁵ t。光滩区因没有植被, 碳储量计算仅包含土壤部分, 总计为2.09 × 10⁵ t。总体上, 陕西黄河湿地省级自然保护区典型植被区的碳储量为1.22 × 10⁶ t。
3 讨论
3.1 湿地植被碳储量估算
湿地碳储量是研究气候变化和人类耦合作用下的生态系统碳循环、碳中和的重要基础(Fang et al., 2018; 方精云, 2021; Syvitski et al., 2022)。湿地通过占据陆地表面面积的5%-8%, 储存了20%-30%的土壤碳(Lal, 2008; Mitsch et al., 2013)。我国湿地生态系统的碳储量为16.9 Pg, 每年约有120 Tg的碳汇, 其中河流湿地的碳汇速率为28.0 Tg·a−1 (Xiao et al., 2019)。从宏观尺度来说, 湿地生态系统碳储量反映的是植被和土壤碳输入速率、分解速率的长期平衡, 要同时考虑影响输入和分解两方面的因素, 包括植被和土壤结构、气候(气温、降水等)和土地利用等, 通过不同的过程或机制影响湿地生态系统碳储量状况和碳分布格局(刘亚男等, 2019), 而本研究对象为局域尺度的自然湿地生态系统, 无明显气候差异, 故本研究中重点分析不同植被类型下的碳储量分异和变化。陕西黄河湿地省级自然保护区不同植被群落的碳含量占比有所差异(图3), 但主要影响陕西黄河湿地省级自然保护区地上碳储量的是植物群落的生物量(碳密度)。
植物经过光合作用将CO2吸收转化为有机物质, 经微生物的分解和自身腐化最终以固体有机质形式存储于土壤中, 植物种类的差异使得植物群落的碳储量和固碳能力也产生较大差别(宋亮平等, 2016; 常雄凯等, 2018; 王伯炜等, 2019)。在黄河湿地自然保护区基本一致的气候条件下, 从光滩、低草植被、矮灌丛植被到高草植被的植物水分利用、碳水循环、径流大小等的差异造成植被结构和功能的差异(王根绪等, 2021), 导致陕西黄河湿地省级自然保护区不同植被类型的地上生物量差异显著, 影响枯落物分解和根系进入土壤的碳含量, 最终导致不同的群落储碳能力。本研究中高草植被的碳密度(496.73 g·m-2)稍高于全国第二次湿地资源调查的植被碳密度的平均值(410 g·m-2, Xiao et al., 2019), 但低于滨海草本沼泽湿地植被的碳密度(675.4 g·m-2, Shen et al., 2021), 低草区和矮灌丛植被碳密度均低于全国平均值。由于根系采样难度大且精度不高, 故未估测根系的碳储量也会导致植被碳储量估计偏低。此外, 区域空间尺度的湿地碳储量差异主要是气候差异会导致固碳速率明显不同所致。全球尺度上, 热带湿地、温带湿地和北部寒带湿地的固碳速率分别为1.3、0.9和0.2 Mg·hm−2·a−1 (Villa & Bernal, 2018)。我国湿地草本植被碳密度在滨海地区最高, 从亚热带潮湿沼泽区、青藏高原沼泽区、温带干旱和半干旱沼泽区到湿润和半湿润沼泽区依次下降(Shen et al., 2021)。本研究中不同植被区的地上生物量均显著低于滨海湿地的典型区域, 如杭州湾湿地的芦苇、互花米草(Spartina alterniflora)群落的生物量均在4 000 g·m-2左右(张文敏等, 2014)。气候变化和人类活动的耦合作用则会在时间尺度上导致湿地生态系统的固碳速率发生变化(Yang et al., 2022)。
3.2 湿地土壤碳储量估算
对湿地土壤碳储量的研究明显多于对湿地植被的研究, 全球湿地土壤碳储量中位值为330 Pg, 中国为7.6 Pg (Yang et al., 2022), 美国连续大陆湿地的土壤碳储量为11.5 Pg (Nahlik & Fennessy, 2016)。土壤有机碳是地表动植物残体在多种因素综合作用下与土壤颗粒结合的化合物, 其不同组分含量及分布受土地利用方式、土壤质地和气候等共同影响。例如高草植被每年产生较大的生物量, 一方面直接增加了湿地地上部分的固碳量, 另一方面通过根系分泌和凋落物分解间接增加了土壤碳的输入, 导致保护区湿地高草植被区0-50 cm的土壤碳储量显著高于光滩、低草植被和矮灌丛植被。从气候因素来说, 气温和降水在研究区范围内的空间差异性不明显, 对土壤碳储量空间差异的影响较小(张俊华等, 2020), 而更大尺度上, 中国湿地生态系统0-20和0-100 cm深度的土壤碳储量在减少(1980-2010年), 气候变化影响了区域尺度湿地生态系统的水位和面积, 而水位下降和湿地面积减少会引起土壤温度升高、土壤孔隙度和渗透性增强等生态系统特征变化, 从而使得土壤有机质加速分解, 降低碳储量(刘子刚和张坤民, 2005; 周文昌等, 2016; 徐丽等, 2018)。水位变化同时增加了湿地植物分解环境的复杂性和分解产物的多样性, 是湿地植物残体分解的重要驱动因子(Dolinar et al., 2016)。其中质量较低的湿地植物残体由于木质素含量较高, 比质量高的植物光降解更快(Angst et al., 2017)。在群落水平上, 由于物种多样性较高, 会出现多种不同质量的植物残体混合分解的情况, 这时枯落物之间的营养盐、碳化合物和促进或抑制性化合物不断交换, 产生复杂的非加性效应, 影响该群落整体植物残体的分解(Santonja et al., 2020)。从不同深度来看, 由于气候变化和人类活动干扰, 我国湿地生态系统在20世纪80年代到21世纪10年代间的0-20和0-100 cm深度的土壤有机碳密度分别从(8.49 ± 2.73) kg·m-2降至(8.27 ± 1.68) kg·m-2, 和从(28.12 ± 10.18) kg·m-2降至(25.93 ± 6.18) kg·m-2 (徐丽等, 2018)。本研究中0-25 cm土壤的碳密度为3.66-6.39 kg·m-2, 高草区土壤的碳密度接近于白洋淀的芦苇湿地(李瑾璞等, 2020), 整体上与我国湿地平均值接近但偏低, 一方面是研究区的差异, 滨海湿地碳储量一般高于内陆湿地碳储量, 另一方面湿地面积丧失和土地利用方式的改变导致土壤碳储量进一步下降(Lu et al., 2021; Yang et al., 2022)。近年来, 研究区由于建设用地的大面积增加、湿地的波动减少及生境的严重破碎化, 导致湿地生态系统退化(包玉斌等, 2015), 进而导致CO2和CH4从土壤向大气排放, 从而减少湿地碳储量。
不同植被群落下土壤碳含量、碳密度以及单位面积碳储量存在差异性, 其中植被的生长对营养物质的吸收以及水盐条件的影响可能是造成这种差异的主要原因(宋红丽等, 2018; 杜书栋等, 2022)。光滩区的碳密度比有植被生长的湿地区域低, 这一方面与光滩有机质主要来源于水体有关, 也与光滩受到水位变化作用比较强烈有关。另一方面土壤水分通过改变土壤氧化还原电位和微生物活性影响土壤碳储量, 湿地土壤中的高含水量会导致低氧化还原电位和低分解速率, 增加土壤碳储量, 这也是湿地生态系统碳储量很可能高于邻近的森林等陆地生态系统碳储量的重要原因(Pearse et al., 2018)。碳在厌氧土壤中累积是因为淹水环境抑制了酚氧化酶活性, 而酚氧化酶能够分解酚类抑制剂, 降低土壤碳的分解速率(Dunn & Freeman, 2018), 这也是光滩区存在一定碳储量的重要因素。此外, 土壤质地对土壤碳的主导控制可能是由于土壤通过聚集体的内部封闭及矿物吸附形成有机矿物复合物, 限制微生物分解作用, 一定程度保证了碳储量的稳定(Unger et al., 2016), 而黄河泥沙厚度和沉积过程的变化会对研究区土壤质地产生影响(张俊华等, 2020), 进而影响湿地植被演替, 形成多样的植被类型, 最终导致湿地生态系统的碳储量存在异质性。
4 结论
陕西黄河湿地自然保护区的光滩、低草植被区、矮灌丛植被区、高草植被区的总碳储量(地上植被碳储量和0-50 cm土壤碳储量之和)分别为2.09 × 10⁵、3.41 × 10⁵、1.48 × 10⁵和5.22 × 10⁵ t, 占评估区总碳储量的比例分别为17.13%、27.95%、12.13%和42.79%。高草植被区的植物和土壤碳密度最大, 其余类型的碳密度差异不显著。总的来说, 土壤亚系统的碳储量是湿地生态系统碳储量的主要组成, 未来湿地生态系统的保护恢复应优先关注土壤结构和固碳功能的恢复; 植被碳储量次之, 不同高度植被群落碳储量的差异有助于湿地生态恢复中的物种选择和群落结构配置。
致谢
感谢国家林业和草原局西北调查规划院科技创新项目(XBY-KJCX-2021-12)的资助。感谢北京生命科学研究所王建华博士帮助制图。
参考文献
Retention of dead standing plant biomass (marcescence) increases subsequent litter decomposition in the soil organic layer
DOI:10.1007/s11104-017-3318-6 URL [本文引用: 1]
Effects of land use change on habitat based on InVEST model—Taking Yellow River Wetland Nature Reserve in Shaanxi Province as an example
基于InVEST模型的土地利用变化对生境的影响——以陕西省黄河湿地自然保护区为例
The role of soil carbon in natural climate solutions
DOI:10.1038/s41893-020-0491-z [本文引用: 1]
Relationships among vegetation types, biomass and soil environmental factors in the wetlands of Yellow Sea and Bohai coastal areas
Understanding the relationships among wetland types, biomass and environmental factors is fundamental for wetland vegetation restoration. Based on field investigation in coastal areas of Yellow Sea and Bohai, TWINSPAN was used to categorize wetland types, and redundancy analysis was used to determine the major environmental factors affecting the spatial distribution and biomass variation of wetland types, aiming to provide scientific basis for wetland restoration. Results showed that wetland vegetation in coastal areas of Yellow Sea and Bohai could be classified into eleven types. Soil total carbon content and electrical conductivity significantly influenced the spatial distribution of wetland types. The wetlands in coastal areas of yellow Sea and Bohai had high biomass, with the highest (48512 kg·hm<sup>-2</sup>) occurring in <em>Spartina alterniflora</em>community, followed by <em>Suaeda salsa</em>, <em>Phragmites australis</em>, and <em>Tamarix chinensis</em> communities(>5000kg·hm<sup>-2</sup>), and the lower (<5000 kg·hm<sup>-2</sup>) in other communities. Soil organic carbon and total nitrogen contents were the major factors influencing the spatial variation of wetland biomass. Under climatic warming and increased nitrogen deposition, the biomass of wetland vegetation can be enhanced. Therefore, it is an effective way to strengthen wetland conservation and to restore the degraded wetland ecosystems for enhancing coastal wetland carbon sink and coping with climatic change.
黄渤海滨海湿地植被类型、生物量及其与土壤环境因子的关系
理解湿地植被类型、生物量与环境因素间的关系,是湿地植被恢复的基础。本文在野外调查的基础上,采用TWINSPAN对黄渤海滨海湿地进行类型划分,利用冗余度分析来确定影响研究区湿地类型分布和生物量差异的环境因素,以期为湿地的恢复提供科学依据。结果表明:黄渤海滨海湿地可以划分为11种类型;土壤电导率和土壤总碳对黄渤海滨海湿地类型的分布有显著影响;湿地具有较高的生物量,其中,互花米草(Spartina alterniflora)群落的生物量最高(48512 kg·hm<sup>-2</sup>),盐地碱蓬(Suaeda salsa)、芦苇(Phragmites australis)和柽柳(Tamarix chinensis)群落的生物量较高,均超过5000 kg·hm<sup>-2</sup>,其他类型的生物量较低,小于5000 kg·hm<sup>-2</sup>;影响研究区湿地类型生物量的主要因素为土壤有机碳和总氮含量。在气候变暖、氮沉降增加情况下,滨海湿地生物量将进一步增加,滨海湿地具有很大的固碳潜力。因此,加强研究区湿地的保护和退化湿地的生态恢复,是增加滨海湿地碳汇和应对气候变化的有效途径。
Above-ground and below-ground ecosystem biomass accumulation and carbon sequestration with Caragana korshinskii Kom plantation development
DOI:10.1002/ldr.v28.3 URL [本文引用: 2]
Water- level fluctuations as a driver of Phragmites australis primary productivity, litter decomposition, and fungal root colonisation in an intermittent wetland
DOI:10.1007/s10750-015-2492-x URL [本文引用: 1]
Conservation and high quality development of wetlands in the Yellow River Basin
黄河流域湿地保护与高质量发展
Changes of soil organic carbon storage in Phragmites australis wetlands along a salinity gradient in the Yellow River Delta
黄河三角洲芦苇湿地土壤有机碳储量沿盐分梯度的变化特征
Research progress on the carbon cycle of rivers and lakes
河流湖泊碳循环研究进展
The role of molecular weight in the enzyme-inhibiting effect of phenolics: the significance in peatland carbon sequestration
DOI:10.1016/j.ecoleng.2017.06.036 URL [本文引用: 1]
Ecological perspectives of carbon neutrality
DOI:10.17521/cjpe.2021.0394 URL [本文引用: 2]
碳中和的生态学透视
DOI:10.17521/cjpe.2021.0394
[本文引用: 2]

在简述碳中和概念的基础上, 重点对碳中和的实现途径及生态系统碳汇的重要性进行了评述, 认为碳减排和碳增汇是实现“碳中和”的两个决定因素; 碳减排的核心是节能、调结构、增效和发展清洁能源, 碳增汇的核心是生态保护、建设和管理。由于植被自然生长和生态建设等因素, 中国陆地生态系统发挥了, 并将在未来继续发挥着重要的碳汇作用。为增强生态系统的固碳能力, 作者提出“三优”生态建设和管理原则, 即“最优的生态系统布局、最优的物种配置、最优的生态系统管理”。此外, 文章还对“后碳中和”时代可能出现的问题和挑战进行了展望, 认为碳中和后, 由于气候变化, 特别是大气CO<sub>2</sub>浓度增速减缓甚至下降等因素, 可能导致全球性的植被生产力下降, 对此可能带来的新的环境问题需要提前谋划和应对。
Climate change, human impacts, and carbon sequestration in China
DOI:10.1073/pnas.1700304115 PMID:29666313 [本文引用: 1]
Storage of carbon, nitrogen and phosphorus in temperate shrubland ecosystems across Northern China
DOI:10.17521/cjpe.2016.0201
[本文引用: 2]
Aims Studying storage of carbon (C), nitrogen (N) and phosphorus (P) in ecosystems is of significance in understanding carbon and nutrient cycling. Previous researches in ecosystem C, N and P storage have biased towards forests and grasslands. Shrubland ecosystems encompass a wide gradient in precipitation and soil conditions, providing a unique opportunity to explore the patterns of ecosystem C, N and P storage in relation to climate and soil properties. Methods We estimated densities and storage of organic C, N and P of shrubland ecosystems in Northern China based on data from 433 shrubland sites.Important findings The main results are summarized as follows: the average organic C, N and P densities in temperate shrubland ecosystems across Northern China were 69.8 Mg·hm-2, 7.3 Mg·hm-2 and 4.2 Mg·hm-2, respectively. The average plant C, N and P densities were 5.1 Mg·hm-2, 11.5 × 10⁻² Mg·hm-2 and 8.6 × 10⁻³ Mg·hm-2, respectively, and were significantly correlated with precipitation and soil nutrient concentrations. The average litter C, N and P densities were 1.4 Mg·hm-2, 3.8 ×10⁻² Mg·hm-2, 2.5 ×10⁻³ Mg·hm-2 and were significantly correlated with temperature and precipitation. The average soil organic C, N and P densities in the top 1 m were 64.0 Mg·hm-2, 7.1 Mg·hm-2 and 4.2 Mg·hm-2, respectively and the former two were significantly correlated with temperature and precipitation. The total organic C, N and P storage of shrublands in Northern China were 1.7 Pg, 164.9 Tg and 124.8 Tg, respectively. The plant C, N and P storage were 128.4 Tg, 3.1 Tg and 0.2 Tg, respectively. The litter C, N and P storage were 8.4 Tg, 0.45 Tg, 0.027 Tg, respectively. Soil is the largest C, N and P pool in the studied area. The soil organic C, N and P storage in the top 1 meter were 1.6 Pg, 161.3 Tg and 124.6 Tg, respectively.
中国北方温带灌丛生态系统碳、氮、磷储量
DOI:10.17521/cjpe.2016.0201
[本文引用: 2]
研究生态系统碳(C)、氮(N)、磷(P)密度分布和储量对于理解生态系统碳循环和养分循环的机制和规律有重要意义。现有的相关研究多集中在森林和草地生态系统。在中国北方, 灌丛生境水分和土壤条件差异很大, 这为研究生态系统C、N、P密度与储量的分布格局提供了良好条件。该研究调查了433个中国北方温带灌丛样地的生物量、凋落物以及土壤等组分的有机C及N、P含量, 据此计算出中国北方灌丛生态系统有机C及N、P密度和储量。结果表明: 中国北方灌丛平均生态系统有机C及N、P密度分别为69.8 Mg·hm<sup>-2</sup>、7.3 Mg·hm<sup>-2</sup>、4.2 Mg·hm<sup>-2</sup>。其中, 生物量C、N、P密度分别为5.1 Mg·hm<sup>-2</sup>、11.5×10<sup>-2</sup> Mg·hm<sup>-2</sup>、8.6×10<sup>-3</sup> Mg·hm<sup>-2</sup>, 生物量C、N、P密度与降水和土壤养分关系显著; 凋落物C、N、P密度分别为1.4 Mg·hm<sup>-2</sup>、3.8×10<sup>-2</sup> Mg·hm<sup>-2</sup>、2.5×10<sup>-3</sup> Mg·hm<sup>-2</sup>, 凋落物C、N、P密度与温度和降水关系显著; 1 m深土壤的平均有机C及N、P密度分别为64.0 Mg·hm<sup>-2</sup>、7.1 Mg·hm<sup>-2</sup>、4.2 Mg·hm<sup>-2</sup>, 土壤有机C及N密度与温度和降水关系显著。中国北方灌丛生态系统的总有机C及N、P储量分别为1.7 Pg、164.9 Tg、124.8 Tg。其中生物量C、N、P储量分别为128.4 Tg、3.1 Tg、0.2 Tg; 凋落物C、N、P储量分别为8.4 Tg、0.45 Tg、0.027 Tg; 土壤是最大的C、N、P库, 1 m深土壤有机C及N、P储量分别为1.6 Pg、161.3 Tg、124.6 Tg。
Effect of grass restoration on soil carbon and nitrogen in the hilly area of the Loess Plateau
黄土高原丘陵沟壑区草地恢复对土壤碳氮库的影响
Carbon sequestration
DOI:10.1098/rstb.2007.2185
URL
[本文引用: 1]
Developing technologies to reduce the rate of increase of atmospheric concentration of carbon dioxide (CO2) from annual emissions of 8.6 Pg C yr–1from energy, process industry, land-use conversion and soil cultivation is an important issue of the twenty-first century. Of the three options of reducing the global energy use, developing low or no-carbon fuel and sequestering emissions, this manuscript describes processes for carbon (CO2) sequestration and discusses abiotic and biotic technologies. Carbon sequestration implies transfer of atmospheric CO2into other long-lived global pools including oceanic, pedologic, biotic and geological strata to reduce the net rate of increase in atmospheric CO2. Engineering techniques of CO2injection in deep ocean, geological strata, old coal mines and oil wells, and saline aquifers along with mineral carbonation of CO2constitute abiotic techniques. These techniques have a large potential of thousands of Pg, are expensive, have leakage risks and may be available for routine use by 2025 and beyond. In comparison, biotic techniques are natural and cost-effective processes, have numerous ancillary benefits, are immediately applicable but have finite sink capacity. Biotic and abiotic C sequestration options have specific nitches, are complementary, and have potential to mitigate the climate change risks.
The spatial distribution of soil organic carbon density and carbon storage in Baiyangdian wetland
白洋淀湿地区土壤有机碳密度及储量的空间分布特征
Spatial distribution of carbon storages in the terrestrial ecosystems and its influencing factors on the Loess Plateau
黄土高原地区生态系统碳储量空间分布及其影响因素
Responses of soil organic carbon component on different degrees of degradation of alpine wetland in the source of Yellow River
黄河源高寒湿地有机碳组分对不同退化程度的响应
DOI:10.11733/j.issn.1007-0435.2021.07.021
[本文引用: 1]
本研究以黄河源区玛沁县大武滩不同退化高寒湿地为研究对象,分层采集冻融丘和丘间土层样品,分析土壤有机碳组分的变化及其与土壤因子的关系。结果表明:冻融丘和丘间各层轻组分有机碳、重组分有机碳、可溶性有机碳、微生物碳含量随着退化程度的加剧下降,且在未退化与轻度退化、重度退化样地冻融丘0~10 cm土层间差异显著(PP<0.05),对高寒湿地退化的响应敏感;土壤含水量与有机碳、轻组分有机碳、重组分有机碳、可溶性有机碳和微生物碳含量呈正相关关系。综上所述,高寒湿地退化导致有机碳组分减少,重组分有机碳含量和占比可作为反映土壤有机碳库变化的关键指标,微生物碳含量和占比可作为反映高寒湿地退化的关键指标,均可为高寒湿地生态系统碳库和恢复机理的研究提供数据支撑。
Foliar C, N, and P stoichiometry of dominant shrubs in the chenier wetland of the Yellow River Delta, China
黄河三角洲贝壳堤湿地优势灌木碳、氮、磷化学计量特征
Variation of organic matter in soil aggregates with the succession of tidal flatland from barren land-saltmarsh-upland in the Yellow River Delta
黄河三角洲滩涂-湿地-旱地土壤团聚体有机质组分变化规律
Carbon storage distribution characteristics of wetlands in China and its influencing factors
中国湿地碳储量分布特征及其影响因素
DOI:10.13287/j.1001-9332.201907.036
[本文引用: 2]
湿地巨大的碳储存能力使其在稳定全球气候变化中占有重要地位,并对全球土壤碳储量做出重要贡献.本文在阐明湿地碳储量估算方法的基础上,分析我国主要湿地区碳储量并讨论气候、植被、土壤性质、土地利用等因素对湿地碳储量的影响.结果表明: 东北湿地区和青藏高原湿地区是八大湿地区中碳储量最高的两大区域;泥炭湿地的高稳定性、低分解率及酚氧化酶的作用使其成为内陆地区碳储量最高的湿地类型;单一因素的双向干扰及多重因素的交互作用使得湿地碳储量的影响因素和作用机理更加复杂.注重多重因素的交互作用,并结合数据同化技术,有利于湿地碳储量及湿地生态系统价值预测与评估.
Wetland soils carbon stock in the Sanjiang plain
黑龙江省三江平原湿地土壤碳储量变化
Anthropogenic disturbances caused declines in the wetland area and carbon pool in China during the last four decades
DOI:10.1111/gcb.v27.16 URL [本文引用: 1]
Wetlands, carbon, and climate change
DOI:10.1007/s10980-012-9758-8 URL [本文引用: 1]
Carbon storage in US wetlands
DOI:10.1038/ncomms13835 [本文引用: 1]
Soil organic carbon variability in Australian temperate freshwater wetlands
Advances in soil organic carbon losses under erosion
侵蚀条件下土壤有机碳流失研究进展
Global carbon dioxide emissions from inland waters
DOI:10.1038/nature12760 [本文引用: 1]
Anthropogenic perturbation of the carbon fluxes from land to ocean
DOI:10.1038/ngeo1830 [本文引用: 1]
Leaf nutrients and macroinvertebrates control litter mixing effects on decomposition in temperate streams
DOI:10.1007/s10021-019-00410-9 [本文引用: 1]
Aboveground biomass and its spatial distribution pattern of herbaceous marsh vegetation in China
DOI:10.1007/s11430-020-9778-7 [本文引用: 4]
Spatial and temporal distribution of soil organic carbon in vegetation communities of the Yellow River Delta under different disturbance levels
不同干扰程度下黄河三角洲植被群落有机碳分布特征
Carbon sequestration capacity of typical plants in marginal zone of the Ebinur Lake Wetland
艾比湖湿地边缘带典型植物固碳能力研究
Earth’s sediment cycle during the Anthropocene
Stability of organic carbon accumulating in Spartina alterniflora-dominated salt marshes of the Mid-Atlantic US
Carbon sequestration in wetlands, from science to practice: an overview of the biogeochemical process, measurement methods, and policy framework
DOI:10.1016/j.ecoleng.2017.06.037 URL [本文引用: 1]
Carbon storage of a primary coniferous forested wetland ecosystem in the temperate Changbai Mountain of China
长白山原始针叶林沼泽湿地生态系统碳储量
Critical advances in understanding ecohydrological processes of terrestrial vegetation: from leaf to watershed scale
陆地植被生态水文过程前沿进展: 从植物叶片到流域
Carbon budgets of wetland ecosystems in China
DOI:10.1111/gcb.14621
PMID:30884086
[本文引用: 3]
Wetlands contain a large proportion of carbon (C) in the biosphere and partly affect climate by regulating C cycles of terrestrial ecosystems. China contains Asia's largest wetlands, accounting for about 10% of the global wetland area. Although previous studies attempted to estimate C budget in China's wetlands, uncertainties remain. We conducted a synthesis to estimate C uptake and emission of wetland ecosystems in China using a dataset compiled from published literature. The dataset comprised 193 studies, including 370 sites representing coastal, river, lake and marsh wetlands across China. In addition, C stocks of different wetlands in China were estimated using unbiased data from the China Second Wetlands Survey. The results showed that China's wetlands sequestered 16.87 Pg C (315.76 Mg C/ha), accounting for about 3.8% of C stocks in global wetlands. Net ecosystem productivity, jointly determined by gross primary productivity and ecosystem respiration, exhibited annual C sequestration of 120.23 Tg C. China's wetlands had a total gaseous C loss of 173.20 Tg C per year from soils, including 154.26 Tg CO -C and 18.94 Tg CH -C emissions. Moreover, C stocks, uptakes and gaseous losses varied with wetland types, and were affected by geographic location and climatic factors (precipitation and temperature). Our results provide better estimation of the C budget in China's wetlands and improve understanding of their contribution to the global C cycle in the context of global climate change.© 2019 John Wiley & Sons Ltd.
Biomass carbon storage and its effect factors in steppe and agro-pastoral ecotones in northern China
DOI:10.3864/j.issn.0578-1752.2020.13.022
[本文引用: 1]
<p id="C3"> <strong>【Objective】</strong> The grassland ecosystem plays an important role in the global carbon balance. The study of grassland carbon pool and its driving force is a hot point of vegetation ecology. This study investigated the vegetation carbon density and its spatial pattern in the steppe and agro-pastoral ecotones of northern China. The major factors driving the spatial variation of grassland vegetation carbon density were identified, as well as the relative contribution of climate, soil texture, grazing intensity and other factors to the grassland vegetation carbon pool. <strong>【Method】</strong> Using the survey data of the grassland vegetation in northern grassland during 2002 and 2009, combined with the MODIS/NDVI remote sensing data and 1:1 million grassland type map, the estimation model of above- and below-ground biomass in the main grassland types of northern China was established. Based on 255 county-level administrative units in the study area, the relationship between grassland vegetation carbon density and climate factors, soil texture and livestock carrying capacity were explored, and derived the relative contribution of different driving factors to grassland carbon density using the general linear model (GLM). <strong>【Result】</strong> (1) The average above-ground biomass (AGB) of the steppe and agro-pastoral ecotones of northern China was 36.9 g C·m<sup>-2</sup>, and the below-ground biomass (BGB) was 362.9 g C·m<sup>-2</sup>, nearly 10 times the AGB. Both the above- and below-ground biomass decreased from east to west, and followed logarithmic normal distribution. The biomass carbon density of grassland types was significantly different. (2) In the whole study region and steppe sub-region, desert sub-region, agro-pastoral sub-region, the AGB showed a significantly positive correlation with mean annual precipitation (MAP) and soil clay content (Clay%), a significantly negative relationship with the mean annual temperature (MAT) and soil sand content (Sand%). The AGB increased with livestock carrying capacity except in the steppe sub-region where were very heavily grazed. (3) General Linear Model (GLM) analysis indicated that the MAP, MAT, Clay% and grazing intensity explained 29.6% (<i>P</i><0.001), 5.8% (<i>P</i><0.001), 0.8% (<i>P</i><0.05) and 1.3% (<i>P</i><0.001) of AGB variation, respectively, and the MAP, MAT and Sand% contributed to 12.1% (<i>P</i><0.001), 6.8% (<i>P</i><0.001) and 1.9% (<i>P</i><0.005) to BGB variation, respectively, and the grazing intensity had minor contribution to BGB. <strong>【Conclusion】</strong> Climate factors especially MAP was the dominate driving factor of grassland vegetation carbon density, and its impact on AGB was more obvious than on BGB. Soil texture also had a significant contribution to the grassland vegetation carbon density, especially on the BGB. Grazing intensity explained only 1.3% of the AGB and had no impact on BGB. This finding indicated that the climate factors were major contributor grassland vegetation carbon density comparing with grazing intensity. </p>
北方草地及农牧交错区草地植被碳储量及其影响因素
DOI:10.3864/j.issn.0578-1752.2020.13.022
[本文引用: 1]
【目的】 草地生态系统在全球碳平衡中有重要的意义,草地植被碳库及其变化机制研究是植被生态学的重要命题。本文研究北方草地和农牧交错区草地植被碳密度及其空间格局,解析不同区域草地植被碳密度的关键影响因素,分析了气候、土壤、放牧等因素对地上地下植被碳库的相对贡献。【方法】 基于2002—2009年北方草地及农牧交错带草地植被调查数据,结合同期MODIS/NDVI遥感影像和1﹕100万草地类型图,建立了我国主要草地类型的生物量估算模型;整合野外考察数据和前人研究结果,探讨了研究区地上地下生物碳库及其空间格局;基于研究区255个县级行政单元,分析了不同类型草地植被碳库与气候要素、土壤要素及家畜承载量的关系,应用一般线性模型(GLM)解析了不同影响因素对草地碳密度的相对贡献。【结果】 (1)北方草地与农牧交错区草地地上平均生物碳密度为36.9 g C·m<sup>-2</sup>,地下生物碳密度为362.9 g C·m<sup>-2</sup>,地下生物碳密度高于地上10倍,均呈从东到西递减的趋势,频率分布图基本服从对数正态分布,不同草地类型的生物碳密度存在明显差异;(2)整个研究区及草原亚区、荒漠亚区、农牧交错亚区内,地上生物量与年降水量(MAP)呈极显著正相关、与年均气温(MAT)均呈极显著负相关,与土壤黏粒含量(Clay%)呈显著正相关、与土壤砂粒含量(Sand%)呈显著负相关,整个研究区家畜承载量与草地地上生物量之间呈极显著正相关;(3)一般线性模型(GLM)分析结果表明,年平均降水量(MAP)、年均气温(MAT)、土壤黏粒含量(Clay%)、放牧强度对地上生物量空间变异的解释率分别达到29.6%(PPPPPPP【结论】 气候条件尤其是年降水量是草地生物量碳库的主要影响因素,但对地上生物量影响更为明显;土壤质地对植被生物碳库也有显著贡献,尤其对地下生物量的影响更加显著;放牧强度只能解释地上生物量变化的1.3%、对地下生物量没有显著贡献,这一发现意味着气候对生物量碳库的贡献远大于放牧影响。
Changes of soil organic carbon storage in Chinese terrestrial ecosystems from the 1980s to the 2010s
DOI:10.11821/dlxb201811008
[本文引用: 2]
<p>Soils store a large amount of the terrestrial ecosystem carbon (C) and play an important role in maintaining global C balance. However, very few studies have addressed the regional patterns of soil organic carbon (SOC) storage and the main factors influencing its changes in Chinese terrestrial ecosystems, especially using field measured data. In this study, we collected information on SOC storage in the main types of ecosystems (forest, grassland, cropland, and wetland) across 18 regions of China during the 1980s (from the Second National Soil Survey of China, SNSSC) and the 2010s (from studies published between 2004 and 2014), and evaluated whether trends changed over the 30-year period. The SOC storage (0-100 cm) in China was 83.46±11.89 Pg C in the 1980s and 86.50±8.71 Pg C in the 2010s, and the net increase over 30 years was 3.04±1.65 Pg C, with a rate of 0.101±0.055 Pg C yr<sup>-1</sup>. This increase was mainly observed in the topsoil (0-20 cm). Forest, grassland, and cropland SOC storage increased by 2.52±0.77, 0.40±0.78, and 0.07±0.31 Pg C, respectively, which can be attributed to the several ecological restoration projects and agricultural practices implemented. On the other hand, SOC storage in wetlands declined by 0.76±0.29 Pg C, most likely due to the decrease in wetland area and SOC density. These results, combined with those of vegetation C sink (0.100 Pg C yr<sup>-1</sup>), show that the net C sink in Chinese terrestrial ecosystems was about 0.201±0.061 Pg C yr<sup>-1</sup>, which offsets 14.85%-27.79% of the C emissions from fossil fuels from the 1980s to the 2010s. These estimates of soil C sink based on field measured data supported the premise that China's terrestrial ecosystems have a large C sequestration potential, and further emphasized the importance of forest protection and reforestation to increase SOC storage capacity.</p>
1980s-2010s中国陆地生态系统土壤碳储量的变化
DOI:10.11821/dlxb201811008
[本文引用: 2]
土壤作为陆地生态系统有机碳库的主体,在全球碳循环中起着重要作用。然而,当前区域土壤有机碳储量的变化情况及其碳源/汇功能仍然不清楚。利用中国1980s (1979-1985年)第二次土壤普查数据,同时收集整理2010s(2004-2014年)已发表的有关中国土壤有机碳储量(0~20 cm和0~100 cm)的文献数据,综合评估了1980s-2010s中国土壤有机碳储量的变化情况,并分析森林、草地、农田和湿地等生态系统土壤碳源/汇功能;同时结合现有的中国植被碳储量变化研究,进一步探讨了1980s-2010s中国陆地生态系统的碳源/汇效应。研究发现:① 1980s-2010s中国土壤(0~100 cm)有机碳储量净增长3.04±1.65 Pg C,增长速率为0.101±0.055 Pg C yr<sup>-1</sup>,其中表层土壤(0~20 cm)的碳汇效应明显;② 森林土壤是固碳主体,净增长2.52±0.77 Pg C,而草地和农田土壤增长有限,分别为0.40±0.78和0.07±0.31 Pg C;③ 湿地有机碳储量净减少0.76±0.29 Pg C;④ 中国陆地生态系统的碳汇效应较强,总碳汇量相当于同期(1980-2009年)化石燃料和水泥生产排放CO<sub>2</sub>总量的14.85%~27.79%。随着中国森林和草地生态系统植被和土壤的进一步保护、恢复和重建,中国陆地生态系统具有较大的碳汇潜力,在未来全球碳平衡中将发挥更大的作用。
Ecological stoichiometry characteristics of soil carbon, nitrogen and phosphorus of the Yellow River wetland in Baotou, Inner Mongolia
内蒙古包头黄河湿地土壤碳氮磷含量及其生态化学计量学特征
Effects of land use types on soil organic carbon in the South China Sea wetland
黄河湿地包头段不同地被类型对土壤有机碳的影响
DOI:10.16258/j.cnki.1674-5906.2018.06.006 [本文引用: 1]
Terrestrial carbon sinks in China and around the world and their contribution to carbon neutrality
DOI:10.1007/s11427-021-2045-5
PMID:35146581
[本文引用: 5]
Enhancing the terrestrial ecosystem carbon sink (referred to as terrestrial C sink) is an important way to slow down the continuous increase in atmospheric carbon dioxide (CO) concentration and to achieve carbon neutrality target. To better understand the characteristics of terrestrial C sinks and their contribution to carbon neutrality, this review summarizes major progress in terrestrial C budget researches during the past decades, clarifies spatial patterns and drivers of terrestrial C sources and sinks in China and around the world, and examines the role of terrestrial C sinks in achieving carbon neutrality target. According to recent studies, the global terrestrial C sink has been increasing from a source of (-0.2±0.9) Pg C yr (1 Pg=10 g) in the 1960s to a sink of (1.9±1.1) Pg C yr in the 2010s. By synthesizing the published data, we estimate terrestrial C sink of 0.20-0.25 Pg C yr in China during the past decades, and predict it to be 0.15-0.52 Pg C yr by 2060. The terrestrial C sinks are mainly located in the mid- and high latitudes of the Northern Hemisphere, while tropical regions act as a weak C sink or source. The C balance differs much among ecosystem types: forest is the major C sink; shrubland, wetland and farmland soil act as C sinks; and whether the grassland functions as C sink or source remains unclear. Desert might be a C sink, but the magnitude and the associated mechanisms are still controversial. Elevated atmospheric CO concentration, nitrogen deposition, climate change, and land cover change are the main drivers of terrestrial C sinks, while other factors such as fires and aerosols would also affect ecosystem C balance. The driving factors of terrestrial C sink differ among regions. Elevated CO concentration and climate change are major drivers of the C sinks in North America and Europe, while afforestation and ecological restoration are additionally important forcing factors of terrestrial C sinks in China. For future studies, we recommend the necessity for intensive and long term ecosystem C monitoring over broad geographic scale to improve terrestrial biosphere models for accurately evaluating terrestrial C budget and its dynamics under various climate change and policy scenarios.© 2022. Science China Press and Springer-Verlag GmbH Germany, part of Springer Nature.
Modeling the effects of land-use optimization on the soil organic carbon sequestration potential
DOI:10.1007/s11442-018-1534-5
[本文引用: 1]
Increasing soil organic carbon (SOC) sequestration is not only an efficient method to address climate change problems but also a useful way to improve land productivity. It has been reported by many studies that land-use changes can significantly influence the sequestration of SOC. However, the SOC sequestration potential (SOCP, the difference between the saturation and the existing content of SOC) caused by land-use change, and the effects of land-use optimization on the SOCP are still not well understood. In this research, we modeled the effects of land-use optimization on SOCP in Beijing. We simulated three land-use optimization scenarios (uncontrolled scenario, scale control scenario, and spatial restriction scenario) and assessed their effects on SOCP. The total SOCP (0-20 cm) in Beijing in 2010 was estimated as 23.82 Tg C or 18.27 t C/ha. In the uncontrolled scenario, the built-up land area of Beijing would increase by 951 km2 from 2010 to 2030, and the SOCP would decrease by 1.73 Tg C. In the scale control scenario, the built-up land area would decrease by 25 km2 and the SOCP would increase by 0.07 Tg C from 2010 to 2030. Compared to the uncontrolled scenario, the SOCP in 2030 of Beijing would increase by 0.77 Tg C or 0.64 t C/ha in the spatial restriction scenario. This research provides evidence to guide planning authorities in conducting land-use optimization strategies and estimating their effects on the carbon sequestration function of land-use systems.
Spatial characteristics and variation mechanism of different soil organic carbon components in the alluvial/ sedimentary zone of the Yellow River
黄河泥沙冲/沉积区土壤有机碳不同组分空间特征及变异机制
DOI:10.11821/dlxb202003009
[本文引用: 2]
黄河泥沙是黄河下游陆地地貌类型形成的物质来源,泥沙沉积改变了地表土壤结构和有机碳含量水平。基于室内外实验和空间地统计分析方法,文中对开封—周口土壤有机碳组分的空间特征和影响因素进行了分析。在0~100 cm土壤中TOC、AOC、NOC的含量分别为0.05~30.03 g/kg、0.01~8.86 g/kg和0.02~23.36 g/kg,表层0~20 cm的TOC、AOC、NOC高于下层,同一土层中TOC的变化幅度和含量差异性最大,AOC最小,NOC介于二者之间。NOC的含量对TOC的贡献大于AOC。空间地统计学研究显示,TOC、AOC、NOC的块金系数在0.50~0.67之间,具有中等程度的空间相关性,TOC、AOC、NOC的含量受结构因素和随机因素的共同作用,且二者的作用强度接近。空间上,自表层向下层,土壤TOC、AOC和NOC的整体变化趋势较为一致,高值区与低值区之间过渡明显,NOC和AOC的含量及空间变化能较好地反映TOC的空间变化和碳积累区域。分析发现,黄河泥沙冲/沉积区分布、农业耕作过程和耕作历史是影响区内土壤有机碳及其组成含量和空间分布的主要因素,而有机物的输入量、土壤颗粒物组成及二者的动态关系是影响土壤结构体形成和有机碳含量的关键因素,提高有机物的含量和改善土壤结构是提升土壤质量、实现区内农业持续发展的有效途径。
Distribution characteristics of organic carbon and its components in soils under different types of vegetation in wetland of Hangzhou Bay
杭州湾湿地不同植被类型下土壤有机碳及其组分分布特征
Advances in study on organic carbon characteristics in the riverine systems
The interfaces of the Earth’s critical zones are the place where organic carbon is dramatically decomposed and transformed. The dynamics and fate of organic carbon serve as an important foundation of revealing the material transportation and energy transfer in the critical zones, which is of great significance to support the ecological system. The geochemical characteristics of organic carbon in riverine system is reviewed in this study, including the research methods, sources, storage, dynamics and turnover process of organic carbon. It is suggested that the the dynamics of organic carbon in the critical zones should be studied well for understanding carbon cycling in the riverine systems. Various technical methods, short-term high-frequency observation, long-term observation research in the multiinterface with multitime scales should be conducted in typical critical zones, in order to reveal the key factors and its mechanisms of organic carbon dynamics and processes in the riverine systems. Furthermore, the response and feedback mechanism of organic carbon cycle to global change and human activities on longtime scales should be studied. Besides, the carbon exchange between interfaces of atmosphere-plant-litter-soil-river and the dynamics of organic carbon in watersheds should be further analyzed under different disturbance intensities of human activities. Understanding the impacts of environmental changes and human activities on the geochemical cycling of organic carbon in critical zones would benefit the optimization of carbon cycling model and climate change predictions.
地表流域有机碳地球化学研究进展
地球关键带的各个界面是有机碳发生剧烈分解转化的场所,探讨关键带有机碳的动态变化、归趋及其控制过程,是揭示地表流域中物质运输和能量传递规律的重要基础,对维持生态系统平衡具有重要意义。本文介绍了国内外关于流域不同关键带有机碳的研究方法、来源、储量及其动态、周转过程等地球化学特征的研究进展,以及现有研究存在的问题。建议将典型关键带作为一个整体来研究,综合使用多种技术方法,将短期高频次观测和长期定位观测研究相结合,在典型小流域开展多界面、多过程、多时间尺度的长期同步观测和系统研究,揭示控制关键带有机碳地球化学循环的关键因子及其作用机制。同时重视长时间尺度下有机碳循环对全球变化和人类活动的响应及反馈机制;分析不同人为活动下,大气植物凋落物土壤河流之间的碳交换特征及流域有机碳动态变化规律;定量区分环境变化和人类活动对关键带有机碳地球化学行为的影响,为碳循环模型优化及气候变化预测提供科学依据。
