


草地荒漠化是近年来备受关注的全球性问题之一, 也是中国北方最主要的生态环境问题之一(Wang et al., 2008; Zhou et al., 2015)。植被具有改善区域气候、保持水土等作用, 被认为是反映区域生态质量的重要指标(Parmesan & Yohe, 2003; 罗新兰等, 2020)。在沙地生态系统中, 植被不但能够减弱风蚀而且还能改善沙土环境从而遏制和逆转土地沙漠化。因此, 植被的破坏与恢复程度可以决定土地沙漠化的发展与治理情况(郭泽呈等, 2020)。长时间尺度的植被变化可以代表区域土地沙漠化的变化情况, 遥感技术可以实现对长时间、大尺度的植被变化进行估算和监测(He et al., 2017)。归一化植被指数(NDVI)是监测生态系统和区域植被变化的重要指标, 能有效反映区域植被覆盖程度与生长状态(Wang et al., 2015)。
科尔沁沙地是我国面积最大的沙地, 生态环境非常脆弱。近百年来, 受气候变化和人类活动的影响, 该地区以林草为特征的区域逐渐退化为沙地(Han et al., 2010)。近几十年, 在植被恢复重建等生态工程措施影响下, 部分地区植被覆盖度发生了显著的变化。Huang等(2008)采用趋势分析法得出1998-2006年科尔沁沙地植被覆盖度呈增加趋势且增幅较大; 魏丰良等(2012)通过土壤调节植被指数(SAVI)表明2000-2009年科尔沁沙地东部和西北部地区的植被生长较好, 西南部地区的植被空间变异最显著; 李生勇等(2016)研究发现2004-2013年科尔沁地区植被覆盖度以0.033·a-1的增速变化; 崔珍珍等(2021)采用趋势分析、变异系数、Hurst指数及偏相关分析方法, 得出1982-2015年科尔沁沙地植被NDVI格局呈“南北高, 中间低”的分布特征。上述研究对不同时期的科尔沁沙地植被NDVI时空变化进行了探讨, 通过相关系数、变异系数等方法分析了驱动因子与植被的关系。当植被与驱动因子的关系是线性且遵循正态分布时, 这些传统的统计方法才有效(Gu et al., 2018), 但是植被生长对环境变化的响应过程, 并不存在完全符合统计标准的线性关系(Hein et al., 2011), 是传统方法的不足。相比之下, 地理探测器是一种探测空间分异性并揭示其潜在影响因子的新方法, 其优点在于不必严格遵循传统统计方法的假设以及复杂的参数设置过程, 此外, 还可以消除和忽略输入要素的多重共线性, 而且增加或者减少要素也不会影响其他要素的结果(Ding et al., 2018; Peng et al., 2019; Zhu et al., 2020)。
因此, 本研究采用地理探测器分析了2001- 2020年科尔沁沙地植被NDVI变化的基本特征以及自然因子和人为因子对植被变化的影响, 通过地理探测器的各个模型定量研究了各驱动因子影响力、交互力和适宜性范围。研究结果可为科尔沁沙地植被恢复以及生态工程的合理布局提供科学依据。
1 材料和方法
1.1 研究区概况
科尔沁沙地位于117.82°-123.70° E、41.68°- 46.08° N。地处内蒙古高原向东北平原过渡地带, 西起燕山山系的七老图山, 东至松辽平原西部, 南以努鲁儿虎山为界, 北接大兴安岭山地南缘, 地势西高东低, 南北高中部低。研究区内共有14个旗县, 总面积12.51 × 10⁴ km2 (图1)。属于温带大陆性季风气候, 年平均气温5.2-6.4 ℃、年降水量350-500 mm (赵哈林等, 2008)。土壤类型以松散的沙质土为主, 其次是草甸土和栗钙土。植被类型为疏林, 乔木优势种有榆树(Ulmus pumila)、蒙古栎(Quercus mongolica) 等; 灌木有盐蒿(Artemisia halodendron)、小叶锦鸡儿(Caragana microphylla)等; 多年生草本有白草(Pennisetum centrasiaticum)、冷蒿(Artemisia frigida)、羊草(Leymus chinenses)等; 沙丘上多被沙米(Agriophyllum squarrosum)等一年生植物占据(王涛, 2003)。
图1
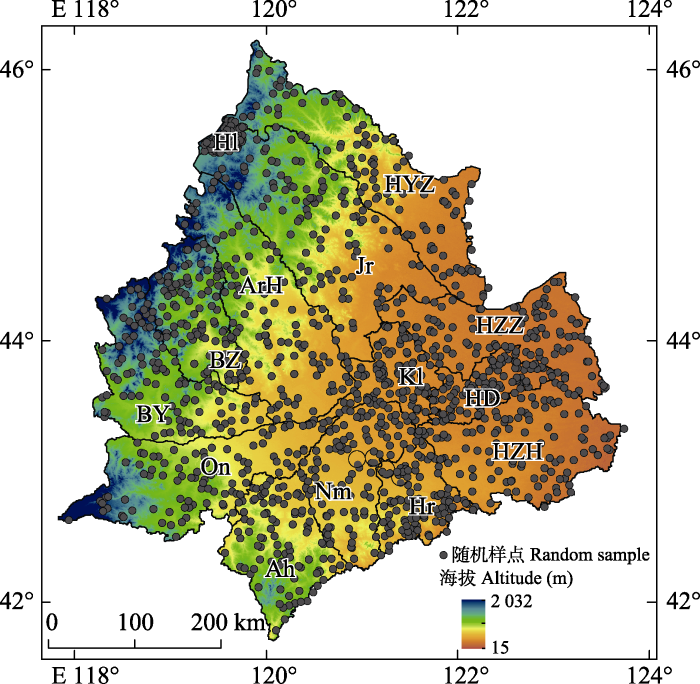
图1
科尔沁沙地随机样点分布图。Ah, 敖汉旗; ArH, 阿鲁科尔沁旗; BY, 巴林右旗; BZ, 巴林左旗; HD, 科尔沁区; Hl, 霍林郭勒市; Hr, 库伦旗; HYZ, 科尔沁右翼中旗; HZH, 科尔沁左翼后旗; HZZ, 科尔沁左翼中旗; Jr, 扎鲁特旗; Kl, 开鲁县; Nm, 奈曼旗; On, 翁牛特旗。
Fig. 1
Distribution of random samples in Horqin Sandy Land. Ah, Aohan Banner; ArH, Ar Horqin Banner; BY, Bairin You Banner; BZ, Bairin Zuo Banner; HD, Horqin District; Hl, Huolingol City; Hr, Hure Banner; HYZ, Horqin Youyi Zhong Banner; HZH, Horqin Zuoyi Hou Banner; HZZ, Horqin Zuoyi Zhong Banner; Jr, Jarud Banner; Kl, Kailu County; Nm, Naiman Banner; On, Ongniutd Banner.
1.2 数据来源
表1 归一化植被指数(NDVI)的驱动因子
Table 1
| 类型 Type | 驱动因子 Driving factor | 指标 Index | 单位 Unit | 数据来源 Data resource |
|---|---|---|---|---|
| 自然因素 Natural factor | X1 | 年平均气温 Mean annual temperature | ℃ | 中国气象数据共享网 China Meteorological Data Service Center |
| X2 | 年降水量 Mean annual precipitation | mm | 中国气象数据共享网 China Meteorological Data Service Center | |
| X3 | 坡度 Slope | 。 | 美国NASA获取的SRTM 30 m DEM数据 SRTM 30 m DEM data acquired by NASA | |
| X4 | 土壤类型 Soil type | - | 中国科学院资源环境科学与数据中心 Resource and Environment Science and Data Center, Chinese Academy of Sciences (CAS) | |
| X5 | 植被类型 Vegetation type | - | 中国科学院资源环境科学与数据中心 Resource and Environment Science and Data Center, CAS | |
| X6 | 地貌类型 Geomorphic type | - | 中国科学院资源环境科学与数据中心 Resource and Environment Science and Data Center, CAS | |
| 人为因素 Anthropogenic factor | X7 | 人口密度 Population density | 人·km-2 person·km-2 | 内蒙古自治区统计年鉴 Inner Mongolia Statistical Yearbook |
| X8 | 累积造林面积 Accumulated afforestation area | hm2·km-2 | 中国林业统计年鉴 China Forestry Statistical Yearbook | |
| X9 | 牲畜密度 Livestock density | 头·km-2 head·km-2 | 内蒙古自治区统计年鉴 Inner Mongolia Statistical Yearbook | |
| X10 | 农作物种植面积 Crops area | hm2·km-2 | 内蒙古自治区统计年鉴 Inner Mongolia Statistical Yearbook |
1.3 研究方法
1.3.1 趋势分析
采用一元线性回归方法分析植被NDVI时空格局变化趋势(王文辉等, 2017)。计算公式:
式中, slope为回归方程斜率, n为时间, NDVIi为第i年的NDVI值。slope > 0表示植被NDVI呈增加趋势, slope ≤ 0表示下降趋势。
1.3.2 地理探测器模型
(1)因子探测: 用于探测驱动因子X对植被NDVI变化的影响力大小, 用q表示。
式中, h = 1, 2…, L为变量Y或因子X的分类或分区; N和Nh分别是全区和层h的单元数; σh2和σ2分别是层h和全区的Y值方差; SSW与SST分别为层内方差之和与区域总方差。q值范围[0,1], 值越大表示驱动因子对植被NDVI影响力越强。
(2)交互探测: 用于识别驱动因子之间的交互作用, 即驱动因子X1和X2共同作用是否会增加或减弱对植被NDVI的影响力, 或者这些驱动因子对植被NDVI的影响是否相互独立。交互作用关系分为5类(表2)。
表2 两因子间的交互作用类型
Table 2
| 交互作用类型 Interaction type | q值关系 q value relationship |
|---|---|
| 非线性减弱 Non-linear reduction | q(X1∩X2) < min(q(X1), q(X2)) |
| 单因子非线性减弱 Single factor non-linear reduction | min(q(X1), q(X2)) < q(X1∩X2) < max(q(X1), q(X2)) |
| 双因子增强 Bi-factor enhancement | q(X1∩X2) > max(q(X1), q(X2)) |
| 独立 Independent | q(X1∩X2) = q(X1) + q(X2) |
| 非线性增强 Non-linear enhancement | q(X1∩X2) > q(X1) + q(X2) |
q为驱动因子对植被的影响力; X1、X2分别表示任意两个驱动因子。
q represents the influence of driving factor on vegetation; X1, X2 denotes any of two driving factors.
(3)风险探测: 用于判断两个驱动因子子区域之间的属性均值是否有显著差别, 找出植被覆盖好的区域。用t统计量来检验:
式中,
(4)生态探测: 用于判断两个因子X1与X2对植被NDVI空间分布哪个更具有影响力。以F统计量来衡量。
式中, NX1及NX2分别表示两个驱动因子X1和X2的样本数量; SSWX1和SSWX2分别表示两个驱动因子X1和X2形成分层的层内方差之和; L1和L2分别表示变量X1和X2分层数目。
1.4 驱动因子选取
1.4.1 NDVI数据选取及等级划分
为了更好地分析科尔沁沙地植被覆盖动态变化,按照等间距法(彭文甫等, 2016)将植被NDVI划分为低覆盖度(<0.2)、中低覆盖度(0.2-0.4)、中高覆盖度(0.4-0.6)和高覆盖度(≥0.6)共4个等级。利用slope趋势分析得到2001-2020年科尔沁沙地植被NDVI变化趋势空间分布, 根据显著性检验结果和变化斜率大小, 将NDVI变化趋势分为5类: 极显著退化(-0.023 - -0.015)、显著退化(-0.015 - -0.001)、无显著变化(-0.001-0.001)、显著改善(0.001-0.015)和极显著改善(0.015-0.026)。
1.4.2 其他驱动因子选取
已有研究表明, 自然因子如气候、土壤、地形等会显著影响植被NDVI (Lu et al., 2020; 刘宁等, 2022), 人口密度、农作物种植面积等人为因子也会对植被NDVI产生作用(Liu et al., 2018), 结合科尔沁沙地地理位置以及区域特点, 还选取了累计造林面积和牲畜密度等因子。最终确定了6类自然因子以及4类人为因子(表1)。由于地理探测器模型输入需要将连续性变量处理为离散变量, 本研究采用R软件“GD”包最优参数地理探测器模型(OPGD模型)进行连续变量离散化, 该方法通过优化数据的空间尺度和离散化过程, 能够确定出地理探测器模型的最佳参数组合(Song et al., 2020)。所以, 对气温、降水、坡度、人口密度、累积造林面积、牲畜密度以及农作物种植面积7类因子用OPGD模型选择出最合适的分类方法以及分类等级; 土壤类型、地貌类型和植被类型按照数据已有的分类标准进行分类, 分类结果列于表3。在ArcGIS软件中对研究区域进行随机采样, 间距设为1 km, 随机生成1 379个样点(图1)。通过空间位置关联采样点的植被NDVI和所有驱动因子, 分析植被NDVI与各因子之间的定量关系(张华等, 2021)。
表3 归一化植被指数(NDVI)各驱动因子的分级标准
Table 3
| 分级 Class | X1 (℃) | X2 (mm) | X3 (°) | X4 | X5 | X6 | X7 (person·km-2) | X8 (hm2·km-2) | X9 (head·km-2) | X10 (hm2·km-2) |
|---|---|---|---|---|---|---|---|---|---|---|
| 1 | 4.68-5.67 | 462.77-492.69 | 0-2 | 淋溶土 Alfisol | 针叶林 Needle leaf forest | 平原 Plain | 17.67-41.26 | 1.69-2.94 | 8.99-70.65 | 13.30-13.40 |
| 2 | 5.67-6.45 | 492.69-511.24 | 2-3 | 钙层土 Pedocal | 阔叶林 Broadleaf forest | 台地 Platform | 41.26-49.39 | 2.94-4.41 | 70.65-96.30 | 13.40-16.09 |
| 3 | 6.45-7.07 | 511.24-529.69 | 3-5 | 初育土 Primary | 灌丛 Shrub | 丘陵 Hill | 49.39-56.81 | 4.41-4.89 | 96.30-110.69 | 16.09-18.02 |
| 4 | 7.07-7.66 | 529.69-547.57 | 5-8 | 半水成土 Semi- hydromorph | 草原 Steppe | 小起伏 山地 Small undulating mountain | 56.81-67.65 | 4.89-5.14 | 110.69-118.50 | 18.02-18.89 |
| 5 | 7.66-8.22 | 547.57-566.55 | 8-10 | 水成土 Hydromorph | 草甸 Meadow | 中起伏 山地 Middle undulating mountain | 67.65-86.71 | 5.14-5.29 | 118.50-128.85 | 18.89-20.18 |
| 6 | 8.22-8.72 | 566.55-587.78 | 10-13 | 盐碱土 Saline-alkali | 人工林Artificial forest | 86.71-132.62 | 5.29-5.56 | 128.85-141.48 | 20.18-21.56 | |
| 7 | 8.72-9.32 | 587.78-628.31 | 13-15 | 湖泊水库 Lakes and reservoirs | 132.62-260.95 | 5.56-7.89 | 141.48-224.26 | 21.56-33.17 | ||
| 8 | 15-17 | 河流 Rivers | ||||||||
| 9 | 17-30 | 河内沙洲 Sandbank |
X1, 年平均气温; X2, 年降水量; X3, 坡度; X4, 土壤类型; X5, 植被类型; X6, 地貌类型; X7, 人口密度; X8, 累积造林面积; X9, 牲畜密度; X10, 农作物种植面积.
X1, mean annual air temperature; X2, mean annual precipitation; X3, slope; X4, soil type; X5, vegetation type; X6, geomorphic type; X7, population density; X8, accumulated afforestation area; X9, livestock density; X10, crops area.
2 结果和分析
2.1 植被NDVI时空分布与变化特征
近20年来, 科尔沁沙地植被NDVI时空格局发生了显著变化。在年均植被NDVI趋势图上绘制了5年滑动平均曲线, 滑动平均法是时间序列上消除变量不稳定波动, 显示其变化平稳性的一种方法(魏凤英, 2007)。植被NDVI年均值整体呈波动上升趋势, 2004-2012年期间有明显波动下降趋势(图2)。空间上, 2001年, 植被NDVI中低值区和中高值区主要分布科尔沁沙地的中部和南部(图3), 占总面积96.70%; 2010年, 植被低值区占比略有上升, 说明植被覆盖度降低; 到2020年, 中低值区占比减少到50.97%, 中高值区和高值区比例明显增加, 分别为41.66%和3.06%, 说明植被覆盖度逐渐升高(表4)。植被NDVI显著增加的区域占比超过64.91%, 主要分布于科尔沁沙地北部、中部及南部山区; 植被NDVI显著退化区与无显著变化区占比分别为14.84%和20.08%, 主要分布在巴林右旗和翁牛特旗北部等地区。高值区主要分布在北部山地森林区; 低值区集中分布在翁牛特旗东部以及奈曼旗西北部, 这些地区主要为半流动-流动沙丘, 植被盖度低。
图2
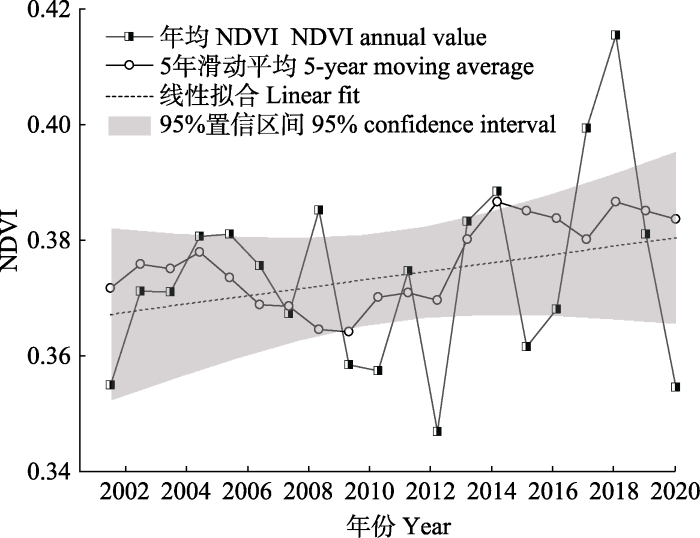
图2
科尔沁沙地2001-2020年归一化植被指数(NDVI)平均值变化趋势。
Fig. 2
Variation trend of mean value of Normalized Difference Vegetation Index (NDVI) in Horqin Sandy Land during 2001-2020.
图3
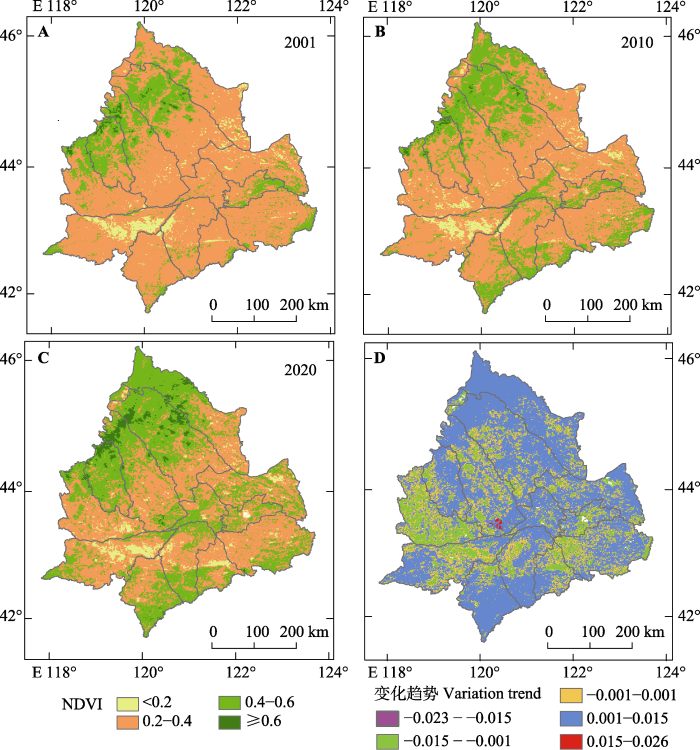
图3
科尔沁沙地年平均归一化植被指数(NDVI)及变化空间分布。A、B、C分别为2001、2010、2020年研究区NDVI空间分布图。D为研究区2001-2020年NDVI变化趋势图。
Fig. 3
Spatial distribution of Normalized Difference Vegetation Index (NDVI) in Horqin Sandy Land. A, B, C represents the spatial distribution of mean annual NDVI of the study area in 2001, 2010 and 2020, respectively. D shows the variation trend of NDVI in the study area from 2001 to 2020.
表4 科尔沁沙地2001-2020年归一化植被指数(NDVI)动态变化
Table 4
| NDVI分级 NDVI class | 2001 | 2010 | 2020 | |||
|---|---|---|---|---|---|---|
| 面积 Area (km2) | 比例 Proportion (%) | 面积 Area (km2) | 比例 Proportion (%) | 面积 Area (km2) | 比例 Proportion (%) | |
| <0.2 | 4 696 | 2.79 | 6 905 | 4.10 | 7 265 | 4.31 |
| 0.2-0.4 | 114 900 | 68.20 | 116 634 | 69.22 | 85 884 | 50.97 |
| 0.4-0.6 | 48 028 | 28.50 | 44 176 | 26.22 | 70 181 | 41.66 |
| ≥0.6 | 866 | 0.51 | 775 | 0.46 | 5 160 | 3.06 |
2.2 驱动因子影响力分析
2.2.1 驱动因子影响力变化
图4
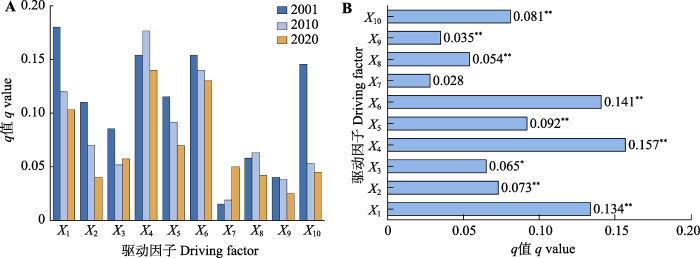
图4
科尔沁沙地驱动因子对归一化植被指数(NDVI)的影响力(q值)。A, 2001、2010、2020年q值。B, 2001-2020年平均q值。X1-X10, 驱动因子名称, 具体见
Fig. 4
Influence (q value) of driving factors for Normalized Difference Vegetation Index (NDVI) in Horqin Sandy Land. A, q value in 2001, 2010, and 2020. B, Mean value of q during 2001-2020. X1-X10, driving factors’ name, see
2.2.2 驱动因子交互作用以及显著性差异
根据交互探测以及生态探测结果(图5), 各驱动因子交互都存在增强效应, 说明单个因子与其他因子相互作用时, 对植被NDVI的影响力会增强, 主要表现为非线性增强, 其次为双因子增强。其中交互作用最显著的是土壤类型与年平均气温和地貌类型的交互, 分别达到0.33和0.32; 交互作用较小的是坡度与农作物种植面积和年降水量的交互。此外, 自然因子如土壤类型、地貌类型分别与人为因子之间也存在着较高的交互作用, 这进一步说明土壤类型和地貌类型等自然因子是影响植被NDVI的主要因素。
图5
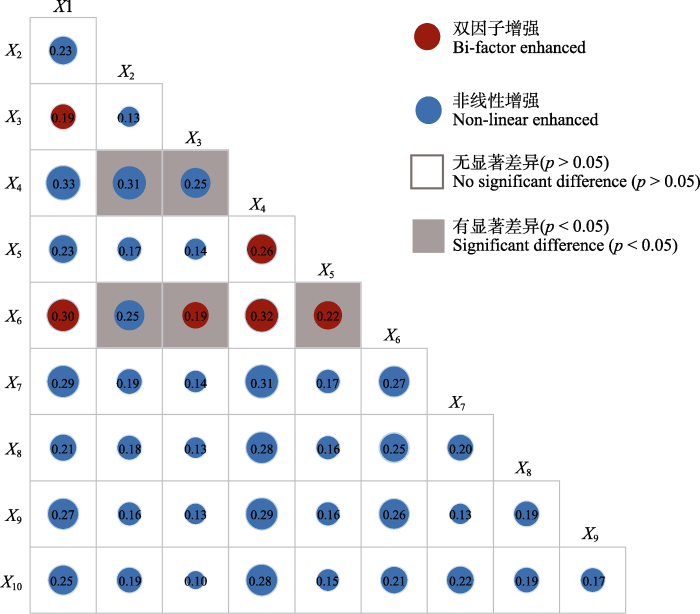
图5
科尔沁沙地驱动因子的交互作用以及显著性差异。X1-X10, 驱动因子名称, 具体见
Fig. 5
Interaction and significant difference of driving factors in Horqin Sandy Land. X1-X10, driving factors’ name, see
生态探测结果得出, q值较高的土壤类型、地貌类型对植被NDVI变化的影响显著不同于其他因子, 其中, 土壤类型和地貌类型分别与降水量以及坡度的相互作用对植被NDVI变化的影响存在显著差异; 植被类型与地貌类型对植被NDVI变化也有显著性差异。20%的驱动因子组合对植被NDVI变化的影响差异显著, 其余两两因子组合对植被NDVI的影响差异不显著。
2.2.3 自然因子与人为因子的适宜性
基于风险探测模型, 探究了驱动因子的子组之间的植被NDVI均值, 并确定每个驱动因子的合适范围或者类型(图6), 得到有利于植被生长的各因子范围或类别为: 年平均气温4.68-5.67 ℃, 年降水量529.69-547.57 mm, 坡度8°-10°, 土壤类型为淋溶土, 植被类型为针叶林及典型草原, 地貌类型为丘陵及小起伏山地, 人口密度17.64-41.26人·km-2, 累计造林面积5.56-7.89 hm2·km-2, 牲畜密度8.99-70.65头·km-2, 农作物种植面积18.89-20.18 hm2·km-2。
图6
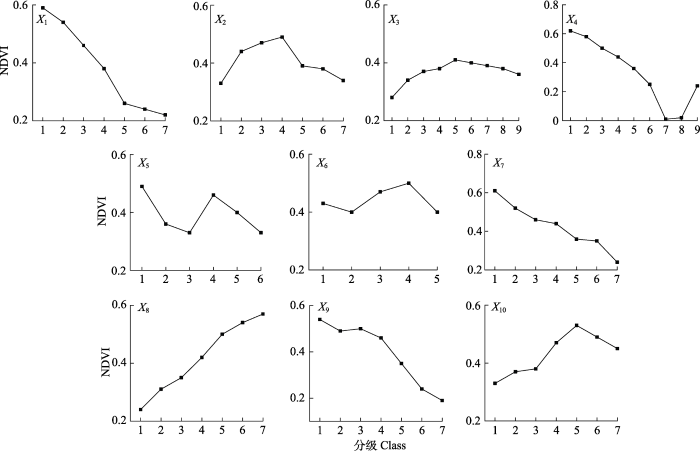
图6
科尔沁沙地归一化植被指数(NDVI)与各驱动因子分级变化。X1-X10, 驱动因子名称, 具体见
Fig. 6
Normalized Difference Vegetation Index (NDVI) changes with different grades for all driving factors in Horqin Sandy Land. X1-X10, driving factors’ name, see
3 讨论
3.1 自然因子主导植被时空分布
地理探测器驱动因子影响力研究表明, 自然因子对植被NDVI空间分布的影响更大。其中, 土壤类型对研究区植被NDVI影响最为明显, 这与Peng (2019)及Huo和Sun (2021)的结论一致。因为土壤是植物的生长基质, 对植被的空间分布具有非常重要的作用, 尤其在干旱地区(Zhang et al., 2021), 水资源有效性是干旱半干旱地区植被生长的主要限制因素, 而土壤类型对植被生长和雨水再利用效率有显著的影响(刘宪锋等, 2015), 所以土壤类型影响力最大。其次为地貌类型, 是因为地形能够显著影响土壤水分的有效性(Fan et al., 2020)。气温较降水影响力更大, 研究区纬度较高, 春季气温快速回暖有利于土壤解冻, 植被才能在有利的地温条件下返青或播种; 到了秋、冬季, 过早降温会导致牧草和林木提前枯黄(张超, 2013)。因此, 相较于降水, 科尔沁沙地植被受气温影响更明显(陈欢和任志远, 2013; 王彦颖, 2016)。
3.2 人类活动对植被产生重要影响
人为因子中, 农作物种植面积、累积造林面积对植被的影响较为明显。研究区位于北方农牧交错带, 农牧用地此消彼长的动态变化以及生态恢复工程的实施会显著影响研究区植被NDVI变化(刘孟竹等, 2021)。科尔沁沙地植被NDVI呈逐渐上升趋势, 与国家重视生态系统保护政策密不可分。该地区是国家部署“三北”防护林工程建设的重点防治区域, 进入21世纪前后国家实施的生态恢复工程项目, 诸如“退耕还林(草)”计划、“京津风沙源治理工程”、“禁牧禁伐政策”等(Zhang et al., 2012), 在很大程度上促进了科尔沁沙地植被恢复(穆少杰等, 2017)。杜云(2021)对科尔沁沙地土地利用变化研究表明, 2000-2019年该地区耕地面积占比由2000年的8.90%增加到2010年的17.49%, 到2019年达40.21%, 20年来耕地面积增长了近4倍。说明农业的发展和生态工程作用下的植被恢复一定程度上增加了该区域植被覆盖度(肖洋等, 2016)。实际上, 牲畜密度的增加也会造成草地地上生物量减少, 引起植被覆盖度变化(Zhou et al., 2018), 但由于“禁牧” “围封”等政策的实施很大程度上降低了放牧强度, 而且科尔沁沙地牲畜分布主要集中在部分以牧业为主的旗县(张思源等, 2020), 因此, 牲畜密度对整个地区植被NDVI影响力较弱。
3.3 驱动因子耦合及适宜性范围
3.4 创新与不足
植被动态变化是受控制因素及其之间的相互影响的复杂过程, 以往的研究也充分研究了科尔沁沙地不同时空尺度的植被覆盖变化, 有些以单个因素为主, 比如气象因素(马龙等, 2016; 崔珍珍等, 2021), 地形因素(Fan et al., 2020), 生态工程(Zhang et al., 2012), 也有研究综合考虑了自然因子和人为因子(吕家欣等, 2020; Wang et al., 2021), 但都是以相关性分析和回归分析方法为主, 这些方法适用于连续变量, 更多的是量化局部空间异质性, 关注局部相关性(Losada et al., 2019; Bai et al., 2022)。本研究采用了新的空间统计方法——地理探测器模型量化了科尔沁沙地植被NDVI与各驱动因子之间的关系。地理探测器方法没有线性假设, 形式简洁, 物理意义明确, 可用于测量空间分异、解释因素贡献力以及分析变量之间的相互作用(Wang et al., 2016)。另外, 本研究仍然存在一些局限性和不确定性。考虑的潜在影响因素并不全面, 比如: 土壤水分、水资源可用性、气候滞后效应、干旱时期的降水等更多的生物气候以及社会经济因素应纳入到未来的工作中, 以进一步减少其对植被动态影响的不确定性。
4 结论
近20年来, 科尔沁沙地植被NDVI整体呈上升趋势, NDVI恢复区域面积占比超过64.91%, 植被覆盖度高的地区主要分布在科尔沁沙地西北和东部地区。自然因子中土壤类型和地貌类型对研究区植被NDVI影响力最大; 人为因子中农作物种植面积对植被NDVI影响力较高; 各驱动因子交互作用最显著的是土壤类型分别与年平均气温、地貌类型的交互。研究结果得出了该地区适宜植被生长的驱动因子的类型或范围, 为进一步揭示NDVI变化驱动机制以及退化环境恢复和生态环境建设提供理论支持。
参考文献
Spatial rough set-based geographical detectors for nominal target variables
DOI:10.1016/j.ins.2021.12.019 URL [本文引用: 1]
Response of vegetation coverage to changes of precipitation and temperature in Chinese mainland
中国大陆植被覆盖对降水与温度变化的响应
Spatiotemporal variation of vegetation and climate response in Horqin Sandy Land from 1982 to 2015
1982-2015年科尔沁沙地植被时空变化及气候响应
Using the geographical detector technique to explore the impact of socioeconomic factors on PM2.5 concentrations in China
DOI:10.1016/j.jclepro.2018.11.159 URL [本文引用: 1]
Vegetation growth variation in relation to topography in Horqin Sandy Land
Spatiotemporal variation in vegetation coverage and its response to climatic factors in the Red River Basin, China
DOI:10.1016/j.ecolind.2018.04.033 URL [本文引用: 1]
Temporal and spatial patterns of land desertification sensitivity in arid regions of Northwest China
中国西北干旱区土地沙漠化敏感性时空格局
Change trends for desertified lands in the Horqin Sandy Land at the beginning of the twenty-first century
DOI:10.1007/s12665-009-0157-7 URL [本文引用: 1]
The response of vegetation growth to shifts in trend of temperature in China
DOI:10.1007/s11442-017-1407-3
[本文引用: 1]

Though many studies have focused on the causes of shifts in trend of temperature, whether the response of vegetation growth to temperature has changed is still not very clear. In this study, we analyzed the spatial features of the trend changes of temperature during the growing season and the response of vegetation growth in China based on observed climatic data and the normalized difference vegetation index (NDVI) from 1984 to 2011. An obvious warming to cooling shift during growing season from the period 1984-1997 to the period 1998-2011 was identified in the northern and northeastern regions of China, whereas a totally converse shift was observed in the southern and western regions, suggesting large spatial heterogeneity of changes of the trend of growing season temperature throughout China. China as a whole, a significant positive relationship between vegetation growth and temperature during 1984 to 1997 has been greatly weakened during 1998-2011. This change of response of vegetation growth to temperature has also been confirmed by Granger causality test. On regional scales, obvious shifts in relationship between vegetation growth and temperature were identified in temperate desert region and rainforest region. Furthermore, by comprehensively analyzing of the relationship between NDVI and climate variables, an overall reduction of impacts of climate factors on vegetation growth was identified over China during recent years, indicating enhanced influences from human associated activities.
Desertification in the Sahel: towards better accounting for ecosystem dynamics in the interpretation of remote sensing images-Science Direct
DOI:10.1016/j.jaridenv.2010.09.009 URL [本文引用: 1]
Interannual growth dynamics of vegetation in the Kuparuk River watershed, Alaska based on the Normalized Difference Vegetation Index
DOI:10.1080/0143116021000021170 URL [本文引用: 1]
Monitoring vegetation dynamic in Horqin sandy-land from spot vegetation time series imagery
Identification of health risks of hand, foot and mouth disease in China using the geographical detector technique
Spatiotemporal variation and influencing factors of vegetation dynamics based on Geodetector: a case study of the northwestern Yunnan Plateau, China
Research on the beginning period of vegetation growth season in northern China based on GIMMS 3g NDVI in the past 30 years
基于GIMMS 3g NDVI的近30年中国北部植被生长季始期变化研究
DOI:10.13249/j.cnki.sgs.2017.04.016
[本文引用: 1]
基于全球库存建模与绘图研究第三代归一化差值植被指数(GIMMS 3g NDVI)、土地利用和气温降水数据,利用NDVI时间序列谐波分析法(HANTS)重构了中国北部地区原始植被NDVI,用一元六次多项式拟合了植被生长曲线并结合逐像元动态阈值法提取了中国北部地区1983~2012年植被生长季始期并分析了其时空变化及对气温和降水的响应情况。结果表明:①GIMMS 3g NDVI具有较长的时序特征和较好的数据质量,经HANTS时间序列谐波分析后能很好的表现植被生长季曲线特征,可用于后续植被生长季的研究。② 北部地区生长季始期均值主要集中分布在80~150βd之间,全区30βa平均为111.6βd,东北平原、华北平原、河套平原、新疆天山和阿尔泰地区生长季始期早于其它区域。③ 研究时段内北部地区生长季始期总体上呈提前趋势(R<sup>2</sup>=0.19),空间上由西北向东北逐渐推移,明显提前的区域主要分布在内蒙古中东部、东北平原、陕西南部和新疆天山的部分地区,明显推迟的区域主要分布在青藏高原高寒地区。④ 因植被类型的不同和区域的差异,生长季始期对气温和降水的响应程度不同,春季气温是影响生长季始期变化的主要自然因素。
Spatio-temporal changes of vegetation coverage in Horqin District based on MODIS data
基于MODIS数据的科尔沁区植被覆盖时空变化分析
Changes in land use and carbon storage in the agro-pastoral ecotone of northern China under the background of returning farmland to forest (grass)
退耕还林(草)背景下中国北方农牧交错带土地利用及碳储量变化
DOI:10.7522/j.issn.1000-694X.2020.00073
[本文引用: 1]
为明析退耕还林(草)背景下生态环境较为脆弱的北方农牧交错带土地利用及碳储量变化,基于该区2000、2010、2018年土地利用数据,通过动态度、土地转移矩阵,景观指数等指标从土地利用变化的数量、速率以及空间格局特征加以分析,同时基于InVEST模型定量估算了该区近20年来的碳储量变化。结果表明:(1)北方农牧交错带土地利用类型以草地、耕地、林地为主,面积合计逾4.30×10<sup>5</sup> km<sup>2</sup>,占比超过91.83%;林地、建设用地显著扩张,草地与耕地有明显减少趋势,同时两者之间流转面积最多,高达1.67×10<sup>4</sup> km<sup>2</sup>,研究区景观格局总体上收敛于“集中—分散”;(2)近20年来北方农牧交错带总碳储量51.44—52.81亿t,总体呈增加趋势,碳密度稳定在110 t·hm<sup>-2</sup>左右,退耕还林(草)政策下碳储量净增加逾300万t。北方农牧交错带土地利用变化程度较为剧烈,退耕还林(草)政策不仅是土地更迭的主要驱动因素,也是该区固碳功能显著提升的重要原因。
Temporal effects of climate factors on vegetation growth in the Qingzang Plateau
DOI:10.17521/cjpe.2020.0246 URL [本文引用: 1]
气候因子对青藏高原植被生长的时间效应研究
Characteristics of temporal and spatial changes of vegetation cover in China from 1982 to 2012
1982-2012年中国植被覆盖时空变化特征
Anthropogenic contributions dominate trends of vegetation cover change over the farming- pastoral ecotone of northern China
DOI:10.1016/j.ecolind.2018.07.063 URL [本文引用: 1]
Spatial heterogeneity in Spain for senior travel behavior
DOI:10.1016/j.tourman.2018.09.011
[本文引用: 1]
Travel patterns are becoming more differentiated, influenced by new variables resulting from changes in lifestyle. The relevance of the senior segment for this industry, with the continuous aging population and their economic status, made this segment a very attractive group for the sector, and even more so in a country that is characterized by its aging, such as Spain. Spatial effects are considered a key element to understand this process, but there are only a few studies focusing on cross-cultural influences and the neighborhood context. For this purpose, the technique of geographically weighted principal component analysis (GWPCA) is applied in a novel way for the sector, showing different behavior patterns according to area of origin. The GWPCA is a localized version of the principal component analysis (PCA) used when there is a certain spatial heterogeneity in the structure of a multivariate data set. The results confirmed that GWPCA is an effective statistical methodology to research spatial heterogeneity for travel behavior, with clearly differentiated scenarios for the north, center and south of Spain, where the most determining factors in each case were hygiene and cleanliness, medical coverage and transport facilities.
Dynamic change of vegetation and its response to climate and topographic factors in the Xijiang River basin, China
DOI:10.1007/s11356-020-07692-w [本文引用: 1]
The response of vegetation NDVI in Northeast China to SPEI at different time scales
东北地区植被NDVI对不同时间尺度SPEI的响应
植被在陆地生态系统中起至关重要的作用。近年来干旱频率逐渐增加,对植被的生长发育产生严重的影响。本研究基于1982—2015年的归一化植被指数(normalized difference vegetation index,NDVI)和不同时间尺度的标准化降水蒸散指数(standardized precipitation evapotranspiration index,SPEI)的相关性来评估东北地区植被生长状况对干旱的响应。结果表明:年尺度和季尺度内NDVI和SPEI的最大相关系数值在研究区内西部内蒙古草原地区最大,东部长白山脉地区次之,中东部东北平原地区最小,且NDVI与SPEI的相关系数在12个月以上的时间尺度较大;生长季(4—10月)和夏季(6—8月)的NDVI对SPEI响应最为敏感,春季(4—5月)、秋季(9—10月)响应依次减弱;其中,5—7月的NDVI与SPEI24的显著相关像元比例较高,而8—10月的NDVI则与SPEI06的显著相关像元比例较高;不同的植被类型对干旱响应不同,森林NDVI在不同月份与不同尺度的SPEI大体上呈负相关,草原和农作物则主要以正相关为主。
Spatiotemporal changes and driving forces of vegetation in Horqin Sandy Land in the past 40 years
近40年科尔沁沙地植被时空变化及其驱动力
Response relationship between vegetation and climate factors in Horgin Sandy Land from 2000 to 2012
2000-2012年科尔沁沙地植被与气候因子间的响应关系
Research on grassland degradation control countermeasures and ways of increasing carbon sinks in Inner Mongolia
内蒙古草地退化防治对策及碳增汇途径研究
DOI:10.11733/j.issn.1007-0435.2017.02.001
[本文引用: 1]
全球变化背景下草地生态系统的退化及碳循环过程是生态学、地学、植物学和农学领域的研究热点之一。本文介绍了草地退化的概念、层次及退化现状,探讨了开垦、放牧、气候变化等人为因素和自然因素对内蒙古地区草地退化的驱动作用,重点分析了草地退化对碳循环过程的影响机制及退化草地恢复的固碳潜力,以期加深对草地生态系统退化及恢复过程中碳循环动态变化的理解。本文提出了内蒙古退化草地恢复过程中尚需解决的主要问题以及草业和畜牧业可持续发展的战略计划,以期为草地碳增汇方面的研究提供新的思路,并为决策者合理调整草地利用和保护布局提供理论基础。
A globally coherent fingerprint of climate change impacts across natural systems
DOI:10.1038/nature01286 [本文引用: 1]
Quantifying influences of natural factors on vegetation NDVI changes based on geographical detector in Sichuan, western China
Dynamic monitoring of vegetation coverage in the Wenchuan-Dujiang Weir section of the Minjiang River based on multi-temporal Landsat 5/8 images
基于多时相Landsat5/8影像的岷江汶川-都江堰段植被覆盖动态监测
An optimal parameters- based geographical detector model enhances geographic characteristics of explanatory variables for spatial heterogeneity analysis: cases with different types of spatial data
Impacts of climate change and human activities on vegetation cover in hilly southern China
DOI:10.1016/j.ecoleng.2015.04.022 URL [本文引用: 1]
Geodetector: principles and prospects
地理探测器: 原理与展望
DOI:10.11821/dlxb201701010
[本文引用: 1]
空间分异是自然和社会经济过程的空间表现,也是自亚里士多德以来人类认识自然的重要途径。地理探测器是探测空间分异性,以及揭示其背后驱动因子的一种新的统计学方法,此方法无线性假设,具有优雅的形式和明确的物理含义。基本思想是:假设研究区分为若干子区域,如果子区域的方差之和小于区域总方差,则存在空间分异性;如果两变量的空间分布趋于一致,则两者存在统计关联性。地理探测器q统计量,可用以度量空间分异性、探测解释因子、分析变量之间交互关系,已经在自然和社会科学多领域应用。本文阐述地理探测器的原理,并对其特点及应用进行了归纳总结,以利于读者方便灵活地使用地理探测器来认识、挖掘和利用空间分异性。
A measure of spatial stratified heterogeneity
DOI:10.1016/j.ecolind.2016.02.052 URL [本文引用: 1]
Spatiotemporal evolution characteristics of vegetation coverage in Fujian Province from 2000 to 2010
2000-2010年福建省植被覆盖度的时空演变特征
Desertification in China: an assessment
DOI:10.1016/j.earscirev.2008.02.001 URL [本文引用: 1]
Temporal and spatial variations in NDVI and analysis of the driving factors in the desertified areas of northern China from 1998 to 2015
China faces some of the most serious desertification in the world, leading to many problems. To solve them, large-scale ecological restoration projects were implemented. To assess their effectiveness, we analyzed normalized-difference vegetation index (NDVI) data derived from SPOT VEGETATION and gridded climate datasets from 1998 to 2015 to detect the degrees of desertification and the effects of human and climate drivers on vegetation dynamics. We found that NDVI of desertified areas generally decreased before 2000, then increased. The annual increase in NDVI was fixed dunes (0.0013) = semi-fixed dunes (0.0013) > semi-mobile dunes (0.0012) > gobi (gravel) desert (0.0011) > mobile dunes (0.0003) > saline–alkali land (0.0000). The proportions of the area of each desert type in which NDVI increased were fixed dunes (43.4%) > semi-mobile dunes (39.7%) > semi-fixed dunes (26.7%) > saline–alkali land (23.1%) > gobi desert (14.4%) > mobile dunes (12.5%). Thus, the vegetation response to the restoration efforts increased as the initial dune stability increased. The proportion of the area where desertification was dominated by temperature (1.8%) was far less than the area dominated by precipitation (14.1%). However, 67.6% of the change was driven by non-climatic factors. The effectiveness of the ecological restoration projects was significant in the Loess Plateau and in the Mu Us, Horqin, and Hulunbuir sandy lands. In contrast, there was little effect in the Badain Jaran, Ulan Buh, and Tengger deserts; in particular, vegetation cover has declined seriously in the Hunshandake Sandy Land and Alkin Desert Grassland. Thus, more or different ecological restoration must be implemented in these areas.
Vegetation cover change in Horqin Sandy Land and its relationship with climate factors
科尔沁沙地植被覆盖变化及其与气候因子的关系研究
Ecosystem quality spatial characteristics and driving forces in Inner Mongolia
内蒙古生态系统质量空间特征及其驱动力
Effectiveness of ecological restoration projects in Horqin Sandy Land, China, based on SPOT-VGT NDVI data
DOI:10.1016/j.ecoleng.2011.09.005 URL [本文引用: 2]
Analysis of driving factors of vegetation NDVI changes in Qilian Mountain National Park based on geographic detectors
基于地理探测器的祁连山国家公园植被NDVI变化驱动因素分析
Analysis of spatial and temporal changes and driving forces of vegetation NDVI in Inner Mongolia based on geographic detectors
DOI:10.11733/j.issn.1007-0435.2020.05.034
[本文引用: 1]
The study of spatiotemporal variation and driving forces of NDVI (Normalized Difference Vegetation Index) is conducive to regional ecological environment protection and natural resource management. Based on SPOT NDVI remote sensing data from 2000 to 2015 and 18 types of natural and socio-economic factors in the same period,the spatiotemporal variation characteristics of vegetation NDVI in Inner Mongolia were analyzed. Furthermore,based on the Geodetector model,we explored the spatial stratified heterogeneity and driving forces. On the spatial scale,the vegetation coverage of the whole region was characterized by high in the east and low in the west,and the region of variation was increasing in the east and decreasing in the middle and west. On the time scale,the annual NDVI showed a slow increasing trend in 16 years,with a growth rate of 0.32%·a<sup>-1</sup>. The vegetation coverage increased in both the dense grade (8.6%) and the sparse grade (2.8%),showing the feature of polarization. Annual precipitation that was the factor with the highest explanatory power (0.75),together with soil type,vegetation type and annual mean temperature,controlled the spatial pattern of vegetation NDVI. The interaction of factors showed mutual or nonlinear enhancement,and the explanatory power of interaction between human factors and natural factors was significantly enhanced. During the study period,the explanatory power of climatic factors was weakened,while the statistical factors of agriculture,forestry and animal husbandry were slightly enhanced. Here we studied the differences in explanatory power of different land use types and the optimal characteristic of each factor,which would provide scientific basis for the driving mechanism of vegetation growth.
基于地理探测器的内蒙古植被NDVI时空变化与驱动力分析
DOI:10.11733/j.issn.1007-0435.2020.05.034
[本文引用: 1]
研究植被归一化植被指数(Normalized Difference Vegetation Index,NDVI)时空变化及驱动力有助于区域生态环境保护和自然资源管理。本研究基于2000—2015年SPOT NDVI遥感数据和同时期18种自然因子与社会经济因子,分析了内蒙古植被NDVI时空变化特征,并利用地理探测器探讨其空间分异特征与驱动力。研究表明:空间尺度上,内蒙古NDVI分布呈现东北高西南低,变化格局为东部增加,中西部减少;时间尺度上,年际NDVI呈缓慢增加趋势(0.32%·a<sup>-1</sup>),并呈现高植被覆盖度(8.6%)和低植被覆盖度(2.8%)均增加的“两极化”特征。年降水量的解释力最高(0.75),与土壤类型、植被类型和年均温共同主导植被NDVI时空格局;因子交互作用为增强关系,自然因子与社会经济因子交互影响力显著增强;研究时段气候因子解释力减弱,农林牧业因子略有增强。本研究探讨了不同土地利用类型的因子解释力差异及各因子促进植被生长的最适宜范围,有助于植被生长的驱动力机制研究。
Variations and controlling factors of vegetation dynamics on the Qingzang Plateau of China over the recent 20 years
DOI:10.1016/j.geosus.2021.02.001 URL [本文引用: 1]
The impact of human activities and climate change on the vegetation of sandy grassland in Horqin
人类活动与气候变化对科尔沁沙质草地植被的影响
Long-term vegetation changes in the four mega-sandy lands in Inner Mongolia, China
DOI:10.1007/s10980-015-0151-2 URL [本文引用: 1]
Distinguishing the vegetation dynamics induced by anthropogenic factors using vegetation optical depth and AVHRR NDVI: a cross-border study on the Mongolian Plateau
