


国际通量网目前覆盖超过1 000个通量观测站点, 大部分集中于北美中东部、西欧和东亚的森林和草地生态系统; 中国通量网目前覆盖79个站点, 其中森林、草地和农田站点合计占76%, 而荒漠站仅有2个。已有研究多关注温带森林、温带草原、高寒草甸等生态系统的碳汇功能、水文效应和能量平衡, 针对沙地灌丛的研究仍相对较少, 数据可利用性较低, 制约着对干旱、半干旱区生态功能的准确评估和预测。我国北方沙地灌丛在气候上呈现水热基本同期, 季节温差巨大, 冬季严寒; 在物种组成上以C3植物为优势种, 缺乏常绿植物种; 在物候特征上, 植物展叶和枯黄时间主要受温度影响, 其次受降水影响(Biederman et al., 2018; Mu et al., 2022)。因此, 为准确评估我国生态系统碳汇规模, 服务国家“双碳”战略, 有必要提高我国北方干旱半干旱区灌丛生态系统的数据可利用性, 研制、公开生态系统通量观测共享数据产品。
宁夏盐池毛乌素沙地生态系统定位观测研究站(下文简称“盐池站”)地处毛乌素沙地南缘, 位于干旱、半干旱气候过渡带、农牧区交错带。以黑沙蒿(Artemisia ordosica)为优势种的灌丛群落是毛乌素沙地最具代表性的植物群落类型, 在沙地生态系统恢复中起重要作用。自2011年6月以来, 采用涡度协方差技术对典型黑沙蒿灌丛生态系统碳水热通量及相关气象因子进行长期连续监测。基于观测数据, 探究了生态系统净CO2交换(NEE)和蒸散发的昼夜、季节和年际变化规律, 明晰了生物、非生物因素对碳水平衡的影响机理, 并以论文电子附件等形式公开了部分月尺度研究数据(Jia et al., 2014, 2016, 2018, 2020; Mu et al., 2022)。
本文整理了2012-2016年盐池站多时间尺度(半小时、日、月、年)的碳水热通量和相关气象数据。经过通量计算、质量控制、缺失值插补和通量拆分等处理步骤, 确保数据的可靠性、完整性、综合性。该数据集可为评估与预测区域碳水平衡特征提供数据支撑, 为整合分析补充有区域代表性的生态系统类型。
1 材料和方法
1.1 站点概况
盐池站(37.71° N, 107.23° E, 海拔高度1 530 m)位于宁夏回族自治区盐池县, 毛乌素沙地南缘, 地处干旱、半干旱气候过渡带、农牧区交错带。属于典型的中温带大陆性气候, 冬季干燥寒冷, 夏季高温多雨, 多年平均气温8.3 ℃, 最高月平均气温为25.2 ℃ (7月), 最低月平均气温为-13.8 ℃ (12月)。多年平均降水量293 mm, 年际间波动较大(140-587 mm), 约80%的降水集中在4-10月。多年平均潜在蒸散量约为1 300 mm (气象数据来源于盐池气象站和盐池站, 见Mu et al., 2022)。土壤类型以风沙土为主(砂、粉、黏粒占比分别为96.6%、3.2%和0.2%), 0-10 cm深度土壤密度约为1.50 g·cm-3, 田间持水量约为20%, 凋萎点约为3.6% (Miao et al., 2020; Mu et al., 2022)。0-10 cm表层土壤总氮含量为0.1-0.2 g·kg-1, 有机碳含量约为2.0 g·kg-1 (Jiang et al., 2021)。主要植被类型为沙生灌丛, 植被盖度约为70%, 黑沙蒿为优势物种, 其他木本植物包括蒙古羊柴(Corethrodendron fruticosum var. mongolicum)、细枝羊柴(C. scoparium)和北沙柳(Salix psammophila); 草本植物主要为赖草(Leymus secalinus)、白草(Pennisetum flaccidum)、沙生针茅(Stipa caucasica subsp. glareosa)、角蒿(Incarvillea sinensis)和华北白前(Vincetoxicum mongolicum)等。植被高度为1.0-1.5 m, 生物量为350-600 g·m-2, 叶面积指数为0-1.2 m2·m-2 (Jia et al., 2014; Jiang et al., 2021; Mu et al., 2022)。优势灌木物种的根系主要分布于20-50 cm深度, 因此无法获取地下水(深度超过8 m), 降水对土壤水分的补给是植物根系吸水的唯一来源(Jia et al., 2016)。
1.2 野外观测
野外观测设备的安装、调试主要在2011年6-10月完成, 主要包括涡度协方差观测系统和微气象观测系统(表1)。
表1 宁夏盐池毛乌素沙地黑沙蒿灌丛生态系统通量和气象观测指标、观测仪器和数据采集器信息
Table 1
| 观测系统 Measurement system | 数据采集器 (制造商) Datalogger (manufacturer) | 观测指标 Measured variable | 仪器型号 (制造商) Instrument model (manufacturer) |
|---|---|---|---|
| 通量观测系统 Flux measurement system | LI-7550 (LI-COR, Lincoln, USA) | 大气压 Atmospheric pressure | LI-7200 (LI-COR, Lincoln, USA) |
| 碳水通量 Carbon and water flux | LI-7200 (LI-COR, Lincoln, USA) | ||
| 潜热、显热通量 Latent heat and sensible heat flux | LI-7200 (LI-COR, Lincoln, USA) | ||
| 三维超声风速 3D sonic anemometer | CSAT-3 (Campbell, Logan, USA) | ||
| 气象观测系统 Meteorological measurement system | CR200X (Campbell, Logan, USA) | 降雨量 Rainfall | TR-525M (Texas Electronics, Dallas, USA) |
| CR3000 (Campbell, Logan, USA) | 空气温度 Air temperature | HMP155A (Vaisala, Helsinki, Finland) | |
| 相对湿度 Relative humidity | HMP155A (Vaisala, Helsinki, Finland) | ||
| 饱和水汽压差 Vapor pressure deficit | HMP155A (Vaisala, Helsinki, Finland) | ||
| 风速 Wind speed | 034B (Met-One Instruments, Grants Pass, USA) | ||
| 风向 Wind direction | 034B (Met-One Instruments, Grants Pass, USA) | ||
| 太阳辐射 Solar radiation | CMP3 (Kipp & Zonen, Delft, The Netherlands) | ||
| 净辐射 Net radiation | CNR-4 (Kipp & Zonen, Delft, The Netherlands) | ||
| 光合有效辐射 Photosynthetically active radiation | PAR-LITE (Kipp & Zonen, Delft, The Netherlands) | ||
| 土壤热通量 Soil heat flux | HFP01 (Hukseflux Thermal Sensors, Delft, The Netherlands) | ||
| 土壤温度 Soil temperature | ECH2O-5TE (METER Environment, Pullman, USA) | ||
| EM50 (METER Environment, Pullman, USA) | 土壤含水量 Soil water content | ECH2O-5TE (METER Environment, Pullman, USA) |
涡度协方差观测系统: 主要由三维超声风速仪和闭路红外气体分析仪组成。涡度协方差系统安装在观测塔上, 距地面高度为6.2 m, 下垫面平坦(坡度<1°), 各个方向植被盖度和物种组成相似, 90%以上的通量足迹来自于上风向220 m范围内。原始数据测定频率为10 Hz, 由数据采集器记录, 由维护人员每周下载, 并离线计算半小时通量数值。定期对涡度协方差系统进行现场标定、光路清洁、气路清洁和过滤网更换等维护工作, 保证系统运行状态良好。
微气象观测系统: 观测塔上安装了各类型传感器, 对气象环境变量开展同步观测, 微气象传感器的观测高度均为6 m, 观测指标包括空气温度、相对湿度、风速、风向、太阳辐射(总辐射)、净辐射和光合有效辐射。在观测塔周围10 m范围内不同方向的3个位置挖掘土壤剖面, 埋设传感器, 测定土壤温度和体积含水率, 测量深度为10 cm和30 cm。在观测塔周围10 m范围内不同方向的5个位置埋设土壤热通量传感器(10 cm深度), 测定土壤热通量, 并根据0-10 cm土壤热储量变化率对土壤热通量数值进行校正(Ochsner et al., 2007)。上述指标采集频率均为0.1 Hz。选取观测塔周围约50 m距离不同方向的3个位置, 在2 m高度架设翻斗式雨量筒, 测定降雨量(精度0.1 mm)。大气压由涡度协方差系统的闭路红外气体分析仪中内置的气压传感器测定。由不同的数据采集器计算并存储上述指标的半小时数值(详见表1)。
1.3 数据处理
采用EddyPro 7.0.2软件(LI-COR, Lincoln, USA)对涡度协方差系统观测的10 Hz原始数据进行计算, 得到半小时通量数据(包括CO2通量、潜热通量(LE)和显热通量(Hs))。主要计算步骤包括剔除异常值、二次坐标旋转、频率损失校正、时间延迟校正、去趋势和通量计算等(Jia et al., 2020)。由于LI-7200闭路式气体分析仪(LI-COR, Lincoln, USA)可以直接输出气体混合比(不受气体密度影响), 因此没有进行密度校正(即Webb-Pearman-Leuning (WPL)校正)。采用中位数绝对偏差法(median of absolute deviation about the median, MAD) (Papale et al., 2006)对半小时通量数据进行异常值剔除。
采用边际分布抽样算法(marginal distribution sampling, MDS)进行半小时通量数据的缺失值插补, 该算法的窗口大小随着太阳辐射、温度和饱和水汽压差等气象数据的可利用性改变, 大多数情况下为1-14天, 随着气象数据可利用性下降, 时间窗口最大可扩展至140天, 具体算法流程详见Wutzler等(2018)。微气象变量的缺失值优先采用与其他相关指标的回归关系进行插补(如光合有效辐射和太阳辐射的关系), 当无法建立回归关系时, 则采用MDS法进行插补(Reichstein et al., 2005; Wutzler et al., 2018)。因缺乏可靠算法, 未对大气压、风向和土壤含水量进行缺失值插补, 缺失值用NA表示。大气压、风向和土壤含水量的整体缺失值占比分别为5.5%、6.3%和0.006%。
在缺失值插补后, 将日间NEE拆分成总初级生产力(GPP)和Re。首先, 采用Lloyd & Taylor模型(Lloyd & Taylor, 1994)建立夜间Re的温度响应函数:
式中, T0是恒值, 为-46.02 ℃; Ta指空气温度; Tref为参考温度, 为15 ℃; Reref指参考温度下的生态系统呼吸速率; E0指活化能, 能够量化Re的温度敏感性。计算E0时, 将时间序列分割为每15天一段, 应用公式(1)进行回归分析, 并通过多个时段的加权平均(权重为E0标准误的倒数), 得到每年一个E0值。计算Reref时, 将时间序列分割为每4天一段, 围绕其中心时间点, 建立7天的时间窗口, 应用公式(1)进行回归分析, 将得到的Reref值赋给中心时间点, 最后进行线性插值, 得到每半小时的Reref。再利用公式(1)计算日间Re, 并最终得到GPP和净生态系统生产力(NEP):
数据集中未包括半小时尺度生态系统蒸散发(ET)数据, 数据使用者可采用LE计算ET (mm):
式中, λ为水的汽化潜热(2.45 kJ·g-1), ρ为水的密度(1 g·cm-3)。
1.4 数据集质量检验
1.4.1 有效数据占比
统计质量控制后半小时NEE、LE和Hs通量数据缺失率, 计算得出各年份3个指标的有效观测数据占比。
1.4.2 能量闭合评估
表面能量闭合是根据生态系统能量输入和输出的一致性, 判定通量观测系统运行状况和数据可靠程度的常用指标。陆地生态系统的表面能量平衡方程为:
式中, Rn为净辐射, G为土壤热通量, Hs为显热通量, LE为潜热通量, Fs为冠层储热, Q为其他能量输出项。其中Fs和Q占比例较小, 且难以被测量获取, 因此忽略不计, 采用湍流能量(LE + Hs)和辐射有效能(Rn - G)进行能量闭合评估。
当前学界常用的两种能量闭合评价方法是最小二乘法线性回归法(OLS)和能量平衡比率法(EBR) (McGloin et al., 2018)。对于(LE + Hs)和(Rn - G), OLS方法和EBR的计算方式分别为拟合回归曲线和计算比值, 具体公式如下:
式中, a为斜率, b为截距。
2 结果
2.1 数据集描述
本数据集为2012-2016年宁夏盐池毛乌素沙地黑沙蒿灌丛生态系统通量观测数据, 存储为Excel文件, 文件夹命名分别为“通量观测数据”和“气象观测数据”, 每个文件夹内按照时间尺度划分为“半小时尺度.xlsx ”、“日尺度.xlsx”、“月尺度.xlsx”和“年尺度.xlsx”, 共8个“.xlsx”文件, 总数据量约为21.4 MB (附录)。
表2 盐池站半小时通量观测数据表单内容
Table 2
| 数据项 Data item | 计量单位 Unit |
|---|---|
| 年 Year | - |
| 月 Month | - |
| 日 Day | - |
| 时 Hour | - |
| 分 Minute | - |
| 潜热通量 Latent heat flux | W·m-2 |
| 显热通量 Sensible heat flux | W·m-2 |
| 总初级生产力 Gross primary productivity | mg C·m-2·s-1 |
| 生态系统呼吸 Ecosystem respiration | mg C·m-2·s-1 |
| 生态系统净CO2交换 Net ecosystem CO2 exchange | mg C·m-2·s-1 |
-, 无数据。
-, no data.
表3 盐池站微气象半小时观测数据表单内容
Table 3
| 数据项 Data item | 计量单位 Unit | 数据项说明 Description |
|---|---|---|
| 年 Year | - | 年份 Year |
| 月 Month | - | 月份 Month |
| 日 Day | - | 日期 Day |
| 时 Hour | - | 小时 Hour |
| 分 Minute | - | 分钟 Minute |
| 空气温度 Air temperature | ℃ | 冠层上方平均空气温度 Mean air temperature above canopy |
| 相对湿度 Relative humidity | % | 冠层上方平均相对湿度 Mean relative humidity above canopy |
| 饱和水汽压差 Vapor pressure deficit | kPa | 冠层上方饱和水汽压差 Vapor pressure deficit above canopy |
| 大气压 Atmospheric pressure | kPa | 大气压强 Atmospheric pressure |
| 风速 Wind speed | m·s-1 | 冠层上方风速 Wind speed above canopy |
| 风向 Wind direction | ° | 冠层上方风向 Wind direction above canopy |
| 太阳辐射 Solar radiation | W·m-2 | 太阳总辐射 Total solar radiation |
| 净辐射 Net radiation | W·m-2 | 净辐射 Net radiation |
| 光合有效辐射 Photosynthetically active radiation | µmol·m-2·s-1 | 光合有效辐射 Photosynthetically active radiation |
| 土壤热通量 Soil heat flux | W·m-2 | 土壤热通量 Soil heat flux |
| 一层土壤(10 cm)温度 10 cm soil temperature | ℃ | 距地表10 cm土壤温度 Soil temperature 10 cm underground |
| 二层土壤(30 cm)温度 30 cm soil temperature | ℃ | 距地表30 cm土壤温度 Soil temperature 30 cm underground |
| 一层土壤(10 cm)含水量 10 cm soil water content | m3·m-3 | 距地表10 cm土壤水分 Soil water content 10 cm underground |
| 二层土壤(30 cm)含水量 30 cm soil water content | m3·m-3 | 距地表30 cm土壤水分 Soil water content 30 cm underground |
| 降雨量 Rainfall | mm | 降雨量 Rainfall |
-, 无数据。
-, no data.
图1
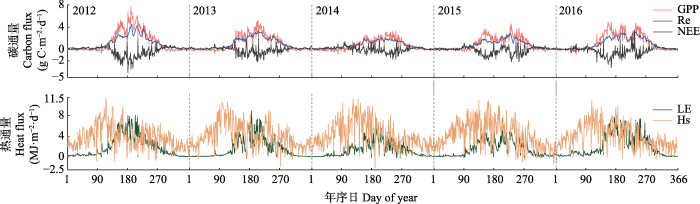
图1
盐池站碳通量和热通量逐日值在2012-2016年期间的变化动态。GPP, 总初级生产力; Hs, 显热通量; LE, 潜热通量; NEE, 净生态系统CO2交换; Re, 生态系统呼吸。
Fig. 1
Temporal variations in daily carbon and heat fluxes at Yanchi Research Station during 2012-2016. GPP, gross primary productivity; Hs, sensible heat flux; LE, latent heat flux; NEE, net ecosystem CO2 exchange; Re, ecosystem respiration.
图2
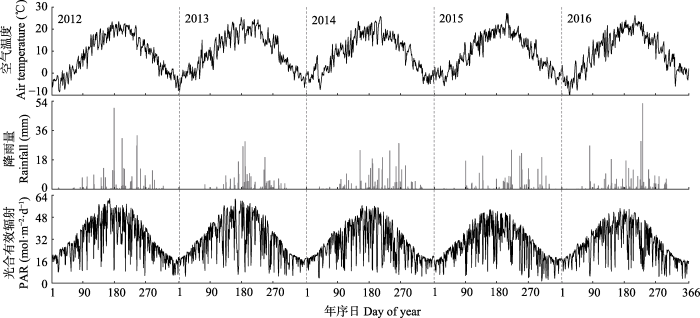
图2
盐池站空气温度、降雨量、光合有效辐射逐日值在2012-2016年期间的变化动态。
Fig. 2
Temporal variations in daily mean air temperature, daily total rainfall and daily mean photosynthetically active radiation (PAR) at Yanchi Research Station during 2012-2016.
2.2 有效数据占比
经过质量控制的NEE、LE和Hs的有效观测数据在5年间平均占比分别为60.08%、88.51%和86.57%, 不同年份间有效观测数据占比变化范围分别为56.23%-62.19%、79.40%-94.12%和77.56%-91.27%, 其中2015和2013年3项指标的有效数据占比分别为最高和最低的年份。可以看出, 各项通量指标在5年观测期内有效数据占比较高, 未出现长时间的数据缺失情况, 数据可信度较高。具体各年的有效数据占比情况如表4所示。
表4 盐池站2012-2016年通量观测有效数据占比
Table 4
| 年份 Year | NEE (%) | LE (%) | Hs (%) |
|---|---|---|---|
| 2012 | 59.89 | 91.23 | 90.84 |
| 2013 | 56.23 | 79.40 | 77.56 |
| 2014 | 61.53 | 90.03 | 88.33 |
| 2015 | 62.19 | 94.12 | 91.27 |
| 2016 | 60.56 | 87.78 | 84.86 |
| 平均 Mean | 60.08 | 88.51 | 86.57 |
Hs, 显热通量; LE, 潜热通量; NEE, 净生态系统CO2交换。
Hs, sensible heat flux; LE, latent heat flux; NEE, net ecosystem CO2 exchange.
2.3 能量闭合分析
采用EBR评价盐池毛乌素沙地灌丛年尺度和月尺度能量闭合状况。在年尺度(表5), 5年EBR平均值为0.81, 不同年份间EBR变化范围为0.78 (2014年) 至0.83 (2013年)。在月尺度(表6), 不同年份间EBR月平均值为0.83 (2014年)至0.90 (2013年), 与年尺度所得结果相同。不同月份间, 5年平均月尺度EBR变化范围为0.67-1.06, 其中EBR较高的月份多集中在1月和12月, 5年平均值与1.00接近; EBR较低的月份多集中在7-9月, 5年均值在0.70左右。无论是在年尺度还是月尺度, EBR的值均较高, 能量不闭合程度小于30%, 说明数据质量较为可靠。
表5 盐池站2012-2016年通量观测年尺度能量平衡比率
Table 5
| 年份 Year | 能量平衡比率 EBR |
|---|---|
| 2012 | 0.83 |
| 2013 | 0.83 |
| 2014 | 0.78 |
| 2015 | 0.80 |
| 2016 | 0.80 |
| 平均 Mean | 0.81 |
表6 盐池站2012-2016年通量观测月尺度能量平衡比率
Table 6
| 月份 Month | 年份 Year | 平均 Mean | ||||
|---|---|---|---|---|---|---|
| 2012 | 2013 | 2014 | 2015 | 2016 | ||
| 1 | 1.10 | 1.19 | 1.08 | 0.86 | 0.90 | 1.03 |
| 2 | 0.96 | 1.06 | 0.82 | 0.92 | 0.96 | 0.94 |
| 3 | 0.90 | 0.99 | 0.95 | 0.93 | 0.90 | 0.93 |
| 4 | 0.97 | 0.96 | 0.80 | 0.82 | 0.83 | 0.87 |
| 5 | 0.82 | 0.85 | 0.82 | 0.81 | 0.69 | 0.80 |
| 6 | 0.81 | 0.79 | 0.79 | 0.79 | 0.82 | 0.80 |
| 7 | 0.72 | 0.64 | 0.68 | 0.77 | 0.77 | 0.72 |
| 8 | 0.72 | 0.78 | 0.63 | 0.77 | 0.71 | 0.72 |
| 9 | 0.72 | 0.65 | 0.59 | 0.62 | 0.79 | 0.67 |
| 10 | 0.86 | 0.88 | 0.79 | 0.82 | 0.75 | 0.82 |
| 11 | 0.88 | 0.88 | 0.91 | 0.68 | 1.00 | 0.87 |
| 12 | 1.01 | 1.12 | 1.04 | 1.13 | 0.98 | 1.06 |
| 平均 Mean | 0.87 | 0.90 | 0.83 | 0.83 | 0.84 | 0.85 |
本研究采用OLS方法评价盐池毛乌素沙地灌丛在不同年份和季节上日尺度能量闭合程度的边际值。在不同年份间(图3), 决定系数(R2)和OLS回归方程的斜率(a)变化范围分别为0.83-0.88和0.73-0.79, 其中R2最高和最低的年份分别为2015、2016年(图3D、3E)和2014年(图3C), a最高和最低的年份分别为2015年(图3D)和2014年(图3C)。图3F为5年总体的日尺度能量闭合状况, R2和a分别为0.86和0.75。在不同季节间(图4), R2和a分别为0.78-0.80和0.73-0.92, 其中R2和a最高和最低的季节均为夏季(图4B)和秋季(图4C)。无论是在不同年份还是不同季节, R2和a均较高, 说明数据受随机误差影响较小, 能量闭合程度较好。
图3
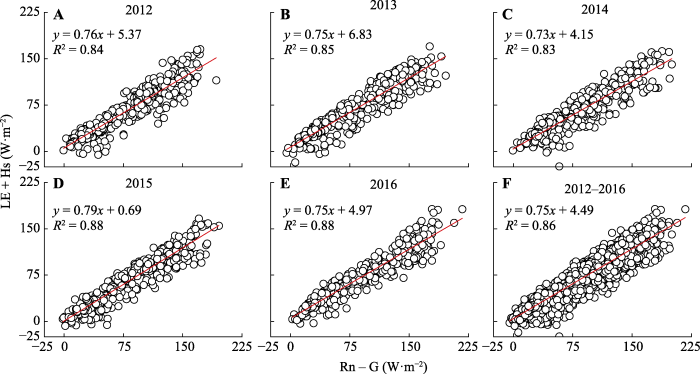
图3
盐池站2012-2016年间不同年份间通量逐日数据能量闭合回归分析。G, 土壤热通量; Hs, 显热通量; LE, 潜热通量; Rn, 净辐射。
Fig. 3
Regression analysis on the energy balance closure of daily flux values at Yanchi Research Station for different years during 2012-2016. G, soil heat flux; Hs, sensible heat flux; LE, latent heat flux; Rn, net radiation.
图4
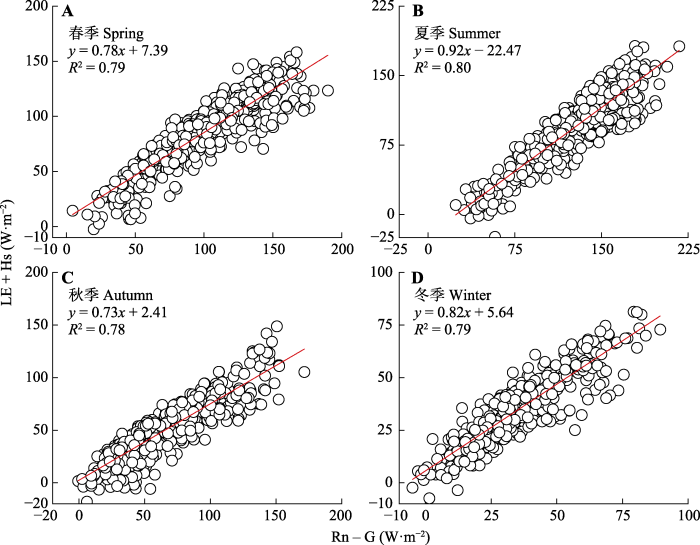
图4
盐池站2012-2016年间不同季节间通量逐日数据能量闭合回归分析。G, 土壤热通量; Hs, 显热通量; LE, 潜热通量; Rn, 净辐射。
Fig. 4
Regression analysis on the energy balance closure of daily flux values at Yanchi Research Station for different seasons during 2012-2016. G, soil heat flux; Hs, sensible heat flux; LE, latent heat flux; Rn, net radiation.
3 讨论
依托宁夏盐池毛乌素沙地生态系统国家定位观测研究站, 于2012-2016年, 对毛乌素沙地典型黑沙蒿灌丛生态系统的碳水热通量及相关微气象因子进行连续观测。通过对原始观测数据进行通量计算、质量控制、缺失值插补和碳通量拆分, 生成各时间尺度(半小时、日、月、年)生态系统碳水热通量观测数据集。数据集所含数据项较为全面, 包括常用的碳水热通量数据以及空气温湿度、风速风向、太阳辐射、光合有效辐射、净辐射、土壤温度、土壤含水量和降雨量等气象数据。通量计算、质量控制、缺失值插补和碳通量拆分等数据计算处理流程, 均采用国际通量学界的主流方法和规范软件包 (“EddyPro”、“REddyProc”等)完成。在观测期间定期对仪器设备进行标定维护, 数据精度好, 有效数据占比高, 能量闭合程度处于FLUXNET和ChinaFLUX站点的中等水平(Wilson et al., 2002; Li et al., 2005), 说明数据质量较好, 能够为不同时空尺度研究提供较好的数据支撑。
本数据集观测站点位于毛乌素沙地南缘的黑沙蒿灌丛生态系统, 该区域在20世纪中后期曾经历严重的荒漠化, 尽管近20多年生态恢复成效显著, 但生态系统仍对气候变化和人类活动干扰极为敏感, 稳定性较差, 是北方的典型脆弱生态系统类型。此外, 在全国甚至全球范围内, 类似气候特征、土壤特征和植物群落组成的通量站点目前仍很少。因此, 本数据集在区位、气候、植被类型上具有一定的独特性和代表性, 可补充和提升已有站点观测数据的覆盖面, 有助于全面认识陆地生态系统的碳水循环规律和准确评估区域碳水平衡。本数据集的碳通量指标表现出较大的年际变化: Re为300 (2014年) -426 (2012年) g C·m-2·a-1、GPP为277 (2014年) -503 (2012年) g C·m-2·a-1、NEE为-77 (2012年) -23 (2014年) g C·m-2·a-1; 5年中仅2014年为净碳源, 其他4年均为净碳汇(Jia et al., 2016, 2018, 2020)。该站点前期研究表明, 白天NEE的光响应和夜间NEE的温度响应均受到30 cm深度土壤含水量的调控(Jia et al., 2014, 2018, 2020; Liu et al., 2019); 秋季降雨减少可引发次年春季干旱, 进而对NEE产生滞后影响, 并导致NEE与当年降水量解耦(Jia et al., 2016); 生长季Re与GPP关系的斜率约为0.5, 即大约50%的总初级生产增量分配给生态系统呼吸(Jia et al., 2020); 光合有效辐射是NEE在日和月尺度变化的主导因子, 温度则通过影响植被物候进而驱动NEE在整个生长季到全年的动态变化(Jia et al., 2018); ET的年际间变化范围为194 mm (2014年)至297 mm (2016年), 其在小时和日尺度的变化主要受土壤水分和饱和水汽压差调控, 季节变化主要受叶面积指数和表面导度调控(Mu et al., 2022); 降雨量与年ET、湿季(7-11月) ET和旱季(12-6月) ET解耦, 湿季ET通常小于同期降雨量, 而旱季ET通常大于同期降雨量, 表明水文损失(深层入渗、地下径流等)和土壤水分的遗留效应在生态系统水量平衡中具有重要作用(Mu et al., 2022)。
本数据集中的碳水热通量数据均经过质量控制和数据插补等处理步骤, 部分数据为估算值, 本质上与气象变量之间不独立, 因此在进行单站点机理性分析时应对结果谨慎考虑。此外, 国际通量网(FLUXNET)目前的标准数据处理流程采用R软件包“REddyProc”进行通量数据缺失值插补和拆分(Wutzler et al., 2018; Pastorello et al., 2020), 由于各个站点的生长季开始和结束时间不同, 为增强算法的广泛适用性, 该拆分算法默认对全年数据进行计算。本数据集也是采用该算法生成, 因此即使在非生长季, GPP也不为0, 其围绕0的微小变化代表观测和拆分模型的随机误差。许多已有研究也采用了相似的数据处理方式(如Barr et al., 2007; Gu et al., 2018; Wutzler et al., 2018; Jia et al., 2020)。本数据集使用者如有需要, 可自行确定生长季的开始和结束时间, 并将非生长季的GPP强制赋值为0, 将非生长季的Re强制赋值为NEE, 此处理对结果影响很小。
致谢
感谢宁夏回族自治区盐池县自然资源局的杨学武、刘世君在野外观测、仪器维护和数据采集工作中给予的帮助。
附录 宁夏盐池毛乌素沙地黑沙蒿灌丛生态系统通量观测数据集(2012-2016)
Supplement A dataset of ecosystem fluxes in a shrubland ecosystem of Mau Us Sandy Land in Yanchi, Ningxia, China (2012-2016)
参考文献
Carbon cycle. The dominant role of semi-arid ecosystems in the trend and variability of the land CO2 sink
DOI:10.1126/science.aaa1668
PMID:25999504
[本文引用: 1]

The growth rate of atmospheric carbon dioxide (CO2) concentrations since industrialization is characterized by large interannual variability, mostly resulting from variability in CO2 uptake by terrestrial ecosystems (typically termed carbon sink). However, the contributions of regional ecosystems to that variability are not well known. Using an ensemble of ecosystem and land-surface models and an empirical observation-based product of global gross primary production, we show that the mean sink, trend, and interannual variability in CO2 uptake by terrestrial ecosystems are dominated by distinct biogeographic regions. Whereas the mean sink is dominated by highly productive lands (mainly tropical forests), the trend and interannual variability of the sink are dominated by semi-arid ecosystems whose carbon balance is strongly associated with circulation-driven variations in both precipitation and temperature. Copyright © 2015, American Association for the Advancement of Science.
Climatic controls on the carbon and water balances of a boreal aspen forest, 1994-2003
DOI:10.1111/gcb.2007.13.issue-3 URL [本文引用: 1]
Shrubland carbon sink depends upon winter water availability in the warm deserts of North America
DOI:10.1016/j.agrformet.2017.11.005 URL [本文引用: 1]
Eddy covariance technique and its applications in flux observations of terrestrial ecosystems
DOI:10.17521/cjpe.2019.0351 URL [本文引用: 2]
涡度相关技术及其在陆地生态系统通量研究中的应用
DOI:10.17521/cjpe.2019.0351
[本文引用: 2]
通量观测是定量描述土壤-植被-大气间物质循环和能量交换过程的基础。涡度相关技术作为直接测量植被冠层与大气间能量与物质交换通量的技术手段, 已经逐步发展成为国际通用的通量观测标准方法。随着涡度相关技术在全球碳水循环研究中的广泛应用, 长期连续的通量观测正在为准确评价生态系统碳固持能力、水分和能量平衡状况、生态系统对全球气候变化的反馈作用、区域和全球尺度模型的优化与验证、极端事件对生态系统结构与功能影响等方面的研究提供重要数据支撑和机制理解途径。通过站点尺度通量长期动态观测, 明确了不同气候区和植被类型生态系统碳水通量强度基线及其季节与年际变异特征。通过多站点联网观测, 在区域和全球尺度研究生态系统碳通量空间变异特征, 揭示了区域尺度上温度和降水对生态系统碳通量空间格局的生物地理学控制机制。该文概括地介绍了涡度相关技术的基本原理、假设与系统构成, 总结了涡度通量长期联网观测在陆地生态系统碳水通量研究中的主要应用, 并对通量研究发展前景进行了展望。
A novel integrated method based on a machine learning model for estimating evapotranspiration in dryland
Potential and environmental control of carbon sequestration in major ecosystems across arid and semi-arid regions in China
DOI:10.1016/j.scitotenv.2018.07.139 URL [本文引用: 1]
Seasonal and interannual variations in ecosystem respiration in relation to temperature, moisture, and productivity in a temperate semi-arid shrubland
Carbon and water exchange over a temperate semi-arid shrubland during three years of contrasting precipitation and soil moisture patterns
Multi-scale dynamics and environmental controls on net ecosystem CO2 exchange over a temperate semiarid shrubland
DOI:10.1016/j.agrformet.2018.05.009 URL [本文引用: 4]
Biophysical controls on net ecosystem CO2 exchange over a semiarid shrubland in northwest China
DOI:10.5194/bg-11-4679-2014
URL
[本文引用: 4]
. The carbon (C) cycling in semiarid and arid areas remains largely unexplored, despite the wide distribution of drylands globally. Rehabilitation practices have been carried out in many desertified areas, but information on the C sequestration capacity of recovering vegetation is still largely lacking. Using the eddy-covariance technique, we measured the net ecosystem CO2 exchange (NEE) over a recovering shrub ecosystem in northwest China throughout 2012 in order to (1) quantify NEE and its components and to (2) examine the dependence of C fluxes on biophysical factors at multiple timescales. The annual budget showed a gross ecosystem productivity (GEP) of 456 g C m−2 yr−1 (with a 90% prediction interval of 449–463 g C m−2 yr−1) and an ecosystem respiration (Re) of 379 g C m−2 yr−1 (with a 90% prediction interval of 370–389 g C m−2 yr−1), resulting in a net C sink of 77 g C m−2 yr−1 (with a 90% prediction interval of 68–87 g C m−2 yr−1). The maximum daily NEE, GEP and Re were −4.7, 6.8 and 3.3 g C m−2 day−1, respectively. Both the maximum C assimilation rate (i.e., at the optimum light intensity) and the quantum yield varied over the growing season, being higher in summer and lower in spring and autumn. At the half-hourly scale, water deficit exerted a major control over daytime NEE, and interacted with other stresses (e.g., heat and photoinhibition) in constraining C fixation by the vegetation. Low soil moisture also reduced the temperature sensitivity of Re (Q10). At the synoptic scale, rain events triggered immediate pulses of C release from the ecosystem, followed by peaks of CO2 uptake 1–2 days later. Over the entire growing season, leaf area index accounted for 45 and 65% of the seasonal variation in NEE and GEP, respectively. There was a linear dependence of daily Re on GEP, with a slope of 0.34. These results highlight the role of abiotic stresses and their alleviation in regulating C cycling in the face of an increasing frequency and intensity of extreme climatic events.\n
Plant nutrient contents rather than physical traits are coordinated between leaves and roots in a desert shrubland
Although leaf economics spectrum (LES) has been extensively tested with regional and global datasets, the correlation among functional traits of desert plants remains largely unclear. Moreover, examinations on whether and how leaf and root traits are coordinated have yielded mixed results. We investigated variations in leaf and fine-root traits across 48 species in a desert community of northern China to test the hypotheses that (1) the leaf-trait syndrome of plant species in desert shrublands follows the predictions of the global LES, and is paralleled by a similar root-trait syndrome, (2) functional traits related to nutrient contents and resource uptake are tightly coordinated between leaves and fine roots in desert ecosystems where plant growth is limited primarily by dry and nutrient-poor conditions, and (3) traits as well as their relationships vary among functional groups. Our results partially supported the LES theory. Specific leaf area (SLA) was correlated with leaf tissue density, phosphorus content, and carbon-to-nitrogen ratio, but not with leaf nitrogen content. Specific root length (SRL) was not correlated with other fine-root traits, and fine-root traits were largely independent of each other. Therefore, fine-root traits did not mirror the leaf-trait syndrome. Fine-root nitrogen and phosphorus contents, nitrogen-to-phosphorous ratio, and carbon-to-nitrogen ratio all increased with analogous leaf traits, whereas SRL was not correlated with SLA. After phylogenetic effects were considered, nutrient contents and their ratios still displayed stronger coordination between leaves and fine roots than did SRL and SLA. The overall pattern of trait variations and relationships suggested differentiation among functional groups. Our results suggest that despite the absence of a root-trait syndrome, fine-root functions in the studied desert community were probably coordinated with leaf functions with respect to nutrient allocation and use.
Energy balance closure at ChinaFLUX sites
Different effects of spring and summer droughts on ecosystem carbon and water exchanges in a semiarid shrubland ecosystem in northwest China
DOI:10.1007/s10021-019-00379-5 [本文引用: 1]
On the temperature dependence of soil respiration
DOI:10.2307/2389824 URL [本文引用: 1]
Energy balance closure at a variety of ecosystems in Central Europe with contrasting topographies
DOI:10.1016/j.agrformet.2017.10.003 URL [本文引用: 1]
Chemoheterotrophic diazotrophs contribute to nitrogen incorporation in a semi-arid desert
DOI:10.1007/s00374-020-01492-7 [本文引用: 1]
Hydrological losses and soil moisture carryover affected the relationship between evapotranspiration and rainfall in a temperate semiarid shrubland
Soil heat storage measurements in energy balance studies
DOI:10.2134/agronj2005.0103S
URL
[本文引用: 1]
Energy balance studies require knowledge of the heat flux at the soil surface. This flux is determined by summing the heat flux at a reference depth (zr) some centimeters below the surface and the rate of change of heat storage in the soil above zr. The rate of change of heat storage, or heat storage for short (ΔS), is calculated from soil volumetric heat capacity (C) and temperature. The objectives of this study were to determine how choices regarding zr, C measurements, and ΔS calculations all affect the accuracy of ΔS data. Heat transfer theory and data from three field sites were used toward these ends. In some studies, shallow reference depths have been used and ΔS neglected. Our results indicate that when zr is sufficiently deep to permit accurate heat flux measurements, ΔS is too large to neglect. Three methods for determining C were evaluated: soil sampling, the ThetaProbe soil moisture sensor, and heat pulse sensors. When C was determined using all three methods simultaneously, the estimates agreed to within 6% on average; however, the temporal variability of C was best recorded with the automated heat pulse sensors. Three approaches for calculating ΔS were also tested. The common approach of letting C vary in time but neglecting its time derivative caused errors when soil water content was changing. These errors exceeded 200 W m−2 in some cases. The simple approach of assuming a constant C performed similarly. We introduce a third approach that accounts for the time derivative of C and yields the most accurate ΔS data.
Towards a standardized processing of Net Ecosystem Exchange measured with eddy covariance technique: algorithms and uncertainty estimation
DOI:10.5194/bg-3-571-2006
URL
[本文引用: 2]
. Eddy covariance technique to measure CO2, water and energy fluxes between biosphere and atmosphere is widely spread and used in various regional networks. Currently more than 250 eddy covariance sites are active around the world measuring carbon exchange at high temporal resolution for different biomes and climatic conditions. In this paper a new standardized set of corrections is introduced and the uncertainties associated with these corrections are assessed for eight different forest sites in Europe with a total of 12 yearly datasets. The uncertainties introduced on the two components GPP (Gross Primary Production) and TER (Terrestrial Ecosystem Respiration) are also discussed and a quantitative analysis presented. Through a factorial analysis we find that generally, uncertainties by different corrections are additive without interactions and that the heuristic u*-correction introduces the largest uncertainty. The results show that a standardized data processing is needed for an effective comparison across biomes and for underpinning inter-annual variability. The methodology presented in this paper has also been integrated in the European database of the eddy covariance measurements.
The FLUXNET2015 dataset and the ONEFlux processing pipeline for eddy covariance data
The FLUXNET2015 dataset provides ecosystem-scale data on CO, water, and energy exchange between the biosphere and the atmosphere, and other meteorological and biological measurements, from 212 sites around the globe (over 1500 site-years, up to and including year 2014). These sites, independently managed and operated, voluntarily contributed their data to create global datasets. Data were quality controlled and processed using uniform methods, to improve consistency and intercomparability across sites. The dataset is already being used in a number of applications, including ecophysiology studies, remote sensing studies, and development of ecosystem and Earth system models. FLUXNET2015 includes derived-data products, such as gap-filled time series, ecosystem respiration and photosynthetic uptake estimates, estimation of uncertainties, and metadata about the measurements, presented for the first time in this paper. In addition, 206 of these sites are for the first time distributed under a Creative Commons (CC-BY 4.0) license. This paper details this enhanced dataset and the processing methods, now made available as open-source codes, making the dataset more accessible, transparent, and reproducible.
NDVI-indicated decline in desertification in China in the past two decades
Contribution of semi-arid ecosystems to interannual variability of the global carbon cycle
DOI:10.1038/nature13376 [本文引用: 1]
On the separation of net ecosystem exchange into assimilation and ecosystem respiration: review and improved algorithm
DOI:10.1111/gcb.2005.11.issue-9 URL [本文引用: 1]
Global desertification: building a science for dryland development
DOI:10.1126/science.1131634
PMID:17495163
[本文引用: 1]
In this millennium, global drylands face a myriad of problems that present tough research, management, and policy challenges. Recent advances in dryland development, however, together with the integrative approaches of global change and sustainability science, suggest that concerns about land degradation, poverty, safeguarding biodiversity, and protecting the culture of 2.5 billion people can be confronted with renewed optimism. We review recent lessons about the functioning of dryland ecosystems and the livelihood systems of their human residents and introduce a new synthetic framework, the Drylands Development Paradigm (DDP). The DDP, supported by a growing and well-documented set of tools for policy and management action, helps navigate the inherent complexity of desertification and dryland development, identifying and synthesizing those factors important to research, management, and policy communities.
Energy balance closure at FLUXNET sites
DOI:10.1016/S0168-1923(02)00109-0 URL [本文引用: 2]
Basic and extensible post-processing of eddy covariance flux data with REddyProc
DOI:10.5194/bg-15-5015-2018
URL
[本文引用: 5]
. With the eddy covariance (EC) technique, net fluxes of carbon dioxide (CO2) and other trace gases as well as water and energy fluxes can be measured at the ecosystem level. These flux measurements are a main source for understanding biosphere–atmosphere interactions and feedbacks through cross-site analysis, model–data integration, and upscaling. The raw fluxes measured with the EC technique require extensive and laborious data processing. While there are standard tools1 available in an open-source environment for processing high-frequency (10 or 20 Hz) data into half-hourly quality-checked fluxes, there is a need for more usable and extensible tools for the subsequent post-processing steps. We tackled this need by developing the REddyProc package in the cross-platform language R that provides standard CO2-focused post-processing routines for reading (half-)hourly data from different formats, estimating the u* threshold, as well as gap-filling, flux-partitioning, and visualizing the results. In addition to basic processing, the functions are extensible and allow easier integration in extended analysis than current tools. New features include cross-year processing and a better treatment of uncertainties. A comparison of REddyProc routines with other state-of-the-art tools resulted in no significant differences in monthly and annual fluxes across sites. Lower uncertainty estimates of both u* and resulting gap-filled fluxes by 50 % with the presented tool were achieved by an improved treatment of seasons during the bootstrap analysis. Higher estimates of uncertainty in daytime partitioning (about twice as high) resulted from a better accounting for the uncertainty in estimates of temperature sensitivity of respiration. The provided routines can be easily installed, configured, and used. Hence, the eddy covariance community will benefit from the REddyProc package, allowing easier integration of standard post-processing with extended analysis. 1http://fluxnet.fluxdata.org/2017/10/10/toolbox-a-rolling-list-of-softwarepackages-for-flux-related-data-processing/, last access: 17 August 2018\n
Soil carbon release responses to long-term versus short-term climatic warming in an arid ecosystem
DOI:10.5194/bg-17-781-2020
URL
[本文引用: 1]
. Climate change severely impacts the grassland carbon cycling by\naltering rates of litter decomposition and soil respiration (Rs),\nespecially in arid areas. However, little is known about the Rs\nresponses to different warming magnitudes and watering pulses in situ in desert\nsteppes. To examine their effects on Rs, we conducted long-term moderate\nwarming (4 years, ∼3 ∘C), short-term acute\nwarming (1 year, ∼4 ∘C) and watering field\nexperiments in a desert grassland of northern China. While experimental\nwarming significantly reduced average Rs by 32.5 % and 40.8 %\nunder long-term moderate and short-term acute warming regimes, respectively,\nwatering pulses (fully irrigating the soil to field capacity) stimulated it\nsubstantially. This indicates that climatic warming constrains soil carbon\nrelease, which is controlled mainly by decreased soil moisture, consequently\ninfluencing soil carbon dynamics. Warming did not change the exponential\nrelationship between Rs and soil temperature, whereas the relationship\nbetween Rs and soil moisture was better fitted to a sigmoid function.\nThe belowground biomass, soil nutrition, and microbial biomass were not\nsignificantly affected by either long-term or short-term warming regimes,\nrespectively. The results of this study highlight the great dependence of\nsoil carbon emission on warming regimes of different durations and the\nimportant role of precipitation pulses during the growing season in\nassessing the terrestrial ecosystem carbon balance and cycle.\n
