
植物生态学报 ›› 2017, Vol. 41 ›› Issue (1): 62-70.DOI: 10.17521/cjpe.2016.0038
所属专题: 中国灌丛生态系统碳储量的研究; 青藏高原植物生态学:群落生态学; 碳循环
杨路存1,2, 李长斌1,3, 宁祎1,3, 聂秀青1,3, 徐文华1,2, 周国英1,2,*( )
)
收稿日期:2016-01-11
接受日期:2016-11-11
出版日期:2017-01-10
发布日期:2017-01-23
通讯作者:
周国英
作者简介:* 通信作者Author for correspondence (E-mail:基金资助:
Lu-Cun YANG1,2, Chang-Bin LI1,3, Yi NING1,3, Xiu-Qing NIE1,3, Wen-Hua XU1,2, Guo-Ying ZHOU1,2,*()
Received:2016-01-11
Accepted:2016-11-11
Online:2017-01-10
Published:2017-01-23
Contact:
Guo-Ying ZHOU
About author:KANG Jing-yao(1991-), E-mail: 摘要:
灌丛面积增加引起的碳储量增加被认为是我国陆地生态系统碳储量增加的重要原因, 也是陆地生态系统碳汇研究中的一个不确定因素。为了揭示高寒灌丛的碳密度及其分配格局, 该文对青海省不同样地8个金露梅(Potentilla fruticosa)灌丛生态系统各组分的碳密度及分布特征进行了研究。结果表明: 金露梅灌丛的生物碳密度、凋落物碳密度、土壤有机碳密度和总碳密度分别为: 5088.54、542.1、35903.76和41534.4 kg·hm-2。金露梅灌丛灌木层碳主要分配在根部(49.5%-56.1%), 灌木层碳密度占总生物量碳密度的68%以上。草本层碳也主要分配在根部(59.6%-75.1%), 草本层碳密度占总生物量碳密度的22.5%。金露梅灌丛的生物碳密度明显低于中国6种主要灌丛的平均值(10.88 t·hm-2)。在金露梅灌丛中, 土壤碳密度占有最大比例, 约占总碳密度的86.4%。
杨路存, 李长斌, 宁祎, 聂秀青, 徐文华, 周国英. 青海高寒金露梅灌丛碳密度及其分配格局. 植物生态学报, 2017, 41(1): 62-70. DOI: 10.17521/cjpe.2016.0038
Lu-Cun YANG, Chang-Bin LI, Yi NING, Xiu-Qing NIE, Wen-Hua XU, Guo-Ying ZHOU. Carbon density and its spatial distribution in the Potentilla fruticosa dominated alpine shrub in Qinghai, China. Chinese Journal of Plant Ecology, 2017, 41(1): 62-70. DOI: 10.17521/cjpe.2016.0038
| 代码 Code | 调查地区 Location | 纬度 Latitude (N) | 经度 Longitude (E) | 海拔 Altitude (m) | 平均盖度 Average coverage (%) | 灌木物种组成 Composition of shrub species |
|---|---|---|---|---|---|---|
| Q1 | 青海门源 Menyuan, Qinghai | 37.22° | 101.24° | 3 399 | 50 | 金露梅 Potentilla fruticosa, 山生柳 Salix oritrepha, 高山绣线菊 Spiraea alpine, 鬼箭锦鸡儿 Caragana jubata |
| Q2 | 青海祁连 Qilian, Qinghai | 38.05° | 100.21° | 2 973 | 65 | 金露梅 Potentilla fruticosa, 山生柳 Salix oritrepha, 高山绣线菊 Spiraea alpina |
| Q3 | 青海玉树 Yushu, Qinghai | 33.02° | 96.50° | 4 132 | 60 | 金露梅 Potentilla fruticosa, 山生柳 Salix oritrepha, 高山绣线菊 Spiraea alpine, 千里香杜鹃 Rhododendron thymifolium |
| Q4 | 青海刚察 Gangcha, Qinghai | 37.25° | 100.15° | 3 614 | 60 | 金露梅 Potentilla fruticosa |
| Q5 | 青海天峻 Tianjun, Qinghai | 37.31° | 99.19° | 3 567 | 65 | 金露梅 Potentilla fruticosa, 山生柳 Salix oritrepha |
| Q6 | 青海大通 Datong, Qinghai | 37.29° | 101.43° | 2 959 | 80 | 金露梅 Potentilla fruticosa, 山生柳 Salix oritrepha, 沙棘 Hippophae rhamnoides |
| Q7 | 青海兴海 Xinghai, Qinghai | 35.85° | 99.92° | 3 579 | 65 | 金露梅 Potentilla fruticosa |
| Q8 | 青海贵南 Guinan, Qinghai | 35.47° | 100.74° | 3 583 | 60 | 金露梅 Potentilla fruticosa |
表1 样地概况
Table 1 Basic information of the sampling plots
| 代码 Code | 调查地区 Location | 纬度 Latitude (N) | 经度 Longitude (E) | 海拔 Altitude (m) | 平均盖度 Average coverage (%) | 灌木物种组成 Composition of shrub species |
|---|---|---|---|---|---|---|
| Q1 | 青海门源 Menyuan, Qinghai | 37.22° | 101.24° | 3 399 | 50 | 金露梅 Potentilla fruticosa, 山生柳 Salix oritrepha, 高山绣线菊 Spiraea alpine, 鬼箭锦鸡儿 Caragana jubata |
| Q2 | 青海祁连 Qilian, Qinghai | 38.05° | 100.21° | 2 973 | 65 | 金露梅 Potentilla fruticosa, 山生柳 Salix oritrepha, 高山绣线菊 Spiraea alpina |
| Q3 | 青海玉树 Yushu, Qinghai | 33.02° | 96.50° | 4 132 | 60 | 金露梅 Potentilla fruticosa, 山生柳 Salix oritrepha, 高山绣线菊 Spiraea alpine, 千里香杜鹃 Rhododendron thymifolium |
| Q4 | 青海刚察 Gangcha, Qinghai | 37.25° | 100.15° | 3 614 | 60 | 金露梅 Potentilla fruticosa |
| Q5 | 青海天峻 Tianjun, Qinghai | 37.31° | 99.19° | 3 567 | 65 | 金露梅 Potentilla fruticosa, 山生柳 Salix oritrepha |
| Q6 | 青海大通 Datong, Qinghai | 37.29° | 101.43° | 2 959 | 80 | 金露梅 Potentilla fruticosa, 山生柳 Salix oritrepha, 沙棘 Hippophae rhamnoides |
| Q7 | 青海兴海 Xinghai, Qinghai | 35.85° | 99.92° | 3 579 | 65 | 金露梅 Potentilla fruticosa |
| Q8 | 青海贵南 Guinan, Qinghai | 35.47° | 100.74° | 3 583 | 60 | 金露梅 Potentilla fruticosa |
| 层次/器官 Layer/organ | 样地 Sampling site | 平均 Average | ||||||||
|---|---|---|---|---|---|---|---|---|---|---|
| 青海门源 Menyuan, Qinghai | 青海祁连 Qilian, Qinghai | 青海玉树 Yushu, Qinghai | 青海刚察Gangcha, Qinghai | 青海天峻Tianjun, Qinghai | 青海大通Datong, Qinghai | 青海兴海Xinghai, Qinghai | 青海贵南Guinan, Qinghai | |||
| 灌木层 Shrub layer | 叶 Leaf | 391.81 ± 42.45a | 665.50 ± 41.65b | 598.030 ± 23.65ab | 753.39 ± 90.58b | 425.65 ± 68.75a | 1 065.54 ± 91.63c | 580.96 ± 45.58ab | 1 057.52 ± 98.76c | 692.30 ± 53.89 |
| 枝 Branch | 2 677.35 ± 478.95abc | 3 083.58 ± 468.43abc | 4 527.30 ± 1014.2c | 3 548.54 ± 135.69abc | 2 313.81 ± 445.49ab | 2 055.72 ± 446.22a | 2 206.73 ± 119.62a | 4 198.33 ± 864.11bc | 3 076.43 ± 248.61 | |
| 根 Root | 3 405.82 ± 822.31a | 4 745.91 ± 831.42abc | 5 538.02 ± 235.86bc | 5 715.92 ± 675.68bc | 3 212.59 ± 852.82a | 4 119.84 ± 605.00ab | 3 239.50 ± 178.57a | 6 767.94 ± 599.21c | 4 593.19 ± 321.39 | |
| 合计 Total | 6 474.98 ± 1231.8a | 8 494.99 ± 1 205.1ab | 10 663.36 ± 897.24bc | 10 017.85 ± 900.44bc | 5 952.05 ± 918.99a | 7 241.10 ± 1060.2ab | 6 027.10 ± 302.16a | 12 023.80 ± 1 536.0c | 8 361.92 ± 549.46 | |
| 草本层 Herb layer | 叶 Leaf | 406.21 ± 64.50a | 762.57 ± 115.41ab | 1 534.51 ± 292.50b | 834.52 ± 48.88ab | 1 402.72 ± 684.49b | 340.36 ± 119.32a | 683.52 ± 128.13ab | 727.74 ± 58.50ab | 836.52 ± 116.46 |
| 根 Root | 1 438.43 ± 388.53a | 1 761.69 ± 45.60ab | 9 852.47 ± 2 780.3c | 5 486.23 ± 1 915.2b | 5 494.34 ± 1 125.2b | 735.05 ± 264.70a | 1 274.49 ± 155.68a | 1 612.09 ± 253.11ab | 3 274.15 ± 753.52 | |
| 合计 Total | 1 844.64 ± 441.05a | 2 524.26 ± 160.98ab | 11 386.98 ± 2 973.4d | 6 320.75 ± 1 964.0bc | 6 897.06 ± 1 710.5c | 1 075.41 ± 380.29a | 1 958.01 ± 277.09ab | 2 339.83 ± 285.17ab | 4 293.37 ± 838.27 | |
| 凋落物层 Litter layer | 1 352.4 ± 149.86bc | 1 653.93 ± 42.58c | 2 846.63 ± 504.94d | 826.93 ± 19.22ab | 1 122.5 ± 143.50bc | 897.57 ± 116.48ab | 907.57 ± 97.57ab | 365.77 ± 65.34a | 1 246.66 ± 158.05 | |
| 生物层 Biological layer | 9 672.02 ± 1 635.3ab | 12 673.18 ± 1 319.4ab | 24 896.97 ± 4 321.5c | 17 165.53 ± 2 217.8b | 13 971.61 ± 2 643.3ab | 9 214.08 ± 1184.5a | 9 202.41 ± 647.34a | 14 729.4 ± 1 364.9ab | 13 940.65 ± 1 222.3 | |
表2 青海不同样地金露梅灌丛各组分生物量(平均值±标准误差) (kg·hm-2)
Table 2 Biomass of the Potentilla fruticosa shrub ecosystem in different sampling sites in Qinghai (mean ± SE) (kg·hm-2)
| 层次/器官 Layer/organ | 样地 Sampling site | 平均 Average | ||||||||
|---|---|---|---|---|---|---|---|---|---|---|
| 青海门源 Menyuan, Qinghai | 青海祁连 Qilian, Qinghai | 青海玉树 Yushu, Qinghai | 青海刚察Gangcha, Qinghai | 青海天峻Tianjun, Qinghai | 青海大通Datong, Qinghai | 青海兴海Xinghai, Qinghai | 青海贵南Guinan, Qinghai | |||
| 灌木层 Shrub layer | 叶 Leaf | 391.81 ± 42.45a | 665.50 ± 41.65b | 598.030 ± 23.65ab | 753.39 ± 90.58b | 425.65 ± 68.75a | 1 065.54 ± 91.63c | 580.96 ± 45.58ab | 1 057.52 ± 98.76c | 692.30 ± 53.89 |
| 枝 Branch | 2 677.35 ± 478.95abc | 3 083.58 ± 468.43abc | 4 527.30 ± 1014.2c | 3 548.54 ± 135.69abc | 2 313.81 ± 445.49ab | 2 055.72 ± 446.22a | 2 206.73 ± 119.62a | 4 198.33 ± 864.11bc | 3 076.43 ± 248.61 | |
| 根 Root | 3 405.82 ± 822.31a | 4 745.91 ± 831.42abc | 5 538.02 ± 235.86bc | 5 715.92 ± 675.68bc | 3 212.59 ± 852.82a | 4 119.84 ± 605.00ab | 3 239.50 ± 178.57a | 6 767.94 ± 599.21c | 4 593.19 ± 321.39 | |
| 合计 Total | 6 474.98 ± 1231.8a | 8 494.99 ± 1 205.1ab | 10 663.36 ± 897.24bc | 10 017.85 ± 900.44bc | 5 952.05 ± 918.99a | 7 241.10 ± 1060.2ab | 6 027.10 ± 302.16a | 12 023.80 ± 1 536.0c | 8 361.92 ± 549.46 | |
| 草本层 Herb layer | 叶 Leaf | 406.21 ± 64.50a | 762.57 ± 115.41ab | 1 534.51 ± 292.50b | 834.52 ± 48.88ab | 1 402.72 ± 684.49b | 340.36 ± 119.32a | 683.52 ± 128.13ab | 727.74 ± 58.50ab | 836.52 ± 116.46 |
| 根 Root | 1 438.43 ± 388.53a | 1 761.69 ± 45.60ab | 9 852.47 ± 2 780.3c | 5 486.23 ± 1 915.2b | 5 494.34 ± 1 125.2b | 735.05 ± 264.70a | 1 274.49 ± 155.68a | 1 612.09 ± 253.11ab | 3 274.15 ± 753.52 | |
| 合计 Total | 1 844.64 ± 441.05a | 2 524.26 ± 160.98ab | 11 386.98 ± 2 973.4d | 6 320.75 ± 1 964.0bc | 6 897.06 ± 1 710.5c | 1 075.41 ± 380.29a | 1 958.01 ± 277.09ab | 2 339.83 ± 285.17ab | 4 293.37 ± 838.27 | |
| 凋落物层 Litter layer | 1 352.4 ± 149.86bc | 1 653.93 ± 42.58c | 2 846.63 ± 504.94d | 826.93 ± 19.22ab | 1 122.5 ± 143.50bc | 897.57 ± 116.48ab | 907.57 ± 97.57ab | 365.77 ± 65.34a | 1 246.66 ± 158.05 | |
| 生物层 Biological layer | 9 672.02 ± 1 635.3ab | 12 673.18 ± 1 319.4ab | 24 896.97 ± 4 321.5c | 17 165.53 ± 2 217.8b | 13 971.61 ± 2 643.3ab | 9 214.08 ± 1184.5a | 9 202.41 ± 647.34a | 14 729.4 ± 1 364.9ab | 13 940.65 ± 1 222.3 | |
| 样地 Sampling site | 土层 Soil layer (cm) | 合计 Total | |||||
|---|---|---|---|---|---|---|---|
| 0-10 | 10-20 | 20-30 | 30-50 | 50-70 | 70-100 | ||
| Q1 | 9.98 | 8.02 | 8.54 | 3.36 | 1.60 | 0.79 | 32.29 |
| Q2 | 9.86 | 9.19 | 6.63 | 3.05 | 3.71 | 1.03 | 33.47 |
| Q3 | 9.78 | 7.00 | 5.71 | 4.38 | 3.83 | 3.69 | 34.39 |
| Q4 | 9.03 | 6.81 | 5.80 | 3.49 | 3.19 | 2.52 | 30.84 |
| Q5 | 9.42 | 6.18 | 5.66 | 1.71 | 1.73 | 2.44 | 27.14 |
| Q6 | 3.55 | 5.06 | 6.68 | 5.53 | 4.07 | - | 24.89 |
| Q7 | 12.29 | 5.50 | 4.13 | 4.43 | 4.72 | 4.59 | 35.66 |
| Q8 | 8.31 | 6.70 | 3.27 | 2.83 | 2.70 | 2.58 | 26.39 |
| 平均 Average | 9.03 | 6.81 | 5.80 | 3.60 | 3.19 | 2.52 | 30.63 |
表3 青海各样地金露梅灌丛土壤含碳率(%)
Table 3 Soil carbon contents of the Potentilla fruticosa shrublands in different sampling sites in Qinghai (%)
| 样地 Sampling site | 土层 Soil layer (cm) | 合计 Total | |||||
|---|---|---|---|---|---|---|---|
| 0-10 | 10-20 | 20-30 | 30-50 | 50-70 | 70-100 | ||
| Q1 | 9.98 | 8.02 | 8.54 | 3.36 | 1.60 | 0.79 | 32.29 |
| Q2 | 9.86 | 9.19 | 6.63 | 3.05 | 3.71 | 1.03 | 33.47 |
| Q3 | 9.78 | 7.00 | 5.71 | 4.38 | 3.83 | 3.69 | 34.39 |
| Q4 | 9.03 | 6.81 | 5.80 | 3.49 | 3.19 | 2.52 | 30.84 |
| Q5 | 9.42 | 6.18 | 5.66 | 1.71 | 1.73 | 2.44 | 27.14 |
| Q6 | 3.55 | 5.06 | 6.68 | 5.53 | 4.07 | - | 24.89 |
| Q7 | 12.29 | 5.50 | 4.13 | 4.43 | 4.72 | 4.59 | 35.66 |
| Q8 | 8.31 | 6.70 | 3.27 | 2.83 | 2.70 | 2.58 | 26.39 |
| 平均 Average | 9.03 | 6.81 | 5.80 | 3.60 | 3.19 | 2.52 | 30.63 |
 |
表4 青海各样地金露梅灌丛生态系统各组分碳密度及分配格局(平局值±标准误差)
Table 4 Density and distribution pattern of catbon in the Potentilla fruticosa shrub ecosystem in different sampling sites in Qinghai(mean±SE)
|
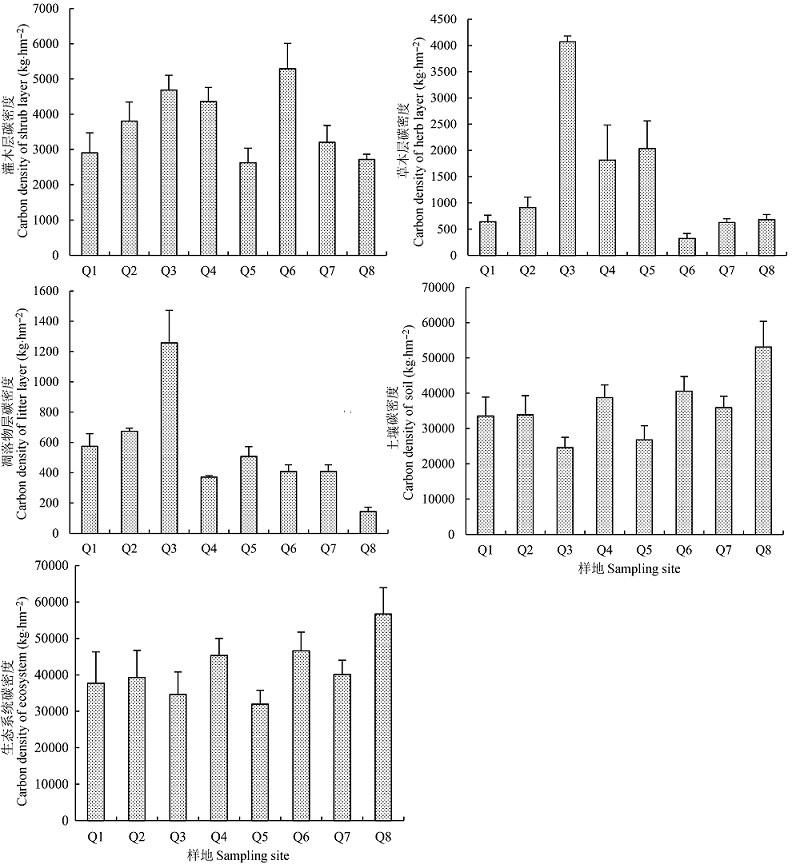
图1 青海各样地金露梅灌丛碳密度(平均值±标准误差)。
Fig. 1 Carbon density of the Potentilla fruticosa shrub ecosystem in different sampling sites in Qinghai (mean ± SE).
| [1] | Dong X (2009). Evaluation of forest resources in Qinghai Province.Journal of Anhui Agricultural Sciences, 37, 5727-5728, 5751. (in Chinese with English abstract)[董旭 (2009). 青海省森林资源评价. 安徽农业科学, 37, 5727-5728, 5751.] |
| [2] | Fan QS, Sha ZJ, Cao GC, Cao SK (2005). Assessment of ecology and environments on climate changing of Qinghai- Tibetan Plateau.Journal of Salt Lake Research, 13(1), 12-18. (in Chinese with English abstract)[樊启顺, 沙占江, 曹广超, 曹生奎 (2005). 气候变化对青藏高原生态环境的影响评价. 盐湖研究, 13(1), 12-18.] |
| [3] | Gao Q, Yang XC, Yin CY, Liu Q (2014). Estimation of biomass allocation and carbon density in alpine dwarf shrubs in Garzê Zangzu Autonomous Prefecture of Sichuan Province, China.Chinese Journal of Plant Ecology, 38, 355-365. (in Chinese with English abstract)[高巧, 阳小成, 尹春英, 刘庆 (2014). 四川省甘孜藏族自治州高寒矮灌丛生物量分配及其碳密度的估算. 植物生态学报, 38, 355-365.] |
| [4] | Hao WF, Chen CG, Liang ZS, Ma L (2008). Research advances in vegetation biomass. Journal of Northwest A & F University (Natural Science Edition), 36, 175-182. (in Chinese with English abstract)[郝文芳, 陈存根, 梁宗锁, 马丽 (2008). 植被生物量的研究进展. 西北农林科技大学学报(自然科学版), 36, 175-182.] |
| [5] | Hou XY (1982). Vegetation Map of the People’s Republic of China. China Map Press, Beijing. (in Chinese)[侯学煜 (1982). 中华人民共和国植被图. 中国地图出版社, 北京. ] |
| [6] | Hu HF, Wang ZH, Liu GH, Fu BJ (2006). Vegetation carbon storage of major shrublands in China.Journal of Plant Ecology (Chinese Version), 30, 539-544. (in Chinese with English abstract)[胡会峰, 王志恒, 刘国华, 傅伯杰 (2006). 中国主要灌丛植被碳储量. 植物生态学报, 30, 539-544.] |
| [7] | Jin M, Li Y, Wang SL, Zhang XL, Lei L (2012). Alpine shrubs biomass and its distribution characteristics in Qilian Mountains.Arid Land Geography, 35, 952-959. (in Chinese with English abstract)[金铭, 李毅, 王顺利, 张学龙, 雷蕾 (2012). 祁连山高山灌丛生物量及其分配特征. 干旱区地理, 35, 952-959.] |
| [8] | Jobbagy EG, Jackson RB (2000). The vertical distribution of soil organic carbon and its relation to climate and vegetation.Ecological Applications, 10, 423-426. |
| [9] | Kang WX, Tian Z, He JN, Cui SS (2009). Carbon cycle in ten kinds of forest ecosystem in Guangzhou City.Chinese Journal of Applied Ecology, 20, 2917-2924. (in Chinese with English abstract)[康文星, 田徵, 何介南, 崔莎莎 (2009). 广州市十种森林生态系统的碳循环. 应用生态学报, 20, 2917-2924.] |
| [10] | Lei L, Liu XD, Wang SL, Li Y, Zhang XL (2011). Assignment rule of alpine shrubs biomass and its relationships to environmental factors in Qilian Mountains.Ecology and Environmental Sciences, 20, 1602-1607. (in Chinese with English abstract)[雷蕾, 刘贤德, 王顺利, 李毅, 张学龙 (2011). 祁连山高山灌丛生物量分配规律及其与环境因子的关系. 生态环境学报, 20, 1602-1607.] |
| [11] | Li J (2008). Study on Soil Carbon Stock and Its Spatial Distribution, Influence Factors in the Forest of China. Master degree dissertation, Sichuan Agricultural University, Ya’an, Sichuan. 18-21. (in Chinese with English abstract)[李江 (2008). 中国主工森林群落林下土壤有机碳储量格局及其影响因子研究. 硕士学位论文, 四川农业大学, 四川雅安. 18-21.] |
| [12] | Li YN, Yu XF, Xu ZQ, Liu LL, Yao WX, Wang L (2014). Carbon density characteristics of two typical shrub communities in the northern mountain region of Hebei.Scientia silvae sinicae, 50(6), 28-33. (in Chinese with English abstract)[李亚男, 虞晓凡, 许中旗, 刘乐乐, 姚卫星, 王丽 (2014). 冀北山地2种典型灌丛的碳密度特征. 林业科学, 50(6), 28-33.] |
| [13] | Li YN, Zhao L, Wang QX, Du MY, Gu S, Xu SX, Zhang FQ, Zhao XQ (2006). Estimation of biomass and annual turnover quantities of Potentilla froticosa shrub. Acta Agrestia Sinica, 14(1), 72-76. (in Chinese with English abstract)[李英年, 赵亮, 王勤学, 杜明远, 古松, 徐世晓, 张发起, 赵新全 (2006). 高寒金露梅灌丛生物量及年周转量. 草地学报, 14(1), 72-76.] |
| [14] | Liu H, Dong L, Abula A, Li PJ, Jia RQ, Wang WY (2015). Value of carbon sequestration of Tamarix in the midstream of the Tarim River. Acta Agriculturae Universitatis Jiangxiensis, 37, 484-489. (in Chinese with English abstract)[刘华, 董玲, 艾吉尔·阿不拉, 李丕军, 贾瑞琪, 王文月 (2015). 塔里木河中游柽柳灌丛碳储量及其价值评估. 江西农业大学学报, 37, 484-489.] |
| [15] | Lu RK (1999). Analysis of Soil Agrochemistry. China Agriculture Scientech Press, Beijing. (in Chinese)[鲁如坤 (1999). 土壤农业化学分析方法. 中国农业科技出版社, 北京.] |
| [16] | Pan HL, Li MH, Cai XH, Wu J, Du Z, Liu XL (2009). Responses of growth and ecophysiology of plants to altitude.Ecology and Environmental Sciences, 18, 722-730. (in Chinese with English abstract)[潘红丽, 李迈和, 蔡小虎, 吴杰, 杜忠, 刘兴良 (2009). 海拔梯度上的植物生长与生理生态特性. 生态环境学报, 18, 722-730.] |
| [17] | Piao SL, Fang JY, Huang Y (2010). The carbon balance of terrestrial ecosystems in China.China Basic Science,12(2), 20-22. (in Chinese with English abstract)[朴世龙, 方精云, 黄耀 (2010). 中国陆地生态系统碳收支. 中国基础科学, 12(2), 20-22.] |
| [18] | Qiao CL, Li JM, Wang JH, Ge SD, Zhao L, Xu SX (2011). Annual carbon dioxide flux variations of alpine shrub ecosystem in the Qinghai-Tibet Plateau.Acta Agrestia Sinica, 19, 910-916. (in Chinese with English abstract)[乔春连, 李婧梅, 王基恒, 葛世栋, 赵亮, 徐世晓 (2011). 青藏高原高寒灌丛生态系统CO2通量年变化特征研究. 草地学报, 19, 910-916.] |
| [19] | Ren LN, Wang HY, Ding GD, Gao GL, Liu L (2012). Effects of Larix principis-rupprechtii plantation density control on soil organic carbon and nutrients characteristics. Journal of Arid Land Resources and Environment, 26(4), 138-143. (in Chinese with English abstract)[任丽娜, 王海燕, 丁国栋, 高广磊, 刘玲 (2012). 密度调控对华北落叶松人工林土壤有机碳及养分特征的影响. 干旱区资源与环境, 26(4), 138-143.] |
| [20] | Sturm M, Racine C, Tape K (2001). Increasing shrub abundance in the Arctic.Nature, 411, 546-547. |
| [21] | Tian YY, Qin F, Yan H, Guo WH, Guan QW (2011). Carbon content rate in the common woody plants of China.Journal of Anhui Agriculture Science, 39, 16166-16169. (in Chinese with English abstract)[田勇燕, 秦飞, 言华, 郭伟红, 关庆伟 (2011). 我国常见木本植物的含碳率. 安徽农业科学, 39, 16166-16169.] |
| [22] | Veldkamp E (1994). Organic carbon turnover in three tropical soils under pasture after deforestation.Soil Science Society of American Journal, 58, 175-180. |
| [23] | Wang GR, Chen XR, Han YZ, Yang CD, Xu CL (2006). Photosynthetic characteristics of three species ofLiriope. Grassland and Turf, (3), 27-34. (in Chinese with English abstract)[王国荣, 陈秀荣, 韩玉竹, 杨成德, 徐长林 (2006). 东祁连山高寒灌丛土壤微生物的分布特征. 草原与草坪, (3), 27-34.] |
| [24] | Wang QJ, Zhou XM, Zhang YQ, Zhao XQ (1991). Structure characteristics and biomass of Potentilla fruticose shrub in Qinghai-Tibetan Plateau. Acta Botanic Boreali-Occidentalia Sinica, 11, 333-340. (in Chinese with English abstract)[王启基, 周兴民, 张堰青, 赵兴全 (1991). 青藏高原金露梅灌丛的结构特征及其生物量. 西北植物学报, 11, 333-340.] |
| [25] | Yang LC, Zhong ZB, Liu HC, Song WZ, Xu WH, Zhou GY, Nie XM (2013). Community characteristics of alpine shrubSalix oritrepha. Bulletin of Botanical Research, 33, 653-658. (in Chinese with English abstract)[杨路存, 钟泽兵, 刘何春, 宋文珠, 徐文华, 周国英, 聂学敏 (2013). 高寒山生柳灌丛的群落特征研究. 植物研究, 33, 653-658.] |
| [26] | Yang YH, Fang JY, Tang YH, Ji CJ, Zheng CY, He JS, Zhu B (2008). Storage, patterns and controls of soil organic carbon in the Tibetan grasslands.Global Change Biology, 14, 1592-1599. |
| [27] | Yang YJ, Chen YM, Cao Y (2014). Carbon density and distribution of Pinus tabulaeformis plantation ecosystem in Hilly Loess Plateau. Acta Ecologica Sinica, 34, 2128-2136. (in Chinese with English abstract)[杨玉姣, 陈云明, 曹扬 (2014). 黄土丘陵区油松人工林生态系统碳密度及其分配. 生态学报, 34, 2128-2136.] |
| [28] | Yi LB (2012). Research and Assessment of Forest Carbon Potential in Qinghai.Master degree dissertation, Northwest A & F University, Yangling, Shaanxi. 5-52. (in Chinese with English abstract)[仪律北 (2012). 青海森林碳汇潜力分析与评估. 硕士学位论文, 西北农林科技大学, 陕西杨凌. 51-52.] |
| [29] | Yu HY, Xu JC (2009). Effects of climate change on vegetations on Qinghai-Tibet Plateau: A review.Chinese Journal of Ecology, 28, 747-754. (in Chinese with English abstract)[于海英, 许建初 (2009). 气候变化对青藏高原植被影响研究综述. 生态学杂志, 28, 747-754.] |
| [30] | Zhang XH, Zhang YD, Gu FX, Liu SR (2011). Dynamics of shrubs normalized difference vegetation index and its correlations with climatic factors in Southwest China.Chinese Journal of Ecology, 30, 2577-2583. (in Chinese with English abstract)[张笑鹤, 张远东, 顾峰雪, 刘世荣 (2011). 西南地区灌丛归一化植被指数动态及其与气候因子的相关性. 生态学杂志, 30, 2577-2583.] |
| [31] | Zhao CC, Liu L, Yang JJ, Dong X (2013). Study on the biomass of Potentilla fruticosa forest in Qinghai loess hilly region. Guangdong Agricultural Sciences, (5), 179-182. (in Chinese with English abstract)[赵串串, 刘龙, 杨晶晶, 董旭 (2013). 青海黄土丘陵区金露梅灌丛生物量的研究. 广东农业科学, (5), 179-182.] |
| [32] | Zhou HK, Zhou L, Zhao XQ, Shen ZX, Li YN, Zhou XM, Yan ZL, Liu W (2002). Study of formation pattern of belowground biomass in Potentilla fruticosa shrub. Acta Prataculturae Sinica, 11(2), 59-65. (in Chinese with English abstract)[周华坤, 周立, 赵新全, 沈振西, 李英年, 周兴民, 严作良, 刘伟 (2002). 金露梅灌丛地下生物量形成规律的研究. 草业学报, 11(2), 59-65.] |
| [1] | 杨昊天, 王增如, 贾荣亮. 腾格里沙漠东南缘荒漠草地不同群落类型土壤有机碳分布及储量特征[J]. 植物生态学报, 2018, 42(3): 288-296. |
| [2] | 杨怀, 李意德, 任海, 骆土寿, 陈仁利, 刘文杰, 陈德祥, 许涵, 周璋, 林明献, 杨秋, 姚海荣, 周国逸. 海南岛热带原始森林主要分布区土壤有机碳密度及影响因素[J]. 植物生态学报, 2016, 40(4): 292-303. |
| 阅读次数 | ||||||
|
全文 |
|
|||||
|
摘要 |
|
|||||
Copyright © 2022 版权所有 《植物生态学报》编辑部
地址: 北京香山南辛村20号, 邮编: 100093
Tel.: 010-62836134, 62836138; Fax: 010-82599431; E-mail: apes@ibcas.ac.cn, cjpe@ibcas.ac.cn
备案号: 京ICP备16067583号-19