
Chin J Plant Ecol ›› 2007, Vol. 31 ›› Issue (5): 757-768.DOI: 10.17521/cjpe.2007.0097
• Research Articles • Previous Articles Next Articles
ZHANG Xi1,2( ), XUE Jian-Hui2, Kikuo Haibara3, XU Xiao-Tian1,4, TIAN Ye2,3, Hiroto Toda3, LIU Yan-Hui1
Received:2006-09-04
Accepted:2007-01-11
Online:2007-09-04
Published:2007-09-30
ZHANG Xi, XUE Jian-Hui, Kikuo Haibara, XU Xiao-Tian, TIAN Ye, Hiroto Toda, LIU Yan-Hui. NUTRIENT DYNAMICS AND HYDROLOGICAL PROCESS OF KARST FORESTS IN MOUNTAINOUS AREA OF CENTRAL GUIZHOU PROVINCE, CHINA[J]. Chin J Plant Ecol, 2007, 31(5): 757-768.
Add to citation manager EndNote|Ris|BibTeX
URL: https://www.plant-ecology.com/EN/10.17521/cjpe.2007.0097
| 样地号 Plot No. | 层片 Layers | 林分特征指数 Stand indexes | 多样性指数 Diversity indexes | |||||||||||||||||||||||||||||||||||||||||
|---|---|---|---|---|---|---|---|---|---|---|---|---|---|---|---|---|---|---|---|---|---|---|---|---|---|---|---|---|---|---|---|---|---|---|---|---|---|---|---|---|---|---|---|---|
| 高度 Height (m) | 直径 Diameter* (cm) | 生物量 Biomass (Mg·hm-2) | Menhinnick 指数 Menhinnick index | Simpson 指数 Simpson index | Pielou 指数 Pielou index | |||||||||||||||||||||||||||||||||||||||
| No. 1 | 乔木层Arboreous layer | 9.92 | 14.17 | 25.67 | 0.593 1 | 0.204 1 | 0.782 2 | |||||||||||||||||||||||||||||||||||||
| 灌木层Arbuscular layer | 0.66 | 0.49 | 2.38 | 0.551 4 | 0.302 8 | 1.132 9 | ||||||||||||||||||||||||||||||||||||||
| 草本层Herbaceous layer | 0.12 | 0.49 | 0.453 1 | 0.341 9 | 0.665 6 | |||||||||||||||||||||||||||||||||||||||
| No. 2 | 乔木层Arboreous layer | 5.16 | 7.39 | 11.24 | 0.599 8 | 0.172 6 | 0.824 3 | |||||||||||||||||||||||||||||||||||||
| 灌木层Arbuscular layer | 0.61 | 0.49 | 1.58 | 0.605 9 | 0.139 1 | 0.829 7 | ||||||||||||||||||||||||||||||||||||||
| 草本层Herbaceous layer | 0.15 | 0.23 | 0.492 8 | 0.249 4 | 0.745 3 | |||||||||||||||||||||||||||||||||||||||
Table 1 Basic parameters of stands and diversity in different types of karst forests
| 样地号 Plot No. | 层片 Layers | 林分特征指数 Stand indexes | 多样性指数 Diversity indexes | |||||||||||||||||||||||||||||||||||||||||
|---|---|---|---|---|---|---|---|---|---|---|---|---|---|---|---|---|---|---|---|---|---|---|---|---|---|---|---|---|---|---|---|---|---|---|---|---|---|---|---|---|---|---|---|---|
| 高度 Height (m) | 直径 Diameter* (cm) | 生物量 Biomass (Mg·hm-2) | Menhinnick 指数 Menhinnick index | Simpson 指数 Simpson index | Pielou 指数 Pielou index | |||||||||||||||||||||||||||||||||||||||
| No. 1 | 乔木层Arboreous layer | 9.92 | 14.17 | 25.67 | 0.593 1 | 0.204 1 | 0.782 2 | |||||||||||||||||||||||||||||||||||||
| 灌木层Arbuscular layer | 0.66 | 0.49 | 2.38 | 0.551 4 | 0.302 8 | 1.132 9 | ||||||||||||||||||||||||||||||||||||||
| 草本层Herbaceous layer | 0.12 | 0.49 | 0.453 1 | 0.341 9 | 0.665 6 | |||||||||||||||||||||||||||||||||||||||
| No. 2 | 乔木层Arboreous layer | 5.16 | 7.39 | 11.24 | 0.599 8 | 0.172 6 | 0.824 3 | |||||||||||||||||||||||||||||||||||||
| 灌木层Arbuscular layer | 0.61 | 0.49 | 1.58 | 0.605 9 | 0.139 1 | 0.829 7 | ||||||||||||||||||||||||||||||||||||||
| 草本层Herbaceous layer | 0.15 | 0.23 | 0.492 8 | 0.249 4 | 0.745 3 | |||||||||||||||||||||||||||||||||||||||
| 项目Item | No. 1 | No. 2 | |
|---|---|---|---|
| A层 A stratum | 厚度Thickness (cm) | 9.0 | 13.0 |
| 容重Volume weight (g·cm-3) | 0.849 0 | 0.960 2 | |
| 总孔隙度Total pore (%) | 56.42 | 56.11 | |
| 毛管孔隙度Capillary pore (%) | 50.93 | 43.77 | |
| B层 B stratum | 厚度Thickness (cm) | 22.0 | 10.0 |
| 容重Volume weight (g·cm-3) | 1.548 2 | 1.237 1 | |
| 总孔隙度Total pore (%) | 42.36 | 61.44 | |
| 毛管孔隙度Capillary pore (%) | 41.03 | 60.42 | |
| C层 C stratum | 厚度Thickness (cm) | 89.0 | 127.0 |
| 容重Volume weight (g·cm-3) | 1.530 8 | 1.345 9 | |
| 总孔隙度Total pore (%) | 46.64 | 54.12 | |
| 毛管孔隙度Capillary pore (%) | 45.31 | 49.03 |
Table 2 Main soil characteristics of the experimental types of karst forest
| 项目Item | No. 1 | No. 2 | |
|---|---|---|---|
| A层 A stratum | 厚度Thickness (cm) | 9.0 | 13.0 |
| 容重Volume weight (g·cm-3) | 0.849 0 | 0.960 2 | |
| 总孔隙度Total pore (%) | 56.42 | 56.11 | |
| 毛管孔隙度Capillary pore (%) | 50.93 | 43.77 | |
| B层 B stratum | 厚度Thickness (cm) | 22.0 | 10.0 |
| 容重Volume weight (g·cm-3) | 1.548 2 | 1.237 1 | |
| 总孔隙度Total pore (%) | 42.36 | 61.44 | |
| 毛管孔隙度Capillary pore (%) | 41.03 | 60.42 | |
| C层 C stratum | 厚度Thickness (cm) | 89.0 | 127.0 |
| 容重Volume weight (g·cm-3) | 1.530 8 | 1.345 9 | |
| 总孔隙度Total pore (%) | 46.64 | 54.12 | |
| 毛管孔隙度Capillary pore (%) | 45.31 | 49.03 |
| 海拔高度 Altitude (m) | 水平距离 Horizontal distance (m) | |||||||
|---|---|---|---|---|---|---|---|---|
| 观测面 Observation of valley | 峡谷对面 Opposite of valley | 雨量点 Precipitation observation site | 谷底 Valley bottom | 峡谷顶间 Two tops of valley | 观测点至峡谷轴线 From observation site to valley axis | 观测点距离 Observation site distance | ||
| No.1 | 1 384.7 | 1 244.0 | 1 266.6 | 968.6 | 2 100.0 | 490.0 | 1 300.0 | |
| No.2 | 1 332.8 | 1 276.0 | 1 178.9 | 1 033.9 | 1 700.0 | 370.0 | 1 050.0 | |
| CK | 1 331.0 | 1 383.0 | 1 162.0 | 1 071.7 | 1 600.0 | 555.0 | ||
Table 3 Spatial distribution parameters of precipitation observation sites
| 海拔高度 Altitude (m) | 水平距离 Horizontal distance (m) | |||||||
|---|---|---|---|---|---|---|---|---|
| 观测面 Observation of valley | 峡谷对面 Opposite of valley | 雨量点 Precipitation observation site | 谷底 Valley bottom | 峡谷顶间 Two tops of valley | 观测点至峡谷轴线 From observation site to valley axis | 观测点距离 Observation site distance | ||
| No.1 | 1 384.7 | 1 244.0 | 1 266.6 | 968.6 | 2 100.0 | 490.0 | 1 300.0 | |
| No.2 | 1 332.8 | 1 276.0 | 1 178.9 | 1 033.9 | 1 700.0 | 370.0 | 1 050.0 | |
| CK | 1 331.0 | 1 383.0 | 1 162.0 | 1 071.7 | 1 600.0 | 555.0 | ||
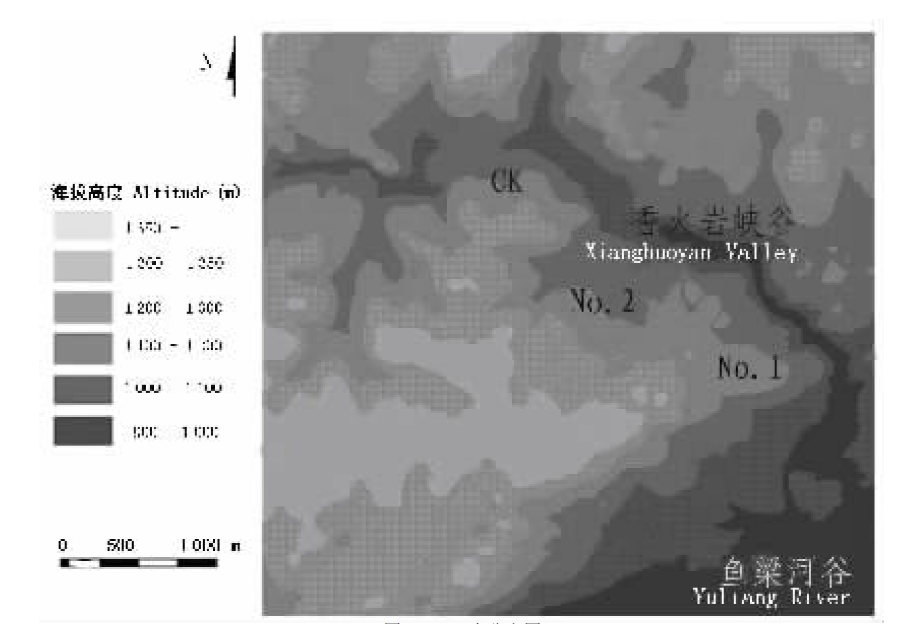
Fig.1 Distribution map of observation sites
| 月份 Month | No. 1 | No. 2 | CK | ||
|---|---|---|---|---|---|
| 林隙 Forest gap | 林内 Inner forest | 林隙 Forest gap | 林内 Inner forest | 无林地 Non-forested land | |
| 1月Jan. | 31.00 | 16.80 | 35.00 | 42.70 | 39.35 |
| 2月Feb. | 31.10 | 24.20 | 25.15 | 25.40 | 38.75 |
| 3月Mar. | 43.10 | 33.80 | 27.95 | 26.50 | 44.95 |
| 4月Apr. | 54.25 | 39.50 | 51.80 | 24.60 | 61.65 |
| 5月May | 203.93 | 231.87 | 192.30 | 206.10 | 184.60 |
| 6月Jun. | 130.50 | 127.10 | 155.63 | 118.13 | 149.57 |
| 7月Jul. | 204.27 | 223.27 | 214.23 | 236.07 | 225.47 |
| 8月Aug. | 106.30 | 110.83 | 99.97 | 92.77 | 111.43 |
| 9月Sept. | 46.90 | 49.27 | 46.97 | 41.93 | 42.57 |
| 10月Oct. | 75.20 | 57.07 | 66.27 | 67.57 | 75.83 |
| 11月Nov. | 26.13 | 25.27 | 22.17 | 21.67 | 29.90 |
| 12月Dec. | 43.75 | 50.25 | 27.25 | 28.65 | 39.60 |
Table 4 Monthly variations of precipitation of gap and inner in different types of karst forests (mm)
| 月份 Month | No. 1 | No. 2 | CK | ||
|---|---|---|---|---|---|
| 林隙 Forest gap | 林内 Inner forest | 林隙 Forest gap | 林内 Inner forest | 无林地 Non-forested land | |
| 1月Jan. | 31.00 | 16.80 | 35.00 | 42.70 | 39.35 |
| 2月Feb. | 31.10 | 24.20 | 25.15 | 25.40 | 38.75 |
| 3月Mar. | 43.10 | 33.80 | 27.95 | 26.50 | 44.95 |
| 4月Apr. | 54.25 | 39.50 | 51.80 | 24.60 | 61.65 |
| 5月May | 203.93 | 231.87 | 192.30 | 206.10 | 184.60 |
| 6月Jun. | 130.50 | 127.10 | 155.63 | 118.13 | 149.57 |
| 7月Jul. | 204.27 | 223.27 | 214.23 | 236.07 | 225.47 |
| 8月Aug. | 106.30 | 110.83 | 99.97 | 92.77 | 111.43 |
| 9月Sept. | 46.90 | 49.27 | 46.97 | 41.93 | 42.57 |
| 10月Oct. | 75.20 | 57.07 | 66.27 | 67.57 | 75.83 |
| 11月Nov. | 26.13 | 25.27 | 22.17 | 21.67 | 29.90 |
| 12月Dec. | 43.75 | 50.25 | 27.25 | 28.65 | 39.60 |
| 月份 Month | No. 1 | No. 2 | ||||
|---|---|---|---|---|---|---|
| ① | ② | ③ | ① | ② | ③ | |
| 1月Jan. | 37.56 | 0.00 | 0.00 | 14.12 | 0.22 | 0.00 |
| 2月Feb. | 21.31 | 0.00 | 0.00 | 10.90 | 0.25 | 0.00 |
| 3月Mar. | 22.60 | 0.00 | 0.00 | 19.40 | 0.04 | 0.00 |
| 4月Apr. | 40.60 | 0.02 | 0.00 | 26.77 | 0.25 | 0.00 |
| 5月May | 114.82 | 0.11 | 4.23 | 75.10 | 2.75 | 0.21 |
| 6月Jun. | 73.09 | 0.02 | 4.05 | 61.66 | 1.57 | 0.15 |
| 7月Jul. | 122.43 | 1.48 | 7.53 | 113.68 | 8.69 | 2.74 |
| 8月Aug. | 57.01 | 1.16 | 2.44 | 44.34 | 2.98 | 0.00 |
| 9月Sept. | 23.03 | 0.39 | 0.15 | 21.35 | 0.87 | 0.00 |
| 10月Oct. | 38.96 | 0.01 | 0.00 | 36.48 | 0.87 | 0.00 |
| 11月Nov. | 18.09 | 0.00 | 0.00 | 14.24 | 0.42 | 0.00 |
| 12月Dec. | 34.31 | 0.00 | 0.00 | 7.95 | 0.00 | 0.00 |
Table 5 Monthly variations of precipitation in different layers of karst forest (mm)
| 月份 Month | No. 1 | No. 2 | ||||
|---|---|---|---|---|---|---|
| ① | ② | ③ | ① | ② | ③ | |
| 1月Jan. | 37.56 | 0.00 | 0.00 | 14.12 | 0.22 | 0.00 |
| 2月Feb. | 21.31 | 0.00 | 0.00 | 10.90 | 0.25 | 0.00 |
| 3月Mar. | 22.60 | 0.00 | 0.00 | 19.40 | 0.04 | 0.00 |
| 4月Apr. | 40.60 | 0.02 | 0.00 | 26.77 | 0.25 | 0.00 |
| 5月May | 114.82 | 0.11 | 4.23 | 75.10 | 2.75 | 0.21 |
| 6月Jun. | 73.09 | 0.02 | 4.05 | 61.66 | 1.57 | 0.15 |
| 7月Jul. | 122.43 | 1.48 | 7.53 | 113.68 | 8.69 | 2.74 |
| 8月Aug. | 57.01 | 1.16 | 2.44 | 44.34 | 2.98 | 0.00 |
| 9月Sept. | 23.03 | 0.39 | 0.15 | 21.35 | 0.87 | 0.00 |
| 10月Oct. | 38.96 | 0.01 | 0.00 | 36.48 | 0.87 | 0.00 |
| 11月Nov. | 18.09 | 0.00 | 0.00 | 14.24 | 0.42 | 0.00 |
| 12月Dec. | 34.31 | 0.00 | 0.00 | 7.95 | 0.00 | 0.00 |
| 项目 Item | 杨树 Populus sp. | 马尾松 Pinus massoniana | 枫香 Liquidambar formosana | 冬青 Ilex sp. | 香樟 Cinnamomum camphora | ||||
|---|---|---|---|---|---|---|---|---|---|
| DBH (cm) | 24.2 | 12.3 | 17.9 | 3.5 | 9.6 | 9.8 | 29.3 | 14.6 | 14.1 |
| 1月Jan. | 0.09 | 0.02 | 0.06 | 0.02 | 0.23 | 0.31 | 0.52 | 0.15 | 0.27 |
| 2月Feb. | 0.07 | 0.01 | 0.09 | 0.02 | 0.06 | 0.07 | 0.59 | 0.09 | 0.06 |
| 3月Mar. | 0.24 | 0.02 | 0.03 | 0.04 | 0.25 | 0.12 | 1.20 | 0.07 | 0.15 |
| 4月Apr. | 0.25 | 0.03 | 0.16 | 0.03 | 0.15 | 0.46 | 0.69 | 0.05 | 0.18 |
| 5月May | 0.89 | 0.29 | 0.52 | 0.24 | 1.12 | 0.98 | 1.90 | 0.69 | 1.88 |
| 6月Jun. | 0.60 | 0.30 | 0.44 | 0.17 | 0.64 | 0.63 | 1.82 | 0.87 | 2.04 |
| 7月Jul. | 1.72 | 0.49 | 0.93 | 0.69 | 1.31 | 1.11 | 2.59 | 2.22 | 4.28 |
| 8月Aug. | 0.71 | 0.16 | 0.18 | 0.17 | 0.85 | 0.72 | 1.65 | 0.51 | 1.18 |
| 9月Sept. | 0.27 | 0.08 | 0.09 | 0.06 | 0.42 | 0.32 | 0.65 | 0.32 | 1.13 |
| 10月Oct. | 0.36 | 0.09 | 0.16 | 0.02 | 0.66 | 0.69 | 2.74 | 0.39 | 0.96 |
| 11月Nov. | 0.08 | 0.03 | 0.03 | 0.01 | 0.32 | 0.33 | 0.51 | 0.07 | 0.27 |
| 12月Dec. | 0.04 | 0.01 | 0.07 | 0.05 | 0.18 | 0.30 | 0.21 | 0.15 | 0.37 |
Table 6 Monthly variations of stemflow in different diameters at breast height (DBH) of several trees in different types of karst forests (mm)
| 项目 Item | 杨树 Populus sp. | 马尾松 Pinus massoniana | 枫香 Liquidambar formosana | 冬青 Ilex sp. | 香樟 Cinnamomum camphora | ||||
|---|---|---|---|---|---|---|---|---|---|
| DBH (cm) | 24.2 | 12.3 | 17.9 | 3.5 | 9.6 | 9.8 | 29.3 | 14.6 | 14.1 |
| 1月Jan. | 0.09 | 0.02 | 0.06 | 0.02 | 0.23 | 0.31 | 0.52 | 0.15 | 0.27 |
| 2月Feb. | 0.07 | 0.01 | 0.09 | 0.02 | 0.06 | 0.07 | 0.59 | 0.09 | 0.06 |
| 3月Mar. | 0.24 | 0.02 | 0.03 | 0.04 | 0.25 | 0.12 | 1.20 | 0.07 | 0.15 |
| 4月Apr. | 0.25 | 0.03 | 0.16 | 0.03 | 0.15 | 0.46 | 0.69 | 0.05 | 0.18 |
| 5月May | 0.89 | 0.29 | 0.52 | 0.24 | 1.12 | 0.98 | 1.90 | 0.69 | 1.88 |
| 6月Jun. | 0.60 | 0.30 | 0.44 | 0.17 | 0.64 | 0.63 | 1.82 | 0.87 | 2.04 |
| 7月Jul. | 1.72 | 0.49 | 0.93 | 0.69 | 1.31 | 1.11 | 2.59 | 2.22 | 4.28 |
| 8月Aug. | 0.71 | 0.16 | 0.18 | 0.17 | 0.85 | 0.72 | 1.65 | 0.51 | 1.18 |
| 9月Sept. | 0.27 | 0.08 | 0.09 | 0.06 | 0.42 | 0.32 | 0.65 | 0.32 | 1.13 |
| 10月Oct. | 0.36 | 0.09 | 0.16 | 0.02 | 0.66 | 0.69 | 2.74 | 0.39 | 0.96 |
| 11月Nov. | 0.08 | 0.03 | 0.03 | 0.01 | 0.32 | 0.33 | 0.51 | 0.07 | 0.27 |
| 12月Dec. | 0.04 | 0.01 | 0.07 | 0.05 | 0.18 | 0.30 | 0.21 | 0.15 | 0.37 |
| No. 1 | No. 2 | |||||||||
|---|---|---|---|---|---|---|---|---|---|---|
| ① | ② | ③ | ④ | ⑤ | ① | ② | ③ | ④ | ⑤ | |
| 1月Jan. | 22.24 | -20.76 | 0.00 | 0.00 | 38.87 | -3.43 | 28.58 | 0.22 | 0.00 | 13.98 |
| 2月Feb. | 14.35 | 2.89 | 0.00 | 0.00 | 21.51 | 13.30 | 14.50 | 0.25 | 0.00 | 10.70 |
| 3月Mar. | 10.77 | 11.20 | 0.00 | 0.00 | 22.98 | 18.33 | 7.10 | 0.04 | 0.00 | 19.48 |
| 4月Apr. | 21.81 | -1.10 | 0.02 | 0.00 | 40.92 | 36.93 | -2.17 | 0.25 | 0.00 | 26.64 |
| 5月May | -48.63 | 117.05 | 0.11 | 4.23 | 111.84 | -22.11 | 131.00 | 2.75 | 0.21 | 72.75 |
| 6月Jun. | 21.13 | 54.01 | 0.02 | 4.05 | 70.36 | 31.01 | 56.47 | 1.57 | 0.15 | 60.37 |
| 7月Jul. | -0.35 | 100.84 | 1.48 | 7.53 | 115.97 | -11.63 | 122.39 | 8.69 | 2.74 | 103.28 |
| 8月Aug. | -0.41 | 53.82 | 1.16 | 2.44 | 54.42 | 18.25 | 48.43 | 2.98 | 0.00 | 41.77 |
| 9月Sept. | -7.30 | 26.24 | 0.39 | 0.15 | 23.09 | 0.46 | 20.58 | 0.87 | 0.00 | 20.66 |
| 10月Oct. | 17.57 | 18.11 | 0.01 | 0.00 | 40.14 | 8.00 | 31.09 | 0.87 | 0.00 | 35.87 |
| 11月Nov. | 4.33 | 7.18 | 0.00 | 0.00 | 18.39 | 8.13 | 7.43 | 0.42 | 0.00 | 13.92 |
| 12月Dec. | -10.91 | 15.94 | 0.00 | 0.00 | 34.57 | 10.88 | 20.7 | 0.00 | 0.00 | 8.02 |
Table 7 Hydrological balance of precipitation in experimental types of karst forest (mm)
| No. 1 | No. 2 | |||||||||
|---|---|---|---|---|---|---|---|---|---|---|
| ① | ② | ③ | ④ | ⑤ | ① | ② | ③ | ④ | ⑤ | |
| 1月Jan. | 22.24 | -20.76 | 0.00 | 0.00 | 38.87 | -3.43 | 28.58 | 0.22 | 0.00 | 13.98 |
| 2月Feb. | 14.35 | 2.89 | 0.00 | 0.00 | 21.51 | 13.30 | 14.50 | 0.25 | 0.00 | 10.70 |
| 3月Mar. | 10.77 | 11.20 | 0.00 | 0.00 | 22.98 | 18.33 | 7.10 | 0.04 | 0.00 | 19.48 |
| 4月Apr. | 21.81 | -1.10 | 0.02 | 0.00 | 40.92 | 36.93 | -2.17 | 0.25 | 0.00 | 26.64 |
| 5月May | -48.63 | 117.05 | 0.11 | 4.23 | 111.84 | -22.11 | 131.00 | 2.75 | 0.21 | 72.75 |
| 6月Jun. | 21.13 | 54.01 | 0.02 | 4.05 | 70.36 | 31.01 | 56.47 | 1.57 | 0.15 | 60.37 |
| 7月Jul. | -0.35 | 100.84 | 1.48 | 7.53 | 115.97 | -11.63 | 122.39 | 8.69 | 2.74 | 103.28 |
| 8月Aug. | -0.41 | 53.82 | 1.16 | 2.44 | 54.42 | 18.25 | 48.43 | 2.98 | 0.00 | 41.77 |
| 9月Sept. | -7.30 | 26.24 | 0.39 | 0.15 | 23.09 | 0.46 | 20.58 | 0.87 | 0.00 | 20.66 |
| 10月Oct. | 17.57 | 18.11 | 0.01 | 0.00 | 40.14 | 8.00 | 31.09 | 0.87 | 0.00 | 35.87 |
| 11月Nov. | 4.33 | 7.18 | 0.00 | 0.00 | 18.39 | 8.13 | 7.43 | 0.42 | 0.00 | 13.92 |
| 12月Dec. | -10.91 | 15.94 | 0.00 | 0.00 | 34.57 | 10.88 | 20.7 | 0.00 | 0.00 | 8.02 |
| 月份 Month | Ca2+ | Mg2+ | K+ | Na+ | | | | Cl- |
|---|---|---|---|---|---|---|---|---|
| 1月Jan. | 0.267 | 0.236 | 0.051 | 0.018 | 0.089 | 0.426 | 0.047 | 0.133 |
| 2月Feb. | 0.784 | 0.191 | 0.051 | 0.029 | 0.169 | 1.190 | 0.080 | 0.051 |
| 3月Mar. | 0.448 | 0.092 | 0.051 | 0.045 | 0.070 | 0.495 | 0.119 | 0.039 |
| 4月Apr. | 0.208 | 0.061 | 0.034 | 0.010 | 0.079 | 0.291 | 0.049 | 0.013 |
| 5月May | 0.118 | 0.038 | 0.038 | 0.005 | 0.022 | 0.138 | 0.014 | 0.009 |
| 6月Jun. | 0.077 | 0.024 | 0.032 | 0.004 | 0.030 | 0.138 | 0.007 | 0.005 |
| 7月Jul. | 0.090 | 0.030 | 0.045 | 0.030 | 0.042 | 0.122 | 0.009 | 0.027 |
| 8月Aug. | 0.155 | 0.044 | 0.028 | 0.017 | 0.039 | 0.188 | 0.015 | 0.016 |
| 9月Sept. | 0.101 | 0.037 | 0.031 | 0.012 | 0.042 | 0.192 | 0.009 | 0.012 |
| 10月Oct. | 0.155 | 0.044 | 0.043 | 0.012 | 0.152 | 0.433 | 0.042 | 0.017 |
| 11月Nov. | 0.281 | 0.093 | 0.082 | 0.014 | 0.040 | 0.417 | 0.008 | 0.054 |
| 12月Dec. | 0.460 | 0.156 | 0.116 | 0.036 | 0.129 | 0.571 | 0.034 | 0.037 |
Table 8 Monthly variations of relative ion mean contents of forest-gap precipitation in karst forest (mmol·L-1)
| 月份 Month | Ca2+ | Mg2+ | K+ | Na+ | | | | Cl- |
|---|---|---|---|---|---|---|---|---|
| 1月Jan. | 0.267 | 0.236 | 0.051 | 0.018 | 0.089 | 0.426 | 0.047 | 0.133 |
| 2月Feb. | 0.784 | 0.191 | 0.051 | 0.029 | 0.169 | 1.190 | 0.080 | 0.051 |
| 3月Mar. | 0.448 | 0.092 | 0.051 | 0.045 | 0.070 | 0.495 | 0.119 | 0.039 |
| 4月Apr. | 0.208 | 0.061 | 0.034 | 0.010 | 0.079 | 0.291 | 0.049 | 0.013 |
| 5月May | 0.118 | 0.038 | 0.038 | 0.005 | 0.022 | 0.138 | 0.014 | 0.009 |
| 6月Jun. | 0.077 | 0.024 | 0.032 | 0.004 | 0.030 | 0.138 | 0.007 | 0.005 |
| 7月Jul. | 0.090 | 0.030 | 0.045 | 0.030 | 0.042 | 0.122 | 0.009 | 0.027 |
| 8月Aug. | 0.155 | 0.044 | 0.028 | 0.017 | 0.039 | 0.188 | 0.015 | 0.016 |
| 9月Sept. | 0.101 | 0.037 | 0.031 | 0.012 | 0.042 | 0.192 | 0.009 | 0.012 |
| 10月Oct. | 0.155 | 0.044 | 0.043 | 0.012 | 0.152 | 0.433 | 0.042 | 0.017 |
| 11月Nov. | 0.281 | 0.093 | 0.082 | 0.014 | 0.040 | 0.417 | 0.008 | 0.054 |
| 12月Dec. | 0.460 | 0.156 | 0.116 | 0.036 | 0.129 | 0.571 | 0.034 | 0.037 |
| 月份 Month | Ca2+ | Mg2+ | K+ | Na+ | | | | Cl- |
|---|---|---|---|---|---|---|---|---|
| 1月Jan. | 0.753 | 0.165 | 0.128 | 0.012 | 0.084 | 1.041 | 0.061 | 0.032 |
| 2月Feb. | 0.859 | 0.186 | 0.128 | 0.017 | 0.114 | 1.184 | 0.085 | 0.033 |
| 3月Mar. | 0.727 | 0.149 | 0.128 | 0.038 | 0.133 | 0.822 | 0.100 | 0.048 |
| 4月Apr. | 0.340 | 0.107 | 0.087 | 0.013 | 0.106 | 0.494 | 0.035 | 0.026 |
| 5月May | 0.158 | 0.067 | 0.054 | 0.007 | 0.053 | 0.221 | 0.019 | 0.013 |
| 6月Jun. | 0.138 | 0.073 | 0.070 | 0.007 | 0.090 | 0.258 | 0.015 | 0.012 |
| 7月Jul. | 0.169 | 0.061 | 0.083 | 0.007 | 0.108 | 0.241 | 0.017 | 0.011 |
| 8月Aug. | 0.280 | 0.106 | 0.064 | 0.007 | 0.050 | 0.375 | 0.020 | 0.012 |
| 9月Sept. | 0.518 | 0.171 | 0.113 | 0.008 | 0.056 | 0.670 | 0.048 | 0.021 |
| 10月Oct. | 0.565 | 0.193 | 0.170 | 0.013 | 0.111 | 0.919 | 0.053 | 0.035 |
| 11月Nov. | 1.148 | 0.388 | 0.304 | 0.019 | 0.062 | 1.574 | 0.091 | 0.076 |
| 12月Dec. | 1.093 | 0.342 | 0.218 | 0.020 | 0.099 | 1.330 | 0.042 | 0.110 |
Table 9 Monthly variations of relative ion mean contents of inner forest precipitation in karst forest (mmol·L-1)
| 月份 Month | Ca2+ | Mg2+ | K+ | Na+ | | | | Cl- |
|---|---|---|---|---|---|---|---|---|
| 1月Jan. | 0.753 | 0.165 | 0.128 | 0.012 | 0.084 | 1.041 | 0.061 | 0.032 |
| 2月Feb. | 0.859 | 0.186 | 0.128 | 0.017 | 0.114 | 1.184 | 0.085 | 0.033 |
| 3月Mar. | 0.727 | 0.149 | 0.128 | 0.038 | 0.133 | 0.822 | 0.100 | 0.048 |
| 4月Apr. | 0.340 | 0.107 | 0.087 | 0.013 | 0.106 | 0.494 | 0.035 | 0.026 |
| 5月May | 0.158 | 0.067 | 0.054 | 0.007 | 0.053 | 0.221 | 0.019 | 0.013 |
| 6月Jun. | 0.138 | 0.073 | 0.070 | 0.007 | 0.090 | 0.258 | 0.015 | 0.012 |
| 7月Jul. | 0.169 | 0.061 | 0.083 | 0.007 | 0.108 | 0.241 | 0.017 | 0.011 |
| 8月Aug. | 0.280 | 0.106 | 0.064 | 0.007 | 0.050 | 0.375 | 0.020 | 0.012 |
| 9月Sept. | 0.518 | 0.171 | 0.113 | 0.008 | 0.056 | 0.670 | 0.048 | 0.021 |
| 10月Oct. | 0.565 | 0.193 | 0.170 | 0.013 | 0.111 | 0.919 | 0.053 | 0.035 |
| 11月Nov. | 1.148 | 0.388 | 0.304 | 0.019 | 0.062 | 1.574 | 0.091 | 0.076 |
| 12月Dec. | 1.093 | 0.342 | 0.218 | 0.020 | 0.099 | 1.330 | 0.042 | 0.110 |
| 月份 Month | Ca2+ | Mg2+ | K+ | Na+ | | S | | Cl- |
|---|---|---|---|---|---|---|---|---|
| 1月Jan. | 4.775 | 2.024 | 0.319 | 0.045 | 0.063 | 7.462 | 0.046 | 0.186 |
| 2月Feb. | 5.485 | 2.079 | 0.319 | 0.053 | 0.061 | 8.377 | 0.005 | 0.213 |
| 3月Mar. | 3.935 | 1.156 | 0.319 | 0.048 | 0.177 | 5.128 | 0.129 | 0.195 |
| 4月Apr. | 2.430 | 0.625 | 0.400 | 0.020 | 0.102 | 3.535 | 0.023 | 0.095 |
| 5月May | 0.980 | 0.233 | 0.200 | 0.008 | 0.111 | 1.149 | 0.039 | 0.043 |
| 6月Jun. | 0.647 | 0.208 | 0.248 | 0.006 | 0.279 | 1.007 | 0.030 | 0.043 |
| 7月Jul. | 0.631 | 0.198 | 0.221 | 0.005 | 0.132 | 0.938 | 0.024 | 0.043 |
| 8月Aug. | 0.724 | 0.192 | 0.171 | 0.005 | 0.060 | 0.861 | 0.010 | 0.032 |
| 9月Sept. | 1.709 | 0.707 | 0.469 | 0.019 | 0.163 | 2.227 | 0.039 | 0.108 |
| 10月Oct. | 1.295 | 0.470 | 0.409 | 0.013 | 0.089 | 1.996 | 0.025 | 0.079 |
| 11月Nov. | 2.476 | 0.793 | 0.696 | 0.018 | 0.065 | 3.772 | 0.005 | 0.107 |
| 12月Dec. | 3.814 | 1.529 | 0.794 | 0.030 | 0.078 | 5.693 | 0.021 | 0.143 |
Table 10 Monthly variations of relative ion mean contents in the stemflow of several trees in karst forest (mmol·L-1)
| 月份 Month | Ca2+ | Mg2+ | K+ | Na+ | | S | | Cl- |
|---|---|---|---|---|---|---|---|---|
| 1月Jan. | 4.775 | 2.024 | 0.319 | 0.045 | 0.063 | 7.462 | 0.046 | 0.186 |
| 2月Feb. | 5.485 | 2.079 | 0.319 | 0.053 | 0.061 | 8.377 | 0.005 | 0.213 |
| 3月Mar. | 3.935 | 1.156 | 0.319 | 0.048 | 0.177 | 5.128 | 0.129 | 0.195 |
| 4月Apr. | 2.430 | 0.625 | 0.400 | 0.020 | 0.102 | 3.535 | 0.023 | 0.095 |
| 5月May | 0.980 | 0.233 | 0.200 | 0.008 | 0.111 | 1.149 | 0.039 | 0.043 |
| 6月Jun. | 0.647 | 0.208 | 0.248 | 0.006 | 0.279 | 1.007 | 0.030 | 0.043 |
| 7月Jul. | 0.631 | 0.198 | 0.221 | 0.005 | 0.132 | 0.938 | 0.024 | 0.043 |
| 8月Aug. | 0.724 | 0.192 | 0.171 | 0.005 | 0.060 | 0.861 | 0.010 | 0.032 |
| 9月Sept. | 1.709 | 0.707 | 0.469 | 0.019 | 0.163 | 2.227 | 0.039 | 0.108 |
| 10月Oct. | 1.295 | 0.470 | 0.409 | 0.013 | 0.089 | 1.996 | 0.025 | 0.079 |
| 11月Nov. | 2.476 | 0.793 | 0.696 | 0.018 | 0.065 | 3.772 | 0.005 | 0.107 |
| 12月Dec. | 3.814 | 1.529 | 0.794 | 0.030 | 0.078 | 5.693 | 0.021 | 0.143 |
| 月份 Month | Ca2+ | Mg2+ | K+ | Na+ | | | | Cl- |
|---|---|---|---|---|---|---|---|---|
| 1月Jan. | 1.678 | 1.895 | 0.014 | 0.011 | 0.000 | 0.230 | 0.052 | 0.010 |
| 2月Feb. | 2.799 | 3.130 | 0.014 | 0.024 | 0.000 | 0.328 | 0.102 | 0.016 |
| 3月Mar. | 2.566 | 3.109 | 0.014 | 0.016 | 0.000 | 0.234 | 0.126 | 0.018 |
| 4月Apr. | 2.454 | 2.629 | 0.015 | 0.015 | 0.000 | 0.318 | 0.097 | 0.020 |
| 5月May | 2.257 | 2.368 | 0.025 | 0.028 | 0.001 | 0.609 | 0.084 | 0.060 |
| 6月Jun. | 2.532 | 2.626 | 0.017 | 0.036 | 0.003 | 0.552 | 0.094 | 0.053 |
| 7月Jul. | 2.730 | 3.118 | 0.032 | 0.024 | 0.004 | 0.478 | 0.094 | 0.031 |
| 8月Aug. | 2.946 | 3.554 | 0.013 | 0.028 | 0.003 | 0.468 | 0.105 | 0.034 |
| 9月Sept. | 2.190 | 3.160 | 0.002 | 0.023 | 0.001 | 0.342 | 0.065 | 0.017 |
| 10月Oct. | 2.706 | 3.298 | 0.000 | 0.027 | 0.005 | 0.382 | 0.070 | 0.018 |
| 11月Nov. | 2.378 | 3.125 | 0.000 | 0.021 | 0.000 | 0.340 | 0.075 | 0.018 |
| 12月Dec. | 2.546 | 2.927 | 0.004 | 0.020 | 0.000 | 0.324 | 0.078 | 0.017 |
Table 11 Monthly variations of relative ion mean contents of upper and lower stream (mmol·L-1)
| 月份 Month | Ca2+ | Mg2+ | K+ | Na+ | | | | Cl- |
|---|---|---|---|---|---|---|---|---|
| 1月Jan. | 1.678 | 1.895 | 0.014 | 0.011 | 0.000 | 0.230 | 0.052 | 0.010 |
| 2月Feb. | 2.799 | 3.130 | 0.014 | 0.024 | 0.000 | 0.328 | 0.102 | 0.016 |
| 3月Mar. | 2.566 | 3.109 | 0.014 | 0.016 | 0.000 | 0.234 | 0.126 | 0.018 |
| 4月Apr. | 2.454 | 2.629 | 0.015 | 0.015 | 0.000 | 0.318 | 0.097 | 0.020 |
| 5月May | 2.257 | 2.368 | 0.025 | 0.028 | 0.001 | 0.609 | 0.084 | 0.060 |
| 6月Jun. | 2.532 | 2.626 | 0.017 | 0.036 | 0.003 | 0.552 | 0.094 | 0.053 |
| 7月Jul. | 2.730 | 3.118 | 0.032 | 0.024 | 0.004 | 0.478 | 0.094 | 0.031 |
| 8月Aug. | 2.946 | 3.554 | 0.013 | 0.028 | 0.003 | 0.468 | 0.105 | 0.034 |
| 9月Sept. | 2.190 | 3.160 | 0.002 | 0.023 | 0.001 | 0.342 | 0.065 | 0.017 |
| 10月Oct. | 2.706 | 3.298 | 0.000 | 0.027 | 0.005 | 0.382 | 0.070 | 0.018 |
| 11月Nov. | 2.378 | 3.125 | 0.000 | 0.021 | 0.000 | 0.340 | 0.075 | 0.018 |
| 12月Dec. | 2.546 | 2.927 | 0.004 | 0.020 | 0.000 | 0.324 | 0.078 | 0.017 |
| Ca2+ | Mg2+ | K+ | Na+ | | | | Cl- | ||
|---|---|---|---|---|---|---|---|---|---|
| No.1 | ① | 84.064 | 16.287 | 19.557 | 5.696 | 10.777 | 263.205 | 19.140 | 12.225 |
| ② | 168.525 | 32.395 | 37.442 | 2.759 | 19.814 | 539.025 | 24.594 | 11.050 | |
| ③ | 1.619 | 0.156 | 0.845 | 0.714 | 0.158 | 1.666 | 0.764 | 0.096 | |
| ④ | 11.320 | 3.283 | 0.856 | 0.876 | 0.010 | 26.229 | 0.662 | 0.535 | |
| No.2 | ① | 50.800 | 9.712 | 12.741 | 1.836 | 9.203 | 206.129 | 10.328 | 3.352 |
| ② | 94.162 | 20.911 | 34.576 | 1.623 | 9.058 | 335.028 | 11.622 | 4.579 | |
| ③ | 6.791 | 0.801 | 3.784 | 0.990 | 0.066 | 10.408 | 1.450 | 0.479 | |
| ④ | 3.312 | 0.789 | 0.886 | 0.182 | 0.386 | 8.368 | 0.214 | 0.310 |
Table 12 Relative ion distribution transported by precipitation in experimental types of karst forests (kg·hm-2·a-1)
| Ca2+ | Mg2+ | K+ | Na+ | | | | Cl- | ||
|---|---|---|---|---|---|---|---|---|---|
| No.1 | ① | 84.064 | 16.287 | 19.557 | 5.696 | 10.777 | 263.205 | 19.140 | 12.225 |
| ② | 168.525 | 32.395 | 37.442 | 2.759 | 19.814 | 539.025 | 24.594 | 11.050 | |
| ③ | 1.619 | 0.156 | 0.845 | 0.714 | 0.158 | 1.666 | 0.764 | 0.096 | |
| ④ | 11.320 | 3.283 | 0.856 | 0.876 | 0.010 | 26.229 | 0.662 | 0.535 | |
| No.2 | ① | 50.800 | 9.712 | 12.741 | 1.836 | 9.203 | 206.129 | 10.328 | 3.352 |
| ② | 94.162 | 20.911 | 34.576 | 1.623 | 9.058 | 335.028 | 11.622 | 4.579 | |
| ③ | 6.791 | 0.801 | 3.784 | 0.990 | 0.066 | 10.408 | 1.450 | 0.479 | |
| ④ | 3.312 | 0.789 | 0.886 | 0.182 | 0.386 | 8.368 | 0.214 | 0.310 |
| 项目Item | No. 1 | No. 2 |
|---|---|---|
| 乔木层 Arboreous layer | 21.96 | 8.82 |
| 灌木层 Arbuscular layer | 0.29 | 0.19 |
| 草本层Herbaceous layer | 0.05 | 0.02 |
| 枯落物层Litter layer | 5.90 | 5.47 |
| 土壤层 Soil layer A层A stratum | 59.54 (6.62) | 66.79 (5.14) |
| B层 B stratum | 159.72 (7.26) | 32.26 (3.23) |
| C层 C stratum | 477.86 (5.37) | 238.18 (1.88) |
Table 13 Maximum water-retaining capacity in experimental types of karst forest (mm, mm·(3 cm)-1)
| 项目Item | No. 1 | No. 2 |
|---|---|---|
| 乔木层 Arboreous layer | 21.96 | 8.82 |
| 灌木层 Arbuscular layer | 0.29 | 0.19 |
| 草本层Herbaceous layer | 0.05 | 0.02 |
| 枯落物层Litter layer | 5.90 | 5.47 |
| 土壤层 Soil layer A层A stratum | 59.54 (6.62) | 66.79 (5.14) |
| B层 B stratum | 159.72 (7.26) | 32.26 (3.23) |
| C层 C stratum | 477.86 (5.37) | 238.18 (1.88) |
| 项目 Item | No. 1 | No. 2 | |||||||
|---|---|---|---|---|---|---|---|---|---|
| N3- | K+ | Ca2+ | Mg2+ | N3- | K+ | Ca2+ | Mg2+ | ||
| 乔木层Arboreous layer | 0.793 | 0.571 | 2.197 | 0.559 | 0.304 | 0.217 | 0.834 | 0.211 | |
| 灌木层Arbuscular layer | 0.024 | 0.003 | 0.058 | 0.003 | 0.016 | 0.002 | 0.039 | 0.002 | |
| 草本层Herbaceous layer | 0.004 | 0.001 | 0.004 | 0.001 | 0.002 | 0.001 | 0.002 | 0.001 | |
| 枯落物层Litter layer | 0.228 | 0.073 | 0.178 | 0.034 | 0.212 | 0.068 | 0.166 | 0.031 | |
| 土壤层 Soil layer | A层 A stratum | 2.910 | 5.831 | 1.524 | 8.783 | 2.352 | 4.392 | 0.225 | 1.236 |
| B层 B stratum | 1.993 | 26.010 | 3.559 | 44.006 | 0.987 | 3.620 | 0.223 | 1.670 | |
| C层 C stratum | 5.991 | 112.072 | 10.790 | 183.435 | 7.482 | 67.911 | 1.658 | 21.553 | |
| 加权值Rational value | 0.481 | 3.089 | 0.452 | 5.037 | 0.339 | 1.235 | 0.053 | 0.432 | |
Table 14 Relative ions distribution in experimental types of karst forest (Mg·hm-2)
| 项目 Item | No. 1 | No. 2 | |||||||
|---|---|---|---|---|---|---|---|---|---|
| N3- | K+ | Ca2+ | Mg2+ | N3- | K+ | Ca2+ | Mg2+ | ||
| 乔木层Arboreous layer | 0.793 | 0.571 | 2.197 | 0.559 | 0.304 | 0.217 | 0.834 | 0.211 | |
| 灌木层Arbuscular layer | 0.024 | 0.003 | 0.058 | 0.003 | 0.016 | 0.002 | 0.039 | 0.002 | |
| 草本层Herbaceous layer | 0.004 | 0.001 | 0.004 | 0.001 | 0.002 | 0.001 | 0.002 | 0.001 | |
| 枯落物层Litter layer | 0.228 | 0.073 | 0.178 | 0.034 | 0.212 | 0.068 | 0.166 | 0.031 | |
| 土壤层 Soil layer | A层 A stratum | 2.910 | 5.831 | 1.524 | 8.783 | 2.352 | 4.392 | 0.225 | 1.236 |
| B层 B stratum | 1.993 | 26.010 | 3.559 | 44.006 | 0.987 | 3.620 | 0.223 | 1.670 | |
| C层 C stratum | 5.991 | 112.072 | 10.790 | 183.435 | 7.482 | 67.911 | 1.658 | 21.553 | |
| 加权值Rational value | 0.481 | 3.089 | 0.452 | 5.037 | 0.339 | 1.235 | 0.053 | 0.432 | |
| [1] | Bonell M (1993). Progress in the understanding of runoff generation dynamics in forest. Journal of Hydrology, 150,217-275. |
| [2] | Dunkerley DL (2000). Measuring interception loss and canopy storage in dry land vegetation: a brief review and evaluation of available research strategies. Hydrological Processes, 14,669-678. |
| [3] | Dunne T (1991). Effects of rainfall, vegetation and microtopography on infiltration and runoff. Water Resources Research, 27,2271-2285. |
| [4] | Feng ZW (冯宗炜), Wang XK (王效科), Wu G (吴刚) (1999). Biomass and Productivity of Forest Ecosystem in China (中国森林生态系统的生物量和生产力). Science Press, Beijing. (in Chinese) |
| [5] | Gupta VK, Mesa OJ (1988). Runoff generation and hydrologic responses via channel network geomorphology: recent progress and open problems. Journal of Hydrology, 102,3-28. |
| [6] | Hargreaves GH, Samani ZA (1982). Estimation of potential evapotranspiration. Journal of Irrigation and Drainage Diversion, Proceedings of the American Society of Civil Engineering, 108,223-230. |
| [7] | Henderson GS, Harris CF, Todd DE (1977). Quality and chemistry of throughfall as influenced by forest type and season. Journal of Ecology, 65,365-374. |
| [8] | Henny AJ (1999). Waterflow and nitrate transport to a groundwater-fed stream in the Belgian-Dutch chalk region. Hydrological Processes, 13,295-307. |
| [9] | Jin XQ (金小麒) (2000). Eco-economic function of main forest stand types in Wujiang river watershed. Journal of Soil and Water Conservation (水土保持学报), 14,64-68. (in Chinese with English abstract) |
| [10] |
Kelliher FM (1989). Evaporation and canopy characteristics of coniferous forests and grasslands. Oecologia, 95,153-163.
DOI URL PMID |
| [11] | Liu SR (刘世荣), Wen YG (温远光), Wang B (王兵), Zhou GY (周光益) (1996). Ecohydrological Functions of Forest Ecosystems in China (中国森林生态系统水文生态功能规律). China Forestry Publishing House, Beijing. (in Chinese with English abstract) |
| [12] | Liu YL (刘映良) (2005). A Study on the Vegetation Restoration of Degraded Ecosystem in Typical Karst Mountainous Area (喀斯特典型山地退化生态系统植被恢复研究). PhD dissertation, Nanjing Forestry University, Nanjing. (in Chinese with English abstract) |
| [13] | Lu RK (鲁如坤) (2000). Analysis Methods of Soil Agricultural Chemistry (土壤农业化学分析方法). Chinese Agricultural Science and Technology Press, Beijing. (in Chinese) |
| [14] | Mei ZM (梅再美), Xiong KN (熊康宁) (2003). A study on the dynamic characteristics of soil erosion and eco-benefit evaluation in karst region—a case study on Qingzhen demonstrating site of returning farmland to wood (grass), Guizhou. Carsologica Sinica (中国岩溶), 22,136-143. (in Chinese with English abstract) |
| [15] | Neary AJ, Gizyn WI (1994). Throughfall and stemflow chemistry under deciduous and coniferous forest canopy in south-central Ontario. Canadian Journal of Forest Research, 24,1089-1100. |
| [16] | Oyarzún C, Godoy R, Sepúlveda A (1998). Water and nutrient fluxes in a cool temperate rainforest at the Cordillera de la Costa in Southern Chile. Hydrological Processes, 12,1067-1077. |
| [17] | Parker GG (1983). Throughfall and stemflow in the forest nutrient cycle. Advances in Ecological Research, 13,58-135. |
| [18] | Peter DL (1995). Runoff production in a forested, shallow soil, Canadian shield basin. Water Resources Research, 31,1291-1304. |
| [19] | Putuhena WM, Cordery I (1996). Estimation of interception capacity of the forest floor. Journal of Hydrology, 180,283-299. |
| [20] | Ran DC (冉顶丞), He SY (何师意), Cao JH (曹建华), Xiong ZB (熊志斌), Chen HM (陈会明) (2003). A study on hydrological benefit of karst forest in Maolan. In: Zhu SQ 朱守谦ed. Ecological Research on Karst Forest (喀斯特森林生态研究)(Ⅲ). Guizhou Science and Technology Press, Guiyang,135-140. (in Chinese) |
| [21] | Schaap MG, Bouten W (1997). Forest floor evaporation in a dense Douglas fir stand. Journal of Hydrology, 193,97-113. |
| [22] | Stednick JD (1996). Monitoring the effects of timber harvest on annual water yield. Journal of Hydrology, 176,79-95. |
| [23] | State Forestry Administration of China (国家林业局) (1999) Forest Soil Analysis Methods—Forestry Professional Standards of China, LY/T 1210-1275 (中华人民共和国林业行业标准——森林土壤分析方法). Standards Press of China, Beijing. (in Chinese) |
| [24] | State Weather Administration of China (中央气象局) (1979). Meteorological Observation at Ground Standards (地面气象观测规范). China Meteorological Press, Beijing. (in Chinese) |
| [25] | Thornthwaite CW (1948). An approach toward a rational classification of climate. Geographical Review, 38,55-94. |
| [26] | Viville D (1993). Interception on a mountainous declining spruce stands in the Strengbach catchment (Voges, France). Journal of Hydrology, 144,892-898. |
| [27] | Wei QF (韦启番) (1996). Erosion characteristics and prevention of karst area in the southern of China. Research of Soil and Water Conservation (水土保持研究), 3(4),72-76. (in Chinese with English abstract) |
| [28] | Yu LF (喻理飞), Zhu SQ (朱守谦), Ye JZ (叶镜中), Wei LM (魏鲁明), Chen ZR (陈正仁) (2002). Dynamics of a degraded karst forest in the process of natural restoration. Scientia Silvae Sinicae (林业科学), 38(1),1-7. (in Chinese with English abstract) |
| [29] | Yu XX (余新晓), Zhang ZQ (张志强), Chen LH (陈丽华), Xie BY (谢宝元), Wang LX (王礼先) (2004). Forest Ecological Hydrology (森林生态水文). China Forestry Publishing House, Beijing. (in Chinese) |
| [30] | Zhu SQ (朱守谦) (1997). Ecological Research on Karst Forest (喀斯特森林生态研究)(Ⅱ). Guizhou Science and Technology Press, Guiyang. (in Chinese) |
| [31] | Zhou ZX (周政贤) (1987). Scientific Survey of the Maolan Karst Forest (茂兰喀斯特森林科学考察集). Guizhou People's Publishing House, Guiyang. (in Chinese) |
| Viewed | ||||||
|
Full text |
|
|||||
|
Abstract |
|
|||||
Copyright © 2022 Chinese Journal of Plant Ecology
Tel: 010-62836134, 62836138, E-mail: apes@ibcas.ac.cn, cjpe@ibcas.ac.cn