
Chin J Plant Ecol ›› 2010, Vol. 34 ›› Issue (12): 1414-1423.DOI: 10.3773/j.issn.1005-264x.2010.12.007
• Research Articles • Previous Articles Next Articles
HOU Qiong1( ), WANG Ying-Shun2, YANG Ze-Long1, SHI Gui-Hua2
Received:2010-01-05
Accepted:2010-05-16
Online:2010-01-05
Published:2010-12-28
HOU Qiong, WANG Ying-Shun, YANG Ze-Long, SHI Gui-Hua. Dynamic simulation and definition of crop coefficient for typical steppe in Inner Mongolia, China[J]. Chin J Plant Ecol, 2010, 34(12): 1414-1423.
| 站点 Station | 经度 Longitude (E) | 纬度 Latitude (N) | 海拔高度Altitude (m) | 年降水量 Annual precipi- tation (mm) | Iw4-9 | 年平均气温 Annual mean air temperature (℃) | 年降水变率 Changing ratio of annual precipitation (%) | W0-50 (mm) | γ0-50 (g·m-3) |
|---|---|---|---|---|---|---|---|---|---|
| 锡林浩特 Xilinhot | 116°38′ | 43°57′ | 989.5 | 286.6 | 0.28 | 2.6 | 24.6 | 84.9 | 1.41 |
| 镶黄旗 Xianghuang Banner | 113°50′ | 42°14′ | 1 322.1 | 269.9 | 0.27 | 3.5 | 17.4 | 85.4 | 1.49 |
| 察哈尔右翼后旗 Qahar Youyi Houqi | 113°11′ | 41°27′ | 1 423.5 | 335.2 | 0.37 | 3.8 | 18.9 | 145.4 | 1.14 |
| 鄂温克族自治旗 Ewenkizu Autonomous Banner | 119°45′ | 49°09′ | 620.8 | 345.6 | 0.44 | -1.5 | 16.1 | 84.4 | 1.43 |
Table 1 Geographical coordinates, main characteristics of climate and soil of four meteorological stations
| 站点 Station | 经度 Longitude (E) | 纬度 Latitude (N) | 海拔高度Altitude (m) | 年降水量 Annual precipi- tation (mm) | Iw4-9 | 年平均气温 Annual mean air temperature (℃) | 年降水变率 Changing ratio of annual precipitation (%) | W0-50 (mm) | γ0-50 (g·m-3) |
|---|---|---|---|---|---|---|---|---|---|
| 锡林浩特 Xilinhot | 116°38′ | 43°57′ | 989.5 | 286.6 | 0.28 | 2.6 | 24.6 | 84.9 | 1.41 |
| 镶黄旗 Xianghuang Banner | 113°50′ | 42°14′ | 1 322.1 | 269.9 | 0.27 | 3.5 | 17.4 | 85.4 | 1.49 |
| 察哈尔右翼后旗 Qahar Youyi Houqi | 113°11′ | 41°27′ | 1 423.5 | 335.2 | 0.37 | 3.8 | 18.9 | 145.4 | 1.14 |
| 鄂温克族自治旗 Ewenkizu Autonomous Banner | 119°45′ | 49°09′ | 620.8 | 345.6 | 0.44 | -1.5 | 16.1 | 84.4 | 1.43 |
| 锡林浩特 Xilinhot | 镶黄旗 Xianghuang Banner | 察哈尔右翼后旗 Qahar Youyi Houqi | 鄂温克族自治旗 Ewenkizu Autonomous Banner | ||||||||
|---|---|---|---|---|---|---|---|---|---|---|---|
| 阈值 Threshold value (mm) | 概率 Probability (%) | 阈值 Threshold value (mm) | 概率 Probability (%) | 阈值 Threshold value (mm) | 概率 Probability (%) | 阈值 Threshold value (mm) | 概率 Probability (%) | ||||
| 丰水年 Wet hydrologic year | >300 | 23.1 | >300 | 15.4 | >350 | 22.2 | >380 | 21.4 | |||
| 平水年 Normal hydrologic year | 300-200 | 38.5 | 300-200 | 61.5 | 350-230 | 55.6 | 380-260 | 53.6 | |||
| 干旱年 Dry hydrologic year | <200 | 34.6 | <200 | 23.1 | <230 | 22.2 | <260 | 25.0 | |||
| 多年平均降水量 Average annual precipitation (mm) | 238.4 | 240.0 | 295.8 | 320.3 | |||||||
Table 2 Dividing results of annual precipitation of four meteorological stations
| 锡林浩特 Xilinhot | 镶黄旗 Xianghuang Banner | 察哈尔右翼后旗 Qahar Youyi Houqi | 鄂温克族自治旗 Ewenkizu Autonomous Banner | ||||||||
|---|---|---|---|---|---|---|---|---|---|---|---|
| 阈值 Threshold value (mm) | 概率 Probability (%) | 阈值 Threshold value (mm) | 概率 Probability (%) | 阈值 Threshold value (mm) | 概率 Probability (%) | 阈值 Threshold value (mm) | 概率 Probability (%) | ||||
| 丰水年 Wet hydrologic year | >300 | 23.1 | >300 | 15.4 | >350 | 22.2 | >380 | 21.4 | |||
| 平水年 Normal hydrologic year | 300-200 | 38.5 | 300-200 | 61.5 | 350-230 | 55.6 | 380-260 | 53.6 | |||
| 干旱年 Dry hydrologic year | <200 | 34.6 | <200 | 23.1 | <230 | 22.2 | <260 | 25.0 | |||
| 多年平均降水量 Average annual precipitation (mm) | 238.4 | 240.0 | 295.8 | 320.3 | |||||||
| 月份 Month | ETo (mm) | ETa (mm) | Kc | |||||||
|---|---|---|---|---|---|---|---|---|---|---|
| 2008年试验区 Experimental area in 2008 | 丰水年平均值 Average values of wet years | 差异 Difference | 2008年试验值 Experimental values in 2008 | 丰水年平均值 Average values of wet years | 差异 Difference | 2008年试验值 Experimental values in 2008 | 丰水年平均值 Average values of wet years | 差异 Difference | ||
| 4 | 113.4 | 121.8 | -8.4 | 24.8 | 31.6 | -6.8 | 0.22 | 0.26 | -0.04 | |
| 5 | 145.8 | 173.2 | -27.4 | 56.4 | 55.1 | 1.3 | 0.39 | 0.32 | 0.20 | |
| 6 | 160.9 | 180.1 | -19.2 | 76.5 | 75.7 | 0.8 | 0.48 | 0.42 | 0.06 | |
| 7 | 185.3 | 159.8 | 25.5 | 157.8 | 134.8 | 23.0 | 0.85 | 0.84 | 0.01 | |
| 8 | 152.2 | 138.4 | 13.8 | 155.2 | 113.6 | 41.6 | 1.02 | 0.82 | 0.20 | |
| 9 | 109.0 | 115.4 | -6.4 | 93.9 | 57.7 | 36.2 | 0.86 | 0.50 | 0.36 | |
| 4-9 | 866.5 | 888.8 | -22.3 | 564.6 | 468.4 | 96.2 | 0.65 | 0.53 | 0.12 | |
Table 3 Experimental values of water requirements of crop (ETa), evapotranspiration of reference crop (ETo) and crop coefficient (Kc) of typical steppe in growing season compared with calculated values on abundant precipitation years
| 月份 Month | ETo (mm) | ETa (mm) | Kc | |||||||
|---|---|---|---|---|---|---|---|---|---|---|
| 2008年试验区 Experimental area in 2008 | 丰水年平均值 Average values of wet years | 差异 Difference | 2008年试验值 Experimental values in 2008 | 丰水年平均值 Average values of wet years | 差异 Difference | 2008年试验值 Experimental values in 2008 | 丰水年平均值 Average values of wet years | 差异 Difference | ||
| 4 | 113.4 | 121.8 | -8.4 | 24.8 | 31.6 | -6.8 | 0.22 | 0.26 | -0.04 | |
| 5 | 145.8 | 173.2 | -27.4 | 56.4 | 55.1 | 1.3 | 0.39 | 0.32 | 0.20 | |
| 6 | 160.9 | 180.1 | -19.2 | 76.5 | 75.7 | 0.8 | 0.48 | 0.42 | 0.06 | |
| 7 | 185.3 | 159.8 | 25.5 | 157.8 | 134.8 | 23.0 | 0.85 | 0.84 | 0.01 | |
| 8 | 152.2 | 138.4 | 13.8 | 155.2 | 113.6 | 41.6 | 1.02 | 0.82 | 0.20 | |
| 9 | 109.0 | 115.4 | -6.4 | 93.9 | 57.7 | 36.2 | 0.86 | 0.50 | 0.36 | |
| 4-9 | 866.5 | 888.8 | -22.3 | 564.6 | 468.4 | 96.2 | 0.65 | 0.53 | 0.12 | |
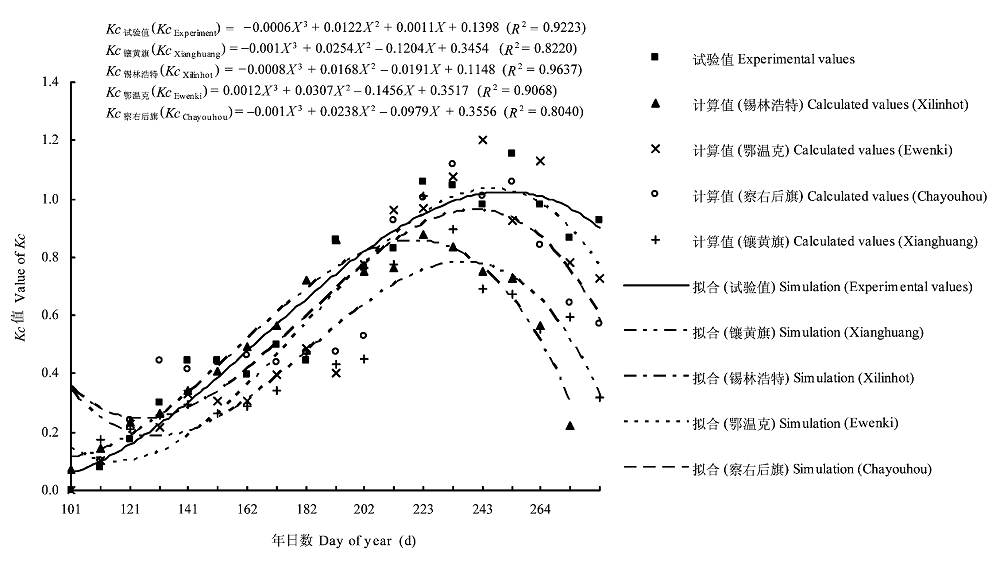
Fig. 1 Changing trend of crop coefficient (Kc) of four meteorological stations. Chayouhou, Qahar Youyi Houqi; Ewenki, Ewenkizu Autonomous Banner.
| 模拟方程式 Simulation equations | R2 | F | 拟合率 Fitting ratio (%) | |
|---|---|---|---|---|
| 标准作物系数 Standard crop coefficients | Kcs = -5.21 × 10-0.7D3 + 0.000258D2 - 0.0338D + 1.4712 | 0.922 5 | 43.6** | 86.8 |
| Kcs = -1.6 × 10⁻¹⁰Tj3 + 6.33 × 10-07Tj2 - 0.000346Tj + 0.4666 | 0.904 2 | 34.6** | 91.4 | |
| LAI | LAID = -5.45 × 10⁻¹⁰Tj3 + 2.45 × 10-0.6Tj2 - 0.0018Tj + 0.5141 | 0.982 5 | 153.5** | 81.5 |
| 植被盖度 Coverage of vegetation | GDD = -1.9 × 10⁻⁵Tj2 + 0.09Tj - 25 | 0.932 2 | 171.9** | 78.1 |
Table 4 Dynamic simulating equations of standard crop coefficient (Kcs), leaf area index (LAI) and coverage of typical steppe in Inner Mongolia under appropriate conditions of water
| 模拟方程式 Simulation equations | R2 | F | 拟合率 Fitting ratio (%) | |
|---|---|---|---|---|
| 标准作物系数 Standard crop coefficients | Kcs = -5.21 × 10-0.7D3 + 0.000258D2 - 0.0338D + 1.4712 | 0.922 5 | 43.6** | 86.8 |
| Kcs = -1.6 × 10⁻¹⁰Tj3 + 6.33 × 10-07Tj2 - 0.000346Tj + 0.4666 | 0.904 2 | 34.6** | 91.4 | |
| LAI | LAID = -5.45 × 10⁻¹⁰Tj3 + 2.45 × 10-0.6Tj2 - 0.0018Tj + 0.5141 | 0.982 5 | 153.5** | 81.5 |
| 植被盖度 Coverage of vegetation | GDD = -1.9 × 10⁻⁵Tj2 + 0.09Tj - 25 | 0.932 2 | 171.9** | 78.1 |
| 月份 Month | 锡林浩特 Xilinhot | 镶黄旗 Xianghuang Banner | 察右后旗 Chayouhou | 鄂温克 Ewenki | 4站平均 Average of four stations | 标准误差 Standard error | |||||||||||
|---|---|---|---|---|---|---|---|---|---|---|---|---|---|---|---|---|---|
| KcLocal | KcObservation | KcLocal | KcObservation | KcLocal | KcObservation | KcLocal | KcObservation | KcLocal | KcObservation | KcLocal | KcObservation | ||||||
| 4 | 0.06 | 0.16 | 0.09 | 0.14 | 0.12 | 0.09 | 0.16 | 0.08 | 0.11 | 0.12 | 0.042 8 | 0.038 7 | |||||
| 5 | 0.23 | 0.28 | 0.22 | 0.38 | 0.27 | 0.35 | 0.16 | 0.18 | 0.22 | 0.30 | 0.045 5 | 0.088 9 | |||||
| 6 | 0.55 | 0.64 | 0.44 | 0.42 | 0.49 | 0.48 | 0.39 | 0.43 | 0.47 | 0.49 | 0.068 6 | 0.101 8 | |||||
| 7 | 0.75 | 0.76 | 0.69 | 0.64 | 0.69 | 0.61 | 0.95 | 0.89 | 0.75 | 0.72 | 0.125 4 | 0.127 8 | |||||
| 8 | 0.62 | 0.79 | 0.58 | 0.63 | 0.86 | 0.70 | 1.16 | 1.17 | 0.81 | 0.82 | 0.267 1 | 0.240 8 | |||||
| 9 | 0.88 | 0.56 | 0.77 | 0.43 | 0.85 | 0.84 | 0.72 | 0.68 | 0.80 | 0.63 | 0.073 5 | 0.174 6 | |||||
| 4-9 | 0.51 | 0.53 | 0.47 | 0.44 | 0.53 | 0.51 | 0.59 | 0.57 | 0.53 | 0.51 | 0.050 3 | 0.054 5 | |||||
Table 5 Comparison of crop coefficient values calculated with two methods in typical wet years (2003 and 1998)
| 月份 Month | 锡林浩特 Xilinhot | 镶黄旗 Xianghuang Banner | 察右后旗 Chayouhou | 鄂温克 Ewenki | 4站平均 Average of four stations | 标准误差 Standard error | |||||||||||
|---|---|---|---|---|---|---|---|---|---|---|---|---|---|---|---|---|---|
| KcLocal | KcObservation | KcLocal | KcObservation | KcLocal | KcObservation | KcLocal | KcObservation | KcLocal | KcObservation | KcLocal | KcObservation | ||||||
| 4 | 0.06 | 0.16 | 0.09 | 0.14 | 0.12 | 0.09 | 0.16 | 0.08 | 0.11 | 0.12 | 0.042 8 | 0.038 7 | |||||
| 5 | 0.23 | 0.28 | 0.22 | 0.38 | 0.27 | 0.35 | 0.16 | 0.18 | 0.22 | 0.30 | 0.045 5 | 0.088 9 | |||||
| 6 | 0.55 | 0.64 | 0.44 | 0.42 | 0.49 | 0.48 | 0.39 | 0.43 | 0.47 | 0.49 | 0.068 6 | 0.101 8 | |||||
| 7 | 0.75 | 0.76 | 0.69 | 0.64 | 0.69 | 0.61 | 0.95 | 0.89 | 0.75 | 0.72 | 0.125 4 | 0.127 8 | |||||
| 8 | 0.62 | 0.79 | 0.58 | 0.63 | 0.86 | 0.70 | 1.16 | 1.17 | 0.81 | 0.82 | 0.267 1 | 0.240 8 | |||||
| 9 | 0.88 | 0.56 | 0.77 | 0.43 | 0.85 | 0.84 | 0.72 | 0.68 | 0.80 | 0.63 | 0.073 5 | 0.174 6 | |||||
| 4-9 | 0.51 | 0.53 | 0.47 | 0.44 | 0.53 | 0.51 | 0.59 | 0.57 | 0.53 | 0.51 | 0.050 3 | 0.054 5 | |||||
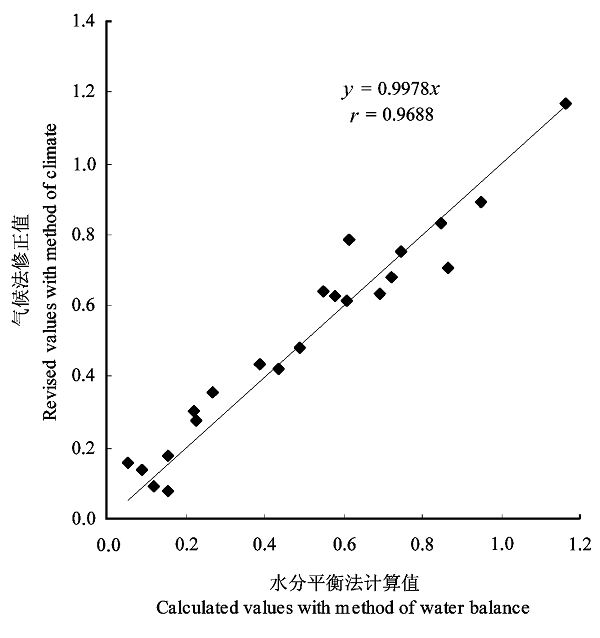
Fig. 2 Correlation of calculated results of two methods for crop coefficient calculation.
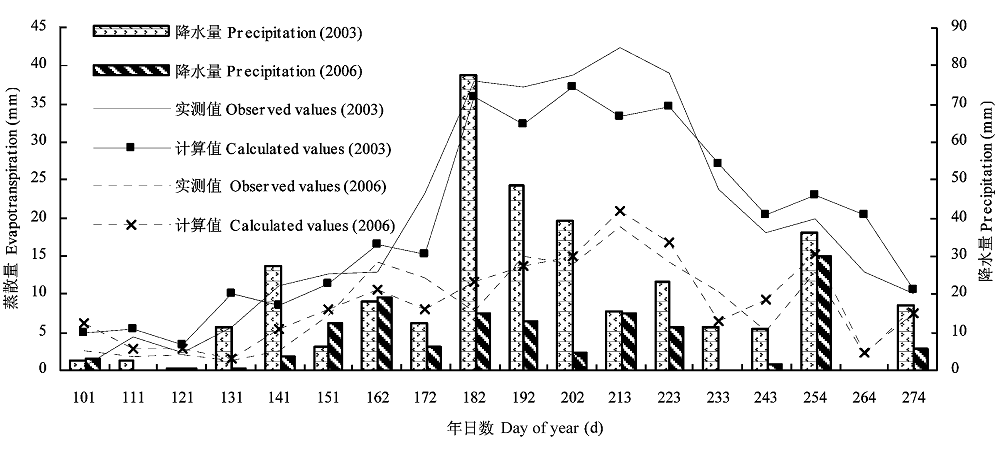
Fig. 3 Calculated values compared with observed values of evapotranspiration in 2003 and 2006.
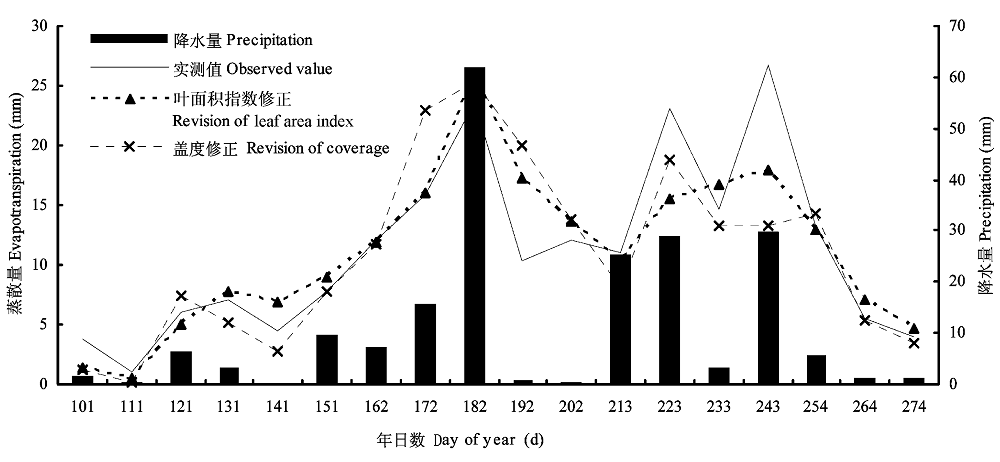
Fig. 4 Calculated values compared with observed values of evapotranspiration in 2008.
| 年度 Year | 降水量 Precipitation (mm) | 实测蒸散量 Observed evapotranspiration (mm) | 叶面积指数(LAI)修正值 Evapotranspiration values revised with method of leaf area index (LAI) (mm) | 盖度修正值 Evapotranspiration values revised with method of coverage (mm) | 相对误差 Relative error (%) | |
|---|---|---|---|---|---|---|
| LAI法 Method of LAI | 盖度法 Method of coverage | |||||
| 2003 | 361.3 | 354.1 | - | 351.1 | - | 0.85 |
| 2006 | 141.1 | 152.6 | - | 165.1 | - | -8.2 |
| 2008 | 203.6 | 202.4 | 196.0 | 195.5 | 3.2 | 3.4 |
Table 6 Comparison of total evapotranspiration between observed and calculated values on growing season (from April to September) in typical years
| 年度 Year | 降水量 Precipitation (mm) | 实测蒸散量 Observed evapotranspiration (mm) | 叶面积指数(LAI)修正值 Evapotranspiration values revised with method of leaf area index (LAI) (mm) | 盖度修正值 Evapotranspiration values revised with method of coverage (mm) | 相对误差 Relative error (%) | |
|---|---|---|---|---|---|---|
| LAI法 Method of LAI | 盖度法 Method of coverage | |||||
| 2003 | 361.3 | 354.1 | - | 351.1 | - | 0.85 |
| 2006 | 141.1 | 152.6 | - | 165.1 | - | -8.2 |
| 2008 | 203.6 | 202.4 | 196.0 | 195.5 | 3.2 | 3.4 |
| [1] | Allen RG, Pereira LS, Raes D, Smith M (1998). Crop evapotranspiration: guidelines for computing crop water requirements. In: Food and Agriculture Organization of the United Nations eds. FAO Irrigation and Drainage Paper 56. Rome. 50-51. |
| [2] | Chen SB, Liu YF, Thomas A (2008). Potential evapotranspira- tion trends and its spatial distributions on the Tibetan Plateau from 1961 to 2000. Journal of Natural Resources, 23, 990-1008. |
| [3] | Chen ZQ (陈仲全), He YS (何友松) (1991). Arid Climate (干旱气候). Education Press of Gansu, Lanzhou. 83-122. (in Chinese) |
| [4] | Chiew FHS, Kamadalasa NN, Malano HM, McMahon TA (1995). Penman-Monteith, FAO-24 reference crop evapotranspiration and class–a pan data in Australia. Agricultural Water Management, 28, 9-21. |
| [5] | David MS, Jennifer MJ (2005). Utility of Penman-Monteith, Priestley-Taylor, reference evapotranspiration, and pan evaporation methods to estimate pasture evapotranspiration. Journal of Hydrology, 308, 81-104. |
| [6] | Hou Q (侯琼), Chen SH (陈素华), Wulan Bater ( 乌兰巴特尔) (2008). Drought index of steppe in Inner Mongolia based on SPAC principle. Journal of Desert Research (中国沙漠), 28, 326-331. (in Chinese with English abstract) |
| [7] | Jensen E (1972). Consumptive Use of Water and Irrigation Water Requirements. Translated by Ma W (马文)(1982). Agricultural Press, Beijing. 37-39. (in Chinese) |
| [8] | Liang LQ (梁丽乔), Li LJ (李丽娟), Zhang L (张丽), Li JY (李九一), Jiang DJ (姜德娟) (2008). Sensitivity of the reference crop evapotranspiration in growing season in the West Songnen Plain. Transactions of the Chinese Society of Agricultural Engineering (农业工程学报), 24(5), 1-5. (in Chinese with English abstract) |
| [9] | Liu SD (刘寿东), Dai YJ (戴艳杰) (1998). Study on model to monitor and forecast soil water in grass land of Inner Mongolia. Meteorology Journal of Inner Mongolia (内蒙古气象), ( 3), 33-37. (in Chinese) |
| [10] | Liu Y (刘钰), Pereira LS (2000). Validation of FAO methods for estimating crop coefficients. Transactions of the Chinese Society of Agricultural Engineering (农业工程学报), 16(5), 26-30. (in Chinese with English abstract) |
| [11] | Ma HY (马海燕), Jiao XY (缴锡云) (2006). Research progress of the crop water demand calculation. Water Sciences and Engineering Technology (水科学与工程技术), ( 5), 5-7. (in Chinese with English abstract) |
| [12] | Mo XG (莫兴国), Xue L (薛玲), Lin ZH (林忠辉) (2005). Spatio-temporal distribution of crop evapotranspiration from 1981-2001 over the North China Plain. Journal of Natural Resources (自然资源学报), 20, 181-187. (in Chinese with English abstract) |
| [13] | Specht RL (1972). Water use by perennial evergreen plant communities in Australia and Papua New Guinea. Australian Journal of Botany, 28, 273-299. |
| [14] | Sun JS (孙景生), Liu ZG (刘祖贵), Zhang JY (张寄阳), Duan AW (段爱旺) (2000). Crop coefficients of spring wheat in windy dust area. Transactions of the Chinese Society of Agricultural Engineering (农业工程学报), 18(6), 55-58. (in Chinese with English abstract) |
| [15] | Wang YF (王永芬), Mo XG (莫兴国), Hao YB (郝彦宾), Guo RP (郭瑞萍), Huang XZ (黄祥忠), Wang YF (王艳芬) (2008). Simulating seasonal and interannual variations of ecosystem evapotranspiration and its components in Inner Mongolia steppe with VIP model. Journal of Plant Ecology (Chinese Version) (植物生态学报), 32, 1052-1060. (in Chinese with English abstract) |
| [16] | Wang YJ (王玉娟), Yang ST (杨胜天), Liu CM (刘昌明), Dai D (戴东), Zheng DH (郑东海), Zeng HJ (曾红娟) (2009). The analysis on the pattern of eco-water use of vegetation and the availability of green water in Sanmenxia area of Yellow River. Geographical Research (地理研究), 28, 74-84. (in Chinese with English abstract) |
| [17] | Wang YQ (王幼奇), Fan J (樊军), Shao MA (邵明安), Wang QJ (王全九) (2009). Evapotranspiration of three types of plants in water-wind erosion crisscross regions in the Loess Plateau. Acta Ecologica Sinica (生态学报), 29, 5386-5394. (in Chinese with English abstract) |
| [18] | Wang ZQ (王志强), Chao lunbagen (朝伦巴根), Chai JH (柴建华) (2006). Determination of regional basal coefficient of the grasses in arid area from dual crop coefficient approach. Journal of Arid Land Resources and Environment (干旱区资源与环境), 20(3), 100-104. (in Chinese with English abstract) |
| [19] | Weltzin JF, Lolk ME, Schwinning S, Williams DG, Fay AP (2003). Assessing the response of terrestrial ecosystems to potential changes in precipitation. BioScience, 53, 941-952. |
| [20] | Zhang F (张峰), Zhou GS (周广胜), Wang YH (王玉辉) (2008). Phenological calendar of Stipa krylovii steppe in Inner Mongolia, China and its correlation with climatic variables. Journal of Plant Ecology (Chinese Version) (植物生态学报), 32, 1312-1322. (in Chinese with English abstract) |
| [21] |
Zhang L (张莉), Zheng YR (郑元润) (2008). Simulation on the seasonal growth patterns of grassland plant communities in northern China. Chinese Journal of Applied Ecology (应用生态学报), 19, 2161-2167. (in Chinese with English abstract)
URL PMID |
| [22] | Zhao BX (赵炳祥), Chen ZZ (陈佐忠), Hu L (胡林), Zhang FS (张福锁), Zhang XM (张新民) (2003a). Turfgrass evapotranspiration: a review. Acta Ecologica Sinica (生态学报), 23, 148-157. (in Chinese with English abstract) |
| [23] | Zhao BX (赵炳祥), Hu L (胡林), Chen ZZ (陈佐忠), Zhang FS (张福锁), Zhang XM (张新民) (2003b). Evapotranspiration rates and crop coefficients of turfgrasses in North China. Journal of Beijing Forestry University (北京林业大学学报), 25(6), 39-44. (in Chinese with English abstract) |
| [1] | Zheng Hai-lei, Huang Zi-chen. Characteristics of Spring Wheat Evapotranspiration at Oasis Ecological Environment and its Influencing Factors [J]. Chin J Plan Ecolo, 1994, 18(4): 362-371. |
| Viewed | ||||||
|
Full text |
|
|||||
|
Abstract |
|
|||||
Copyright © 2022 Chinese Journal of Plant Ecology
Tel: 010-62836134, 62836138, E-mail: apes@ibcas.ac.cn, cjpe@ibcas.ac.cn