
Chin J Plant Ecol ›› 2017, Vol. 41 ›› Issue (5): 577-584.DOI: 10.17521/cjpe.2016.0383
• Method and Technology • Previous Articles Next Articles
Xin-Ting WANG1,*, Wei-Hua ZHANG1, Chao JIANG2,*, Cun-Zhu LIANG3
Online:2017-05-10
Published:2017-06-22
Contact:
Xin-Ting WANG,Chao JIANG
About author:KANG Jing-yao(1991-), E-mail: Xin-Ting WANG, Wei-Hua ZHANG, Chao JIANG, Cun-Zhu LIANG. Point pattern analysis under conditions of replicated sampling[J]. Chin J Plant Ecol, 2017, 41(5): 577-584.
Add to citation manager EndNote|Ris|BibTeX
URL: https://www.plant-ecology.com/EN/10.17521/cjpe.2016.0383
| 种群 Population | 重复 Replicate | 个体数量 Number of individuals |
|---|---|---|
| 羊草 L. chinensis | 1 | 2 601 |
| 2 | 1 869 | |
| 3 | 1 970 | |
| 大针茅 S. grandis | 1 | 528 |
| 2 | 512 | |
| 3 | 427 |
Table 1 Number of individuals in Leymus chinensis and Stipa grandis populations in each replicated plot on site of community with eight years of restoration
| 种群 Population | 重复 Replicate | 个体数量 Number of individuals |
|---|---|---|
| 羊草 L. chinensis | 1 | 2 601 |
| 2 | 1 869 | |
| 3 | 1 970 | |
| 大针茅 S. grandis | 1 | 528 |
| 2 | 512 | |
| 3 | 427 |
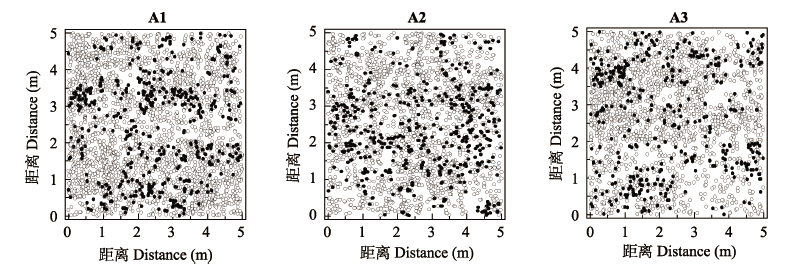
Fig. 1 Mapped points pattern of Leymus chinensis and Stipa grandis populations in communities with eight years of restoration (A1, A2 and A3 refer to replicates 1, 2 and 3, respectively). ○, L. chinensis; ●, S. grandis.
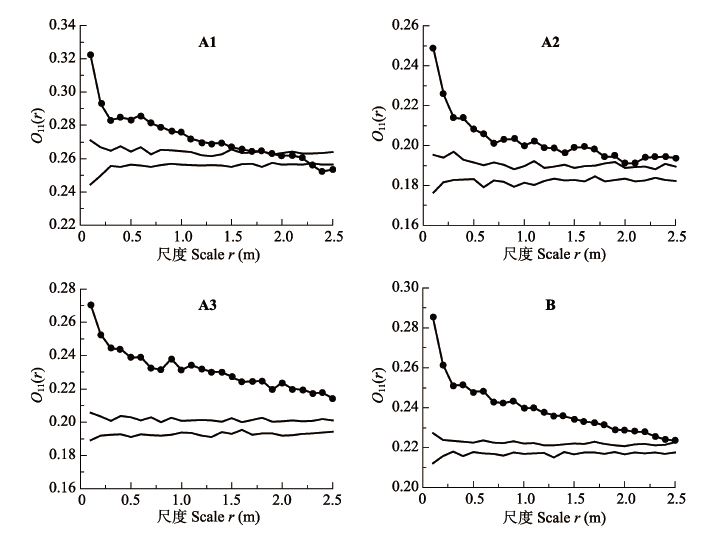
Fig. 2 Point pattern analysis of Leymus chinensis population in communities with eight years of restoration. -●-, observational data; --, the 95% confidence limits resulting from complete spatial random models. A, Point pattern analysis of L. chinensis population in each replicate (A1, A2 and A3 refer to replicates 1, 2 and 3, respectively). B, Point pattern analysis of L. chinensis population integrating data of three replicates.
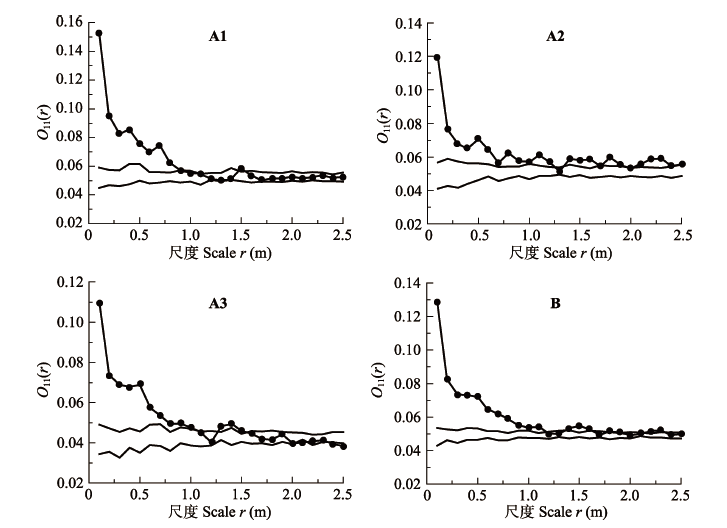
Fig. 3 Point pattern analysis of Stipa grandis population in communities with eight years of restoration. -●-, observational data; --, the 95% confidence limits resulting from complete randomness spatial models. A, Point pattern analysis of S. grandis population in each replicate (A1, A2 and A3 refer to replicates 1, 2 and 3, respectively). B, Point pattern analysis of S. grandis population integrating data of three replicates.
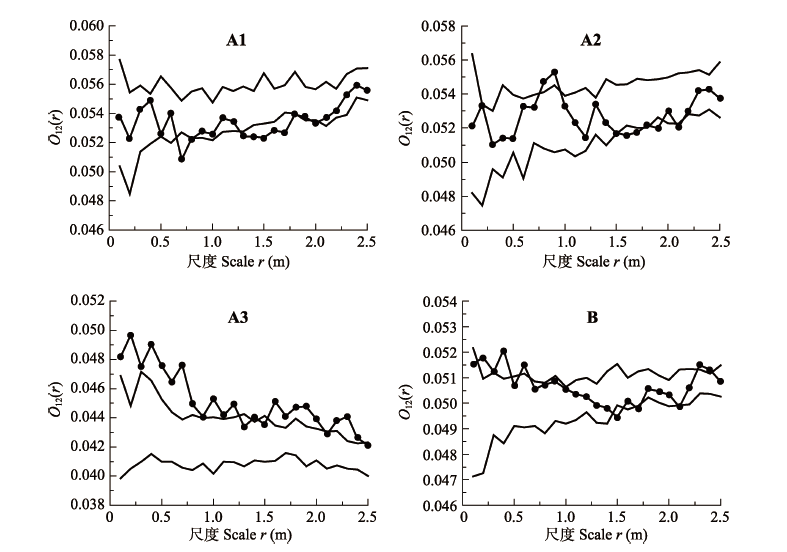
Fig. 4 Spatial association between Leymus chinensis and Stipa grandis populations in communities with eight years of restoration. -●-, observational data; --, the 95% confidence limits resulting from fixed S. grandis population and random L. chinensis population. A, Spatial association between L. chinensis and S. grandis populations in each replicate (A1, A2 and A3 refer to replicates 1, 2 and 3, respectively). B, Spatial association between L. chinensis and S. grandis populations integrating data of three replicates.
| [1] | Condit R, Ashton PS, Baker P, Bunyavejchewin S, Gunatilleke S, Gunatilleke N, Hubbell SP, Foster RB, Itoh A, LaFrankie JV, Lee HS, Losos E, Manokaran N, Sukumar R, Yamakura T (2000). Spatial patterns in the distribution of tropical tree species.Science, 288, 1414-1418. |
| [2] | Dale MRT, MacIsaac DA (1989). New methods for the analysis of spatial pattern in vegetation.Journal of Ecology, 77, 78-91. |
| [3] | Diggle PJ (2003). Statistical Analysis of Point Patterns. 2nd edn. Arnold, London. |
| [4] | Galiano EF (1983). Detection of multi-species patterns in plant populations.Vegetatio, 53, 129-138. |
| [5] | Graff P, Aguiar MR (2011). Testing the biotic stress in the stress gradient hypothesis. Processes and patterns in arid rangelands.Oikos, 120, 1023-1030. |
| [6] | Greig-Smith P (1952). The use of random and contiguous quadrats in the study of structure of plant communities.Annual of Botany, 16, 293-316. |
| [7] | Greig-Smith P (1987). Quantitative Plant Ecology. Butterworths, London. |
| [8] | Jácome-Flores ME, Delibes M, Wiegand T, Fedriani JM (2016). Spatial patterns of an endemic Mediterranean palm recolonizing old fields.Ecology and Evolution, 6, 8556-8568. |
| [9] | Kershaw KA (1963). Pattern in vegetation and its causality.Ecology, 44, 377-388. |
| [10] | Pielou EC (1968). An Introduction to Mathematical Ecology. Wiley, New York. |
| [11] | Velázquez E, Martínez I, Getzin S, Moloney KA, Wiegand T (2016). An evaluation of the state of spatial point pattern analysis in ecology.Ecography, 39, 1-14. |
| [12] | ver Hoef JM, Cressie NAC, Glenn-Lewin DC (1993). Spatial models for spatial statistics: Some unification.Journal of Vegetation Science, 4, 441-452. |
| [13] | Wang X, Wiegand T, Hao Z, Li B, Ye J, Lin F (2010). Species associations in an old-growth temperate forest in north-eastern China.Journal of Ecology, 98, 674-686. |
| [14] | Wang XT, Liang CZ, Wang W (2013). Scale and density: Measuring local neighborhood density at different spatial scales.Chinese Journal of Plant Ecology, 37, 104-110.(in Chinese with English abstract) [王鑫厅, 梁存柱, 王炜 (2013). 尺度与密度: 测定不同尺度下的种群密度. 植物生态学报, 37, 104-110.] |
| [15] | Wang XT, Liang CZ, Wang W (2014). Balance between facilitation and competition determines spatial patterns in a plant population.Chinese Science Bulletin, 59, 1405-1415. |
| [16] | Wang XT, Wang W, Liu JH, Liang CZ, Zhang T (2006). A new method measuring plant population spatial patterns: Photography orientation.Journal of Plant Ecology (Chinese Version), 30, 571-575.(in Chinese with English abstract) [王鑫厅, 王炜, 刘佳慧, 梁存柱, 张韬 (2006). 植物种群空间分布格局测定的新方法: 摄影定位法. 植物生态学报, 30, 571-575.] |
| [17] | Watt AS (1947). Pattern and process in the plant community.Journal of Ecology, 35, 1-22. |
| [18] | Wiegand T, Gunatilleke S, Gunatilleke N (2007). Species associations in a heterogeneous Sri Lankan Dipterocarp forest.The American Naturalist, 170, 77-95. |
| [19] | Wiegand T, Moloney KA (2004). Rings, circles, and null- models for point pattern analysis in ecology.Oikos, 104, 209-229. |
| [20] | Zhang JT (1998). Analysis of spatial pattern for plant species.Acta Phytoecologica Sinica, 22, 344-349.(in Chinese with English abstract) [张金屯 (1998). 植物种群空间分布的点格局分析. 植物生态学报, 22, 344-349.] |
| Viewed | ||||||
|
Full text |
|
|||||
|
Abstract |
|
|||||
Copyright © 2026 Chinese Journal of Plant Ecology
Tel: 010-62836134, 62836138, E-mail: apes@ibcas.ac.cn, cjpe@ibcas.ac.cn
![]()