
Chin J Plant Ecol ›› 2013, Vol. 37 ›› Issue (2): 132-141.DOI: 10.3724/SP.J.1258.2013.00014 cstr: 32100.14.SP.J.1258.2013.00014
• Research Articles • Previous Articles Next Articles
LIU Ning1, SUN Peng-Sen1,*( ), LIU Shi-Rong1, SUN Ge2
Received:2012-08-27
Accepted:2012-12-18
Online:2013-08-27
Published:2013-01-31
Contact:
SUN Peng-Sen
LIU Ning, SUN Peng-Sen, LIU Shi-Rong, SUN Ge. Determination of spatial scale of response unit for the WASSI-C eco-hydrological model—a case study on the upper Zagunao River watershed of China[J]. Chin J Plant Ecol, 2013, 37(2): 132-141.
Add to citation manager EndNote|Ris|BibTeX
URL: https://www.plant-ecology.com/EN/10.3724/SP.J.1258.2013.00014
| 数据集 Dataset | 来源 Source | 用途 Usage | 分辨率 Resolution ratio | 年份 Year | |||
|---|---|---|---|---|---|---|---|
| 气象数据(温度和降水) Climate data (temperature and precipitation) | 国家气象局 State Meteorological Administration, China | 输入数据 Input data | 1 km × 1 km | 2000 | |||
| 植被覆盖数据 Vegetation cover data | 中分辨率成像光谱仪 Moderate Resolution Imaging Spectroradiometer (MODIS) (http://modis.gsfc.nasa.gov) | 输入数据 Input data | 1 km × 1 km | 2000 | |||
| 叶面积指数 Leaf area index (LAI) | 中分辨率成像光谱仪 Moderate Resolution Imaging Spectroradiometer (MODIS) (http://modis.gsfc.nasa.gov) | 输入数据 Input data | 1 km × 1 km | 2000 | |||
| 土壤属性数据 Soil property data | 中国科学院南京土壤研究所 Institute of Soil Science, Chinese Academy of Sciences, Nanjing, China | 输入数据 Input data | 1 km × 1 km | ||||
| 总初级生产力 Gross primary production (GPP) | 中分辨率成像光谱仪 Moderate Resolution Imaging Spectroradiometer (MODIS) (http://modis.gsfc.nasa.gov) | 模型验证 Model validation | 1 km × 1 km | 2000 | |||
| 蒸散 Evapotran- spiration (ET) | MODIS蒸散 MODIS_ET | 中分辨率成像光谱仪 Moderate Resolution Imaging Spectroradiometer (MODIS) (http://modis.gsfc.nasa.gov) | 模型验证 Model validation | 1 km × 1 km | 2000 | ||
| Zhang蒸散Zhang_ET | ET全球数据集 Global ET database (ftp://ftp.ntsg.umt.edu) | 模型验证 Model validation | 8 km × 8 km | 2000 | |||
| 径流 Runoff (RUNOFF) | 四川省水文资源勘测局 Hydrology and Water Resource Investigation Bureau of Sichuan Province, China | 模型验证 Model validation | 2000 | ||||
Table 1 Datasets used in the study
| 数据集 Dataset | 来源 Source | 用途 Usage | 分辨率 Resolution ratio | 年份 Year | |||
|---|---|---|---|---|---|---|---|
| 气象数据(温度和降水) Climate data (temperature and precipitation) | 国家气象局 State Meteorological Administration, China | 输入数据 Input data | 1 km × 1 km | 2000 | |||
| 植被覆盖数据 Vegetation cover data | 中分辨率成像光谱仪 Moderate Resolution Imaging Spectroradiometer (MODIS) (http://modis.gsfc.nasa.gov) | 输入数据 Input data | 1 km × 1 km | 2000 | |||
| 叶面积指数 Leaf area index (LAI) | 中分辨率成像光谱仪 Moderate Resolution Imaging Spectroradiometer (MODIS) (http://modis.gsfc.nasa.gov) | 输入数据 Input data | 1 km × 1 km | 2000 | |||
| 土壤属性数据 Soil property data | 中国科学院南京土壤研究所 Institute of Soil Science, Chinese Academy of Sciences, Nanjing, China | 输入数据 Input data | 1 km × 1 km | ||||
| 总初级生产力 Gross primary production (GPP) | 中分辨率成像光谱仪 Moderate Resolution Imaging Spectroradiometer (MODIS) (http://modis.gsfc.nasa.gov) | 模型验证 Model validation | 1 km × 1 km | 2000 | |||
| 蒸散 Evapotran- spiration (ET) | MODIS蒸散 MODIS_ET | 中分辨率成像光谱仪 Moderate Resolution Imaging Spectroradiometer (MODIS) (http://modis.gsfc.nasa.gov) | 模型验证 Model validation | 1 km × 1 km | 2000 | ||
| Zhang蒸散Zhang_ET | ET全球数据集 Global ET database (ftp://ftp.ntsg.umt.edu) | 模型验证 Model validation | 8 km × 8 km | 2000 | |||
| 径流 Runoff (RUNOFF) | 四川省水文资源勘测局 Hydrology and Water Resource Investigation Bureau of Sichuan Province, China | 模型验证 Model validation | 2000 | ||||
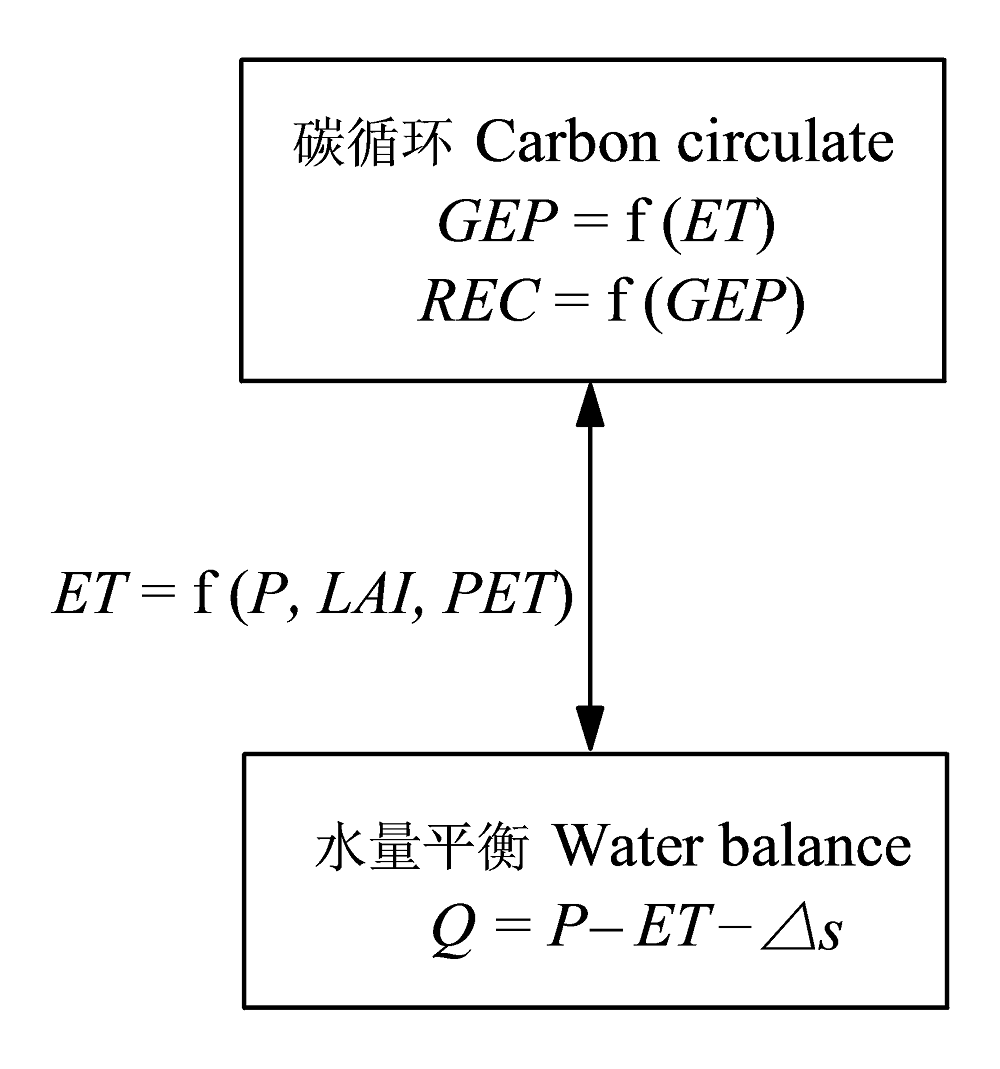
Fig. 1 Framework of WASSI-C model. ET, evapotranspiration; GEP, gross ecosystem productivity; LAI, leaf area index; P, monthly precipitation; PET, potential evapotranspiration; REC, ecosystem respiration consumption; Q, runoff; Δs, variation of soil moisture, the average is zero for many years.
| 植被类型 Vegetation type | GEP = a × ET | REC = m + n × GEP | ||||
|---|---|---|---|---|---|---|
| a ± SD | R2 | m ± SD | n ± SD | R2 | ||
| 农田 Cropland | 3.13 ± 1.69 | 0.78 | 40.6 ± 3.84 | 0.43 ± 0.02 | 0.77 | |
| 郁闭灌丛 Closed shrubland | 1.37 ± 0.62 | 0.77 | 11.4 ± 15.62 | 0.69 ± 0.15 | 0.74 | |
| 落叶阔叶林 Deciduous broad-leaved forest | 3.20 ± 1.26 | 0.93 | 30.8 ± 2.93 | 0.45 ± 0.03 | 0.83 | |
| 常绿阔叶林 Evergreen broad-leaved forest | 2.59 ± 0.54 | 0.92 | 19.6 ± 8.74 | 0.61 ± 0.06 | 0.63 | |
| 常绿针叶林 Evergreen coniferous forest | 2.46 ± 0.96 | 0.89 | 9.9 ± 2.24 | 0.68 ± 0.03 | 0.80 | |
| 草地 Grassland | 2.12 ± 1.66 | 0.84 | 18.9 ± 2.31 | 0.64 ± 0.02 | 0.82 | |
| 混交林 Mixed forest | 2.74 ± 1.05 | 0.89 | 24.4 ± 4.24 | 0.62 ± 0.05 | 0.88 | |
| 稀疏灌丛 Open shrubland | 1.33 ± 0.47 | 0.85 | 9.7 ± 3.03 | 0.56 ± 0.08 | 0.81 | |
| 高山草甸 Alpine meadow | 1.26 ± 0.77 | 0.80 | 25.2 ± 3.23 | 0.53 ± 0.07 | 0.65 | |
| 湿地 Wetland | 1.66 ± 1.33 | 0.78 | 7.8 ± 3.04 | 0.56 ± 0.03 | 0.80 | |
Table 2 Parameters of main vegetation types for carbon flux regression model in WASSI-C model
| 植被类型 Vegetation type | GEP = a × ET | REC = m + n × GEP | ||||
|---|---|---|---|---|---|---|
| a ± SD | R2 | m ± SD | n ± SD | R2 | ||
| 农田 Cropland | 3.13 ± 1.69 | 0.78 | 40.6 ± 3.84 | 0.43 ± 0.02 | 0.77 | |
| 郁闭灌丛 Closed shrubland | 1.37 ± 0.62 | 0.77 | 11.4 ± 15.62 | 0.69 ± 0.15 | 0.74 | |
| 落叶阔叶林 Deciduous broad-leaved forest | 3.20 ± 1.26 | 0.93 | 30.8 ± 2.93 | 0.45 ± 0.03 | 0.83 | |
| 常绿阔叶林 Evergreen broad-leaved forest | 2.59 ± 0.54 | 0.92 | 19.6 ± 8.74 | 0.61 ± 0.06 | 0.63 | |
| 常绿针叶林 Evergreen coniferous forest | 2.46 ± 0.96 | 0.89 | 9.9 ± 2.24 | 0.68 ± 0.03 | 0.80 | |
| 草地 Grassland | 2.12 ± 1.66 | 0.84 | 18.9 ± 2.31 | 0.64 ± 0.02 | 0.82 | |
| 混交林 Mixed forest | 2.74 ± 1.05 | 0.89 | 24.4 ± 4.24 | 0.62 ± 0.05 | 0.88 | |
| 稀疏灌丛 Open shrubland | 1.33 ± 0.47 | 0.85 | 9.7 ± 3.03 | 0.56 ± 0.08 | 0.81 | |
| 高山草甸 Alpine meadow | 1.26 ± 0.77 | 0.80 | 25.2 ± 3.23 | 0.53 ± 0.07 | 0.65 | |
| 湿地 Wetland | 1.66 ± 1.33 | 0.78 | 7.8 ± 3.04 | 0.56 ± 0.03 | 0.80 | |
| 面积阈值 Area threshold (km2) | 10 | 12.5 | 15 | 25 | 35 | 40 | 50 | 85 | 100 | 160 | 200 | 300 | 650 |
|---|---|---|---|---|---|---|---|---|---|---|---|---|---|
| 水文响应单元数 Number of hydrologic response units (HRUs) | 105 | 78 | 64 | 45 | 35 | 27 | 24 | 21 | 15 | 11 | 7 | 3 | 1 |
| 水文响应单元的平均面积 Mean area of all HRUs (km2) | 22.9 | 30.8 | 37.5 | 53.4 | 68.6 | 88.9 | 104.5 | 126.4 | 160.2 | 218.4 | 343.2 | 800.9 | 2 403 |
Table 3 Number of hydrologic response units (HRUs) and associated mean area of all HRUs corresponding to different area threshold
| 面积阈值 Area threshold (km2) | 10 | 12.5 | 15 | 25 | 35 | 40 | 50 | 85 | 100 | 160 | 200 | 300 | 650 |
|---|---|---|---|---|---|---|---|---|---|---|---|---|---|
| 水文响应单元数 Number of hydrologic response units (HRUs) | 105 | 78 | 64 | 45 | 35 | 27 | 24 | 21 | 15 | 11 | 7 | 3 | 1 |
| 水文响应单元的平均面积 Mean area of all HRUs (km2) | 22.9 | 30.8 | 37.5 | 53.4 | 68.6 | 88.9 | 104.5 | 126.4 | 160.2 | 218.4 | 343.2 | 800.9 | 2 403 |
| 敏感性排序 Sensibility rank | 参数 Parameter | 理论区间 Theory interval | 单位 Unit | 最优值 Optimal value |
|---|---|---|---|---|
| 1 | REXP | 1-5 | - | 2.4 |
| 2 | UZFWM | 5-150 | mm | 22 |
| 3 | LZFSM | 5-400 | mm | 36 |
| 4 | LZSK | 0.01-0.35 | - | 0.060 |
| 5 | LZPK | 0.001-0.05 | - | 0.016 |
| 6 | LZTWM | 10-500 | mm | 162 |
| 7 | UZK | 0.10-0.75 | - | 0.15 |
| 8 | ZPERC | 5-350 | - | 80 |
| 9 | UZTWM | 10-300 | mm | 30 |
| 10 | LZFPM | 10-1000 | mm | 65 |
| 11 | PFREE | 0.0-0.8 | - | 0.20 |
Table 4 Sensitivity of main parameters in the WASSI-C model and their optimal value
| 敏感性排序 Sensibility rank | 参数 Parameter | 理论区间 Theory interval | 单位 Unit | 最优值 Optimal value |
|---|---|---|---|---|
| 1 | REXP | 1-5 | - | 2.4 |
| 2 | UZFWM | 5-150 | mm | 22 |
| 3 | LZFSM | 5-400 | mm | 36 |
| 4 | LZSK | 0.01-0.35 | - | 0.060 |
| 5 | LZPK | 0.001-0.05 | - | 0.016 |
| 6 | LZTWM | 10-500 | mm | 162 |
| 7 | UZK | 0.10-0.75 | - | 0.15 |
| 8 | ZPERC | 5-350 | - | 80 |
| 9 | UZTWM | 10-300 | mm | 30 |
| 10 | LZFPM | 10-1000 | mm | 65 |
| 11 | PFREE | 0.0-0.8 | - | 0.20 |
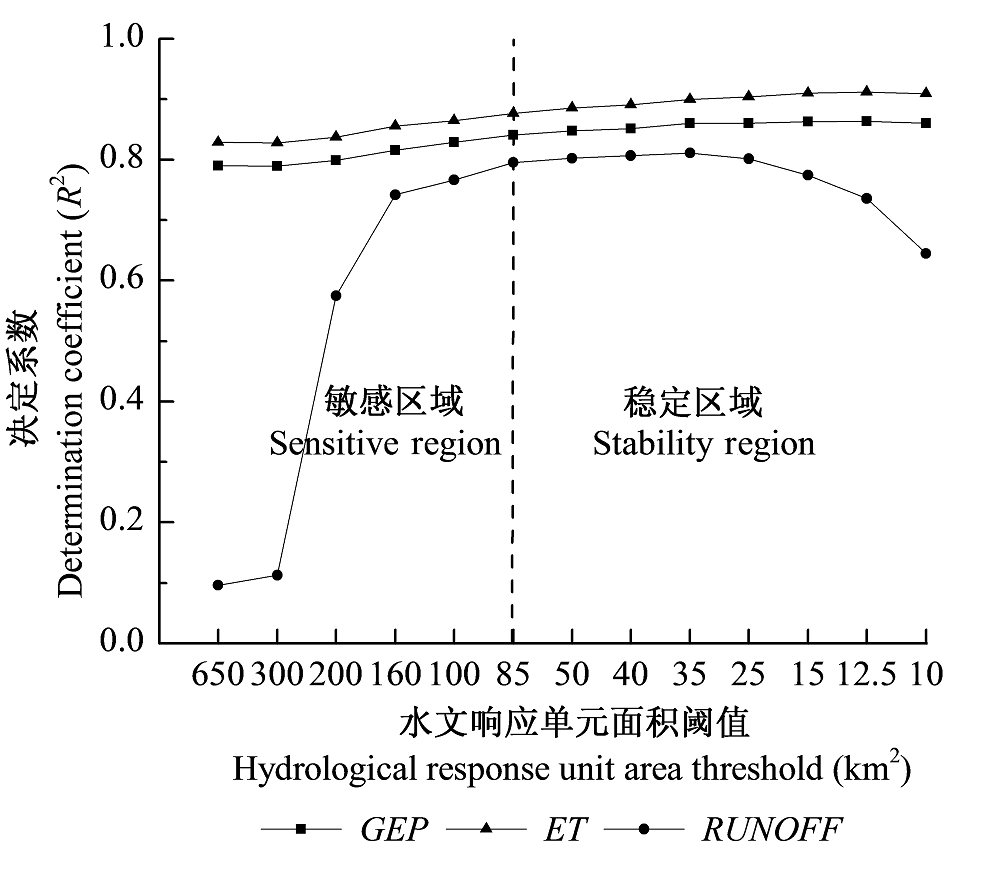
Fig. 2 Determination coefficients of gross ecosystem productivities (GEP), evapotranspiration (ET) and total runoff of the watershed (RUNOFF) between simulated results and verification data under different watershed classification schemes.
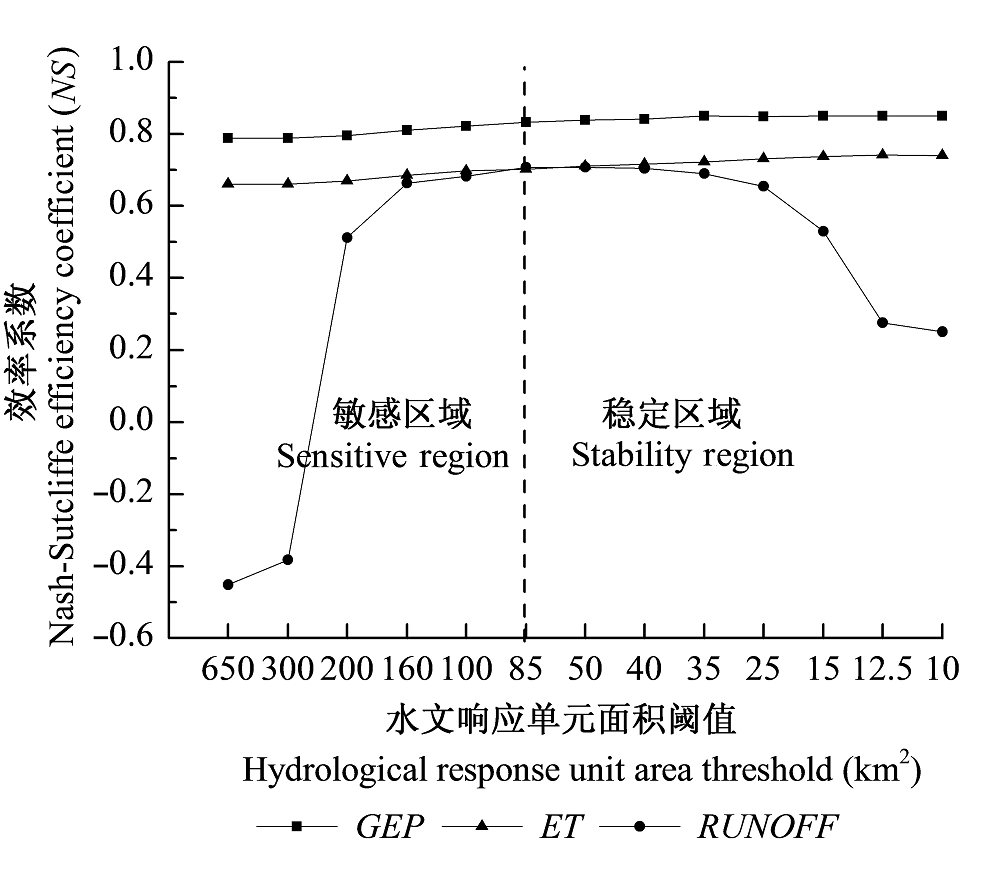
Fig.3 The Nash-Sutcliffe efficiency coefficients (NS) of gross ecosystem productivity (GEP), evapotranspiration (ET) and total runoff of the watershed (RUNOFF) between simulated results and verification data under different watershed classification schemes.
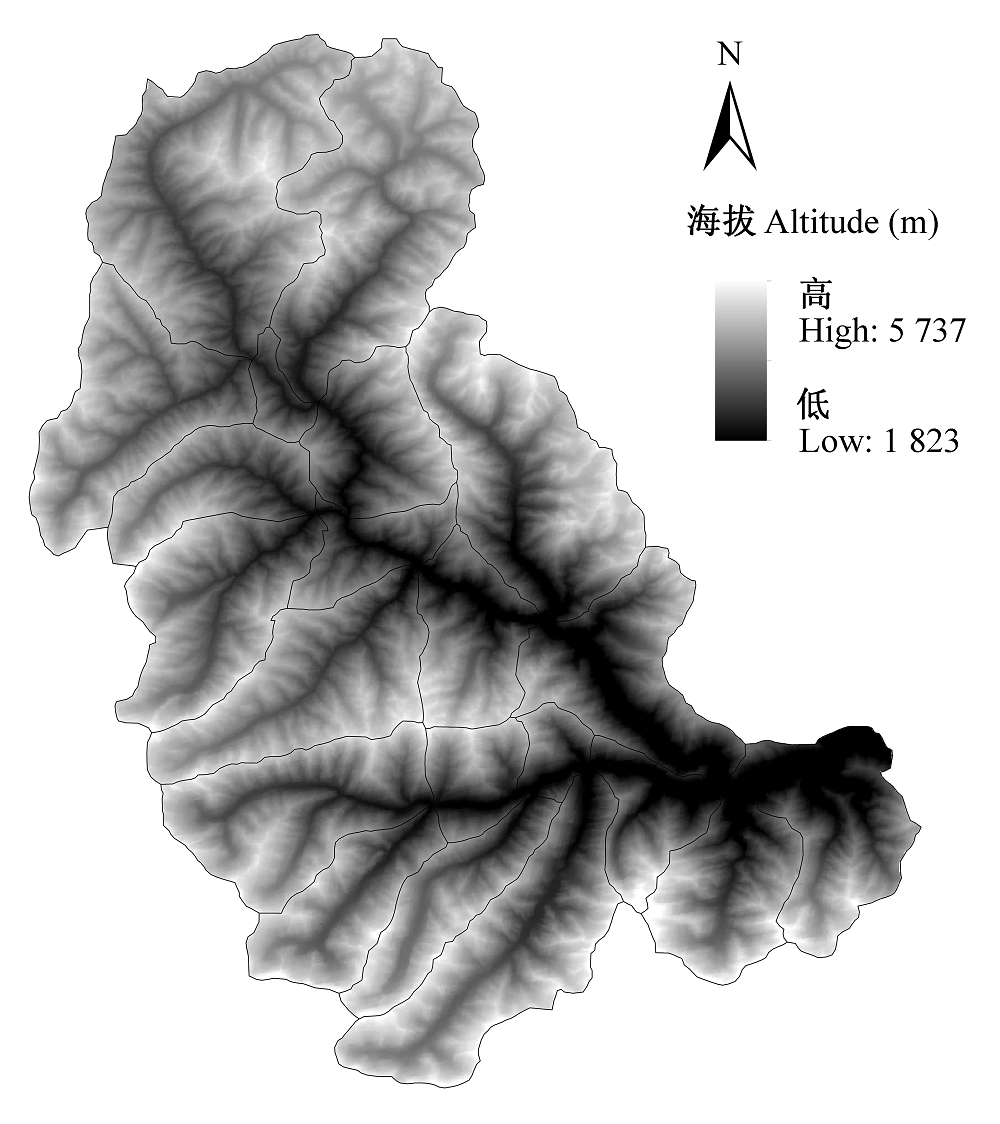
Fig. 4 Distribution of hydrologic response units (HRUs) in the upper Zagunao River watershed.
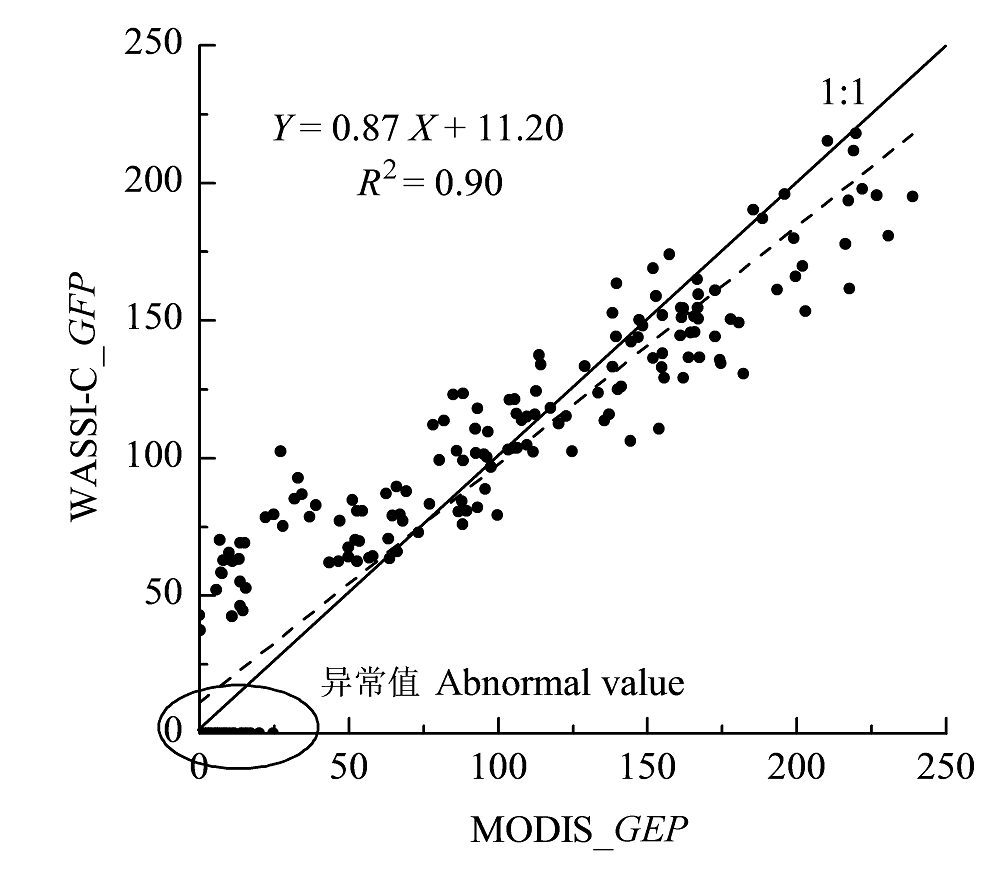
Fig. 5 A comparison between mean monthly gross ecosystem productivity (GEP) (g C·m-2·month-1) simulated by WASSI-C and MODIS for each hydrology response unit.
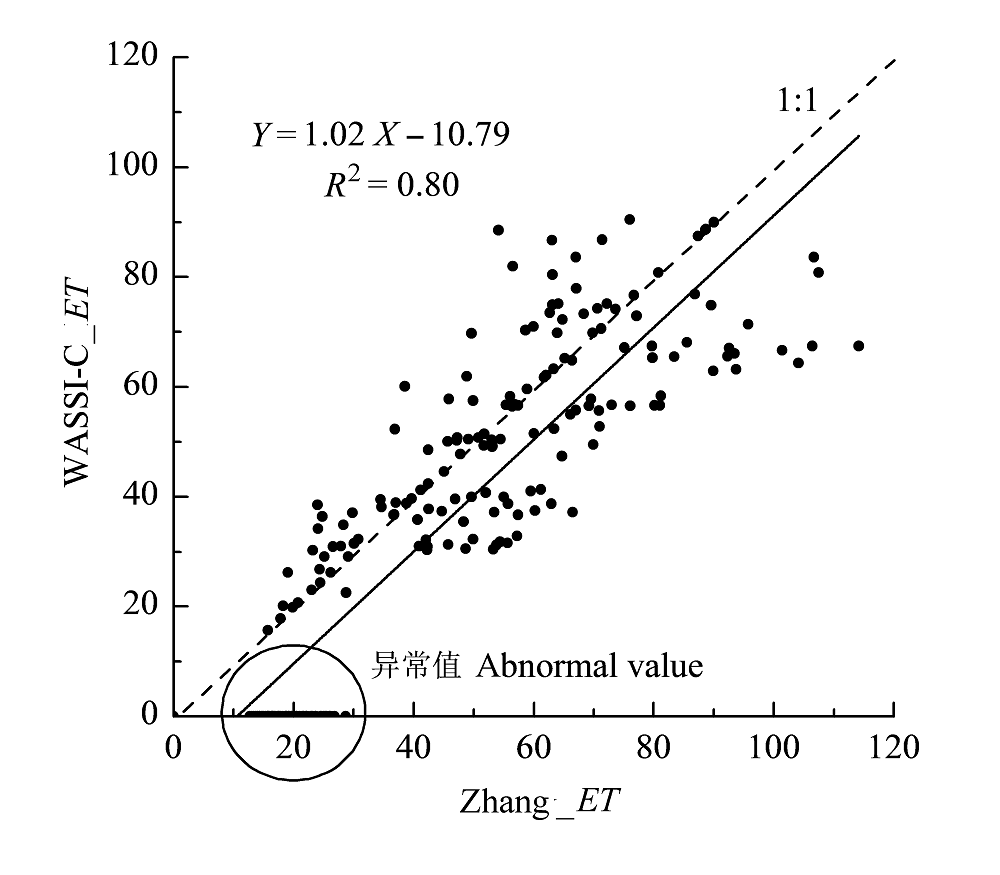
Fig. 6 A comparison between mean monthly evapotranspiration (ET, mm·month-1) simulated by WASSI-C and Zhang for each hydrology response unit.
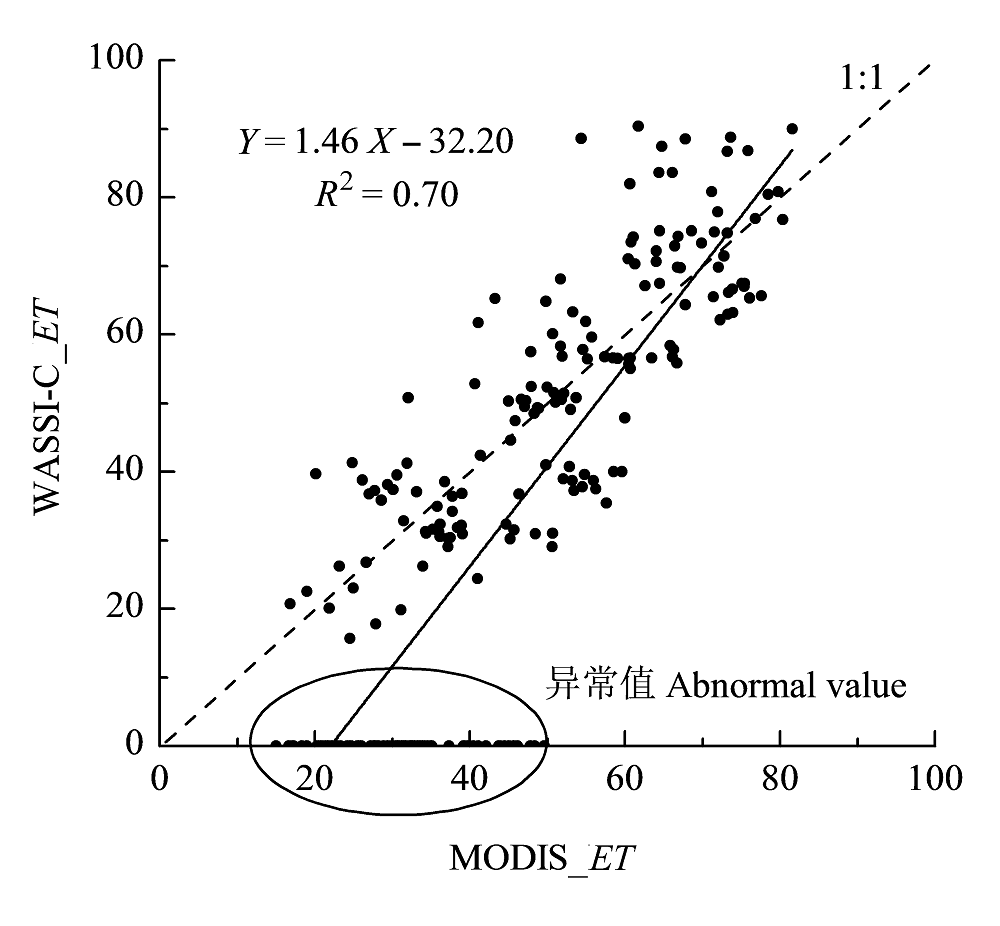
Fig. 7 A comparison between mean monthly evapotranspiration (ET, mm·month-1) simulated by WASSI-C and MODIS for each hydrology response unit.
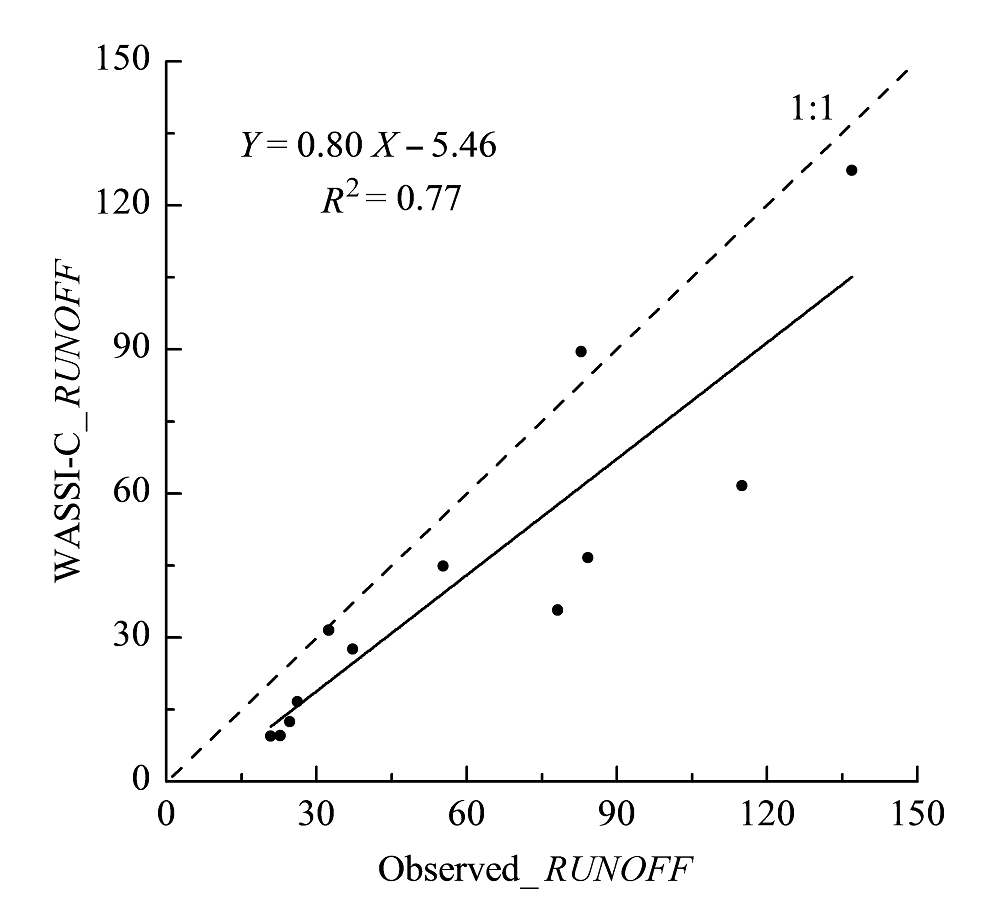
Fig. 8 A comparison between total monthly runoff (RUNOFF, mm·month-1) simulated by WASSI-C and observed.
| [1] | Cao MK, Woodward FI (1998). Net primary and ecosystem production and carbon stocks of terrestrial ecosystems and their responses to climate change. Global Change Biology, 4, 185-198. |
| [2] | Foley JA, Prentice IC, Ramankutty N, Levis S, Pollard D, Sitch S, Haxeltine A (1996). An integrated biosphere model of land surface processes, terrestrial carbon balance, and vegetation dynamics. Global Biogeochemical Cycles, 10, 603-628. |
| [3] | Hao FH, Zhang XS, Cheng HG (2004). Discussion on reasonable subdivision level of watershed for distributed hydrologic model. Journal of Soil and Water Conversation, 17, 75-78. (in Chinese with English abstract) |
| [ 郝芳华, 张雪松, 程红光 (2004). 分布式水文模型亚流域合理划分水平刍议. 水土保持学报, 17, 75-78.] | |
| [4] | Hamon WR (1963). Computation of direct runoff amounts from storm rainfall. International Association of Hydrological Sciences Publication, 63, 52-62. |
| [5] | Jiang XY (1963). The primary study on habitat type of alpine forest in Miyaluo and Markang, West Sichuan. Scientia Silvae Sinicae, 8, 321-335. |
| [6] | Liu J, Chen JM, Cihlar J, Park WM (1997). A process-based boreal ecosystem productivity simulator using remote sensing inputs. Remote Sensing of Environment, 62, 158-175. |
| [7] | Liu N, Sun PS, Liu SR (2012). Research advances in simulating land water-carbon coupling. Chinese Journal of Applied Ecology, 23, 3187-3196. (in Chinese with English abstract) |
| [ 刘宁, 孙鹏森, 刘世荣 (2012). 陆地水碳耦合模拟研究进展. 应用生态学报, 23, 3187-3196.] | |
| [8] | McCuen RH, Knight Z, Cutter AG (2006). Evaluation of the Nash-Sutcliffe efficiency index. Journal of Hydrologic Engineering, 11, 597-602. |
| [9] | Penman HL (1948). Natural evaporation from open water, bare soil and grass. Proceedings of the Royal Society A: Mathematical, Physical and Engineering Sciences, 193, 120-145. |
| [10] | Shi XZ, Yu DS, Xu SX, Warner ED, Wang HJ, Sun WX, Zhao YC, Gong ZT (2010). Cross-reference for relating genetic soil classification of China with WRB at different scales. Geothermal, 155, 344-350. |
| [11] | Sun G, Alstad K, Chen JQ, Chen SP, Ford CR, Lin GH, Liu CF, Lu N, McNulty SG, Miao HX, Noormets A, Vose JM, Wilske B, Zeppel M, Zhang Y, Zhang ZQ (2011a). A general predictive model for estimating monthly ecosystem evapotranspiration. Ecohydrology, 4, 245-255. |
| [12] | Sun G, Caldwell P, Noormets A, McNulty SG, Cohen E, Myers JM, Domec JC, Treasure E, Mu QZ, Xiao JF, John R, Chen JQ (2011b). Upscaling key ecosystem functions across the conterminous United States by a water-centric ecosystem model. Journal of Geophysical Research, 116, G00J05. |
| [13] | Tague CL, Band LE (2004). RHESSys: regional hydroecologic simulation system―an object-oriented approach to spatially distributed modeling of carbon, water, and nutrient cycling. Earth Interactions, 8, 1-42. |
| [14] | Tian HQ, Liu ML, Zhang C, Ren W, Xu XF, Chen GS, Lü CQ, Tao B (2010). The dynamic land ecosystem model (DLEM) for simulating terrestrial processes and interactions in the context of multifactor global change. Acta Geographica Sinica, 65, 1027-1047. (in Chinese with English abstract) |
| [ 田汉勤, 刘明亮, 张弛, 任巍, 徐小锋, 陈广生, 吕超群, 陶波 (2010). 全球变化与陆地系统综合集成模拟——新一代陆地生态系统动态模型(DLEM). 地理学报, 65, 1027-1047.] | |
| [15] | Wang GX, Qian J, Cheng GD (2001). Current situation and prospect of the ecological hydrology. Advance in Earth Sciences, 16, 314-323. (in Chinese with English abstract) |
| [ 王根绪, 钱鞠, 程国栋 (2001). 生态水文科学研究的现状与展望. 地球科学进展, 16, 314-323.] | |
| [16] | Wang LH, Yan DH, Long AH, Yang SY (2009). Advances in basin ecohydrological process modelling. Advance in Earth Sciences, 24, 891-898. (in Chinese with English abstract) |
| [ 王凌河, 严登华, 龙爱华, 杨舒媛 (2009). 流域生态水文过程模拟研究进展. 地球科学进展, 24, 891-898.] | |
| [17] | Wang SP, Zhang ZQ, Sun G, McNulty S, Zhang ML, Li JL (2008). Effect of grid size and time step of MIKESHE on hydrological processes modeling at watershed scale. Hydrology, 28, 1-7. (in Chinese with English abstract) |
| [ 王盛萍, 张志强, 孙阁, McNulty S, 张满良, 李建牢 (2008). 基于物理过程分布式流域水文模型尺度依赖性. 水文, 28, 1-7.] | |
| [18] | Wolock DM (1995). Effects of subbasin size on topographic characteristics and simulated flow paths in Sleepers River watershed, Vermont. Water Resource Research, 31, 1989-1997. |
| [19] | Wood EF, Sivapalan M, Beven K, Band L (1998). Effects of spatial variability and scale with implications to hydrologic modeling. Journal of Hydrology, 102, 29-47. |
| [20] | Yu Z, Sun PS, Liu SR (2011). Phenological change of main vegetation types along a North-South Transect of Eastern China. Chinese Journal of Plant Ecology, 35, 316-329. (in Chinese with English abstract) |
| [ 余振, 孙鹏森, 刘世荣 (2011). 中国东部南北样带主要植被类型物候期的变化. 植物生态学报, 35, 316-329.] | |
| [21] | Zhang K, Kimball JS, Nemani RR, Running SW (2010). A continuous satellite-derived global record of land surface evapotranspiration from 1983 to 2006. Water Resource Research, 46, W9522. |
| [22] | Zhang XS, Hao FH, Cheng HG, Yang ZF (2004). Influence of subdivision of watershed on distributed hydrological model. Shuili Xuebao, 35, 119-123. (in Chinese with English abstract) |
| [ 张雪松, 郝芳华, 程红光, 杨志峰 (2004). 亚流域划分对分布式水文模型模拟结果的影响. 水利学报, 35, 119-123.] |
| Viewed | ||||||
|
Full text |
|
|||||
|
Abstract |
|
|||||
Copyright © 2026 Chinese Journal of Plant Ecology
Tel: 010-62836134, 62836138, E-mail: apes@ibcas.ac.cn, cjpe@ibcas.ac.cn
![]()