


地球上不同区域物种多样性存在着差异, 即生物多样性的空间格局。这一格局的成因一直是生态学和生物地理学的核心问题(Gaston, 2000; Wang et al., 2012a)。研究物种多样性的空间格局及其成因不仅可以加深对不同区域的地质历史、环境变迁、生物演化和迁移等重要生物地理学过程的认识(Ricklefs, 2004), 也有助于提升人们对物种多样性和资源的保护能力。从20世纪末以来, 科学家对这类问题进行了大量探讨(Wang et al., 2012a), 目前关于物种多样性空间格局的成因已有百余种理论假说(Palmer & White, 1994; 王志恒等, 2009), 但不同假说的相对作用仍存在广泛争议。
物种多样性空间格局被认为是现代环境和进化历史共同作用的结果(Brown, 2014)。现代环境因素主要包括现代气候和生境异质性。现代气候(如水热条件、气候季节性等)可以影响一个地区的物种承载力(即水热条件较好、气候季节性较低的地区可以承载更多的物种), 从而影响物种多样性的格局(Currie, 1991; O’Brien, 1993; McGlone, 1996)。如能量和水分条件较差的地区植物的光合作用(Schneider & Childers, 1941)、水分运输(Cavender-Bares et al., 2005)和生殖(Morales et al., 2013)等过程都可能受到不同程度的限制, 故植物在这些地区的分布也会受到限制, 表现为物种多样性较低(Whittaker et al., 2007; Xu et al., 2013)。生境异质性可提供多样化的生存环境, 为物种的共存提供更多的生态位, 并且生境异质性较高的山地地区可以作为极端气候下的避难所, 从而容纳更多物种(Stein et al., 2014; Shrestha et al., 2018)。物种多样性格局还受进化历史的影响。进化历史因素主要在物种形成和物种扩散两方面起作用。造山运动等地质活动可以加快进化过程, 从而促使新物种快速分化, 增加地区的物种多样性(Fjeldså et al., 2012; Hughes & Atchison, 2015)。同时物种扩散受到生态位保守性的制约。生态位保守性假说认为物种多样性格局受到其祖先生态位的影响, 由于进化限制物种更倾向于保有其祖先所在的气候生态位, 更难适应其他气候条件, 故气候条件和某类群祖先生态位差距越大的地区, 该类群的物种多样性越少(Wiens & Donoghue, 2004; Wang et al., 2011; Xu et al., 2013)。此外, 历史气候变化也被认为是影响物种扩散和多样性格局的重要因素。如末次冰期气候较温和的地区会有更多的物种生存下来而非迁移或绝灭, 从而现代气候与冰期差异较小的地区物种多样性较高(Svenning & Skov, 2007a; Liu et al., 2017)。影响不同类群物种多样性格局因素的相对重要性尚没有一致性的结论(Shrestha et al., 2018), 同一类群在不同地区的多样性格局也可能受不同因素控制。故对于特定类群、特定地区而言其物种多样性格局的形成机制仍值得研究。
资源物种是对人类生产生活具有直接或潜在经济价值的物种, 包括野生可收获植物(wild harvested plants)和作物的野生近缘种(crop wild relatives), 前者可以直接为人类提供食物和原材料并衍生相关产业, 后者则作为现代作物的种质资源在作物育种中起到巨大的作用(Brehm et al., 2010; Sher et al., 2012)。资源物种包括食用、药用、园林绿化观赏、油料、糖料、蜜源、木材、牧草、纤维等类别, 以及对应的种质资源(近缘种)等(俞德浚等, 1989)。资源物种由于对人类的经济社会发展意义重大, 应该受到优先保护, 但传统保护生物学关于物种保护优先级的评估更关注物种的受威胁性而对物种的经济价值较为忽视(Brehm et al., 2010)。所以资源物种的多样性格局及热点地区更应该受到关注, 以凸显其在植物保护方面的意义。
蔷薇科是北半球温带地区具有代表性的一个科, 全球有3亚科, 88-100属, 约3 000种(Xiang et al., 2017), 中国有51属1 000余种(Wu & Raven, 1994-2009)。蔷薇科包含桃亚科(Amygdaloideae)、蔷薇亚科(Rosoideae)和仙女木亚科(Dryadoideae)三个亚科, 其中桃亚科和蔷薇亚科包含许多常见的水果(如苹果Malus domestica、桃Amygdalus persica、草莓Fragaria × ananassa)、花卉(如月季花Rosa chinensis)和药材种类, 对人类的生产生活具有重大经济价值(Zhang et al., 2017)。目前对蔷薇科的研究主要集中于基因与进化(Amsellem et al., 2000; Fan et al., 2013; Ru et al., 2015)、生理学(Wells et al., 2002; Wheeler et al., 2005; Lin-Wang et al., 2010)、系统学(Lee & Wen, 2001; Potter et al., 2007; Shi et al., 2013)等方面研究。然而, 关于蔷薇科物种多样性格局及其保护的相关研究只有少量的报道(如伊朗的蔷薇科(Peyravi, 2015)和秘鲁安第斯山区Polylepis属(Mendosa & Cano, 2011))。尤其是蔷薇科植物极为丰富的中国尚没有蔷薇科及其资源植物的多样性格局保护研究报道, 主要原因是缺少较精细分辨率的国家尺度上的分布数据。
针对上述问题, 本研究利用较为精细的物种分布数据(50 km × 50 km), 分析中国蔷薇科及其资源植物的物种多样性格局, 评估其保护状况。具体而言, 本研究着重探索了以下问题: 1)中国蔷薇科整体及各类资源植物物种多样性格局如何? 其热点地区分布在什么区域? 中国蔷薇科物种多样性与气候、地形和过去气候变化等环境因子具有怎样的关系? 2)中国蔷薇科植物, 特别是其中的资源植物受保护的状况如何?
1 材料和方法
1.1 数据与材料
1.1.1 物种名录
本研究所使用的蔷薇科物种名录主要来自《Flora of China》修订版(Wu & Raven, 1994-2009), 并依据其异名和接受名体系确定了本文中国蔷薇科物种接受名名录。在此基础上, 我们去除了外来种和原产地无法确定的栽培种, 并将种下单位合并至种水平。最终结果显示, 中国境内共有蔷薇科物种914个。
蔷薇科物种的经济用途很广。本研究按照经济用途, 将蔷薇科物种归为食用(包括提供淀粉和寡糖)、园林绿化、药用和水果种质资源4类资源植物。其中, 食用植物类参考了《中国植物志》第36-38卷(俞德浚等, 1989)、《中国食用本草——植物卷》(郑汉臣等, 2003)、《中国经济植物志》(中华人民共和国商业部土产废品局和中国科学院植物研究所, 2012)等资料。园林绿化植物类参考了《中国植物志》第36-38卷(俞德浚等, 1989)、《园林景观植物树木图典》(汪荣先, 2010)、《园林植物1000种》(刘与明和黄全能, 2012)、《园林景观植物图鉴》(周洪义, 2009)、《中国作物及其野生近缘植物——花卉卷》(董玉琛和刘旭, 2007)以及《经济植物手册》(胡先骕, 1955)等资料。药用植物类参考了《中国药用植物志》(艾铁民, 2016)、《中国药用植物图鉴》(第二军医大学药学系生药学教研室, 1960)、《中国药用植物(一)》(叶华谷等, 2014)、《中国植物志》第36-38卷(俞德浚等, 1989)和《中国经济植物志》(中华人民共和国商业部土产废品局和中国科学院植物研究所, 2012)等资料。水果种质资源类根据《中国植物志》第36-38卷(俞德浚等, 1989)等共计76部(篇)文献, 由于参考资料较多, 故列于附录I。
根据近期发表的《中国高等植物受威胁物种名录》(覃海宁等, 2017), 我们标记了中国蔷薇科物种的濒危等级。这一名录反映了目前对中国高等植物受威胁情况最全面的评估。根据IUCN濒危物种红色名录标准, 濒危等级分为极危(CR)、濒危(EN)和易危(VU)。对同一个物种的不同种下单位有不同濒危等级的, 则按照VU-EN-CR的顺序全部标记(如EN-CR, VU-EN等)。结果显示, 中国蔷薇科共有58个受威胁物种。
中国蔷薇科全部物种名录、每个物种所属资源类型及受威胁状况等信息见附录II。
1.1.2 物种分布数据
本研究所使用的物种分布数据来自《中国木本植物分布图集》(Fang et al., 2011; Wang et al., 2011)、中国国家标本资源平台(http://www.nsii.org.cn/)、“中国种子植物”数据库以及部分省级植物志, 并用《Flora of China》修订版(Wu & Raven, 1994-2009)进行了校对。物种分布数据的空间分辨率为县级。为增加物种分布数据的准确性, 我们在收集物种分布数据时, 将中国西部地区(特别是新疆南部、西藏北部)部分面积较大的县划分为多个部分, 并根据物种的分布生境、海拔等信息确定物种在这些县内的分布区域。全部空间分布单元的面积中位数为1 960.54 km2。为了消除面积对物种多样性估算的影响, 本研究用Arcgis 9.3 (ESRI, Redlands, CA)将县级分布数据转化为阿尔伯斯投影(正轴等积割圆锥投影)下分辨率为50 km的网格形式, 同时去掉了位于边界地区(包括陆上国界与海岸线)且边界内部面积小于网格大小一半(1 250 km2)的网格。另外, 由于数据限制, 本研究未包含台湾和海南岛以外的其他岛屿。最终, 研究区共有3 794个网格用于后续物种多样性格局估算及统计分析。附录II显示了每个物种分布区所涵盖的网格数。
1.1.3 环境数据
本研究所使用的气候数据包括现代气候数据、末次冰期气候数据以及生境异质性数据, 其中, 现代气候因子分为气温、降水和气候季节性。温度因子包括年平均气温(MAT)、最冷季平均气温(MTCQ)、最暖季平均气温(MTWQ)。降水因子包括年降水量(AP)、湿润指数(MI)和年实际蒸散量(AET)。气候季节性因子包括温度季节性(TSN)和降水季节性(PSN)。其中, MAT、MTCQ、MTWQ、AP、TSN和PSN数据来自Worldclim网站(Hijmans et al., 2005), 原始分辨率为1°, 在Arcgis 10.0 (ESRI, Redlands, CA)中重采样到50 km。TSN定义为月平均气温的标准差, 而PSN则定义为月降水量的变异系数(Hijmans et al., 2005)。AET和MI按照Thornthwaite和Hare (1955)的方法计算得到, 分别反映了在降水限制下地区实际可以蒸散的水分以及在考虑了潜在蒸散后的水分供应状况(Mccabe et al., 1990)。
生境异质性因子包括海拔高差(ELER)、年平均气温空间差异(MATR)和年降水量空间差异(APR)。ELER由每个网格中最高和最低海拔的差值计算而来, 用以表现地形的复杂性(Kerr & Packer, 1997)。海拔数据来自数字地形模型GTOPO30 (http://eros.usgs.gov/#/Find_Data/Products_and_Data_ Available/gtopo30_info), 原始分辨率为3, 重采样到100 m。类似地, MATR和APR由每个网格中最高的年平均气温(年降水量)与最低的年平均气温(年降水量)的差值计算而来。由于生境异质性因子均呈显著右偏分布, 参考以往研究(如Wang et al., 2011), 在后续统计分析中, 这些变量均取自然对数。
末次盛冰期(LGM)以来的气候变化包括LGM以来的年平均气温变化(anomaly_MAT)、LGM以来的年降水量变化(anomaly_AP)、LGM以来年平均气温变化的空间迁移速率(velocity_MAT)以及LGM以来年降水量变化的空间迁移速率(velocity_AP)。anomaly_MAT和anomaly_AP为LGM时期MAT (AP)和现代MAT (AP)的差值[即(MATpresent - MATLGM)和(APpresent - APLGM)](Sandel et al., 2011), 反映了LGM时期以来各地气候变化的幅度。velocity_MAT和velocity_AP则表示为了追踪MAT或AP的变化, 生物从LGM时期到现代平均每年需要迁移的距离。这些指标和该地区LGM时期以来的气候变化速率有关, 同时和该地区地形复杂度、植被类型等因素有关(Loarie et al., 2009)。Velocity的计算方法参见Loarie等(2009)。LGM时期的气候数据来自Worldclim网站, 由大气环流模型(GCM)计算而来, 利用统计方法降尺度到分辨率2.5° (Hijmans et al., 2005)。在计算LGM时期气候数据的过程中, 有3种常用的GCM模型——MIROC-ESM (Watanabe et al., 2011), CCSM v3 (Collins & Halliday, 2005)和CCSM v4 (Gent & Danabasoglu, 2011)。Kimura等(2014)的研究表明, MIROC-ESM模型重建的气候数据对过去植被分布的复原准确度高于CCSM模型, 且方差小于CCSM模型。故本研究采用MIROC-ESM模型的重建结果(Wang et al., 2017)。各环境变量之间的Pearson相关系数显示在附录III中。
1.1.4 保护区分布数据
中国自然保护区分布数据来自Zhang等(2015)。该数据库收集了截至2012年底中国建立的334个国家级自然保护区和857个省级自然保护区的数字边界, 并记录了保护区的位置、面积、保护标的等基本信息。本数据库不包含台湾岛的数据。
1.2 研究方法
1.2.1 物种多样性格局与环境因子的关系
首先, 我们利用50 km × 50 km的物种分布数据, 估算了每个网格中的物种多样性, 并用Arcgis 10.5绘制了蔷薇科全部物种的物种多样性格局。其次, 根据物种名录, 我们分别估算了四类资源植物(即食用植物、园林绿化植物、药用植物和水果种质资源)的物种多样性格局。第三, 我们估算了每个网格内每类资源植物占全部物种的比例, 并绘制了其地理格局。第四, 我们定义每类资源植物物种多样性最高的5%的网格(物种数为0的网格不计)为其多样性热点地区(Orme et al., 2005; Shrestha et al., 2018)。然后将四类资源植物的热点地区进行叠加, 筛选出每类资源植物独有的热点地区以及两类、三类和四类资源植物共有的热点地区, 分别定义为“单一热点”、“二类热点”、“三类热点”和“四类热点”, 并分析了这些热点地区的保护价值。
基于物种多样性格局和各类环境因子, 本研究通过具有泊松残差的广义线性回归模型分析了蔷薇科全部物种和各类资源植物物种多样性与环境因子之间的关系, 并提取了模型的回归系数(即环境因
子每变动一个单位, 物种多样性变化的大小)和Pseudo-R2, 以评估二者相关性强弱(Shrestha et al., 2018)。为进一步分析物种分布与环境因子的关系, 我们以物种分布矩阵为因变量, 和环境因子矩阵为约束变量进行冗余分析(RDA), 提取了物种得分与环境因子得分的前两个RDA轴, 在二维图上显示, 以探究物种分布与环境因子的关系。
1.2.2 蔷薇科物种的保护现状与保护弱点分析
首先, 我们将中国的国家级和省级自然保护区显示在地图上, 并和一至四类热点地区地图进行叠加并制图, 以直观地显示这些热点地区受保护的状况。对于每一个网格, 我们计算了自然保护区在其中的面积和个数, 并以如下4个指标评估了其受保护的状况。1)有无保护区覆盖。当网格内保护区面积不小于5 km2 (这一数值为最小保护区的面积)时, 认为该网格被保护区覆盖。实际共录得1 849个被保护区覆盖的网格。2)网格内的保护区个数。只有在一个网格被保护区覆盖时, 才将其计入保护区个数。3)保护区覆盖面积占网格面积的比例。4)保护区覆盖面积是否小于网格面积的10%。这些指标可以从不同方面反映每一个网格受保护的状况。对于热点地区, 我们重点提取了蔷薇科全部物种的热点地区、各类资源植物的热点地区以及一至四类热点地区, 并计算了热点地区网格内上述4个评价 指标的均值, 用以反映不同类别热点地区受保护的状况。
其次, 我们从物种的总分布范围和其在被保护区覆盖的网格中的分布范围的差异考量其受保护的程度。首先, 我们将物种分布区按照面积大小升序排列, 取前25%作为狭域种(Jetz & Rahbek, 2002; Shrestha et al., 2018), 共获得狭域种225个。其次, 将物种分布区按照其中被保护区覆盖的网格数升序排列, 取前25%作为受保护较差的物种, 共获得226种。第三, 将狭域种和受保护较差的物种取交集, 作为保护薄弱物种, 共计209种。我们认为这些物种是蔷薇科植物的保护薄弱物种。接下来, 我们估算了保护薄弱物种的多样性格局, 并在Arcgis 10.5中制图, 以确定蔷薇科物种的保护薄弱区(亦即保护优先区)。同时, 我们统计了保护薄弱物种的资源类型, 以探究哪种资源类型的蔷薇科植物更缺乏保护。
最后, 本研究比较了蔷薇科不同属内资源植物的数量及受保护状况的差异。根据物种名录, 我们筛选出物种数量超过15的属, 分析了其各类资源植物的种数。在此基础上, 我们计算了各属保护薄弱物种的种数及其占该属全部物种的比例, 以评估资源植物被保护状况是否存在属间差异。
全部的计算与分析工作在R v3.3 (https://cran. r-project.org/)中完成。
2 结果
表1 蔷薇科内超过15个物种的属及其资源和保护薄弱物种状况
Table 1
| 属名 Genus name | 物种总数 Number of species | 保护薄弱物 种数(比例) Number (proportion) of poorly protected species | 食用植物 Edible plants | 园林植物 Ornamental plants | 药用植物 Medicinal plants | 水果种质资源 Fruit germplasm resource | 资源物种总数 Total number of resource species | 保护薄弱的资源 物种总数(比例) Number (proportion) of poorly protected resource species |
|---|---|---|---|---|---|---|---|---|
| 悬钩子属 Rubus | 206 | 74 (0.359) | 27 | 10 | 63 | 171 | 175 | 51 (0.291) |
| 蔷薇属 Rosa | 94 | 27 (0.287) | 10 | 53 | 37 | 36 | 57 | 3 (0.053) |
| 委陵菜属 Potentilla | 83 | 11 (0.133) | 4 | 16 | 36 | 0 | 40 | 0 |
| 绣线菊属 Spiraea | 67 | 13 (0.194) | 0 | 37 | 23 | 0 | 39 | 3 (0.077) |
| 花楸属 Sorbus | 64 | 13 (0.203) | 2 | 11 | 17 | 22 | 26 | 0 |
| 栒子属 Cotoneaster | 61 | 4 (0.066) | 0 | 20 | 16 | 55 | 58 | 3 (0.052) |
| 石楠属 Photinia | 43 | 17 (0.395) | 0 | 7 | 9 | 1 | 10 | 0 |
| 樱属 Cerasus | 38 | 0 | 5 | 13 | 15 | 19 | 23 | 0 |
| 苹果属 Malus | 23 | 2 (0.087) | 7 | 19 | 14 | 20 | 21 | 1 (0.048) |
| 山楂属 Crataegus | 18 | 5 (0.278) | 6 | 6 | 13 | 15 | 16 | 4 (0.250) |
| 绣线梅属 Neillia | 15 | 7 (0.467) | 0 | 6 | 3 | 0 | 6 | 0 |
中国蔷薇科全部物种的物种多样性在西南的横断山区和环绕四川盆地的山脉较高, 而在西北干旱区、华北平原东部和东北平原较低。在各气候带中, 亚热带是蔷薇科物种最集中的区域(图1)。各类资源植物的多样性格局和蔷薇科全部物种的多样性格局具有较高一致性, 但在局部有差别(图2)。对四类资源植物热点地区的叠加图显示, 全部资源植物共有的“四类热点”地区主要分布在四川盆地的北部、东部和西部, 特别是秦岭、大巴山和巫山山脉区域。“三类热点”主要集中在横断山区, 以及“四类热点”的边缘地带(图3)。虽然横断山区是全部物种及绝大多数资源植物的多样性热点地区, 但食用植物的热点地区则主要集中在秦岭、大巴山、巫山等地。各类资源植物占全部蔷薇科物种的比例存在明显的空间格局和类群差异。具体而言, 食用植物、园林绿化植物和药用植物在华北平原和东北平原的比例最高, 而水果种质资源则在华北平原东部和云贵高原东部比例最高(图2)。
图1
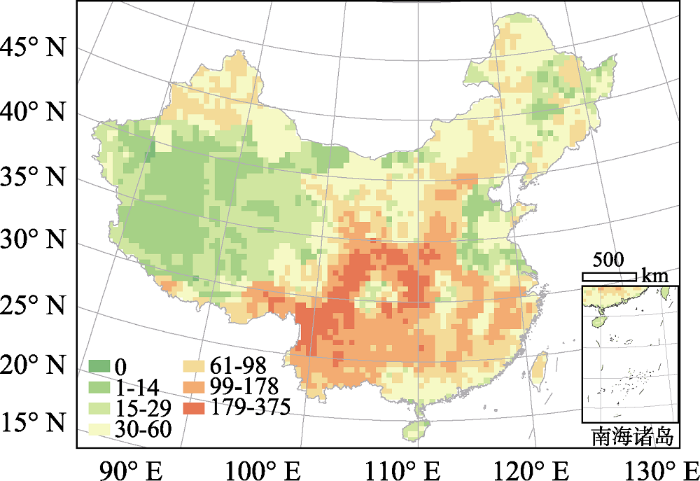
图1
中国蔷薇科物种多样性格局。不同颜色表示各个网格内蔷薇科的物种数。
Fig. 1
Species richness pattern of Rosaceae in China. Colors reflect number of Rosaceae species in each grid cell.
图2
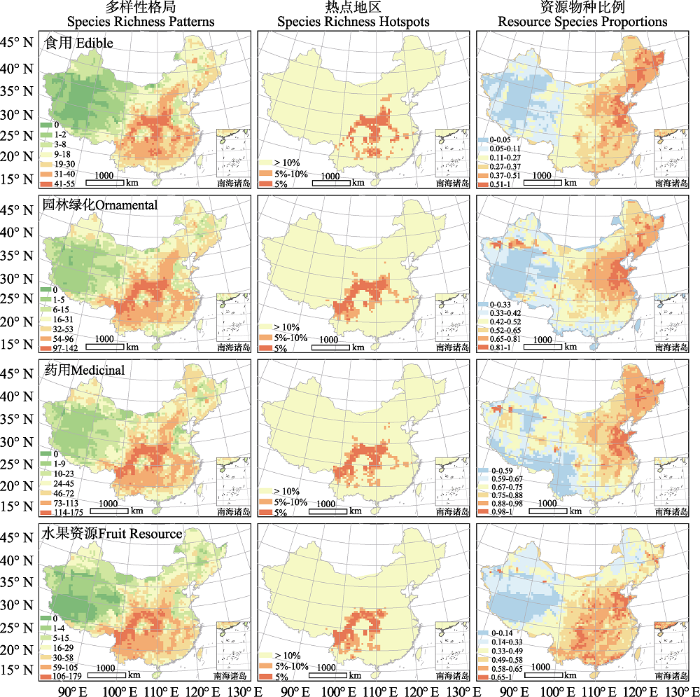
图2
中国蔷薇科各资源类别(食用植物、园林绿化植物、药用植物、水果种质资源)的物种多样性格局及其热点地区。第一列为物种多样性格局, 第二列为热点地区(颜色表示物种丰富度在所有网格中的分位数), 第三列为资源物种占蔷薇科全部物种的比例。
Fig. 2
Species richness patterns and hotspots of the four main resource groups (edible, ornamental, medicinal plants and fruit germplasm resources) of Rosaceae. The left column shows species richness patterns. The central column shows species richness hotspots (different colors represent different quantiles of species richness in each grid cell). The right column shows the ratios of the number of resource species and the number of all species in each grid cell.
图3
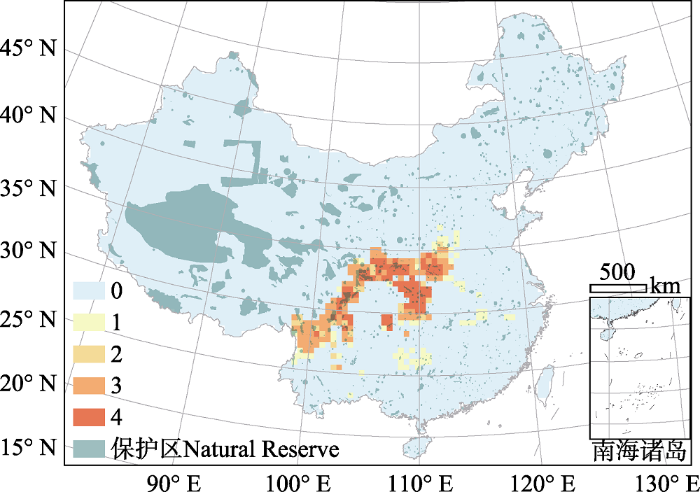
图3
中国蔷薇科各资源类别(食用植物、园林绿化植物、药用植物、水果种质资源)物种多样性热点地区叠加图。橙红深浅表示该热点地区资源类别的种数, 详见材料与方法1.5。绿色表示我国国家级和省级自然保护区的分布。
Fig. 3
The overlaid map of species richness hotspots of the four resource groups (edible, ornamental, medicinal plants and fruit germplasm resources) of Rosaceae. The orange and red colors represent the number of resource groups sharing the grid cell as their hotspot (see Materials and Methods 1.5). Green color represents national and provincial natural reserves in China.
广义线性模型分析结果显示, 水分因子是蔷薇科全部物种以及各类资源植物物种多样性格局最重要的主导因子(表2)。在所有资源类型中, 只有水果种质资源植物的多样性与温度季节性和LGM以来的温度迁移速率具有较显著的关系(表2)。这些结果说明, 在水热条件好、水分季节性不明显的区域, 蔷薇科植物的多样性较高; 在地形起伏较大、生境异质性较强的区域, 蔷薇科多样性也较高; 而在LGM以来气候变化较大(LGM以来温度升高、降水增加幅度大)以及气候变化空间迁移速率较高的地区, 蔷薇科植物多样性则较低(表2)。RDA结果显示, 物种分布主要受两组环境梯度的影响(附录V), 主要是沿第一RDA轴方向的MAT、MI和velocity_AP等因子和沿第二RDA轴方向的logELER、velocity_MAT和TSN等因子(附录IV)。
表2 蔷薇科全部物种及各资源类别(食用植物、园林绿化植物、药用植物、水果种质资源)物种多样性格局与环境因子的关系
Table 2
| 环境变量 Environmental variables | 总体 All species | 食用植物 Edible plants | 园林植物 Ornamental plants | 药用植物 Medicinal plants | 水果资源 Fruit Germplasm Resource |
|---|---|---|---|---|---|
| 气温 Temperature | |||||
| MAT | 14.4 | 24.1 | 15.4 | 16.6 | 19.0 |
| MTCQ | 21.4 | 20.5 | 18.0 | 18.1 | 29.2 |
| MTWQ | 3.7 | 20.1 | 7.7 | 9.3 | 3.7 |
| 降水 Precipitaion | |||||
| AP | 25.2 | 27.3 | 21.6 | 25.9 | 27.9 |
| MI | 35.0 | 24.3 | 28.7 | 31.1 | 36.2 |
| AET | 23.2 | 35.3 | 24.7 | 28.4 | 28.0 |
| 气候季节性 Climate Seasonality | |||||
| TSN | -19.3 | -5.2 | -9.7 | -8.2 | -30.6 |
| PSN | -11.1 | -8.6 | -9.8 | -12.7 | -12.0 |
| 生境异质性 Habitat heterogeneity | |||||
| logELER | 21.0 | 2.4 | 11.3 | 10.9 | 19.4 |
| logMATR | 20.1 | 2.0 | 10.8 | 10.2 | 18.7 |
| logAPR | 9.3 | 2.3 | 5.6 | 5.8 | 7.1 |
| 末次盛冰期以 来的气候变化 Climate Change since the LGM | |||||
| anomaly_MAT | -12.7 | -7.7 | -7.1 | -9.0 | -17.1 |
| anomaly_AP | -5.5 | n.s. | -3.7 | -1.8 | -6.8 |
| velocity_MAT | -25.3 | -10.6 | -17.2 | -17.4 | -30.9 |
| velocity_AP | -11.5 | -15.9 | -11.9 | -10.5 | -17.8 |
Pseudo-R2 (%) are shown by the numbers. “-” represents negative relationships and “n. s.” represents non-significant relationships. The environmental variables with the highest pseudo-R2 in each group are shown in bold. Variable abbreviations: AET, actual annual evapotranspiration; anomaly_AP, AP anomaly between the present and the LGM; anomaly_MAT, MAT anomaly between the present and the LGM; AP, annual precipitation; APR, range of annual precipitation; ELER, elevational range; MAT, mean annual temperature; MATR, range of mean annual temperature; MI, moisture index; MTCQ, mean temperature of the coldest quarter; MTWQ, mean temperature of the warmest quarter; PSN, precipitation seasonality; TSN, temperature seasonality; velocity_AP, spatially migration velocity to track AP change since the LGM;velocity_MAT, spatially migration velocity to track MAT change since the LGM.
数字表示泊松回归的调整Pseudo-R2值(%), 负号表示物种多样性与环境因子负相关, n.s.表示回归结果不显著。粗体字表示对每类物种的主导环境变量。AET, 年实际蒸散量; anomaly_AP, 末次盛冰期以来年降水量变化; anomaly_MAT, 末次盛冰期以来年平均气温变化; AP, 年降水量; APR, 降水量空间差异; ELER, 海拔高差; MAT, 年平均气温; MATR, 气温度空间差异; MI, 湿润指数; MTCQ, 最冷季平均气温; MTWQ, 最暖季平均气温; PSN, 降水季节性; TSN, 温度季节性; velocity_AP, 末次盛冰期以来年降水变化的空间迁移速率;velocity_MAT, 末次盛冰期以来年均温变化的空间迁移速率.
我国青藏高原和东北地区的自然保护区面积较大, 而东部和南部地区虽然保护区数量较多, 但大多面积较小(图3)。全部资源植物共有的“四类热点”地区(即四川盆地北部、东部和西部山区)被保护区覆盖的程度较高, 而其他类别的热点地区(如横断山区、秦岭北缘和东缘的部分地区)被保护区覆盖的程度相对较低(图3)。在各类热点地区内, 被保护区覆盖的网格比例都在60%-80%, 其中药用植物热点和“四类热点”地区被保护区覆盖的网格比例最高, 而其他类别热点地区被保护区覆盖的比例则较低(表3)。各类热点地区内, 平均每个网格内的保护区个数在1.11-2.01之间; 其中“四类热点”地区最高, 其他类型热点地区较低。保护区覆盖面积比例在各类热点地区之间差异较大, 介于6.8%-16.1%之间; 其中, “四类热点”地区覆盖面积最高, 达16.1%, 超过全国所有保护区面积占国土面积的比例(14.9%, 以下简称“全国平均水平”), 而其他热点地区内的保护区覆盖面积均低于全国平均水平, 尤其是“三类热点”和“单一热点”地区, 其被保护区覆盖的面积比例仅能达到全国平均水平的61%和46%。在各类热点地区内, 保护区覆盖面积小于10%的网格数量介于30%-45%之间; 其中, 食用植物和“四类热点”地区比例较低, 表明低保护区覆盖率(即保护区覆盖面积小于10%)的网格数量较少; 而“一类热点”、“三类热点”和水果种质资源热点地区的低保护区覆盖率均超过40%, 表明这些地区有接近一半的网格内保护区覆盖面积低于10%, 保护能力较弱(表3)。
表3 蔷薇科物种多样性热点地区的保护状况
Table 3
| 热点地区类型 Type of hotspot | 网格数 Number of grid cells | 被保护区覆盖的 网格比例 Proportion of grid cells covered by natural reserves | 网格内保护区的 平均个数 Mean number of natural reserves in each grid cell | 保护区覆盖面积比例 Proportion of area covered by natural reserves | 保护区覆盖面积小于10%的网格数量比例 Proportion of grid cells with < 10% of area covered by natural reserve |
|---|---|---|---|---|---|
| 所有物种 All species | 189 | 0.693 | 1.47 | 0.135 | 0.397 |
| 食用植物 Edible plants | 165 | 0.721 | 1.58 | 0.102 | 0.327 |
| 园林植物 Ornamental plants | 187 | 0.717 | 1.52 | 0.124 | 0.380 |
| 药用植物 Medicinal plants | 185 | 0.735 | 1.55 | 0.122 | 0.373 |
| 水果种质资源 Fruit germplasm resource | 172 | 0.727 | 1.57 | 0.137 | 0.424 |
| 四类热点 Type IV hotspot | 78 | 0.782 | 2.01 | 0.161 | 0.333 |
| 三类热点 Type III hotspot | 94 | 0.691 | 1.18 | 0.091 | 0.426 |
| 二类热点 Type II hotspot | 25 | 0.680 | 1.40 | 0.116 | 0.360 |
| 单一热点 Type I hotspot | 65 | 0.631 | 1.11 | 0.068 | 0.446 |
在所有209种保护薄弱种中, 水果种质资源比例最高(共计61种), 其次是园林绿化植物(12种)、药用植物(8种)和食用植物(1种), 说明后两者得到了较好的保护(表4)。
表4 蔷薇科各资源类别(食用植物、园林绿化植物、药用植物、水果种质资源)内保护薄弱物种的数量
Table 4
| 资源类型 Resource type | 物种总数 Total number of species | 保护薄弱物种数 Number of poorly protected species | 保护薄弱物种占比 Proportion of poorly protected species |
|---|---|---|---|
| 食用植物 Edible plants | 120 | 1 | 0.008 |
| 园林植物 Ornamental plants | 286 | 12 | 0.042 |
| 药用植物 Medicinal plants | 495 | 8 | 0.016 |
| 水果种质资源 Fruit germplasm resource | 398 | 61 | 0.153 |
图4
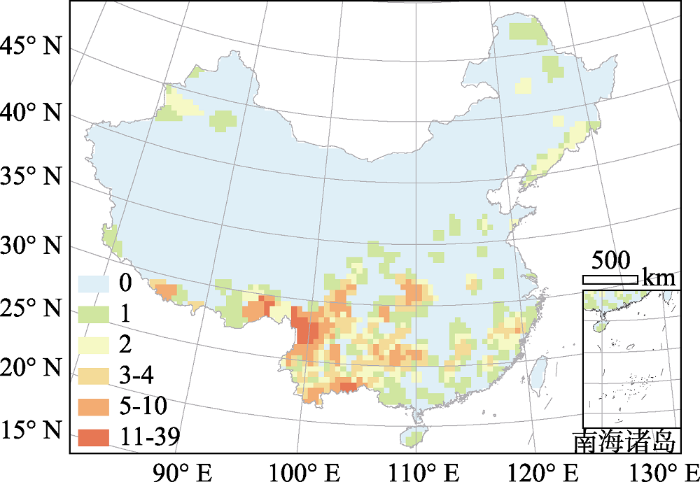
图4
蔷薇科内保护薄弱物种的物种多样性格局。保护薄弱物种定义为狭域物种(分布区最小的25%物种)与受保护较弱的物种(分布范围被保护区覆盖的网格数最小的25%)的交集。
Fig. 4
Species richness pattern of poorly protected species in Rosaceae. The definition of poorly protected species is the intersection between narrowly-ranged species (bottom 25% of range sizes) and the species whose distributed grid cells are less protected (bottom 25% numbers of distributed grids covered by natural reserves).
3 讨论
3.1 蔷薇科物种多样性格局及其与环境因子的 关系
蔷薇科全部植物和绝大多数资源植物的多样性热点地区主要集中在中国西南部的横断山区, 以及四川盆地的北部、东部和西部(图1)。这和其他种子植物类群具有相似的格局(如全部木本植物, Wang et al., 2012a; 杜鹃属(Rhododendron)植物, Shrestha et al., 2018)。综合来看, 蔷薇科的物种多样性格局表现出三个特点: 1)南方地区物种较多; 2)亚热带物种较热带多; 3)山区物种较其他地形多。这三个特点是分别受不同因素影响而产生的。
3.1.1 现代气候和历史气候变化因素的作用
首先, 南方地区物种较多是现代气候因子和LGM时期以来气候变化因子共同作用的结果。现代气候因子的作用表现为水热条件越好、季节性越不明显的地区物种多样性越高(表2)。RDA分析结果也显示蔷薇科物种分布与水热条件、气候季节性有较好的关联, 且气候季节性的作用和水热条件相反(附录IV)。其中, 水热条件主要通过影响植物生理活动限制植物的分布, 从而影响物种多样性。关于蔷薇科及其他类群植物生理的研究表明, 干旱或寒冷会降低叶片的气体交换速率, 并直接减少光合作用所需的水分, 从而影响光合速率(Schneider & Childers, 1941; Xu et al., 2016)。这说明, 干旱或寒冷可能通过限制植物光合作用从而限制植物在水热条件较恶劣的地区分布。此外, 干旱还会影响蔷薇科植物的结实率(Morales et al., 2013), 而寒冷会降低植株的水分运输效率(Cavender-Bares et al., 2005), 也会限制蔷薇科植物向更为干旱和寒冷的区域分布。而气候季节性强的区域气候波动大, 容易出现极端气候, 对植物的生存形成挑战, 故气候季节性和生物多样性呈负相关关系(Schmitt et al., 2013; Shreatha et al., 2018)。
在所有环境因子中, 蔷薇科植物多样性与水分因子的相关性最强(表2), 远强于其与温度因子的相关性。这些结果说明蔷薇科全体物种及各资源类型的物种多样性格局主要受水分影响。本研究的发现与以往关于东亚地区木本植物多样性格局主导因子的研究结果不同。比如, Wang等(2011)利用中国全部木本植物的分布图, 研究了中国木本植物物种多样性格局的主导因子, 发现冬季低温是中国木本植物多样性格局的主导因子, 而冬季低温主要是通过限制热带起源物种的向北扩散而决定东亚地区的木本植物多样性格局。这可能是因为蔷薇科主要起源于东亚的温带地区(Aldasoro et al., 2005; Oh & Potter, 2005; Lo et al., 2009; Dobeš & Paule, 2010; Chin et al., 2014), 有倾向于保留其祖先温带生态位的趋势(Xu et al., 2013), 对寒冷的耐受性较强, 故而对温度等因子的响应较水分因子弱; 而中国全部木本植物中有大量热带起源的类群, 更倾向于保留祖先的热带生态位, 对冬季低温的响应较强(Wang et al., 2011)。蔷薇科系统进化研究显示, 东亚温带区域是蔷薇科重要的起源中心(Aldasoro et al., 2005; Oh & Potter, 2005; Lo et al., 2009; Dobeš & Paule, 2010)。Chin等(2014)分析了广义李属(Prunus)全球81个物种的基因序列, 构建谱系树, 并确定分布在全球各区域物种的年龄, 确定该属在6 100万年前由东亚温带地区起源, 并逐步向全球其他地区扩散。基因证据显示广义李属温带的落叶类群比热带的常绿类群更为古老, 热带类群是由温带类群经杂交形成的新分支(Chin et al., 2014)。起源于温带的蔷薇科植物由于受祖先生态位保守性的限制, 可能难以扩散到环境不同的热带地区(Xu et al., 2013), 从而形成了亚热带山地地区物种较热带多的现象(图1)。
LGM以来的气候变化是影响植物地理分布的重要因素, 气候变化大的区域, 物种倾向于发生迁移和绝灭; 而气候变化小的区域则可能成为避难所, 容纳更多种类的植物(Sandel et al., 2011; Liu et al., 2017)。广义线性回归和RDA分析的结果均显示, LGM以来的气候变化对中国蔷薇科物种分布和物种多样性格局具有显著的影响。在LGM以来气候变化较大以及气候变化空间迁移速率较高的地区, 蔷薇科植物多样性则较低(表2; 附录IV)。为进一步分析LGM以来的气候变化与蔷薇科物种多样性格局的关系, 我们筛选出对蔷薇科物种多样性影响较大的anomaly_MAT, velocity_MAT, velocity_AP 3个因子, 显示了其分布格局(附录IV)。结果显示, 南方地区受LGM时期以来气候变化影响较小, 而东北、西北和青藏地区则受影响较大。受LGM以来气候变化影响较小的区域与蔷薇科物种多样性热点地区相一致(附录IV, 图1)。这表明LGM以来气候变化越小的地区物种多样性越高。我们的结果与关于北半球其他地区和其他类群物种多样性格局的研究结果是一致的。比如, Wang等(2012a, 2012b)发现, 中国木本植物的狭域种分布主要可能受LGM以来气候变化的显著影响。Montoya等(2007)评估了LGM以来的气候变化对北美和欧洲树木多样性格局的影响, 发现LGM结束后的冰川退缩时间显著影响了这两个大陆的植物多样性格局。类似的, Svenning和Skov (2007b)及Normand等(2011)对欧洲树木的研究、Araújo和Rahbek (2008)对欧洲两栖类和爬行类动物多样性的研究以及Hawkins和Porter (2003)对北美哺乳动物和鸟类多样性的研究, 均发现LGM以来的气候变化显著影响了这些地区的物种多样性格局。
3.1.2 生境异质性与地质变化的作用
山区物种较其他地形多, 可能主要是由空间上的生境异质性和时间上的地质-进化协同作用共同导致的(Wang et al., 2012a; Stein et al., 2014; Shrestha et al., 2018)。我们的结果显示, 横断山区是蔷薇科的主要物种多样性热点地区(图1), 这与以往对横断山区物种多样性格局的研究是一致的。横断山区作为全球生物多样性的一个热点地区, 不仅是蔷薇科多样性的热点地区, 也是很多其他类群的热点地区。这一区域拥有超过9 000种维管束植物, 且具有很高的特有性(中国科学院青藏高原综合科学考察队, 1993; Myers et al., 2000; Wang et al., 2012a)。这一地区巨大的生境异质性可能对热点地区的形成起到了重要作用。横断山区地处喜马拉雅山系东缘, 青藏高原的隆起给该地区带来复杂的地形和多种不同的生境。复杂的地形不仅为物种提供栖息地、促进物种共存, 在极端气候下还成为生物的避难所(López-Pujol et al., 2011)。与横断山区类似, 四川盆地周边的山区同样具有较为复杂的地形, 可以为蔷薇科植物提供更加多样化的生存环境, 从而容纳更多的物种(López-Pujol et al., 2011)。本文关于物种多样性和物种分布与环境因子关系的结果显示, 生境异质性与蔷薇科物种多样性存在正相关关系(表2), 很好地支持了前述观点。此外, 除了较高的生境异质性, 横断山区在地质历史上经历了比较剧烈的地质变化(Zhong & Ding, 1996), 从而促进了物种的迅速形成, 成为新物种的“摇篮” (Fjeldså et al., 2012; Hughes & Atchison, 2015)。比如, Xing和Ree (2017)分析了19个植物类群在横断山区、青藏高原区和东亚其他地区的进化, 发现横断山区自约1 000万年以来一直是东亚地区植物多样性的重要“摇篮”, 很多植物类群在横断山区发生快速分化并向周边地区扩散。
3.2 蔷薇科的资源植物
本研究收集了较为翔实的资料, 在中国蔷薇科植物名录的基础上, 补充了各物种常见的经济用途(包括食用、园林绿化、药用和水果种质资源, 见附录II), 可以为蔷薇科植物资源开发与保护提供参考。本名录包含了常见野生花卉山桃(Amygdalus davidiana)、海棠花(Malus spectabilis)、月季(Rosa chinensis), 观叶植物平枝栒子(Cotoneaster horizontalis)、石楠(Photinia serratifolia)、花楸(Sorbus pohuashanensis), 常见水果樱桃(Cerasus pseudocerasus)、李(Prunus salicina)、沙梨(Pyrus pyrifolia), 常用药材翻白草(Potentilla discolor)、地榆(Sanguisorba officinalis)等, 这些植物在中国人的生产生活中扮演着重要角色。通过该名录可以看出, 中国蔷薇科植物中超过一半具有药用价值, 超过40%可以成为培育水果新品种的种质资源, 同时有30%的物种具有园林绿化和观赏价值, 并可以成为培育新品种花卉苗木的种质资源(表4)。
由于本研究去除了人工杂交种以及自然分布区无法确定的栽培种, 实际上有大量的花卉和水果品种没有被纳入本研究的考察范围, 包括著名花卉西府海棠(Malus × micromalus)、梅花(Armeniaca mume), 传统水果桃(Amygdalus persica)、杏(Armeniaca vulgaris)、枇杷(Eriobotrya japonica)等。此外, 全国广泛种植的苹果(Malus domestica)、草莓(Fragaria × ananassa)等水果属外来种(Li, 1999; Liston et al., 2014), 也不在本研究的考察范围之内。但上述物种在我国农业经济中有着重要作用。比如我国是全球最大的苹果生产国, 年产量超过4 000万吨, 有数千万苹果产业从业人员, 相关产业年产值超过3 000亿元(王朱莹, 2017), 对服务“三农”, 脱贫攻坚具有重大意义(王朱莹, 2017)。这说明蔷薇科的经济价值可能远超本研究评估的水平, 而野生蔷薇科植物作为栽培种的种质资源, 其保护价值也日益凸显。另外, 对于其他资源类型的蔷薇科植物, 如蜜源植物、油料作物、用材树种、牧草与纤维植物等, 由于物种数较少或资料缺乏等原因, 本文没有加以评估。对于这些资源物种的多样性研究与保护有待进一步探索。
3.3 蔷薇科资源植物的保护现状和保护弱点
保护薄弱种的多样性格局显示, 横断山区是保护薄弱种分布最为集中的区域(图4, 由于台湾岛保护区分布数据缺失, 对该岛保护薄弱物种不作评估)。这说明, 在横断山区应有针对性地加强对蔷薇科物种、特别是资源植物的保护规划。类似地, 云南东南部和西藏东南部的部分地区同样也是保护薄弱物种集中分布的地区。然而, 近年来青藏高原东缘地区的土地利用变化对该地区的生物多样性造成了较为严重的威胁(Salick et al., 2005), 故而这些地区同时作为多样性热点地区和保护薄弱物种集中分布的地区, 在植物多样性保护, 特别是资源植物多样性保护方面需要引起更多关注(Forest et al., 2007)。
在生物多样性保护规划时, 考虑物种之间的进化关系有助于更合理地保护一个地区的进化历史(Laity et al., 2015)。但由于数据限制, 本研究主要着眼于物种多样性, 未考虑进化因素对资源植物、保护薄弱物种和保护区规划的影响(Faith, 1992), 在未来研究中应进一步分析蔷薇科进化及其对资源植物保护规划的作用。本研究通过对蔷薇科各属的资源植物禀赋及受保护状况的分析, 显示出蔷薇科内不同属之间资源禀赋的巨大差异(表1), 这表明在对该类群进行保护时, 需要根据各个属的分布状况有针对性地进行保护(Araiso & Dunford, 2005)。然而, 现有的保护体系并不能兼顾蔷薇科各个属的保护, 甚至在资源物种比较集中的大属中也出现了较多的保护薄弱物种(如悬钩子属, 表1)。因此, 对各个属的针对性保护, 应充分考虑各属的资源禀赋, 针对各资源类型的植物开展保护, 让保护区的保护功能更加合理高效。
致谢 感谢中国科学院沈阳应用生态研究所胡远满研究员、黄彦青研究员、布仁仓研究员、常禹研究员和郭金停博士等在植物鉴定工作中给予的帮助。
附录I 蔷薇科野生水果种质资源参考文献列表
Supplement I References of wild fruit germplasm resources of Rosaceae in China
附录II 本文所使用的蔷薇科物种名录、物种所属资源类别及濒危等级与保护情况
Supplement II Species list of all Rosaceae species, resource species, endangered species in China and conservation status of those species
附录IV 中国LGM以来气候变化指标的空间分布图
Supplement IV Spatial distributions of variables of climate change since last glacial maximum in China
附录V 中国蔷薇科物种分布格局与环境因子的关系
Supplement V Relationships between species distribution patterns of Rosaceae species and environmental variables in China

参考文献
Phylogenetic and phytogeographical relationships in Maloideae(Rosaceae) based on morphological and anatomical characters.
Comparison of genetic diversity of the invasive weed Rubus alceifolius Poir.(Rosaceae) in its native range and in areas of introduction, using amplified fragment length polymorphism (AFLP) markers.
A test of the higher-taxon approach in the identification of candidate sites for marine reserves
DOI:10.1007/s10531-004-0383-y
URL
[本文引用: 1]

Alternatives to species-level identification have been advocated as one solution to the problem of selecting marine reserves with limited information on the distribution of marine biodiversity.This study evaluated the effects on selection of candidate sites for marine reserves from using the higher-taxon approach as a surrogate for species-level identification of intertidal molluscs and rocky reef fishes. These effects were evaluated by determining the percentage of species included in candidate reserves identified from genus-, family- and order-level data by a complementarity-based reserve selection algorithm, and by testing for correlations between the irreplaceability values of locations. Candidate reserves identified from genus- and family-level data of intertidal molluscs included a similar percentage of all species as the reserves identified from species-level data. Candidate reserves selected from genus- and family-level data of rocky reef fishes included, respectively, 3 7% and 14 23% fewer species than reserves selected from species-level data. When the reserve identification process was constrained by a practical planning limit (a maximum of 20% locations able to be reserved) the reserves selected from genus- and family-level data of intertidal molluscs, and genus-level data of rocky reef fishes, included a similar percentage of species as the reserves identified from species-level data. Irreplaceability values of locations for species, genera and families of intertidal molluscs were highly correlated, and irreplaceability values of locations for species and genera of rocky reef fishes were highly correlated. This study suggests that genus- and family-level data for intertidal molluscs, and genus-level data for rocky reef fishes, are suitable surrogates for species in the identification of candidate sites for marine reserves.
Quaternary climate changes explain diversity among reptiles and amphibians
DOI:10.1111/j.2007.0906-7590.05318.x
URL
[本文引用: 1]
It is widely believed that contemporary climate determines large-scale patterns of species richness. An alternative view proposes that species richness reflects biotic responses to historic climate changes. These competing "contemporary climate" vs "historic climate" hypotheses have been vigorously debated without reaching consensus. Here, we test the proposition that European species richness of reptiles and amphibians is driven by climate changes in the Quaternary. We find that climate stability between the Last Glacial Maximum (LGM) and the present day is a better predictor of species richness than contemporary climate; and that the 000°C isotherm of the LGM delimits the distributions of narrow-ranging species, whereas the current 000°C isotherm limits the distributions of wide-ranging species. Our analyses contradict previous studies of large-scale species richness patterns and support the view that "historic climate" can contribute to current species richness independently of and at least as much as contemporary climate.
New approaches for establishing conservation priorities for socio-economically important plant species
DOI:10.1007/s10531-010-9871-4
URL
[本文引用: 2]
The establishment of priorities among species is a crucial step in any conservation strategy since financial resources are generally limited. Traditionally, priorities for conservation of plant species have been focused on endemicity, rarity and particularly on their threatened status. Crop wild relatives (CWR) and wild harvested plants (WHP) are important elements of biodiversity with actual or potential socio-economic value. In this study, eight prioritisation criteria were used along with different prioritisation systems and applied to the Portuguese CWR and WHP. The top 50 species obtained by each of these methods were identified. The final top CWR were those that occurred as a priority in most methods. Twenty CWR were identified as the highest priorities for conservation in Portugal and they include wild relatives of the crop genera Allium , Daucus , Dianthus , Epilobium , Festuca , Herniaria , Narcissus , Quercus , Plantago , Trifolium , and Vicia . Eighteen WHP were recognised as priorities for conservation and include several Narcissus and Thymus species, among others. The advantages, limitations and level of subjectivity of each of the methods used in this exercise are discussed.
Why are there so many species in the tropics?
DOI:10.1111/jbi.12228
URL
PMID:4320694
[本文引用: 1]
Known for centuries, the geographical pattern of increasing biodiversity from the poles to the equator is one of the most pervasive features of life on Earth. A longstanding goal of biogeographers has been to understand the primary factors that generate and maintain high diversity in the tropics. Many ‘historical’ and ‘ecological’ hypotheses have been proposed and debated, but there is still little consensus. Recent discussions have centred around two main phenomena: phylogenetic niche conservatism and ecological productivity. These two factors play important roles, but accumulating theoretical and empirical studies suggest that the single most important factor is kinetics: the temperature dependence of ecological and evolutionary rates. The relatively high temperatures in the tropics generate and maintain high diversity because ‘the Red Queen runs faster when she is hot’.
Summer and winter sensitivity of leaves and xylem to minimum freezing temperatures: A comparison of co-occurring mediterranean oaks that differ in leaf lifespan
DOI:10.1111/j.1469-8137.2005.01555.x
URL
PMID:16313643
[本文引用: 2]
Freezing sensitivity of leaves and xylem was examined in four co-occurring Mediterranean oaks (Quercus spp.) grown in a common garden to determine whether freezing responses of leaves and xylem were coordinated and could be predicted by leaf lifespan. Freezing-induced embolism and loss of photosynthetic function were measured after overnight exposure to a range of subzero temperatures in both summer and winter. Both measures were found to be dependent on minimum freezing temperature and were correlated with leaf lifespan and vessel diameter. The dependence of xylem embolism on minimum freezing temperature may result from the decline in water potential with ice temperature that influences the redistribution of water during freezing and leads to an increase in xylem tension. Winter acclimatization had a relatively small effect on the vulnerability to freezing-induced embolism, although leaf photosynthetic function showed a strong acclimatization response, particularly in the two evergreen species. Quercus ilex, the species with the longest leaf lifespan and narrowest vessel diameters, showed the highest freezing tolerance. This helps explain its ability to inhabit a broad range throughout the Mediterranean region. By contrast, the inability of the deciduous oaks to maintain photosynthetic and vascular function throughout the winter indicates a competitive disadvantage that may prevent them from expanding their ranges.
Diversification of almonds, peaches, plums and cherries— Mmolecular systematics and biogeographic history of Prunus(Rosaceae).
DOI:10.1016/j.ympev.2014.02.024
URL
PMID:24631854
[本文引用: 3]
Most previous molecular phylogenetic studies of Prunus have been conducted primarily with crop species and their close relatives. As the center of crop diversity of the genus is in Eurasia, the geographic origin of Prunus has inevitably been inferred to be Eurasia as well. The lesser-known tropical Prunus species have not been well represented in previous phylogenetic reconstructions; therefore, their effects on inferences about the phylogenetic structure and geographic origin of Prunus are uncertain. In this study, we examined the phylogeny of Prunus, including an expanded sampling of species from tropical regions in Southeast Asia and the Americas, using sequences from four plastid markers and the nuclear ribosomal ITS region. A penalized likelihood method was used to estimate the absolute age of Prunus and the timing of infrageneric cladogenic events. The geographic origin of Prunus and ancestral sites of cladogenesis were inferred using the Bayes-DIVA approach. Our results indicate that the modern genus appeared 61Myr in eastern Asia and that diversification of all major lineages may have been triggered by the global warming period of the early Eocene. In addition, our molecular dating estimates suggest that the crown clade that includes the temperate deciduous crop species is older than the one that includes the tropical evergreen species, while incongruence between plastid and nuclear phylogenies suggests that the latter lineage originated via an ancient hybridization event. The most recent common ancestor (MRCA) of the temperate crop species was a component of the continuous boreotropical forests of the Northern Hemisphere, while the MRCA of the tropical species represented the last remains of the boreotropical elements and subsequently radiated throughout the Old and New World tropics from refugial areas at lower latitudes. Complex biogeographic histories leading to the present global distribution of the genus were driven by several geologic events, climatic oscillations, and independent dispersals across continents via the Bering and the North Atlantic Land Bridges during different geologic time periods.
Forecasting changes in amphibian biodiversity: Aiming at a moving target
DOI:10.1098/rstb.2004.1588
URL
PMID:1569460
[本文引用: 1]
Amphibian population declines and sudden species' extinctions began to be noted at the beginning of the 1980s. Understanding the causes of the losses is hampered by our poor knowledge of the amphibian fauna in many parts of the world. Amphibian taxa are still being described at a high rate, especially in the tropics, which means that even quantifying species lost as a percentage of the current fauna can be a misleading statistic in some parts of the globe. The number of species that have gone missing is only one measure of the loss of biodiversity. Long-term studies of single-species populations are needed, but this approach has its limits. Amphibian populations often show great annual variation in population size making it difficult, if not impossible, to use short-term studies as a basis for deciding if a population is increasing or decreasing in the long term. Aggregating single studies into databases and searching for patterns of variation is a way of overcoming this limitation. Several databases on species and population time series are available or in development. These records show that declines are continuing worldwide with some species and populations, especially in the tropics and at higher elevations, at greater risk of extinction than others. Unfortunately, amphibian databases with population time series have much less information for the tropics compared to the temperate zone, and less for Africa and Asia compared with Europe and North America. Focusing limited resources using comprehensive statistical designs is a way to maximize the efficiency and effectiveness of monitoring efforts. It is clear that, in the first decades of the twenty-first century, the regions of the globe with the highest diversity of amphibian species will experience the greatest rates of decrease of forests and increase in human population size, fertilizer use, agricultural production, creation of new croplands and irrigation. Many of these changes are likely negatively to affect amphibian species diversity, and their influence must be understood before concluding, at least for amphibians, that the 2010 millennium assessment goal of significantly reversing the rate of loss of Earth's biodiversity can be met.
Energy and large-scale patterns of animal- and plant-species richness
DOI:10.2307/2462155
URL
[本文引用: 1]
http://www.jstor.org/stable/2462155
A comprehensive chloroplast DNA- based phylogeny of the genus Potentilla(Rosaceae): Implications for its geographic origin, phylogeography and generic circumscription.
DOI:10.1016/j.ympev.2010.03.005
URL
PMID:20214995
[本文引用: 2]
A reconstruction of phylogenetic relationships based on three chloroplast DNA markers comprising 98 species of the genus Potentilla and 15 additional genera from the tribe Potentilleae (Rosaceae) is presented. The phylogeny supported the current generic concept of the subtribe Fragariinae and resolved major lineages within the subtribe Potentillinae. Resolved lineages corresponded to the combined genera Argentina, Piletophyllum, and Tylosperma, an European and Asian group of species approximately equivalent to the Trichocarpae Herbaceae sensu Th. Wolf, the series Tormentillae Th. Wolf, a North American clade comprising the genera Horkelia, Horkeliella, and Ivesia, the species Potentilla fragarioides and P. freyniana, and to a taxonomically highly diverse but molecularly little diverged core group of Potentilla, respectively. Age estimates of phylogenetic splits resolved in the Potentilleae using Bayesian inference, suggested a diversification of the tribe in the Eocene and radiation of two major evolutionary lineages corresponding to the Fragariinae and Potentillinae at approximately comparable times. Ancestral area reconstructions based on the recent distribution ranges of species and collection sites of cpDNA haplotypes suggested an Asian origin for Potentilla s.str., and explained the arrival of this still informal taxon in Europe and particularly North America by multiple dispersal events. In combining the phylogenetic and geographic data with molecularly inferred time estimates and taxonomy, strongly contrasting evolutionary patterns were identified. These evolutionary patterns included rapid speciation on a continental and worldwide scale accompanied by multiple intercontinental dispersals opposed to largely diverged lineages of limited taxonomic diversity and vicariant geographic distribution. The molecular-based phylogeographic hypothesis finally is discussed on the background of the fossil record of Potentilla.
Conservation evaluation and phylogenetic diversity
DOI:10.1016/0006-3207(92)91201-3
URL
[本文引用: 1]
Protecting biological diversity with limited resources may require placing conservation priorities on different taxa. A system of priorities that reflects the value of taxonomic diversity can be achieved by setting priorities such that the subset of taxa that is protected has maximum underlying feature diversity. Such feature diversity of taxon subsets is difficult to estimate directly, but can be predicted by the cladistic/phylogenetic relationships among the taxa. In this study, a simple measure of phylogenetic diversity is defined based on cladistic information. The measure of phylogenetic diversity, PD, is contrasted with a measure of taxic diversity recently developed by Vane-Wright et al. (Biol. Conserv., 55, 1991). In re-examining reserve-selection scenarios based on a phylogeny of bumble bees (Apidae), PD produces quite different priorities for species conservation, relative to taxic diversity. The potential application of PD at levels below that of the species is then illustrated using a mtDNA phylogeny for populations of crested newts Triturus cristatus. Calculation of PD for different population subsets shows that protection of populations at either of two extremes of the geographic range of the group can significantly increase the phylogenetic diversity that is protected.
Transferability of newly developed pear SSR markers to other Rosaceae species
DOI:10.1007/s11105-013-0586-z
URL
PMID:24415844
[本文引用: 1]
A set of 120 simple sequence repeats (SSRs) was developed from the newly assembled pear sequence and evaluated for polymorphisms in seven genotypes of pear from different genetic backgrounds. Of these, 67 (55.8 %) primer pairs produced polymorphic amplifications. Together, the 67 SSRs detected 277 alleles with an average of 4.13 per locus. Sequencing of the amplification products from randomly picked loci NAUPy31a and NAUpy53a verified the presence of the SSR loci. When the 67 primer pairs were tested on 96 individual members of eight species in the Rosaceae family, 61.2 % (41/67) of the tested SSRs successfully amplified a PCR product in at least one of the Rosaceae genera. The transferability from pear to different species varied from 58.2 % (apple) to 11.9 % (cherry). The ratio of transferability also reflected the closer relationships within Maloideae over Prunoideae. Two pear SSR markers, NAUpy43c and NAUpy55k, could distinguish the 20 different apple genotypes thoroughly, and UPGMA cluster analysis grouped them into three groups at the similarity level of 0.56. The high level of polymorphism and good transferability of pear SSRs to Rosaceae species indicate their promise for application to future molecular screening, map construction, and comparative genomic studies among pears and other Rosaceae species. The online version of this article (doi:10.1007/s11105-013-0586-z) contains supplementary material, which is available to authorized users.
Atlas of Woody Plants in China: Distribution and Climate
The role of mountain ranges in the diversification of birds
DOI:10.1146/annurev-ecolsys-102710-145113
URL
[本文引用: 2]
Avian faunas vary greatly among montane areas; those at high latitudes are biologically impoverished, whereas those of some low-latitude mountains are biologically very complex. Their high level of species richness is caused by the aggregation of many small-ranged species, which has been difficult to explain from purely macroecological models focusing on contemporary ecological processes. Because the individual mountain tracts harbor species that represent different evolutionary trajectories, it seems plausible to relate these species assemblages to high persistence (or absence of extinction) in addition to high levels of speciation. The distribution of small-ranged species is concentrated near tropical coasts, where moderation of the climate in topographically complex areas creates cloud forests and stable local conditions. The stability underpins specialization and resilience of local populations, and thereby the role of these places as cradles of biodiversity.
Preserving the evolutionary potential of floras in biodiversity hotspots
DOI:10.1038/nature05587
URL
PMID:17301791
[本文引用: 1]
One of the biggest challenges for conservation biology is to provide conservation planners with ways to prioritize effort. Much attention has been focused on biodiversity hotspots. However, the conservation of evolutionary process is now also acknowledged as a priority in the face of global change. Phylogenetic diversity (PD) is a biodiversity index that measures the length of evolutionary pathways that connect a given set of taxa. PD therefore identifies sets of taxa that maximize the accumulation of 'feature diversity'. Recent studies, however, concluded that taxon richness is a good surrogate for PD. Here we show taxon richness to be decoupled from PD, using a biome-wide phylogenetic analysis of the flora of an undisputed biodiversity hotspot--the Cape of South Africa. We demonstrate that this decoupling has real-world importance for conservation planning. Finally, using a database of medicinal and economic plant use, we demonstrate that PD protection is the best strategy for preserving feature diversity in the Cape. We should be able to use PD to identify those key regions that maximize future options, both for the continuing evolution of life on Earth and for the benefit of society.
Global patterns in biodiversity
DOI:10.1038/35012228 [本文引用: 1]
Response to increasing southern hemisphere winds in CCSM4
DOI:10.1175/JCLI-D-10-05011.1
URL
[本文引用: 1]
Results from two perturbation experiments using the Community Climate System Model version 4 where the Southern Hemisphere zonal wind stress is increased are described. It is shown that the ocean response is in accord with experiments using much-higher-resolution ocean models that do not use an eddy parameterization. The key to obtaining an appropriate response in the coarse-resolution climate model is to specify a variable coefficient in the Gent and McWilliams eddy parameterization, rather than a constant value. This result contrasts with several recent papers that have suggested that coarse-resolution climate models cannot obtain an appropriate response.
Relative influences of current and historical factors on mammal and bird diversity patterns in deglaciated North America
DOI:10.1046/j.1466-822X.2003.00060.x
URL
[本文引用: 1]
Aim To investigate the relative contributions of current vs. historical factors in explaining broad-scale diversity gradients using a combination of contemporary factors and a quantitative estimate of the temporal accessibility of areas for recolonization created by glacial retreat following the most recent Ice Age. Location The part of the Nearctic region of North America that was covered by ice sheets during the glacial maximum 20 000 BP. Methods We used range maps to estimate the species richness of mammals and terrestrial birds in 48 400 km 2 cells. Current conditions in each cell were quantified using seven climatic and topographical variables. Historical conditions were estimated using the number of years before present when an area became exposed as the ice sheets retreated during the post-Pleistocene climate warming. We attempted to tease apart contemporary and historical effects using multiple regression, partial regression and spatial autocorrelation analysis. Results A measure of current energy inputs, potential evapotranspiration, explained 76 82% of the variance in species richness, but time since deglaciation explained an additional 8 13% of the variance, primarily due to effects operating at large spatial scales. Because of spatial covariation between the historical climates influencing the melting of the ice sheet and current climates, it was not possible to partition their effects fully, but of the independent effects that could be identified, current climate explained two to seven times more variance in richness patterns than age. Main Conclusions Factors acting in the present appear to have the strongest influence on the diversity gradient, but an historical signal persisting at least 13 000 years is still detectable. This has implications for modelling changes in diversity patterns in response to future global warming.
Very high resolution interpolated climate surfaces for global land areas
DOI:10.1002/joc.1276
URL
[本文引用: 3]
We developed interpolated climate surfaces for global land areas (excluding Antarctica) at a spatial resolution of 30 arc s (often referred to as 1-km spatial resolution). The climate elements considered were monthly precipitation and mean, minimum, and maximum temperature. Input data were gathered from a variety of sources and, where possible, were restricted to records from the 1950-2000 period. We used the thin-plate smoothing spline algorithm implemented in the ANUSPLIN package for interpolation, using latitude, longitude, and elevation as independent variables. We quantified uncertainty arising from the input data and the interpolation by mapping weather station density, elevation bias in the weather stations, and elevation variation within grid cells and through data partitioning and cross validation. Elevation bias tended to be negative (stations lower than expected) at high latitudes but positive in the tropics. Uncertainty is highest in mountainous and in poorly sampled areas. Data partitioning showed high uncertainty of the surfaces on isolated islands, e.g. in the Pacific. Aggregating the elevation and climate data to 10 arc min resolution showed an enormous variation within grid cells, illustrating the value of high-resolution surfaces. A comparison with an existing data set at 10 arc min resolution showed overall agreement, but with significant variation in some regions. A comparison with two high-resolution data sets for the United States also identified areas with large local differences, particularly in mountainous areas. Compared to previous global climatologies, ours has the following advantages: the data are at a higher spatial resolution (400 times greater or more); more weather station records were used; improved elevation data were used; and more information about spatial patterns of uncertainty in the data is available. Owing to the overall low density of available climate stations, our surfaces do not capture of all variation that may occur at a resolution of 1 km, particularly of precipitation in mountainous areas. In future work, such variation might be captured through knowledge-based methods and inclusion of additional co-variates, particularly layers obtained through remote sensing. Copyright 2005 Royal Meteorological Society.
Handbook of Economic Plants
经济植物手册
The ubiquity of alpine plant radiations: From the Andes to the Hengduan Mountains
DOI:10.1111/nph.13230
URL
PMID:25605002
[本文引用: 2]
Abstract I. II. III. IV. V. VI. References SUMMARY: Alpine plant radiations are compared across the world's major mountain ranges and shown to be overwhelmingly young and fast, largely confined to the Pliocene and Pleistocene, and some of them apparently in the early explosive phase of radiation. Accelerated diversification triggered by island-like ecological opportunities following the final phases of mountain uplift, and in many cases enabled by the key adaptation of perennial habit, provides a general model for alpine plant radiations. Accelerated growth form evolution facilitated by perenniality provides compelling evidence of ecological release and suggests striking parallels between island-like alpine, and especially tropicalpine radiations, and island radiations more generally. These parallels suggest that the world's mountains offer an excellent comparative system for explaining evolutionary radiation. 2015 The Authors. New Phytologist 2015 New Phytologist Trust.
Geographic range size and determinants of avian species richness
DOI:10.1126/science.1072779 URL [本文引用: 1]
Habitat heterogeneity as a determinant of mammal species richness in high-energy regions
Evidence for cryptic northern refugia in the last glacial period in Cryptomeria japonica.
Phylodiversity to inform conservation policy: An Australian example
DOI:10.1016/j.scitotenv.2015.04.113
URL
PMID:25976346
[本文引用: 1]
61We demonstrate tangible advantages of phylodiversity to conservation61Study regions have a higher proportion of phylodiversity than species richness.61Low regional phylogenetic endemism was found despite high numbers of endemics.61High congruency found between PD and SR and between PE and WE within taxa61Biotic responses to evolutionary processes are strongly influenced by life history
A phylogenetic analysis of Prunus and the Amygdaloideae (Rosaceae) using its sequences of nuclear ribosomal DNA.
DOI:10.2307/2657135
URL
PMID:11159135
[本文引用: 1]
The economically important plum or cherry genus (Prunus) and the subfamily Amygdaloideae of the Rosaceae have a controversial taxonomic history due to the lack of a phylogenetic framework. Phylogenetic analysis using the ITS sequences of nuclear ribosomal DNA (nrDNA) was conducted to construct the evolutionary history and evaluate the historical classifications of Prunus and the Amygdaloideae. The analyses suggest two major groups within the Amygdaloideae: (1) Prunus s.l. (sensu lato) and Maddenia, and (2) Exochorda, Oemleria, and Prinsepia. The ITS phylogeny supports the recent treatment of including Exochorda (formerly in the Spiraeoideae) in the Amygdaloideae. Maddenia is found to be nested within Prunus s.l. in the parsimony and distance analyses, but basal to Prunus s.l. in the maximum likelihood analysis. Within Prunus, two major groups are recognizable: (1) the Amygdalus-Prunus group, and (2) the Cerasus-Laurocerasus-Padus group. The clades in the ITS phylogeny are not congruent with most subgeneric groups in the widely used classification of Prunus by Rehder. A broadly defined Prunus is supported.
An investigation and studies on the origin and evolution of Malus domestica Borkh. in the world.
An R2R3 MYB transcription factor associated with regulation of the anthocyanin biosynthetic pathway in Rosaceae
DOI:10.1186/1471-2229-10-50
URL
PMID:2923524
[本文引用: 1]
pAbstract/p pBackground/p pThe control of plant anthocyanin accumulation is via transcriptional regulation of the genes encoding the biosynthetic enzymes. A key activator appears to be an R2R3 MYB transcription factor. In apple fruit, skin anthocyanin levels are controlled by a gene called itMYBA /itor itMYB1/it, while the gene determining fruit flesh and foliage anthocyanin has been termed itMYB10/it. In order to further understand tissue-specific anthocyanin regulation we have isolated orthologous itMYB /itgenes from all the commercially important rosaceous species./p pResults/p pWe use gene specific primers to show that the three MYB activators of apple anthocyanin (itMYB10/MYB1/MYBA) /itare likely alleles of each other. MYB transcription factors, with high sequence identity to the apple gene were isolated from across the rosaceous family (e.g. apples, pears, plums, cherries, peaches, raspberries, rose, strawberry). Key identifying amino acid residues were found in both the DNA-binding and C-terminal domains of these MYBs. The expression of these itMYB10 /itgenes correlates with fruit and flower anthocyanin levels. Their function was tested in tobacco and strawberry. In tobacco, these MYBs were shown to induce the anthocyanin pathway when co-expressed with bHLHs, while over-expression of strawberry and apple genes in the crop of origin elevates anthocyanins./p pConclusions/p pThis family-wide study of rosaceous R2R3 MYBs provides insight into the evolution of this plant trait. It has implications for the development of new coloured fruit and flowers, as well as aiding the understanding of temporal-spatial colour change./p
Fragaria: A genus with deep historical roots and ripe for evolutionary and ecological insights
DOI:10.3732/ajb.1400140
URL
PMID:25326614
[本文引用: 1]
The cultivated strawberry, Fragaria ananassa, is one of the youngest domesticated plants. Its 18th century origin via hybridization in Europe between the North American F. virginiana and the South American F. chiloensis was documented by the botanist Antoine Nicolas Duchesne. His 1766 "Natural History of Strawberries" is an extraordinary work that integrates fundamental discoveries on the biology, ecology, and phylogeny of Fragaria with applied information on cultivation and ethnobotanical uses, serving as an inspiration for current research in the genus. Fragaria species exhibit the full range of sexual systems in the gynodioecy pathway from hermaphroditism to dioecy (and back again), as well as variation in self-compatibility, and evidence of sex chromosomes with female heterogamety. The genus is also characterized by interspecific hybridization and polyploidy, with a natural range of ploidy levels from diploids to decaploids. This biological diversity, combined with the availability of genomic resources and the ease of growing and experimenting with the plants, makes Fragaria a very attractive system for ecological and evolutionary genomics. The goal of this review is to introduce Fragaria as a model genus and to provide a roadmap for future integrative research. These research directions will deepen our understanding of the ecological and evolutionary context that shaped the ancestors of the cultivated strawberry, not only providing information that can be applied to efforts to shape the future of this important fruit crop but also our understanding of key transitions in plant evolution.
Determinants of richness patterns differ between rare and common species: Implications for Gesneriaceae conservation in China
DOI:10.1111/ddi.12523
URL
[本文引用: 2]
AbstractAimWhether richness patterns and determinants are consistent between common and rare species remains controversial, and the answer is fundamental for the conservation of species in ...
Evidence for genetic association between East Asian and western North American Crataegus L.(Rosaceae) and rapid divergence of the eastern North American lineages based on multiple DNA sequences.
DOI:10.1016/j.ympev.2009.01.018
URL
PMID:19640428
[本文引用: 2]
Phylogeographic relationships were constructed for 72 Old and New World Crataegus species using combinations of four chloroplast and up to five nuclear regions. Maximum parsimony, maximum likelihood, and Bayesian results yield consistent relationships among major lineages. The close associations of the East Asian and western North American species point toward ancient trans-Beringian migrations. Relationships among eastern North American species are poorly resolved and few groups are identified that are congruent with existing classifications. Scant variation and short internal branches among these species suggest rapid divergence associated with polyploidy and hybridization. Incongruence between the chloroplast and nuclear data, and morphology suggest hybrid origins of three species from an extinct European lineage (the male parent) and three different North American female parents. Europe and eastern North America are suggested as the most recent common areas for Crataegus; at least four dispersal events are inferred to explain the present distribution of the genus.
The velocity of climate change
DOI:10.1038/nature08649
URL
PMID:20033047
[本文引用: 2]
Abstract The ranges of plants and animals are moving in response to recent changes in climate. As temperatures rise, ecosystems with 'nowhere to go', such as mountains, are considered to be more threatened. However, species survival may depend as much on keeping pace with moving climates as the climate's ultimate persistence. Here we present a new index of the velocity of temperature change (km yr(-1)), derived from spatial gradients ( degrees C km(-1)) and multimodel ensemble forecasts of rates of temperature increase ( degrees C yr(-1)) in the twenty-first century. This index represents the instantaneous local velocity along Earth's surface needed to maintain constant temperatures, and has a global mean of 0.42 km yr(-1) (A1B emission scenario). Owing to topographic effects, the velocity of temperature change is lowest in mountainous biomes such as tropical and subtropical coniferous forests (0.08 km yr(-1)), temperate coniferous forest, and montane grasslands. Velocities are highest in flooded grasslands (1.26 km yr(-1)), mangroves and deserts. High velocities suggest that the climates of only 8% of global protected areas have residence times exceeding 100 years. Small protected areas exacerbate the problem in Mediterranean-type and temperate coniferous forest biomes. Large protected areas may mitigate the problem in desert biomes. These results indicate management strategies for minimizing biodiversity loss from climate change. Montane landscapes may effectively shelter many species into the next century. Elsewhere, reduced emissions, a much expanded network of protected areas, or efforts to increase species movement may be necessary.
Centres of plant endemism in China: Places for survival or for speciation?
DOI:10.1111/jbi.2011.38.issue-7 URL [本文引用: 2]
Effects of climatic change on the Thornthwaite moisture index
DOI:10.1111/j.1752-1688.1990.tb01400.x
URL
[本文引用: 1]
ABSTRACT: The Thornthwaite moisture index is a useful indicator of the supply of water (precipitation) in an area relative to the demand for water under prevailing climatic conditions (potential evapotranspiration). This study examines the effects of changes in climate (temperature and precipitation) on the Thornthwaite moisture index in the conterminous United States. Estimates of changes in mean annual temperature and precipitation for doubled-atmospheric CO 2 conditions derived from three general circulation models (GCMs) are used to study the response of the moisture index under steady-state doubled-CO 2 conditions. Results indicate that temperature and precipitation changes under doubled-CO 2 conditions generally will cause the Thornthwaite moisture index to decrease, implying a drier climate for most of the United States. The pattern of expected decrease is consistent among the three GCMs, although the amount of decrease depends on which GCM climatic-change scenario is used. Results also suggest that changes in the moisture index are related mainly to changes in the mean annual potential evapotranspiration as a result of changes in the mean annual temperature, rather than to changes in the mean annual precipitation.
When history matters: Scale, time, climate and tree diversity
DOI:10.2307/2997586
URL
[本文引用: 1]
Palaeoecological insights have had only a limited impact on modern ecological thinking, and tend to be used in an unsophisticated manner. Recent successes in correlating tree diversity with contemporary climate and, in particular, energy, have led to claims that explanations for tree diversity based on historical processes or events are superfluous. However, diversity-energy correlations are strong only at regional scales, and fail to predict diversity at small plots within latitudinal bands, or between continents. Moreover, tree diversity cannot have responded to global glacial-interglacial energy fluctuations because plant species cannot evolve that rapidly nor, in most areas of the world, can migration plausibly adjust regional floral diversity. Thus contemporary climate or energy, while yielding excellent correlations with plant diversity, has no explanatory power. Palaeoecological studies show that cycles of forest migration, fragmentation, reduction, and re-expansion are forced by glacial-interglacial climate cycles at high to mid latitudes. These in turn reduce opportunities for habitat specialization, rapidly eliminate species that remain rare throughout a glacial-interglacial cycle, and promote genetic continuity between populations. The result is increasingly impoverished regional floras with increasing latitude, and hence the latitudinal tree species gradient. Contemporary climate regimes act as a surrogate for the sum total of past climatic states and their effects on diversity, and hence the strong regional climate correlations with tree diversity.
Diversity of the genus Polylepis(Rosaceae, Sanguisorbeae) in the Peruvian Andes.
Contemporary richness of holarctic trees and the historical pattern of glacial retreat
DOI:10.1111/eco.2007.30.issue-2 URL [本文引用: 1]
Phenological and physiological responses to drought stress and subsequent rehydration cycles in two raspberry cultivars
DOI:10.1016/j.scienta.2013.07.025
URL
[本文引用: 2]
Raspberry (Rubus idaeus L.) is a deciduous plant with perennial roots, 75% of which are concentrated in the upper level of the soil. Its shallow rooting system requires a regular water supply; a water deficit can affect fructification as well as cane growth and yield for the following season. Despite the demonstrated drought stress impact on the raspberry, there is little information about the phenological and physiological responses to drought stress. The main goal of this study was to evaluate the effects of drought stress on the phenological phases, physiological parameters and yield of two raspberry cultivars: Heritage (remontant type) and Meeker (non-remontant type). All plants were grown in pots under greenhouse conditions, and the following watering treatments were applied: (T1) well-watered, 100% irrigation and (T2) a controlled drought-stress cycle. The volumetric soil water content (θ), phenological phases, leaf net photosynthetic rate (A), transpiration rate (T), and stomatal conductance (gs) were registered periodically. The free proline and total soluble sugars were also determined. Based on the phenological study, Heritage under drought-stress (T2) showed earlier flowering and a shorter fruit production period in relation to well-watered plants (T1). In Meeker, T2 extended the cane and summer lateral elongation, showing earlier senescence. Leaf gas exchange decreased with drought stress, A declined after 28-day period under drought stress, from 9.2μmolCO2m612s611 to 3.0μmolCO2m612s611 in Heritage, and from 12.2μmolCO2m612s611 to 3.0μmolCO2m612s611 in Meeker. In both cultivars, the free proline and total soluble sugars increased with drought stress. The fruit production was also affected in the next season under T2 condition, decreasing in 34 and 38% in relation to well-watered plants.
Biodiversity hotspots for conservation priorities
DOI:10.1038/35002501
URL
PMID:10706275
[本文引用: 1]
and we have often had to depend on best-judgement estimates by over 100 scientists with abundant experience in the countries concerned. In a few instances, we have had to accept a simple summation of country-by-country totals, which surely under- estimates regional totals. To this extent, many of the endemism estimates are distinctly conservative.A second determinant of hotspot status, applied only after an area has met the `plants' criterion, is the degree of threat through habitat loss. To qualify, a hotspot should have lost 70% or more of its primary vegetation, this being the form of habitat that usually contains the most species, especially endemics. Eleven hotspots have already lost at least 90% and three have lost 95%. The 70% cutoff is justi(R)ed on the grounds that most large-scale concentrations of endemic plant species occur within the 25 hotspots as delineated. Other concentrations of plant endemics with perhaps another 15% of the Earth's plant species occur in three regions designated as `major tropical forest wilderness areas', each retaining 75% of its primary vegetation (see below). There are few other areas with comparable concentrations. Moreover, were the 70% cutoff to be replaced with 60%, this would admit hardly any other hotspots, whereas a 90% cutoff would exclude 11 of the hotspots.Finally, the analysis is limited to the terrestrial realm (Conserva- tion International is preparing an analysis of marine species and conservation priorities).The area-by-area (R)ndings are presented in Tables 1卤6 and Fig. 1. For further information regarding the sources of our statistics, see the list of references and experts in Supplementary Information.There is variability in the precision and accuracy of data. This is to be expected given the range of areas and the degree of documenta- tion available. In many instances, the statistical information is considered to be accurate to within 5%. In most others, it is suf(R)ciently accurate to rank as sound support for working esti- mates. For example, the Tropical Andes is believed to contain at least 20,000 known plant endemics, this being a rounded (R)gure (many more species, probably thousands, remain to be discovered there). Another 14 such totals are rounded. The Cape Floristic Province, by contrast, is considered to contain exactly 5,682 known plant endemics; the same precision applies to another nine hotspots. Similar considerations apply to vertebrate data and to estimates of remaining primary vegetation.
Postglacial migration supplements climate in determining plant species ranges in Europe
DOI:10.1098/rspb.2010.2769
URL
PMID:3203492
[本文引用: 1]
The influence of dispersal limitation on species ranges remains controversial. Considering the dramatic impacts of the last glaciation in Europe, species might not have tracked climate changes through time and, as a consequence, their present-day ranges might be in disequilibrium with current climate. For 1016 European plant species, we assessed the relative importance of current climate and limited postglacial migration in determining species ranges using regression modelling and explanatory variables representing climate, and a novel species-specific hind-casting-based measure of accessibility to postglacial colonization. Climate was important for all species, while postglacial colonization also constrained the ranges of more than 50 per cent of the species. On average, climate explained five times more variation in species ranges than accessibility, but accessibility was the strongest determinant for one-sixth of the species. Accessibility was particularly important for species with limited long-distance dispersal ability, with southern glacial ranges, seed plants compared with ferns, and small-range species in southern Europe. In addition, accessibility explained one-third of the variation in species' disequilibrium with climate as measured by the realized/potential range size ratio computed with niche modelling. In conclusion, we show that although climate is the dominant broad-scale determinant of European plant species ranges, constrained dispersal plays an important supplementary role.
Climatic gradients in woody plant species richness: Towards an explanation based on an analysis of southern Africa’s woody flora
DOI:10.2307/2845670
URL
[本文引用: 1]
The distribution of southern Africa's woody flora (N=1372 species) describes a best-to-east pattern of increasing species richness, being lowest in arid to semiarid areas and highest in mesic to humid areas. Climate accounts for 77.8% (R2; P<0.0001) of the variation: species richness is greatest where the amount and duration of energy is optimized (not too much, not too little) and moisture maximized, and decreases as the amount or duration of energy moves above or below optimal conditions, or as moisture decreases. Given the perpetual and necessary relationship between climate and plant photosynthesis, climate provides a first-order, albeit partial, explanation for the persistence of pattern (especially latitudinal and elevational gradients) in the distribution of woody plant species richness over space and time.
Molecular phylogenetic systematics and biogeography of tribe Neillieae(Rosaceae) using DNA sequences of cpDNA, rDNA, and LEAFY.
DOI:10.3732/ajb.92.1.179
URL
PMID:21652396
[本文引用: 2]
A phylogeny of the tribe Neillieae (Rosaceae), which comprises Neillia, Stephanandra, and Physocarpus, was reconstructed based on nucleotide sequences of several regions of cpDNA, the ITS and ETS regions of rDNA, and the second intron of LEAFY, to elucidate relationships among genera and species in Neillieae and to assess the historical biogeography of the tribe. Phylogenetic analyses indicated that Physocarpus and Neillia-Stephanandra were strongly supported as monophyletic and suggested that Stephanandra may have originated by hybridization between two lineages of Neillia. Dispersal-vicariance analyses suggested that the most recent common ancestor of Neillieae may have occupied eastern Asia and western North America and that Physocarpus and Neillia-Stephanandra may have been split by an intercontinental vicariance event in the early Miocene. The biogeographic analyses also suggested that species of Neillia and Stephanandra diversified in eastern Asia, whereas in Physocarpus one dispersal event from western North America to eastern Asia occurred. Two divergent types of LEAFY sequences were found in the eastern North American species, P. opulifolius, but only one type was present in each plant. The two types of sequences may represent homeologous genes that originated by hybridization between P. capitatus and P. monogynus, both western North American species.
Global hotspots of species richness are not congruent with endemism or threat
DOI:10.1038/nature03850
URL
PMID:16107848
[本文引用: 1]
Abstract Biodiversity hotspots have a prominent role in conservation biology, but it remains controversial to what extent different types of hotspot are congruent. Previous studies were unable to provide a general answer because they used a single biodiversity index, were geographically restricted, compared areas of unequal size or did not quantitatively compare hotspot types. Here we use a new global database on the breeding distribution of all known extant bird species to test for congruence across three types of hotspot. We demonstrate that hotspots of species richness, threat and endemism do not show the same geographical distribution. Only 2.5% of hotspot areas are common to all three aspects of diversity, with over 80% of hotspots being idiosyncratic. More generally, there is a surprisingly low overall congruence of biodiversity indices, with any one index explaining less than 24% of variation in the other indices. These results suggest that, even within a single taxonomic class, different mechanisms are responsible for the origin and maintenance of different aspects of diversity. Consequently, the different types of hotspots also vary greatly in their utility as conservation tools.
Scale dependence and the species-area relationship
DOI:10.1086/285704
URL
[本文引用: 1]
The complex relationship between species richness and area can be simplified by decomposing spatial scale into its components: grain, extent, and number of samples. We designed a 256 x 256-m study grid in the Oosting Natural Area in the Duke Forest, Orange County, North Carolina, such that the effects of these components can be disentangled. We found that grain, extent, and the number of samples all influenced the species-area relationship, although the effects of grain were dominant. We also found that species richness patterns were neither self-similar nor hierarchical. The degree to which diversity occurs in "hot spots" increases as a function of both grain and extent, but diversity hot spots tend to persist across a wide range of grains.
Prioritizing areas for conservation of Rosaceae in Iran based on the geographic distribution analysis
50 km to each observation, then the aggregate of all circular areas was calculated for each species. All of them were done by using of Map Info Software. When the circular neighborhood option is chosen for analysis/point-to-grid/main, calculations are made based not on the observations within each grid cells, but rather on the observation found within a circle with its center in the middle of each grid cells and on the specified radius (Bonham-Carter 1994, Cressie 1991, Hatami & Khosravi 2013).The CA50 statistic was plotted against the number of observations to explore differences in abundance between species. A species with a relatively high number of observations per CA50 would be abundant within its area of distribution, whereas a low number would indicate that a species was more scattered over the range in which it occurs (Hijmans & Spooner 2001, Mousavi & Khosravi 2010).To investigate more aspects of species and endemics distribution area, the smallest area (the number of grid cells) determined that is needed to
Phylogeny and classification of Rosaceae
Threatened species list of China’s higher plants
DOI:10.17520/biods.2017144
URL
[本文引用: 1]
@@
中国高等植物受威胁物种名录
DOI:10.17520/biods.2017144
URL
[本文引用: 1]
@@
A comprehensive framework for global patterns in biodiversity
DOI:10.1046/j.1461-0248.2003.00554.x URL [本文引用: 1]
Current applications, challenges, and perspectives of marker-assisted seedling selection in Rosaceae tree fruit breeding
DOI:10.1007/s11295-015-0834-5
URL
[本文引用: 1]
Most rosaceous tree fruit have long juvenility and large plant sizes, which makes traditional seedling selection (TSS), relying on phenotypic evaluation alone, relatively time-consuming and expensive.
Tibetan land use and change near Khawa Karpo, eastern Himalayas
DOI:10.1663/0013-0001(2005)059[0312:TLUACN]2.0.CO;2
URL
[本文引用: 1]
Tibetan land use near Khawa Karpo, Northwest Yunnan, China, incorporates indigenous forest management, gathering, pastoralism, and agriculture. With field-based GIS, repeat photography, and Participatory Rural Appraisal we quantitatively compare land use between higher and lower villages, and between villages with and without roads. Households in higher elevation (>3,000 meters) villages cultivate more farmland (z = -5.387, P 0.001), a greater diversity of major crops (z = -5.760, P < 0.001), a higher percentage of traditional crops, and fewer cash crops (z = -2.430, P = 0.015) than those in lower elevation villages (<2,500 meters). Villages with roads grow significantly more cash crops (z = -6.794, P 0.001). Both lower villages and villages with roads travel farther to access common property resources. Historical analyses indicate agricultural intensification in valleys, an increase in houses, new crop introduction, hillside aforestation, cessation of hunting, glacial retreat, and timberline advance within the past century. We suggest that Tibetan land use reveals trade-offs between high, remote villages and lower villages near roads. Higher villages offer abundant land and access to natural resources but short growing seasons and little market access; in contrast, lower villages have road and market access, an extended growing season, and modern technology, but limited access to land and many other natural resources.
The influence of Late Quaternary climate-change velocity on species endemism
DOI:10.1126/science.1210173 URL [本文引用: 2]
Importance of regional climates for plant species distribution patterns in moist Afromontane forest
DOI:10.1111/j.1654-1103.2012.01477.x
URL
[本文引用: 1]
QuestionsHow are plant species distribution patterns in tropical montane forest linked to altitude, regional climate and geographic location? Which climatic variables are most important in explaining variations in floristic diversity? What are potential effects of climate change on species diversity?LocationEthiopia.MethodsVegetation surveys were conducted in 180 study plots distributed across five moist montane forest areas in southwest and southeast Ethiopia (1000 2300 m a.s.l.). Temperature and precipitation data, as well as bioclimatic variables, were derived for each study plot from the WorldClim global climate data set. Species and climate data were analysed with direct and indirect ordination techniques and multivariate regression trees (MRT).ResultsEach of the sampled forest areas showed a distinct species composition and was governed by a particular regional temperature and precipitation pattern related to the topographic variability of the Ethiopian highlands. Hence, a general altitudinal cut-off level for different forest types applicable in all five moist montane forest areas could not be identified. The most important bioclimatic variable in determining species distribution patterns was the amount of precipitation after the dry season (i.e. precipitation in the warmest quarter), followed by minimum temperature in the coldest month. At a lower hierarchical level, temperature and precipitation seasonality were also identified as significant discriminating variables. Generally, in areas with high precipitation during the warmest quarter ( 288 mm) and low minimum temperature in the coldest month (<10.9 C), the number of Afromontane species was highest and that of Guineo ongolian species lowest.ConclusionsThe altitudinal effect on species diversity in the Ethiopian moist montane forests is strongly modified by regional differences in precipitation and temperature regime. The predicted increase in temperature for the Ethiopian highlands due to climate change is likely to affect the distribution of the endemic Afromontane species. Furthermore, the study highlights the need for systematic on-the-ground measurements of climate variables in tropical montane areas in order to understand the current climate regime and as a basis for modelling future changes.
Influence of soil moisture on photosynthesis, respiration and transpiration of apple leaves
DOI:10.1104/pp.16.3.565
URL
PMID:16653720
[本文引用: 2]
Abstract A deficiene ofwaterundernatural anidevelu cultural conditions is probably responsible forthepoorgrowthanddeathofmoreplants than diseases, insects, oranyother cause.Although itispossible toseewiththe niaked eyehowandwhena plantresponds tolowwatersupply, itisof interest toknowtheextent towhichadrying soil affects metabolic processes before andduring thetimewilting isvisible. Itisofinterest alsotoknow whether awilted plant recovers immediately inleafactivity whenwaterhas beensupplied tothesoil, orifnormalactivity isdelayed orneveragaini at- taiined. Theresults presented inthispapertracethedailyeffect ofa gradually drying soil onapparent photosynthesis, respiration, andtranspira- tionofsmallappletrees asthesoil inwhichtheyweregrowinggradually dried toapproximately thewilting pereentage, after whichitwaswatered tofield capacity. Methods ENVIRONMENT-CONTROL
Identification and conservation of important plant areas (IPAs) for the distribution of medicinal, aromatic and economic plants in the Hindukush-Himalaya mountain range
Phylogeny and classification of Prunus sensu lato(Rosaceae).
DOI:10.1111/jipb.12095
URL
PMID:23945216
[本文引用: 1]
The classification of the economically important genus Prunus L. sensu lato (s.l.) is controversial due to the high levels of convergent or the parallel evolution of morphological characters. In the present study, phylogenetic analyses of fifteen main segregates of Prunus s.l. represented by eighty-four species were conducted with maximum parsimony and Bayesian approaches using twelve chloroplast regions (atpB-rbcL, matK, ndhF, psbA-trnH, rbcL, rpL16, rpoC1, rps16, trnS-G, trnL, trnL-F and ycf1) and three nuclear genes (ITS, s6pdh and SbeI) to explore their infrageneric relationships. The results of these analyses were used to develop a new, phylogeny-based classification of Prunus s.l. Our phylogenetic reconstructions resolved three main clades of Prunus s.l. with strong supports. We adopted a broad-sensed genus, Prunus, and recognised three subgenera corresponding to the three main clades: subgenus Padus, subgenus Cerasus and subgenus Prunus. Seven sections of subgenus Prunus were recognised. The dwarf cherries, which were previously assigned to subgenus Cerasus, were included in this subgenus Prunus. One new section name, Prunus L. subgenus Prunus section Persicae (T. T. Y & L. T. Lu) S. L. Zhou and one new species name, Prunus tianshanica (Pojarkov) S. Shi, were proposed.
The drivers of high Rhododendron diversity in southwest China: Does seasonality matter?
DOI:10.1111/jbi.13136
URL
[本文引用: 8]
Abstract Aim Is high diversity in tropical and subtropical mountains due to topographical complexity alone or a combination of topography and temperature seasonality? Here, we aim to assess the contribution of these two factors on Rhododendron diversity in China. Specifically, we evaluate how low temperature seasonality in subtropical China jointly with heterogeneous environment accounts for increased species diversity across montane landscapes relative to those of the more seasonal temperate zone in north China. Location China. Methods We compiled distributional data for all Rhododendron species in China and then estimated the species richness patterns of rare versus common species, and of shrubs versus trees at spatial resolutions of 50 50km. Bivariate regressions were performed to evaluate the effects of environmental variables on species richness followed by stepwise regression to select the best set of predictors. Results The variables of habitat heterogeneity and climate seasonality were consistently the strongest predictors of species richness for all species groups, while the contribution of water and energy variables was proportionately much lower. Winter coldness had very low predictive power, which indicated that unlike other woody plants, the northward dispersal of Rhododendron is not limited by cold winter temperature. Main conclusions High Rhododendron diversity in south-west China appears to be influenced jointly by the climatic gradients induced by topographical complexity and temperature seasonality as suggested by Janzen's hypothesis. The increased topographical complexity in combination with low temperature seasonality in south-west China might have promoted species accumulation by offering more niche space, preventing extinction and providing increased opportunities for allopatric speciation. While our findings strongly indicate the effect of habitat heterogeneity on species diversity, they also suggest the role of seasonal uniformity of temperature for increased diversity towards the tropics. The effect of seasonality may, however, be more pronounced in plants because of their limited ability to use behaviour to avoid environmental influences.
Environmental heterogeneity as a universal driver of species richness across taxa, biomes and spatial scales
DOI:10.1111/ele.12277
URL
PMID:24751205
[本文引用: 2]
AbstractEnvironmental heterogeneity is regarded as one of the most important factors governing species richness gradients. An increase in available niche space, provision of refuges and opportunities for isolation and divergent adaptation are thought to enhance species coexistence, persistence and diversification. However, the extent and generality of positive heterogeneity–richness relationships are still debated. Apart from widespread evidence supporting positive relationships, negative and hump-shaped relationships have also been reported. In a meta-analysis of 1148 data points from 192 studies worldwide, we examine the strength and direction of the relationship between spatial environmental heterogeneity and species richness of terrestrial plants and animals. We find that separate effects of heterogeneity in land cover, vegetation, climate, soil and topography are significantly positive, with vegetation and topographic heterogeneity showing particularly strong associations with species richness. The use of equal-area study units, spatial grain and spatial extent emerge as key factors influencing the strength of heterogeneity–richness relationships, highlighting the pervasive influence of spatial scale in heterogeneity–richness studies. We provide the first quantitative support for the generality of positive heterogeneity–richness relationships across heterogeneity components, habitat types, taxa and spatial scales from landscape to global extents, and identify specific needs for future comparative heterogeneity–richness research.
Ice age legacies in the geographical distribution of tree species richness in Europe
DOI:10.1111/j.1466-8238.2006.00280.x
[本文引用: 1]
ABSTRACT Aim68 This study uses a high-resolution simulation of the Last Glacial Maximum (LGM) climate to assess: (1) whether LGM climate still affects the geographical species richness patterns in the European tree flora and (2) the relative importance of modern and LGM climate as controls of tree species richness in Europe. Location68 The parts of Europe that were unglaciated during the LGM. Methods68 Atlas data on the distributions of 55 tree species were linked with data on modern and LGM climate and climatic heterogeneity in a geographical information system with a 60-km grid. Four measures of species richness were computed: total richness, and richness of the 18 most restricted species, 19 species of medium incidence (intermediate species) and 18 most widespread species. We used ordinary least-squares regression and spatial autoregressive modelling to test and estimate the richness–climate relationships. Results68 LGM climate constituted the best single set of explanatory variables for richness of restricted species, while modern climate and climatic heterogeneity was best for total and widespread species richness and richness of intermediate species, respectively. The autoregressive model with all climatic predictors was supported for all richness measures using an information-theoretic approach, albeit only weakly so for total species richness. Among the strongest relationships were increases in total and intermediate richness with climatic heterogeneity and in restricted richness with LGM growing-degree-days. Partial regression showed that climatic heterogeneity accounted for the largest unique variation fraction for intermediate richness, while LGM climate was particularly important for restricted richness. Main conclusions68 LGM climate appears to still affect geographical patterns of tree species richness in Europe, albeit the relative importance of modern and LGM climate depends on range size. Notably, LGM climate is a strong richness control for species with a restricted range, which appear to still be associated with their glacial refugia.
Could the tree diversity pattern in Europe be generated by postglacial dispersal limitation?
DOI:10.1111/j.1461-0248.2007.01038.x
URL
PMID:17498144
[本文引用: 1]
The relative importance of contemporary climate and history as controls of geographical diversity patterns is intensely debated. A key example is the controversy over the extent to which temperate tree distributions and diversity patterns reflect postglacial dispersal limitation. Here, we focus on Central and Northern Europe, and show that recent estimates of tree migration rates < 100 m year 1 imply that many species have probably not reached equilibrium with climate in this region. We then demonstrate that geographical accessibility from glacial refuges explains 78% of the geographical variation in the region's tree diversity and is a much stronger diversity predictor than climate. Finally, we show that realistic estimates of migration rates can be derived from the observed tree diversity pattern by assuming it to be purely dispersal driven. In conclusion, the tree diversity pattern in Central and Northern Europe could, to a large extent, be a result of postglacial dispersal limitation.
Response of spatial vegetation distribution in China to climate changes since the last glacial maximum (LGM)
DOI:10.1371/journal.pone.0175742
URL
PMID:5398547
[本文引用: 1]
Analyzing how climate change affects vegetation distribution is one of the central issues of global change ecology as this has important implications for the carbon budget of terrestrial vegetation. Mapping vegetation distribution under historical climate scenarios is essential for understanding the response of vegetation distribution to future climatic changes. The reconstructions of palaeovegetation based on pollen data provide a useful method to understand the relationship between climate and vegetation distribution. However, this method is limited in time and space. Here, using species distribution model (SDM) approaches, we explored the climatic determinants of contemporary vegetation distribution and reconstructed the distribution of Chinese vegetation during the Last Glacial Maximum (LGM, 18,00014C yr BP) and Middle-Holocene (MH, 600014C yr BP). The dynamics of vegetation distribution since the LGM reconstructed by SDMs were largely consistent with those based on pollen data, suggesting that the SDM approach is a useful tool for studying historical vegetation dynamics and its response to climate change across time and space. Comparison between the modeled contemporary potential natural vegetation distribution and the observed contemporary distribution suggests that temperate deciduous forests, subtropical evergreen broadleaf forests, temperate deciduous shrublands and temperate steppe have low range fillings and are strongly influenced by human activities. In general, the Tibetan Plateau, North and Northeast China, and the areas near the 30 N in Central and Southeast China appeared to have experienced the highest turnover in vegetation due to climate change from the LGM to the present.
Patterns, determinants and models of woody plant diversity in China
DOI:10.1098/rspb.2010.1897
URL
PMID:21147804
[本文引用: 5]
What determines large-scale patterns of species richness remains one of the most controversial issues in ecology. Using the distribution maps of 11 405 woody species in China, we compared the effects of habitat heterogeneity, human activities and different aspects of climate, particularly environmental energy, waterenergy dynamics and winter frost, and explored how biogeographic affinities (tropical versus temperate) influence richness-climate relationships. We found that the species richness of trees, shrubs, lianas and all woody plants strongly correlated with each other, and more strongly correlated with the species richness of tropical affinity than with that of temperate affinity. The mean temperature of the coldest quarter was the strongest predictor of species richness, and its explanatory power for species richness was significantly higher for tropical affinity than for temperate affinity. These results suggest that the patterns of woody species richness mainly result from the increasing intensity of frost filtering for tropical species from the equator/lowlands towards the poles/highlands, and hence support the freezing-tolerance hypothesis. A model based on these results was developed, which explained 76-85% of species richness variation in China, and reasonably predicted the species richness of woody plants in North America and the Northern Hemisphere.
Relative role of contemporary environment versus history in shaping diversity patterns of China’s woody plants
DOI:10.1111/j.1600-0587.2011.06781.x
URL
[本文引用: 6]
What determines large-scale patterns of species diversity is a central and controversial topic in biogeography and ecology. In this study, we compared the effects of contemporary environment and historical contingencies on species richness patterns of woody plants in China, using fine-resolution geographic databases of the distributions of 11 405 woody species and climate, topography, and vegetation information. Residuals of species richness-environment generalized linear models were significantly different from 0 in the majority of seven biogeographical regions, and also differed significantly between these regions, indicating significant deviation from the predicted species richness based on contemporary environment. Additionally, species richness of a given biogeographical region deviated substantially from the predictions of species richness-environment models developed for the remaining regions combined. This suggests different richness-environment relationships among regions. These results indicate important historical signals in the species richness patterns of woody plants across China. The signals are especially pronounced in the eastern Himalayas, the Mongolian Plateau, and the Tibetan Plateau, perhaps reflecting their special geological features and history. Nevertheless, partial regression indicated that historical effects were less important relative to contemporary environment. In conclusion, contemporary environment (notably climate) determines the general trend in woody-plant species richness across China, while historical contingencies generate regional deviations from this trend. Our findings imply that both species diversity and regional evolutionary and ecological histories should be taken into account for future nature conservation.
Geographical patterns in the beta diversity of China’s woody plants: The influence of space, environment and range size
DOI:10.1111/j.1600-0587.2012.06988.x
URL
[本文引用: 1]
Beta diversity (i.e. species turnover rate across space) is fundamental for understanding mechanisms controlling large-scale species richness patterns. However, the influences on beta diversity are still a matter of debate. In particular, the relative role of environmental and spatial processes (e.g. environmental niche versus dispersal limitation of species) remains elusive, and the influence of species range size has been poorly tested. Here, using distribution maps of 11 405 woody species in China (ca 9.6 106 km2), we investigated 1) the geographical and directional patterns of beta diversity for all woody species and species with different range sizes, and 2) compared the effects of environmental and spatial processes on these patterns. Beta diversity was calculated as the decay of similarity in species composition with increasing distance. Variables representing environmental energy, water availability, climatic seasonality, habitat heterogeneity and human activities were used to evaluate the effects of environmental processes, while spatial distance was used to assess the influence of spatial processes. The results indicated significant directional patterns of beta diversity: the similarity decay along the latitudinal gradient was 1.6 2.3 times faster than that along the longitudinal gradient. Beta diversity also increased with the decrease of species range size. As compared with spatial processes, environmental processes had stronger effects on longitudinal beta diversity and on the beta diversity of widely-ranged species. This was opposite to the larger influence of spatial processes on latitudinal beta diversity and the beta diversity of narrowly-ranged species. These results suggest that the distributions of narrowly-ranged woody species in China may have not reached equilibrium with their environmental niches due to dispersal limitation induced by China's topography and/or their low dispersal ability. The projected rapid climatic changes will likely endanger such species. Species dispersal processes should be taken into account in future conservation strategies in China.
The species-energy hypothesis as a mechanism for species richness patterns
DOI:10.3724/SP.J.1003.2009.09161
URL
[本文引用: 1]
物种多样性地理分布格局及其成因是生物地理学和宏观生态学研究的核心问题之一。为了解释物种多样性的分布格局,人们提出了多种假说,其中讨论最多的是能量假说。该假说认为,物种多样性的变化受能量控制。根据能量的不同形式及其对物种多样性的影响机制,能量假说包括以下几种形式:生产力假说(productivity hypothesis)、水分—能量动态假说(water-energy dynamic hypothesis)、环境能量假说(ambientenergy hypothesis)、寒冷忍耐假说(freezing tolerance hypothesis)以及生态学代谢假说(metabolic theory of ecology,MTE)。本文系统介绍了每种能量假说的含义、所使用的能量形式及表征变量,以及对物种多样性的影响机制,并对不同形式的能量假说进行了比较,在此基础上,分析了每种能量假说的优点和缺点以及各自面临的问题。
物种多样性地理格局的能量假说
DOI:10.3724/SP.J.1003.2009.09161
URL
[本文引用: 1]
物种多样性地理分布格局及其成因是生物地理学和宏观生态学研究的核心问题之一。为了解释物种多样性的分布格局,人们提出了多种假说,其中讨论最多的是能量假说。该假说认为,物种多样性的变化受能量控制。根据能量的不同形式及其对物种多样性的影响机制,能量假说包括以下几种形式:生产力假说(productivity hypothesis)、水分—能量动态假说(water-energy dynamic hypothesis)、环境能量假说(ambientenergy hypothesis)、寒冷忍耐假说(freezing tolerance hypothesis)以及生态学代谢假说(metabolic theory of ecology,MTE)。本文系统介绍了每种能量假说的含义、所使用的能量形式及表征变量,以及对物种多样性的影响机制,并对不同形式的能量假说进行了比较,在此基础上,分析了每种能量假说的优点和缺点以及各自面临的问题。
Apple futures: Based on serving for “Three Rural” issues and to help anti-poverty
苹果期货: 立足服务“三农”助力脱贫攻坚
MIROC-ESM 2010: Model description and basic results of CMIP5-20c3m experiments
DOI:10.5194/gmd-4-845-2011
URL
[本文引用: 1]
An earth system model (MIROC-ESM 2010) is fully described in terms of each model component and their interactions. Results for the CMIP5 (Coupled Model Intercomparison Project phase 5) historical simulation are presented to demonstrate the model's performance from several perspectives: atmosphere, ocean, sea-ice, land-surface, ocean and terrestrial biogeochemistry, and atmospheric chemistry and aerosols. An atmospheric chemistry coupled version of MIROC-ESM (MIROC-ESM-CHEM 2010) reasonably reproduces transient variations in surface air temperatures for the period 1850???2005, as well as the present-day climatology for the zonal-mean zonal winds and temperatures from the surface to the mesosphere. The historical evolution and global distribution of column ozone and the amount of tropospheric aerosols are reasonably simulated in the model based on the Representative Concentration Pathways' (RCP) historical emissions of these precursors. The simulated distributions of the terrestrial and marine biogeochemistry parameters agree with recent observations, which is encouraging to use the model for future global change projections.
Changes in the risk of fine-root mortality with age: A case study in peach,Prunus persica(Rosaceae).
Inter-vessel pitting and cavitation in woody Rosaceae and other vesselled plants: A basis for a safety versus efficiency trade-off in xylem transport
DOI:10.1111/j.1365-3040.2005.01330.x
URL
[本文引用: 1]
The hypothesis that greater safety from cavitation by air-seeding through inter-vessel pits comes at the cost of less porous pit membranes with greater flow resistance was tested . Sixteen vessel-bearing species were compared: 11 from the Rosaceae, four from other angiosperm families, and one fern. Unexpectedly, there was no relationship between pit resistance (and hence the prevailing membrane porosity) and cavitation pressure. There was, however, an inverse relationship between pit area per vessel and vulnerability to cavitation ( r 2 = 0.75). This suggests that cavitation is caused by the rare largest membrane pore per vessel, the average size of which increases with total pit area per vessel. If safety from cavitation constrains pit membrane surface area, it also limits vessel surface area and the minimum vessel resistivity. This trade-off was consistent with an approximately three-fold increase in vessel resistivity with cavitation pressure dropping from 610.8 to 616.6 MPa. The trade-off was compensated for by a reduction in the percentage of vessel wall pitted: from 10–16% in vulnerable species to 2–4% in resistant species. Across species, end-wall pitting accounted for 53 ± 3% of the total xylem resistivity. This corresponded to vessels achieving on average 94 ± 2% of their maximum possible conductivity if vessel surface area is constrained.
Geographical gradients of species richness: A test of the water-energy conjecture of Hawkins et al. ( 2003) using European data for five taxa
DOI:10.1111/j.1466-8238.2006.00268.x
URL
[本文引用: 1]
Aims We present an analysis of grid-based species-richness data for European plants, mammals, birds, amphibians and reptiles, designed to test the proposition of Hawkins et al. (2003a ) that the single best factor describing richness variation switches from the water regime to the energy regime in the mid-latitudes and that the 'breakpoint' is related to the physiological character of the taxa. We go on to develop subregional models showing the extent to which regional model fits vary as a function of the extent of the study system, and compare the relative performance of 'water', 'energy' and 'water–energy' models of richness for southern, northern and pan-European models. Location Western Europe. Methods We use atlas data comprising species range data for 187 species of mammals, 445 species of breeding birds, 58 amphibians, 91 reptiles and 2362 plant species, inserted into a c. 50 × 50 km grid cell system. We used 11 modelled climate variables, averaged for the period 1961–90. Statistical analyses were carried out using generalized additive models (GAMs), with splines simplified to a maximum of four degrees of freedom, and we tested for spatial autocorrelation using Moran's I values obtained at 10 different distance intervals. We selected favoured models on the grounds of deviance explained combined with a simple parsimony criterion, such that we selected either: (1) the best two-variable energy, water or water–energy model, or (2) a four-variable water–energy model, where the latter improved on the best two-variable model by a minimum of 5% deviance explained. Results Threshold energy values, at which richness shows a transition from an increasing to a decreasing function of annual solar radiation, were identified for all taxa apart from reptiles. We found conditional support for the switch from dominance of water variables (southern models) to energy variables (northern models). Our favoured models switched between 'water' and 'energy' for mammals, and between 'energy' and 'water–energy' for birds, depending on whether we used data of pan-European extent, southern or northern subsets. Deviance explained in our favoured models varied from 15% (birds, southern Europe) to 72% (amphibians, northern Europe), i.e. ranging from very poor to good fits with the data. Comparison with previous work indicates that our models are generally consistent with (if sometimes weaker than) previous findings. Main conclusions Our models are incomplete representations of factors influencing macro-scale richness patterns across Europe, taking no explicit account of, for example, topographic variation, human influences or long-term climatic variation. However, with the exception of birds, for which only the northern model attains over one-third deviance explained, the models show that climate can account for meaningful proportions of the deviance. We find general support for considering water and energy regimes together in modelling species richness, and for the proposition that water is more limiting in southern Europe and energy in the north. Our analyses demonstrate the sensitivity of model outcomes to the geographical location and extent of the study system, illustrating that simple curve-fitting exercises like these, particularly if based on regions with the complex history and geography characteristic of Europe, are unlikely to provide the basis for global, predictive models. However, such exercises may be of value in detecting which aspects of water and energy regimes may be of most importance in refining independently generated global models for regional application.
Historical biogeography, ecology and species richness
DOI:10.1016/j.tree.2004.09.011
URL
PMID:16701326
[本文引用: 1]
Ecology and historical (phylogeny-based) biogeography have much to offer one another, but exchanges between these fields have been limited. Historical biogeography has become narrowly focused on using phylogenies to discover the history of geological connections among regions. Conversely, ecologists often ignore historical biogeography, even when its input can be crucial. Both historical biogeographers and ecologists have more-or-less abandoned attempts to understand the processes that determine the large-scale distribution of clades. Here, we describe the chasm that has developed between ecology and historical biogeography, some of the important questions that have fallen into it and how it might be bridged. To illustrate the benefits of an integrated approach, we expand on a model that can help explain the latitudinal gradient of species richness.
Flora of China
Well-resolved Rosaceae nuclear phylogeny facilitates feological time and genome duplication analyses and ancestral fruit character reconstruction
Uplift-driven diversification in the Hengduan Mountains, a temperate biodiversity hotspot
DOI:10.1073/pnas.1616063114
URL
PMID:28373546
[本文引用: 1]
Abstract A common hypothesis for the rich biodiversity found in mountains is uplift-driven diversification-that orogeny creates conditions favoring rapid in situ speciation of resident lineages. We tested this hypothesis in the context of the Qinghai-Tibetan Plateau (QTP) and adjoining mountain ranges, using the phylogenetic and geographic histories of multiple groups of plants to infer the tempo (rate) and mode (colonization versus in situ diversification) of biotic assembly through time and across regions. We focused on the Hengduan Mountains region, which in comparison with the QTP and Himalayas was uplifted more recently (since the late Miocene) and is smaller in area and richer in species. Time-calibrated phylogenetic analyses show that about 8 million y ago the rate of in situ diversification increased in the Hengduan Mountains, significantly exceeding that in the geologically older QTP and Himalayas. By contrast, in the QTP and Himalayas during the same period the rate of in situ diversification remained relatively flat, with colonization dominating lineage accumulation. The Hengduan Mountains flora was thus assembled disproportionately by recent in situ diversification, temporally congruent with independent estimates of orogeny. This study shows quantitative evidence for uplift-driven diversification in this region, and more generally, tests the hypothesis by comparing the rate and mode of biotic assembly jointly across time and space. It thus complements the more prevalent method of examining endemic radiations individually and could be used as a template to augment such studies in other biodiversity hotspots.
Evolutionary history influences the effects of water-energy dynamics on oak diversity in Asia
DOI:10.1111/jbi.12149
URL
[本文引用: 4]
AimWater–energy dynamics are often correlated with geographical patterns of terrestrial plant richness. However, the relative importance of water and energy on species richness is still being debated. Some studies suggest a transition in the relative importance of water and energy along a latitudinal gradient, i.e. that water is the most important factor at low latitudes, whereas energy is the leading factor at high latitudes. The generality of this transition is yet to be established and is the focus of the current study. In particular, we examine whether differences in the evolutionary histories of two subgenera of Asian oaks influence the derived models of water–energy dynamics.LocationAsia (70–140° E; 10–60° N).MethodsWe performed geographically weighted regressions to quantify geographical variation in the relative importance of water and energy on the species richness of Asian oaks (Quercus L.). We also evaluated how evolutionary history influences the relative importance of water and energy in determining species richness, by comparing patterns in the two oak subgenera: Quercus subg. Quercus and Quercus subg. Cyclobalanopsis. In particular, we assessed how the ancestral climatic niche of these two subgenera (i.e. subgenus Quercus of temperate origin versus subgenus Cyclobalanopsis of tropical origin) relates to the relative importance of water and energy on contemporary diversity patterns.ResultsWe found no geographical transition line in the relative importance of water and energy along the latitudinal gradient studied. Instead, we found that the importance of energy relative to water on the species richness of subgenus Quercus increased from mid-latitudes (warm temperate regions) towards both tropical and boreal regions: this pattern might reflect that this subgenus originated in the temperate region. In contrast, the importance of both water and energy on the species richness of the tropical subgenus Cyclobalanopsis increased from tropical to boreal regions, probably due to a lack of adaptation to winter coldness.Main conclusionsOur results suggest that differences in the evolutionary history – specifically the ancestral climatic niche – of the two subgenera of oaks influence the effects of water–energy dynamics on species richness along a latitudinal gradient through niche conservatism.
Geographical variation in the importance of water and energy for oak diversity
DOI:10.1111/jbi.12620
URL
[本文引用: 1]
Abstract AimThe water–energy dynamics hypothesis posits that species diversity is correlated with water availability and temperatures; diversity is lowest when water availability is reduced at low temperatures because few species can persist under such conditions. However, the relationship between water and energy availability and diversity likely varies geographically along environmental gradients. Here, we examined the drivers of such variability, using a global-scale data set on oaks. LocationGlobal. MethodTo quantify spatial variation in both species diversity–water relationships and species diversity–energy relationships, we performed geographically weighted regressions (GWR) of (1) species diversity against energy availability, measured as potential evapotranspiration and temperature, and (2) species diversity against water availability, measured by precipitation and an aridity index. We then regressed the local slopes of these GWR models against water and energy separately, and water02×02energy combined to assess whether the regional-scale relationships among oak diversity, water and energy depended on climatic conditions at larger spatial extents. ResultsWe found that the effects of low water availability and cold temperatures on oak diversity varied geographically. In particular, the effects of water and energy availability on oak diversity increased as water and energy availability decreased. Furthermore, the interaction between water and energy availability influenced regional-scale oak diversity–energy relationships but not oak diversity–water relationships. Main conclusionOur results suggest that the relationship between climate (and potentially climatic change) and oak diversity varies geographically, and that the effects of limiting water and temperature are likely to be most severe in arid environments.
Diversification of Rosaceae since the late Cretaceous based on plastid phylogenomics
DOI:10.1111/nph.14461
URL
PMID:28186635
[本文引用: 1]
Abstract Phylogenetic relationships in Rosaceae have long been problematic because of frequent hybridisation, apomixis and presumed rapid radiation, and their historical diversification has not been clarified. With 87 genera representing all subfamilies and tribes of Rosaceae and six of the other eight families of Rosales (outgroups), we analysed 130 newly sequenced plastomes together with 12 from GenBank in an attempt to reconstruct deep relationships and reveal temporal diversification of this family. Our results highlight the importance of improving sequence alignment and the use of appropriate substitution models in plastid phylogenomics. Three subfamilies and 16 tribes (as previously delimited) were strongly supported as monophyletic, and their relationships were fully resolved and strongly supported at most nodes. Rosaceae were estimated to have originated during the Late Cretaceous with evidence for rapid diversification events during several geological periods. The major lineages rapidly diversified in warm and wet habits during the Late Cretaceous, and the rapid diversification of genera from the early Oligocene onwards occurred in colder and drier environments. Plastid phylogenomics offers new and important insights into deep phylogenetic relationships and the diversification history of Rosaceae. The robust phylogenetic backbone and time estimates we provide establish a framework for future comparative studies on rosaceous evolution.
Distribution and conservation of threatened plants in China
DOI:10.1016/j.biocon.2015.10.019
URL
[本文引用: 1]
China is very rich in biodiversity, however, it is also characterized by a long history of civilization. As a result, China has a large number of threatened species. Recently the Chinese government evaluated the living status of plants, and published the China Biodiversity Red List: Higher Plants. However, little is known about how threatened plants are distributed and conserved in China. In this study, we developed a fine resolution distribution database for 3244 threatened plants, explored richness patterns and evaluated the in situ conservation status of the threatened plants by overlapping the species distribution with terrestrial national and provincial nature reserves (NNRs and PNRs) in China. We found the greatest richness of threatened plants in the southwestern region of mainland China (mainly Yunnan, southeastern Xizang and western Sichuan), northwestern Guangxi, northern Guangdong, Hainan Island and the mountainous region of Taiwan, while the lowest richness was found in Qinghai, Hebei, Shandong, Jiangsu and Chongqing Provinces. On average, NNRs covered 18.8%, and NNRs and PNRs together covered 27.5%, of threatened plant distribution areas. However, 827 threatened plants (including 627 species endemic to China) were not covered by NNRs and 397 threatened plants (including 293 endemic to China) were not covered by either NNRs or PNRs. We proposed that nature reserves specifically designed for threatened plants need to be established in South China, especially in the Yunnan, Guizhou, Guangxi, Xinjiang Hainan, and Zhejiang Provinces.
Rising process of the Qinghai-Xizang (Tibet) Plateau and its mechanism
DOI:10.1144/GSL.QJEGH.1996.029.P3.08
URL
[本文引用: 1]
The rising of the Qinghai-Xizang Plateau has character of multistage (45-38 Ma, 25-17 Ma, 13-8 Ma, 3 Ma-present), inhomogeneity and hetero-speed. The whole uprising of the plateau and local rapid rising in its periphery since Late Pliocene is a synthetical result of at least two or more mechanisms.
