Spectral and chemical analysis of tropical forests: scaling from leaf to canopy levels
1
2008
... PLSR是一种线性非参数回归模型(Verrelst et al., 2015), 是为了解决多变量共线性和数据规模大的问题而开发的一种多元回归算法(Schweiger et al., 2017).PLSR分析在建模过程中集中了主成分分析、典型相关分析和线性回归分析方法的特点, 因此在分析结果中, 除了可以提供一个更为合理的回归模型外, 还可以同时完成一些类似于主成分分析和典型相关分析的研究内容, 提供一些更丰富、深入的信息.同时, 它考虑到多指数结合法的预测准确性较差和物理模型的输入参数较为复杂, PLSR将目标变量与全波段光谱信息联系在一起, 易于实现并可以较优的精度反演多种性状, 已成功地应用于森林和草地生态系统中的性状研究中(Asner & Martin, 2008; Dahlin et al., 2013; Schweiger et al., 2017), 是目前较优的反演方法.本研究使用Unscrambler X 10.4软件, 基于46个特征变量, 利用PLSR方法, 与实测草地功能多样性和生物量建立回归模型, 预测FRic、FEve、FDiv和生物量并反演成图. ...
Airborne laser-guided imaging spectroscopy to map forest trait diversity and guide conservation
3
2017
... 传统的功能多样性的计算通常依赖大量的野外调查, 基于野外获得的生物多样性和功能性状进一步得到功能多样性, 测定手段费时费力, 同时也受时间和空间尺度的制约, 不适用于长期大规模的区域监测.遥感数据具有探测范围广、数据获取周期短、可重复等特点, 使得其在大尺度生物多样性监测和评估及制图方面具有极大的优势(Roughgarden et al., 1991), 已经成为评估生态系统功能多样性的重要工具.目前, 基于遥感的功能多样性的监测方法已经在森林生态系统中成功应用.Asner等(2017)和Schneider等(2017)分别基于聚类分析和基于像元的功能多样性遥感反演方法, 利用机载高光谱数据成功绘制了高空间分辨率的植物功能多样性空间分布图.Durán等(2019)利用成像光谱学和叶片性状相结合的方法, 基于偏最小二乘回归(PLSR)估算了亚马孙至安第斯山脉热带森林不同海拔高度的功能多样性, 同时发现通过遥感获得的单一性状或多性状计算得到的功能多样性是净初级生产力和总生产力变化的重要预测因素.但由于草地类型多样、覆盖度低、植株矮小且多数混合生长等特点, 相较于森林生态系统, 在大尺度上进行草地生态系统监测难度较高(辛晓平等, 2018). ...
... 本研究基于3种回归方法反演草地功能多样性, 结果发现利用逐步回归对FRic (R2 = 0.52, RMSE = 4.51)和FEve (R2 = 0.42, RMSE = 0.03)指数有较好的反演结果, 而利用PLSR法对FDiv指数有较好的反演结果(R2 = 0.61, RMSE = 0.04).这可能与3种回归方法选择特征变量的方式有关.逐步回归剔除了具有多重共线性且不显著的特征变量得到最终的回归模型, 而RFR仅剔除了具有多重共线性的特征变量后建立了回归模型, 变量在模型中显著与否没有得到证实.同时, RFR无法控制模型内部的运行, 只能在不同参数和随机种子之间进行尝试, 对于小样本数据或者低维数据(变量较少的数据), 可能不能产生很好的分类.本研究选取了46个特征变量, 但去掉具有多重共线性的变量后仅剩3-6个变量进行回归建模, 且实验样本数量较少, 可能会对模型估算精度有影响.PLSR能够在自变量存在严重多重共线性的条件下进行回归建模, 在最终模型中将包含原有的所有自变量且更易于辨识系统信息与噪声(Farifteh et al., 2007), 这一方法已经在森林功能多样性反演中得到广泛应用(Asner et al., 2017).因此, 在反演过程中, 要根据实际情况选择合适的模型进行估算. ...
... 另一方面, 尽管基于遥感的功能多样性监测在森林中得到了很好的应用, 如利用机载激光雷达、成像光谱学和高光谱数据获取森林冠层或叶片性状, 成功估算热带森林的功能多样性及其变化(Asner et al., 2017; Durán et al., 2019).但相比于森林生态系统, 草地物种个体小, Sentinel-2数据计算的不是各物种间的变异而是像元所代表的群落间的变异, 估算精度也会存在一定差异(Mallinis et al., 2020).因此, 当影像空间分辨率提升到草地物种个体大小(cm级), 功能多样性的估算精度可能会有所提升.进一步, 高光谱数据的应用也会提升功能性状的反演精度, 进而提升功能多样性的反演精度.无人机具有成本低、操作灵活的优点, 结合地面调查, 辅以高光谱传感器, 可实现对高空间、高光谱和高时间分辨率的草地功能多样性监测, 进一步集成地面观测, 构建多维度、多尺度、高频率的天空地一体化草地多样性监测技术体系, 促使遥感技术方法与生态学理论的有机融合, 为实现小尺度研究到大尺度监测的无缝链接提供了强有力的技术手段. ...
Ecosystem stability and compensatory effects in the Inner Mongolia grassland
1
2004
... 草地是陆地生态系统的重要组成部分, 是世界上分布最广的植被类型之一, 为人类提供了一系列重要的物质产品(肉奶、皮毛、各种草药等)和生态服务(防风固沙、大气调节、涵养水源等)(Bai et al., 2004).然而, 由于气候变化和人类活动干扰, 草地的生物多样性和生态系统功能发生了巨大变化(Hoover et al., 2014).因此, 加强对草地生物多样性及生态系统功能的监测与评估, 对草地生物多样性保护政策的制定和生态系统适应性管理至关重要. ...
Positive linear relationship between productivity and diversity: evidence from the Eurasian Steppe
1
2007
... 群落生产力表征区域环境条件下植被的生产能力, 反映了生态系统的生长特征和健康状况, 早期的很多研究认可了物种多样性对生产力的贡献, 但近年来, 一些研究认为相对于物种多样性, 功能多样性更能影响群落生产力(Díaz & Cabido, 2001; Römermann et al., 2001).因此开展对天然草地的功能多样性遥感监测及其与生产力关系的研究可以更好地探究功能多样性与生态系统功能之间的关系.然而, 功能多样性与生产力的关系较为复杂, 主要有“质量比假说” (Grime, 1998)和“多样性假说” (Tilman et al., 1997).前者认为优势物种的性状大小决定了群落的生产力, 后者认为多样性高导致功能性状差异加大, 从而提高了资源的利用效率.两种假说的相对重要性至今仍有争论, 是研究的热点.地上生物量作为群落生产力的有力度量指标, 因其观测相对便利常用来代替群落生产力(Kassen et al., 2000; Bai et al., 2007).基于单种栽培草地平台, Zhao等(2021)发现无人机高光谱反演的与光合作用相关的叶绿素、碳、氮含量等叶片生理性状, 是草地单种栽培群落地上生物量的重要预测因子, 进一步分析了功能多样性与生产力的关系.然而, 当前基于天然草地的功能多样性遥感监测及其与生产力的关系还鲜有研究. ...
Explaining grassland biomass—The contribution of climate, species and functional diversity depends on fertilization and mowing frequency
2
2011
... 本研究中遥感预测的功能多样性与地上生物量的关系与实测相一致, 证明了基于遥感反演分析两者关系的潜力.通过遥感预测功能多样性与地上群落生物量的关系发现, FRic对群落地上生物量的解释度最高(R2 = 0.40), 而FEve (R2 = 0.27)和FDiv (R2 = 0.28)与群落地上生物量关系较弱, 这与Zhao等(2021)的研究结果一致.植物的光合作用是物质生产的主要来源(Blackburn, 2007), 与光合作用有关的叶片性状叶绿素、类胡萝卜素和叶片氮含量等与群落生产力直接相关(Marron et al., 2005; da Silveira Pontes et al., 2010; Durán et al., 2019).本研究中用于计算功能多样性的叶绿素含量、比叶面积、叶片氮含量和叶片含水量4种功能性状均被大量研究证实与生产力直接或间接相关, 随着这4种功能性状在植物体内含量的增加, 物种光合作用加强, FRic增加, 生产力上升(Cadotte et al., 2011; Fyllas et al., 2017; Durán et al., 2019).Bernhardt等(2011)的研究结果也表明群落生产力有随着FRic指数增加而增加的趋势. ...
... FEve与群落地上生物量的关系最弱, 且呈负相关关系, 即群落生产力随FEve的增加而降低, 说明生产力可能主要源于对某一资源集中利用的物种的生物量.FEve被用作指示资源的利用程度, 低的均匀度表示有些生态位空间虽被占据但未充分利用, 不对生物量的增加起促进作用.本研究结果支持“质量比”假说, 即群落中起支配作用的物种的属性和相对多度对生态系统过程有决定性作用(Grime, 1998), 优势种利用了大部分资源, 而非优势种则对生物量的贡献较小, 因此地上生物量随FEve的降低而升高(马文静, 2014).FDiv与地上生物量间的相关性并不显著, 功能离散度表示群落功能性状的多度在性状空间内的离散程度, 离散度高说明植物在性状空间边缘较多分布.研究结果显示, 地上生物量随FDiv的增加表现出降低趋势, 可能是由于可利用资源较少, 使得植物功能性状的分布发生改变, 为了获取更多资源, 植物性状不在边缘聚集, 也与之前的研究结果(李晓刚等, 2011; 王海东等, 2013)一致.有研究发现FDiv对生产力的影响在施肥或者干扰的条件下显著, 说明在资源条件较好的情况下, 植物种间竞争增强, 促进了植物不同功能性状的分化, 有利于植物生存和对资源的有效利用, 群落生产力增加(Bernhardt et al., 2011). ...
Hyperspectral remote sensing of plant pigments
1
2007
... 本研究中遥感预测的功能多样性与地上生物量的关系与实测相一致, 证明了基于遥感反演分析两者关系的潜力.通过遥感预测功能多样性与地上群落生物量的关系发现, FRic对群落地上生物量的解释度最高(R2 = 0.40), 而FEve (R2 = 0.27)和FDiv (R2 = 0.28)与群落地上生物量关系较弱, 这与Zhao等(2021)的研究结果一致.植物的光合作用是物质生产的主要来源(Blackburn, 2007), 与光合作用有关的叶片性状叶绿素、类胡萝卜素和叶片氮含量等与群落生产力直接相关(Marron et al., 2005; da Silveira Pontes et al., 2010; Durán et al., 2019).本研究中用于计算功能多样性的叶绿素含量、比叶面积、叶片氮含量和叶片含水量4种功能性状均被大量研究证实与生产力直接或间接相关, 随着这4种功能性状在植物体内含量的增加, 物种光合作用加强, FRic增加, 生产力上升(Cadotte et al., 2011; Fyllas et al., 2017; Durán et al., 2019).Bernhardt等(2011)的研究结果也表明群落生产力有随着FRic指数增加而增加的趋势. ...
Rao?s quadratic entropy as a measure of functional diversity based on multiple traits
2
2005
... 近年来, 以植物功能性状为基础的研究方法被广泛应用到各个尺度中, 根据不同的尺度, 可选用不同的性状指标评估特定尺度下生态系统的功能(Tilman et al., 1997; Walker et al., 1999; Gillison, 2013; 刘晓娟和马克平, 2015; 韩涛涛等, 2021).功能多样性是生物多样性的重要组成部分, 是解释和预测生态系统过程和功能的重要驱动力(Petchey & Gaston, 2002; Petchey et al., 2004), 反映了群落、景观、甚至区域尺度内功能性状的变异性, 决定了生态系统的功能和稳定性(Tilman, 1997; Ruiz-Benito et al., 2014).由于对于功能多样性的不同理解会产生不同的研究方法(Mason et al., 2003, 2005; Botta-Dukát, 2005; Laliberté & Legendre, 2010), 而这些方法对于植物功能性状选取、功能多样性计算、生态系统功能评估的影响较大, 因此有必要对功能多样性做一个统一的定义.Tilman (2001)认为功能多样性是影响生态系统功能的群落中所有物种及有机物的功能特征值及其变动范围, 强调的是特征值的差异性.由于此概念具有较强的概括性和可操作性, 因而被普遍接受并广泛用于计算生态系统结构与功能的各个方面(Petchey & Gaston, 2002; Mason et al., 2003, 2005; Petchey et al., 2004). ...
... 早期对于功能多样性的研究大多采用物种多样性及功能型组, 但随着计算机技术的高速发展, 很多复杂的数学公式被引入到功能多样性的研究中, 例如用影响生态系统结构与功能的功能性状替代物种间的遗传距离, 从而可以得出一些计算功能多样性的方法(Botta-Dukát, 2005; Violle et al., 2007).随后, 研究者们认为仅采用一种指数难以代表生态系统功能多样性(Mouillot et al., 2005), 从而将功能多样性进一步细分为: (1)功能丰富度(FRic); (2)功能均匀度(FEve); (3)功能离散度(FDiv)(Villéger et al., 2008).功能丰富度代表群落中物种占据生态位空间的大小, 体现的是生态位空间利用程度的指数, 常使用物种或群落生态位中性状空间的凸包体积计算获得, 而功能均匀度和功能离散度则代表生态位空间中功能性状分布的均匀程度或离散程度. ...
Random forests
1
2001
... 随机森林最早是由Leo Breiman在2001年提出, 并经Adele Cutler等(Cutler & Zhao, 2001; Cutler & Stevens, 2006)修改完善的一种由决策树构成的集成算法, 可以解释若干个自变量对因变量的作用.本研究通过随机森林回归算法构建了基于图像的草地功能多样性反演模型, 分为如下几步: (1)通过自助法(bootstrap)重采样技术, 从原始样本S中随机选取m (m < S)个样本点, 得到S1……Sn个训练集, 再利用每个训练集生成对应的决策树, 测试样本为每次重采样中未被抽到的样本所构成的袋外数据(OOB); (2)随机选取一定数量的候选特征, 从中选择最适合的特征作为分裂节点; (3)重复步骤(2)直到不能被分裂; (4)生成的决策树就构成了随机森林回归模型, 其中每一个决策树最终的预测结果为该样本点到叶节点的均值, 随机森林最终的预测结果为所有决策树预测结果的均值.回归的精度评价采用OOB预测的残差均方表示如下: ...
Beyond species: functional diversity and the maintenance of ecological processes and services
1
2011
... 本研究中遥感预测的功能多样性与地上生物量的关系与实测相一致, 证明了基于遥感反演分析两者关系的潜力.通过遥感预测功能多样性与地上群落生物量的关系发现, FRic对群落地上生物量的解释度最高(R2 = 0.40), 而FEve (R2 = 0.27)和FDiv (R2 = 0.28)与群落地上生物量关系较弱, 这与Zhao等(2021)的研究结果一致.植物的光合作用是物质生产的主要来源(Blackburn, 2007), 与光合作用有关的叶片性状叶绿素、类胡萝卜素和叶片氮含量等与群落生产力直接相关(Marron et al., 2005; da Silveira Pontes et al., 2010; Durán et al., 2019).本研究中用于计算功能多样性的叶绿素含量、比叶面积、叶片氮含量和叶片含水量4种功能性状均被大量研究证实与生产力直接或间接相关, 随着这4种功能性状在植物体内含量的增加, 物种光合作用加强, FRic增加, 生产力上升(Cadotte et al., 2011; Fyllas et al., 2017; Durán et al., 2019).Bernhardt等(2011)的研究结果也表明群落生产力有随着FRic指数增加而增加的趋势. ...
Random forests for microarrays
1
2006
... 随机森林最早是由Leo Breiman在2001年提出, 并经Adele Cutler等(Cutler & Zhao, 2001; Cutler & Stevens, 2006)修改完善的一种由决策树构成的集成算法, 可以解释若干个自变量对因变量的作用.本研究通过随机森林回归算法构建了基于图像的草地功能多样性反演模型, 分为如下几步: (1)通过自助法(bootstrap)重采样技术, 从原始样本S中随机选取m (m < S)个样本点, 得到S1……Sn个训练集, 再利用每个训练集生成对应的决策树, 测试样本为每次重采样中未被抽到的样本所构成的袋外数据(OOB); (2)随机选取一定数量的候选特征, 从中选择最适合的特征作为分裂节点; (3)重复步骤(2)直到不能被分裂; (4)生成的决策树就构成了随机森林回归模型, 其中每一个决策树最终的预测结果为该样本点到叶节点的均值, 随机森林最终的预测结果为所有决策树预测结果的均值.回归的精度评价采用OOB预测的残差均方表示如下: ...
PERT—Perfect random tree ensembles
1
2001
... 随机森林最早是由Leo Breiman在2001年提出, 并经Adele Cutler等(Cutler & Zhao, 2001; Cutler & Stevens, 2006)修改完善的一种由决策树构成的集成算法, 可以解释若干个自变量对因变量的作用.本研究通过随机森林回归算法构建了基于图像的草地功能多样性反演模型, 分为如下几步: (1)通过自助法(bootstrap)重采样技术, 从原始样本S中随机选取m (m < S)个样本点, 得到S1……Sn个训练集, 再利用每个训练集生成对应的决策树, 测试样本为每次重采样中未被抽到的样本所构成的袋外数据(OOB); (2)随机选取一定数量的候选特征, 从中选择最适合的特征作为分裂节点; (3)重复步骤(2)直到不能被分裂; (4)生成的决策树就构成了随机森林回归模型, 其中每一个决策树最终的预测结果为该样本点到叶节点的均值, 随机森林最终的预测结果为所有决策树预测结果的均值.回归的精度评价采用OOB预测的残差均方表示如下: ...
The role of plant traits and their plasticity in the response of pasture grasses to nutrients and cutting frequency
1
2010
... 本研究中遥感预测的功能多样性与地上生物量的关系与实测相一致, 证明了基于遥感反演分析两者关系的潜力.通过遥感预测功能多样性与地上群落生物量的关系发现, FRic对群落地上生物量的解释度最高(R2 = 0.40), 而FEve (R2 = 0.27)和FDiv (R2 = 0.28)与群落地上生物量关系较弱, 这与Zhao等(2021)的研究结果一致.植物的光合作用是物质生产的主要来源(Blackburn, 2007), 与光合作用有关的叶片性状叶绿素、类胡萝卜素和叶片氮含量等与群落生产力直接相关(Marron et al., 2005; da Silveira Pontes et al., 2010; Durán et al., 2019).本研究中用于计算功能多样性的叶绿素含量、比叶面积、叶片氮含量和叶片含水量4种功能性状均被大量研究证实与生产力直接或间接相关, 随着这4种功能性状在植物体内含量的增加, 物种光合作用加强, FRic增加, 生产力上升(Cadotte et al., 2011; Fyllas et al., 2017; Durán et al., 2019).Bernhardt等(2011)的研究结果也表明群落生产力有随着FRic指数增加而增加的趋势. ...
Environmental and community controls on plant canopy chemistry in a Mediterranean-type ecosystem
1
2013
... PLSR是一种线性非参数回归模型(Verrelst et al., 2015), 是为了解决多变量共线性和数据规模大的问题而开发的一种多元回归算法(Schweiger et al., 2017).PLSR分析在建模过程中集中了主成分分析、典型相关分析和线性回归分析方法的特点, 因此在分析结果中, 除了可以提供一个更为合理的回归模型外, 还可以同时完成一些类似于主成分分析和典型相关分析的研究内容, 提供一些更丰富、深入的信息.同时, 它考虑到多指数结合法的预测准确性较差和物理模型的输入参数较为复杂, PLSR将目标变量与全波段光谱信息联系在一起, 易于实现并可以较优的精度反演多种性状, 已成功地应用于森林和草地生态系统中的性状研究中(Asner & Martin, 2008; Dahlin et al., 2013; Schweiger et al., 2017), 是目前较优的反演方法.本研究使用Unscrambler X 10.4软件, 基于46个特征变量, 利用PLSR方法, 与实测草地功能多样性和生物量建立回归模型, 预测FRic、FEve、FDiv和生物量并反演成图. ...
A new reflectance index for remote sensing of chlorophyll content in higher plants: tests using Eucalyptus leaves
4
1999
... Calculating formula of vegetation index
Table 1 植被指数
Vegetation index | 计算公式
Calculate formula | Sentinel-2波段
Sentinel-2 band used | 参考文献
Reference |
| TCARI | 3[(R699.19 - R668.98) - 0.2(R699.19 - R550.67)(R699.19/R668.98)] | B3, B4, B5 | Kim et al., 1994 |
| OSAVI | (1 + 0.16)(R750 - R705)/(R750 + R705 + 0.16) | B5, B6 | Wu et al., 2008 |
| OSAVI2 | (1 + 0.16) (R800 - R670)/(R800 + R670 + 0.16) | B4, B7 | Rondeaux et al., 1996 |
| D | R730/R706 | B5, B6 | Zarco-Tejada et al., 2003 |
| Datt | (R850 - R710)/(R850 - R680) | B4, B5, B8 | Datt, 1999 |
| Datt2 | R850/R710 | B5, B8 | Datt, 1999 |
| Gitelson | 1/R700 | B5 | Gitelson et al., 1999 |
| SR | R750/R700 | B5, B6 | Gitelson & Merzlyak, 1997 |
| SR2 | R700/R670 | B4, B5 | McMurtrey III et al., 1994 |
| MSI | R1600/R819 | B8, B11 | Hunt Jr & Rock, 1989 |
| NDVI705 | (R750 - R705)/( R750 + R705) | B5, B6 | Sims & Gamon, 2002 |
| CRI1 | 1/R510 - 1/R550 | B2, B3 | Gitelson et al., 2003 |
| CRI2 | 1/R510 - 1/R700 | B2, B5 | Gitelson et al., 2002 |
| ARI1 | 1/R550 - 1/R700 | B3, B5 | Sims & Gamon, 2002 |
| ARI2 | R800(1/R550 - 1/R700) | B3, B5, B7 | Gitelson et al., 2002 |
| NDVI | (R842 - R665)/(R842 + R665) | B4, B8 | Huete et al., 1997 |
| GNDVI | (R783 - R560)/(R783 + R560) | B3, B7 | Rozenstein et al., 2019 |
| TNDVI | [(R842 - R665)/(R842 + R665) + 0.5]0.5 | B4, B8 | Rozenstein et al., 2019 |
| WDVI | R842 - 0.5R665 | B4, B8 | Rozenstein et al., 2019 |
| NDI45 | (R705 - R665)/(R705 + R665) | B4, B5 | Delegido et al., 2011 |
| SAVI | (1 + 0.5) × (R799.09 - R680.045)/(R799.09 + R680.045 + 0.5) | B4, B7 | Huete, 1988 |
| SAVI2 | R799.09/(R680.045 + b/a) (a = 0.97, b = 0.08) | B4, B7 | Major et al., 1990 |
| ARVI | ARVI = (R799.09 -R680.045 + R444.5 + R680.045)/(R799.09 + R680.045 - R444.5 - R680.045) | B1, B4, B7 | Kaufman & Tanre, 1992 |
| SARVI | RB = R680.045 - (R444.5 - R680.045)
SARVI = (1 + 0.5)(R799.09 -R680.045 + R444.5 + R680.045)/(R799.09 + R680.045 -
R444.5 - R680.045 + 0.5) | B1, B4, B7 | Kaufman & Tanre, 1992 |
| EVI | 2.5(R799.09 - R680.045)/(R799.09 + 6R680.045 - 7.5R444.5 + 1) | B1, B4, B7 | Huete et al., 1997 |
| IRECI | (R783 - R665)/(R705/R740) | B4, B5, B6, B7 | Frampton et al., 2013 |
| IPVI | R842/(R842 + R665) | B4, B8 | Rozenstein et al., 2019 |
| PSSRA | R783/R665 | B4, B7 | Rozenstein et al., 2019 |
| RVI | R842/R665 | B4, B8 | Rozenstein et al., 2019 |
| mNDVI705 | (R750 - R705)/( R750 + R705 - 2R445) | B1, B5, B6 | Datt, 1999 |
| mSR705 | (R750 - R445)/( R705 + R445) | B1, B6 | Datt, 1999 |
| SIPI | (R800 - R445)/( R800 - R680) | B1, B7 | Penuelas et al., 1995 |
| NDWI | (R865 - R1614)/( R865 - R1614) | B8A, B11 | McFeeters, 1996 |
R表示range, 其右下角数值表示光谱值范围.ARI, 花青素反射指数; ARVI, 耐大气植被指数; CRI, 类胡萝卜素反射指数; D, 双峰光学指数; DATT, DATT植被指数; EVI, 增强型植被指数; Gitelson, Gitelson植被指数; GNDVI, 绿色归一化差异植被指数; IPVI, 红外植被百分比指数; IRECI, 倒红边叶绿素指数; mNDVI705, 改进红边归一化植被指数; MSI, 水分胁迫指数; mSR705, 改进红边比值植被指数; NDI45, 归一化差异指数; NDII, 归一化红外指数; NDVI, 归一化植被指数; NDWI, 归一化差值水体指数; OSAVI, 优化型土壤调节植被指数; PSRI, 植物衰老反射指数; PSSRA, 特征色素简单比值指数; RVI, 比值植被指数; SARVI, 土壤大气阻抗植被指数; SAVI, 土壤调节植被指数; SIPI, 结构不敏感色素植被指数; SR, 比值植被指数; TCARI, 转换型叶绿素吸收植被指数; TNDVI, 转化后的归一化植被指数; WDVI, 加权差分植被指数. ...
... Datt,
1999 | Gitelson | 1/R700 | B5 | Gitelson et al., 1999 |
| SR | R750/R700 | B5, B6 | Gitelson & Merzlyak, 1997 |
| SR2 | R700/R670 | B4, B5 | McMurtrey III et al., 1994 |
| MSI | R1600/R819 | B8, B11 | Hunt Jr & Rock, 1989 |
| NDVI705 | (R750 - R705)/( R750 + R705) | B5, B6 | Sims & Gamon, 2002 |
| CRI1 | 1/R510 - 1/R550 | B2, B3 | Gitelson et al., 2003 |
| CRI2 | 1/R510 - 1/R700 | B2, B5 | Gitelson et al., 2002 |
| ARI1 | 1/R550 - 1/R700 | B3, B5 | Sims & Gamon, 2002 |
| ARI2 | R800(1/R550 - 1/R700) | B3, B5, B7 | Gitelson et al., 2002 |
| NDVI | (R842 - R665)/(R842 + R665) | B4, B8 | Huete et al., 1997 |
| GNDVI | (R783 - R560)/(R783 + R560) | B3, B7 | Rozenstein et al., 2019 |
| TNDVI | [(R842 - R665)/(R842 + R665) + 0.5]0.5 | B4, B8 | Rozenstein et al., 2019 |
| WDVI | R842 - 0.5R665 | B4, B8 | Rozenstein et al., 2019 |
| NDI45 | (R705 - R665)/(R705 + R665) | B4, B5 | Delegido et al., 2011 |
| SAVI | (1 + 0.5) × (R799.09 - R680.045)/(R799.09 + R680.045 + 0.5) | B4, B7 | Huete, 1988 |
| SAVI2 | R799.09/(R680.045 + b/a) (a = 0.97, b = 0.08) | B4, B7 | Major et al., 1990 |
| ARVI | ARVI = (R799.09 -R680.045 + R444.5 + R680.045)/(R799.09 + R680.045 - R444.5 - R680.045) | B1, B4, B7 | Kaufman & Tanre, 1992 |
| SARVI | RB = R680.045 - (R444.5 - R680.045)
SARVI = (1 + 0.5)(R799.09 -R680.045 + R444.5 + R680.045)/(R799.09 + R680.045 -
R444.5 - R680.045 + 0.5) | B1, B4, B7 | Kaufman & Tanre, 1992 |
| EVI | 2.5(R799.09 - R680.045)/(R799.09 + 6R680.045 - 7.5R444.5 + 1) | B1, B4, B7 | Huete et al., 1997 |
| IRECI | (R783 - R665)/(R705/R740) | B4, B5, B6, B7 | Frampton et al., 2013 |
| IPVI | R842/(R842 + R665) | B4, B8 | Rozenstein et al., 2019 |
| PSSRA | R783/R665 | B4, B7 | Rozenstein et al., 2019 |
| RVI | R842/R665 | B4, B8 | Rozenstein et al., 2019 |
| mNDVI705 | (R750 - R705)/( R750 + R705 - 2R445) | B1, B5, B6 | Datt, 1999 |
| mSR705 | (R750 - R445)/( R705 + R445) | B1, B6 | Datt, 1999 |
| SIPI | (R800 - R445)/( R800 - R680) | B1, B7 | Penuelas et al., 1995 |
| NDWI | (R865 - R1614)/( R865 - R1614) | B8A, B11 | McFeeters, 1996 |
R表示range, 其右下角数值表示光谱值范围.ARI, 花青素反射指数; ARVI, 耐大气植被指数; CRI, 类胡萝卜素反射指数; D, 双峰光学指数; DATT, DATT植被指数; EVI, 增强型植被指数; Gitelson, Gitelson植被指数; GNDVI, 绿色归一化差异植被指数; IPVI, 红外植被百分比指数; IRECI, 倒红边叶绿素指数; mNDVI705, 改进红边归一化植被指数; MSI, 水分胁迫指数; mSR705, 改进红边比值植被指数; NDI45, 归一化差异指数; NDII, 归一化红外指数; NDVI, 归一化植被指数; NDWI, 归一化差值水体指数; OSAVI, 优化型土壤调节植被指数; PSRI, 植物衰老反射指数; PSSRA, 特征色素简单比值指数; RVI, 比值植被指数; SARVI, 土壤大气阻抗植被指数; SAVI, 土壤调节植被指数; SIPI, 结构不敏感色素植被指数; SR, 比值植被指数; TCARI, 转换型叶绿素吸收植被指数; TNDVI, 转化后的归一化植被指数; WDVI, 加权差分植被指数. ...
... Datt,
1999 | mSR705 | (R750 - R445)/( R705 + R445) | B1, B6 | Datt, 1999 |
| SIPI | (R800 - R445)/( R800 - R680) | B1, B7 | Penuelas et al., 1995 |
| NDWI | (R865 - R1614)/( R865 - R1614) | B8A, B11 | McFeeters, 1996 |
R表示range, 其右下角数值表示光谱值范围.ARI, 花青素反射指数; ARVI, 耐大气植被指数; CRI, 类胡萝卜素反射指数; D, 双峰光学指数; DATT, DATT植被指数; EVI, 增强型植被指数; Gitelson, Gitelson植被指数; GNDVI, 绿色归一化差异植被指数; IPVI, 红外植被百分比指数; IRECI, 倒红边叶绿素指数; mNDVI705, 改进红边归一化植被指数; MSI, 水分胁迫指数; mSR705, 改进红边比值植被指数; NDI45, 归一化差异指数; NDII, 归一化红外指数; NDVI, 归一化植被指数; NDWI, 归一化差值水体指数; OSAVI, 优化型土壤调节植被指数; PSRI, 植物衰老反射指数; PSSRA, 特征色素简单比值指数; RVI, 比值植被指数; SARVI, 土壤大气阻抗植被指数; SAVI, 土壤调节植被指数; SIPI, 结构不敏感色素植被指数; SR, 比值植被指数; TCARI, 转换型叶绿素吸收植被指数; TNDVI, 转化后的归一化植被指数; WDVI, 加权差分植被指数. ...
... Datt,
1999 | SIPI | (R800 - R445)/( R800 - R680) | B1, B7 | Penuelas et al., 1995 |
| NDWI | (R865 - R1614)/( R865 - R1614) | B8A, B11 | McFeeters, 1996 |
R表示range, 其右下角数值表示光谱值范围.ARI, 花青素反射指数; ARVI, 耐大气植被指数; CRI, 类胡萝卜素反射指数; D, 双峰光学指数; DATT, DATT植被指数; EVI, 增强型植被指数; Gitelson, Gitelson植被指数; GNDVI, 绿色归一化差异植被指数; IPVI, 红外植被百分比指数; IRECI, 倒红边叶绿素指数; mNDVI705, 改进红边归一化植被指数; MSI, 水分胁迫指数; mSR705, 改进红边比值植被指数; NDI45, 归一化差异指数; NDII, 归一化红外指数; NDVI, 归一化植被指数; NDWI, 归一化差值水体指数; OSAVI, 优化型土壤调节植被指数; PSRI, 植物衰老反射指数; PSSRA, 特征色素简单比值指数; RVI, 比值植被指数; SARVI, 土壤大气阻抗植被指数; SAVI, 土壤调节植被指数; SIPI, 结构不敏感色素植被指数; SR, 比值植被指数; TCARI, 转换型叶绿素吸收植被指数; TNDVI, 转化后的归一化植被指数; WDVI, 加权差分植被指数. ...
Evaluation of Sentinel-2 red-edge bands for empirical estimation of green LAI and chlorophyll content
1
2011
... Calculating formula of vegetation index
Table 1 植被指数
Vegetation index | 计算公式
Calculate formula | Sentinel-2波段
Sentinel-2 band used | 参考文献
Reference |
| TCARI | 3[(R699.19 - R668.98) - 0.2(R699.19 - R550.67)(R699.19/R668.98)] | B3, B4, B5 | Kim et al., 1994 |
| OSAVI | (1 + 0.16)(R750 - R705)/(R750 + R705 + 0.16) | B5, B6 | Wu et al., 2008 |
| OSAVI2 | (1 + 0.16) (R800 - R670)/(R800 + R670 + 0.16) | B4, B7 | Rondeaux et al., 1996 |
| D | R730/R706 | B5, B6 | Zarco-Tejada et al., 2003 |
| Datt | (R850 - R710)/(R850 - R680) | B4, B5, B8 | Datt, 1999 |
| Datt2 | R850/R710 | B5, B8 | Datt, 1999 |
| Gitelson | 1/R700 | B5 | Gitelson et al., 1999 |
| SR | R750/R700 | B5, B6 | Gitelson & Merzlyak, 1997 |
| SR2 | R700/R670 | B4, B5 | McMurtrey III et al., 1994 |
| MSI | R1600/R819 | B8, B11 | Hunt Jr & Rock, 1989 |
| NDVI705 | (R750 - R705)/( R750 + R705) | B5, B6 | Sims & Gamon, 2002 |
| CRI1 | 1/R510 - 1/R550 | B2, B3 | Gitelson et al., 2003 |
| CRI2 | 1/R510 - 1/R700 | B2, B5 | Gitelson et al., 2002 |
| ARI1 | 1/R550 - 1/R700 | B3, B5 | Sims & Gamon, 2002 |
| ARI2 | R800(1/R550 - 1/R700) | B3, B5, B7 | Gitelson et al., 2002 |
| NDVI | (R842 - R665)/(R842 + R665) | B4, B8 | Huete et al., 1997 |
| GNDVI | (R783 - R560)/(R783 + R560) | B3, B7 | Rozenstein et al., 2019 |
| TNDVI | [(R842 - R665)/(R842 + R665) + 0.5]0.5 | B4, B8 | Rozenstein et al., 2019 |
| WDVI | R842 - 0.5R665 | B4, B8 | Rozenstein et al., 2019 |
| NDI45 | (R705 - R665)/(R705 + R665) | B4, B5 | Delegido et al., 2011 |
| SAVI | (1 + 0.5) × (R799.09 - R680.045)/(R799.09 + R680.045 + 0.5) | B4, B7 | Huete, 1988 |
| SAVI2 | R799.09/(R680.045 + b/a) (a = 0.97, b = 0.08) | B4, B7 | Major et al., 1990 |
| ARVI | ARVI = (R799.09 -R680.045 + R444.5 + R680.045)/(R799.09 + R680.045 - R444.5 - R680.045) | B1, B4, B7 | Kaufman & Tanre, 1992 |
| SARVI | RB = R680.045 - (R444.5 - R680.045)
SARVI = (1 + 0.5)(R799.09 -R680.045 + R444.5 + R680.045)/(R799.09 + R680.045 -
R444.5 - R680.045 + 0.5) | B1, B4, B7 | Kaufman & Tanre, 1992 |
| EVI | 2.5(R799.09 - R680.045)/(R799.09 + 6R680.045 - 7.5R444.5 + 1) | B1, B4, B7 | Huete et al., 1997 |
| IRECI | (R783 - R665)/(R705/R740) | B4, B5, B6, B7 | Frampton et al., 2013 |
| IPVI | R842/(R842 + R665) | B4, B8 | Rozenstein et al., 2019 |
| PSSRA | R783/R665 | B4, B7 | Rozenstein et al., 2019 |
| RVI | R842/R665 | B4, B8 | Rozenstein et al., 2019 |
| mNDVI705 | (R750 - R705)/( R750 + R705 - 2R445) | B1, B5, B6 | Datt, 1999 |
| mSR705 | (R750 - R445)/( R705 + R445) | B1, B6 | Datt, 1999 |
| SIPI | (R800 - R445)/( R800 - R680) | B1, B7 | Penuelas et al., 1995 |
| NDWI | (R865 - R1614)/( R865 - R1614) | B8A, B11 | McFeeters, 1996 |
R表示range, 其右下角数值表示光谱值范围.ARI, 花青素反射指数; ARVI, 耐大气植被指数; CRI, 类胡萝卜素反射指数; D, 双峰光学指数; DATT, DATT植被指数; EVI, 增强型植被指数; Gitelson, Gitelson植被指数; GNDVI, 绿色归一化差异植被指数; IPVI, 红外植被百分比指数; IRECI, 倒红边叶绿素指数; mNDVI705, 改进红边归一化植被指数; MSI, 水分胁迫指数; mSR705, 改进红边比值植被指数; NDI45, 归一化差异指数; NDII, 归一化红外指数; NDVI, 归一化植被指数; NDWI, 归一化差值水体指数; OSAVI, 优化型土壤调节植被指数; PSRI, 植物衰老反射指数; PSSRA, 特征色素简单比值指数; RVI, 比值植被指数; SARVI, 土壤大气阻抗植被指数; SAVI, 土壤调节植被指数; SIPI, 结构不敏感色素植被指数; SR, 比值植被指数; TCARI, 转换型叶绿素吸收植被指数; TNDVI, 转化后的归一化植被指数; WDVI, 加权差分植被指数. ...
Comparison of tree species classifications at the individual tree level by combining ALS data and RGB images using different algorithms
1
2016
... CHA是一种光谱多样性指数(Deng et al., 2016; Gholizadeh et al., 2018), 是样方内各草本植物像元的所有波段凸包面积的平均值, 即: ...
Vive la différence: plant functional diversity matters to ecosystem processes
2
2001
... 群落生产力表征区域环境条件下植被的生产能力, 反映了生态系统的生长特征和健康状况, 早期的很多研究认可了物种多样性对生产力的贡献, 但近年来, 一些研究认为相对于物种多样性, 功能多样性更能影响群落生产力(Díaz & Cabido, 2001; Römermann et al., 2001).因此开展对天然草地的功能多样性遥感监测及其与生产力关系的研究可以更好地探究功能多样性与生态系统功能之间的关系.然而, 功能多样性与生产力的关系较为复杂, 主要有“质量比假说” (Grime, 1998)和“多样性假说” (Tilman et al., 1997).前者认为优势物种的性状大小决定了群落的生产力, 后者认为多样性高导致功能性状差异加大, 从而提高了资源的利用效率.两种假说的相对重要性至今仍有争论, 是研究的热点.地上生物量作为群落生产力的有力度量指标, 因其观测相对便利常用来代替群落生产力(Kassen et al., 2000; Bai et al., 2007).基于单种栽培草地平台, Zhao等(2021)发现无人机高光谱反演的与光合作用相关的叶绿素、碳、氮含量等叶片生理性状, 是草地单种栽培群落地上生物量的重要预测因子, 进一步分析了功能多样性与生产力的关系.然而, 当前基于天然草地的功能多样性遥感监测及其与生产力的关系还鲜有研究. ...
... 越来越多的研究证明, 功能多样性即群落中物种的功能差异性(Tilman, 2001; Petchey & Gaston, 2002)是生态系统过程的决定因素(Díaz & Cabido, 2001; Loreau et al., 2001; 臧岳铭等, 2009).植物功能性状是研究生态系统结构与功能变化的中间桥梁(孙国钧等, 2003).Wan等(2011)指出可以通过改变植物的种类组成和性状来影响区域尺度上的功能多样性, 本研究所选的生态系统功能仅为地上生物量, 覆盖面较小.因此, 研究各性状有何种功能, 各种性状组合计算得到的功能多样性具体又指代生态系统的何种功能, 可作为下一步研究的重点. ...
The plant traits that drive ecosystems: evidence from three continents
1
2004
... 在以往的研究中, 生态学家主要利用物种为基本单元的多样性指数来探讨群落间的物种多样性, 如: Shannon-Weiner指数, Simpson指数等(韩涛涛等, 2021).然而, 物种间的差异往往体现在长期进化过程中, 以物种为基本单元的研究很难体现不同生态系统间功能的差异(Naeem et al., 2012; Mouillot et al., 2013).植物功能性状能够适应环境变化, 并将环境与植物个体和生态系统结构、过程与功能联系起来(Díaz et al., 2004).基于植物功能性状和功能多样性的研究可以从植物的生长、防御、抵抗等不同的功能策略方面解释不同生态系统间的物种组成、功能特征, 从而有助于进一步理解它们的生态过程和功能(Tilman, 1997; Leps et al., 2006; 韩涛涛等, 2021). ...
Hyperspectral inversion of Suaeda salsa biomass under different types of human activity in Liaohe Estuary wetland in north-eastern China
1
2020
... 本研究利用PLSR对地上群落生物量进行了反演, 反演精度R2 = 0.61 (RMSE = 94.15, p < 0.001), 此结果相比基于Sentinel-2数据估算草地生物量的研究精度更低.如, Kong等(2019)以高寒草地的植被为研究对象, 利用冠层光谱数据和生物量与MOD13 NDVI数据相结合, 基于逐步回归方法反演高山草地生物量, 拟合R2为0.869; Dou等(2020)以滨海湿地的植被为研究对象反演生物量的精度, R2大于0.85, 本研究结果与之相比精度略低, 这可能是受研究区域空间尺度的影响(Kong et al., 2019).不同草地类型的生物量遥感反演结果表明, 草地类型也是影响生物量估算精度的重要因子, 且多种草地类型的数据混合, 有利于提升模型的准确性(Shen et al., 2008), 本研究仅选择草甸草原, 可能会对结果产生一定影响. ...
Informing trait-based ecology by assessing remotely sensed functional diversity across a broad tropical temperature gradient
4
2019
... 传统的功能多样性的计算通常依赖大量的野外调查, 基于野外获得的生物多样性和功能性状进一步得到功能多样性, 测定手段费时费力, 同时也受时间和空间尺度的制约, 不适用于长期大规模的区域监测.遥感数据具有探测范围广、数据获取周期短、可重复等特点, 使得其在大尺度生物多样性监测和评估及制图方面具有极大的优势(Roughgarden et al., 1991), 已经成为评估生态系统功能多样性的重要工具.目前, 基于遥感的功能多样性的监测方法已经在森林生态系统中成功应用.Asner等(2017)和Schneider等(2017)分别基于聚类分析和基于像元的功能多样性遥感反演方法, 利用机载高光谱数据成功绘制了高空间分辨率的植物功能多样性空间分布图.Durán等(2019)利用成像光谱学和叶片性状相结合的方法, 基于偏最小二乘回归(PLSR)估算了亚马孙至安第斯山脉热带森林不同海拔高度的功能多样性, 同时发现通过遥感获得的单一性状或多性状计算得到的功能多样性是净初级生产力和总生产力变化的重要预测因素.但由于草地类型多样、覆盖度低、植株矮小且多数混合生长等特点, 相较于森林生态系统, 在大尺度上进行草地生态系统监测难度较高(辛晓平等, 2018). ...
... 另一方面, 尽管基于遥感的功能多样性监测在森林中得到了很好的应用, 如利用机载激光雷达、成像光谱学和高光谱数据获取森林冠层或叶片性状, 成功估算热带森林的功能多样性及其变化(Asner et al., 2017; Durán et al., 2019).但相比于森林生态系统, 草地物种个体小, Sentinel-2数据计算的不是各物种间的变异而是像元所代表的群落间的变异, 估算精度也会存在一定差异(Mallinis et al., 2020).因此, 当影像空间分辨率提升到草地物种个体大小(cm级), 功能多样性的估算精度可能会有所提升.进一步, 高光谱数据的应用也会提升功能性状的反演精度, 进而提升功能多样性的反演精度.无人机具有成本低、操作灵活的优点, 结合地面调查, 辅以高光谱传感器, 可实现对高空间、高光谱和高时间分辨率的草地功能多样性监测, 进一步集成地面观测, 构建多维度、多尺度、高频率的天空地一体化草地多样性监测技术体系, 促使遥感技术方法与生态学理论的有机融合, 为实现小尺度研究到大尺度监测的无缝链接提供了强有力的技术手段. ...
... 本研究中遥感预测的功能多样性与地上生物量的关系与实测相一致, 证明了基于遥感反演分析两者关系的潜力.通过遥感预测功能多样性与地上群落生物量的关系发现, FRic对群落地上生物量的解释度最高(R2 = 0.40), 而FEve (R2 = 0.27)和FDiv (R2 = 0.28)与群落地上生物量关系较弱, 这与Zhao等(2021)的研究结果一致.植物的光合作用是物质生产的主要来源(Blackburn, 2007), 与光合作用有关的叶片性状叶绿素、类胡萝卜素和叶片氮含量等与群落生产力直接相关(Marron et al., 2005; da Silveira Pontes et al., 2010; Durán et al., 2019).本研究中用于计算功能多样性的叶绿素含量、比叶面积、叶片氮含量和叶片含水量4种功能性状均被大量研究证实与生产力直接或间接相关, 随着这4种功能性状在植物体内含量的增加, 物种光合作用加强, FRic增加, 生产力上升(Cadotte et al., 2011; Fyllas et al., 2017; Durán et al., 2019).Bernhardt等(2011)的研究结果也表明群落生产力有随着FRic指数增加而增加的趋势. ...
... ., 2019).Bernhardt等(2011)的研究结果也表明群落生产力有随着FRic指数增加而增加的趋势. ...
Compositional shifts in root-associated bacterial and archaeal microbiota track the plant life cycle in field-grown rice
1
2018
... 以上3种回归模型, 为减少冗余信息的干扰, 均随机选取样本, 利用十折重复交叉验证, 基于决定系数(R2)和均方根误差(RMSE)开展精度评估(Genuer et al., 2010; Edwards et al., 2018), 从而选择最优的回归模型反演草地功能多样性. ...
Quantitative analysis of salt-affected soil reflectance spectra: a comparison of two adaptive methods (PLSR and ANN)
1
2007
... 本研究基于3种回归方法反演草地功能多样性, 结果发现利用逐步回归对FRic (R2 = 0.52, RMSE = 4.51)和FEve (R2 = 0.42, RMSE = 0.03)指数有较好的反演结果, 而利用PLSR法对FDiv指数有较好的反演结果(R2 = 0.61, RMSE = 0.04).这可能与3种回归方法选择特征变量的方式有关.逐步回归剔除了具有多重共线性且不显著的特征变量得到最终的回归模型, 而RFR仅剔除了具有多重共线性的特征变量后建立了回归模型, 变量在模型中显著与否没有得到证实.同时, RFR无法控制模型内部的运行, 只能在不同参数和随机种子之间进行尝试, 对于小样本数据或者低维数据(变量较少的数据), 可能不能产生很好的分类.本研究选取了46个特征变量, 但去掉具有多重共线性的变量后仅剩3-6个变量进行回归建模, 且实验样本数量较少, 可能会对模型估算精度有影响.PLSR能够在自变量存在严重多重共线性的条件下进行回归建模, 在最终模型中将包含原有的所有自变量且更易于辨识系统信息与噪声(Farifteh et al., 2007), 这一方法已经在森林功能多样性反演中得到广泛应用(Asner et al., 2017).因此, 在反演过程中, 要根据实际情况选择合适的模型进行估算. ...
Evaluating the capabilities of Sentinel-2 for quantitative estimation of biophysical variables in vegetation
1
2013
... Calculating formula of vegetation index
Table 1 植被指数
Vegetation index | 计算公式
Calculate formula | Sentinel-2波段
Sentinel-2 band used | 参考文献
Reference |
| TCARI | 3[(R699.19 - R668.98) - 0.2(R699.19 - R550.67)(R699.19/R668.98)] | B3, B4, B5 | Kim et al., 1994 |
| OSAVI | (1 + 0.16)(R750 - R705)/(R750 + R705 + 0.16) | B5, B6 | Wu et al., 2008 |
| OSAVI2 | (1 + 0.16) (R800 - R670)/(R800 + R670 + 0.16) | B4, B7 | Rondeaux et al., 1996 |
| D | R730/R706 | B5, B6 | Zarco-Tejada et al., 2003 |
| Datt | (R850 - R710)/(R850 - R680) | B4, B5, B8 | Datt, 1999 |
| Datt2 | R850/R710 | B5, B8 | Datt, 1999 |
| Gitelson | 1/R700 | B5 | Gitelson et al., 1999 |
| SR | R750/R700 | B5, B6 | Gitelson & Merzlyak, 1997 |
| SR2 | R700/R670 | B4, B5 | McMurtrey III et al., 1994 |
| MSI | R1600/R819 | B8, B11 | Hunt Jr & Rock, 1989 |
| NDVI705 | (R750 - R705)/( R750 + R705) | B5, B6 | Sims & Gamon, 2002 |
| CRI1 | 1/R510 - 1/R550 | B2, B3 | Gitelson et al., 2003 |
| CRI2 | 1/R510 - 1/R700 | B2, B5 | Gitelson et al., 2002 |
| ARI1 | 1/R550 - 1/R700 | B3, B5 | Sims & Gamon, 2002 |
| ARI2 | R800(1/R550 - 1/R700) | B3, B5, B7 | Gitelson et al., 2002 |
| NDVI | (R842 - R665)/(R842 + R665) | B4, B8 | Huete et al., 1997 |
| GNDVI | (R783 - R560)/(R783 + R560) | B3, B7 | Rozenstein et al., 2019 |
| TNDVI | [(R842 - R665)/(R842 + R665) + 0.5]0.5 | B4, B8 | Rozenstein et al., 2019 |
| WDVI | R842 - 0.5R665 | B4, B8 | Rozenstein et al., 2019 |
| NDI45 | (R705 - R665)/(R705 + R665) | B4, B5 | Delegido et al., 2011 |
| SAVI | (1 + 0.5) × (R799.09 - R680.045)/(R799.09 + R680.045 + 0.5) | B4, B7 | Huete, 1988 |
| SAVI2 | R799.09/(R680.045 + b/a) (a = 0.97, b = 0.08) | B4, B7 | Major et al., 1990 |
| ARVI | ARVI = (R799.09 -R680.045 + R444.5 + R680.045)/(R799.09 + R680.045 - R444.5 - R680.045) | B1, B4, B7 | Kaufman & Tanre, 1992 |
| SARVI | RB = R680.045 - (R444.5 - R680.045)
SARVI = (1 + 0.5)(R799.09 -R680.045 + R444.5 + R680.045)/(R799.09 + R680.045 -
R444.5 - R680.045 + 0.5) | B1, B4, B7 | Kaufman & Tanre, 1992 |
| EVI | 2.5(R799.09 - R680.045)/(R799.09 + 6R680.045 - 7.5R444.5 + 1) | B1, B4, B7 | Huete et al., 1997 |
| IRECI | (R783 - R665)/(R705/R740) | B4, B5, B6, B7 | Frampton et al., 2013 |
| IPVI | R842/(R842 + R665) | B4, B8 | Rozenstein et al., 2019 |
| PSSRA | R783/R665 | B4, B7 | Rozenstein et al., 2019 |
| RVI | R842/R665 | B4, B8 | Rozenstein et al., 2019 |
| mNDVI705 | (R750 - R705)/( R750 + R705 - 2R445) | B1, B5, B6 | Datt, 1999 |
| mSR705 | (R750 - R445)/( R705 + R445) | B1, B6 | Datt, 1999 |
| SIPI | (R800 - R445)/( R800 - R680) | B1, B7 | Penuelas et al., 1995 |
| NDWI | (R865 - R1614)/( R865 - R1614) | B8A, B11 | McFeeters, 1996 |
R表示range, 其右下角数值表示光谱值范围.ARI, 花青素反射指数; ARVI, 耐大气植被指数; CRI, 类胡萝卜素反射指数; D, 双峰光学指数; DATT, DATT植被指数; EVI, 增强型植被指数; Gitelson, Gitelson植被指数; GNDVI, 绿色归一化差异植被指数; IPVI, 红外植被百分比指数; IRECI, 倒红边叶绿素指数; mNDVI705, 改进红边归一化植被指数; MSI, 水分胁迫指数; mSR705, 改进红边比值植被指数; NDI45, 归一化差异指数; NDII, 归一化红外指数; NDVI, 归一化植被指数; NDWI, 归一化差值水体指数; OSAVI, 优化型土壤调节植被指数; PSRI, 植物衰老反射指数; PSSRA, 特征色素简单比值指数; RVI, 比值植被指数; SARVI, 土壤大气阻抗植被指数; SAVI, 土壤调节植被指数; SIPI, 结构不敏感色素植被指数; SR, 比值植被指数; TCARI, 转换型叶绿素吸收植被指数; TNDVI, 转化后的归一化植被指数; WDVI, 加权差分植被指数. ...
Solar radiation and functional traits explain the decline of forest primary productivity along a tropical elevation gradient
1
2017
... 本研究中遥感预测的功能多样性与地上生物量的关系与实测相一致, 证明了基于遥感反演分析两者关系的潜力.通过遥感预测功能多样性与地上群落生物量的关系发现, FRic对群落地上生物量的解释度最高(R2 = 0.40), 而FEve (R2 = 0.27)和FDiv (R2 = 0.28)与群落地上生物量关系较弱, 这与Zhao等(2021)的研究结果一致.植物的光合作用是物质生产的主要来源(Blackburn, 2007), 与光合作用有关的叶片性状叶绿素、类胡萝卜素和叶片氮含量等与群落生产力直接相关(Marron et al., 2005; da Silveira Pontes et al., 2010; Durán et al., 2019).本研究中用于计算功能多样性的叶绿素含量、比叶面积、叶片氮含量和叶片含水量4种功能性状均被大量研究证实与生产力直接或间接相关, 随着这4种功能性状在植物体内含量的增加, 物种光合作用加强, FRic增加, 生产力上升(Cadotte et al., 2011; Fyllas et al., 2017; Durán et al., 2019).Bernhardt等(2011)的研究结果也表明群落生产力有随着FRic指数增加而增加的趋势. ...
Variable selection using random forests
1
2010
... 以上3种回归模型, 为减少冗余信息的干扰, 均随机选取样本, 利用十折重复交叉验证, 基于决定系数(R2)和均方根误差(RMSE)开展精度评估(Genuer et al., 2010; Edwards et al., 2018), 从而选择最优的回归模型反演草地功能多样性. ...
Remote sensing of biodiversity: soil correction and data dimension reduction methods improve assessment of α-diversity (species richness) in prairie ecosystems
1
2018
... CHA是一种光谱多样性指数(Deng et al., 2016; Gholizadeh et al., 2018), 是样方内各草本植物像元的所有波段凸包面积的平均值, 即: ...
Plant functional types and traits at the community ecosystem and world level
1
2013
... 近年来, 以植物功能性状为基础的研究方法被广泛应用到各个尺度中, 根据不同的尺度, 可选用不同的性状指标评估特定尺度下生态系统的功能(Tilman et al., 1997; Walker et al., 1999; Gillison, 2013; 刘晓娟和马克平, 2015; 韩涛涛等, 2021).功能多样性是生物多样性的重要组成部分, 是解释和预测生态系统过程和功能的重要驱动力(Petchey & Gaston, 2002; Petchey et al., 2004), 反映了群落、景观、甚至区域尺度内功能性状的变异性, 决定了生态系统的功能和稳定性(Tilman, 1997; Ruiz-Benito et al., 2014).由于对于功能多样性的不同理解会产生不同的研究方法(Mason et al., 2003, 2005; Botta-Dukát, 2005; Laliberté & Legendre, 2010), 而这些方法对于植物功能性状选取、功能多样性计算、生态系统功能评估的影响较大, 因此有必要对功能多样性做一个统一的定义.Tilman (2001)认为功能多样性是影响生态系统功能的群落中所有物种及有机物的功能特征值及其变动范围, 强调的是特征值的差异性.由于此概念具有较强的概括性和可操作性, 因而被普遍接受并广泛用于计算生态系统结构与功能的各个方面(Petchey & Gaston, 2002; Mason et al., 2003, 2005; Petchey et al., 2004). ...
The chlorophyll fluorescence ratio F735/F700 as an accurate measure of the chlorophyll content in plants
1
1999
... Calculating formula of vegetation index
Table 1 植被指数
Vegetation index | 计算公式
Calculate formula | Sentinel-2波段
Sentinel-2 band used | 参考文献
Reference |
| TCARI | 3[(R699.19 - R668.98) - 0.2(R699.19 - R550.67)(R699.19/R668.98)] | B3, B4, B5 | Kim et al., 1994 |
| OSAVI | (1 + 0.16)(R750 - R705)/(R750 + R705 + 0.16) | B5, B6 | Wu et al., 2008 |
| OSAVI2 | (1 + 0.16) (R800 - R670)/(R800 + R670 + 0.16) | B4, B7 | Rondeaux et al., 1996 |
| D | R730/R706 | B5, B6 | Zarco-Tejada et al., 2003 |
| Datt | (R850 - R710)/(R850 - R680) | B4, B5, B8 | Datt, 1999 |
| Datt2 | R850/R710 | B5, B8 | Datt, 1999 |
| Gitelson | 1/R700 | B5 | Gitelson et al., 1999 |
| SR | R750/R700 | B5, B6 | Gitelson & Merzlyak, 1997 |
| SR2 | R700/R670 | B4, B5 | McMurtrey III et al., 1994 |
| MSI | R1600/R819 | B8, B11 | Hunt Jr & Rock, 1989 |
| NDVI705 | (R750 - R705)/( R750 + R705) | B5, B6 | Sims & Gamon, 2002 |
| CRI1 | 1/R510 - 1/R550 | B2, B3 | Gitelson et al., 2003 |
| CRI2 | 1/R510 - 1/R700 | B2, B5 | Gitelson et al., 2002 |
| ARI1 | 1/R550 - 1/R700 | B3, B5 | Sims & Gamon, 2002 |
| ARI2 | R800(1/R550 - 1/R700) | B3, B5, B7 | Gitelson et al., 2002 |
| NDVI | (R842 - R665)/(R842 + R665) | B4, B8 | Huete et al., 1997 |
| GNDVI | (R783 - R560)/(R783 + R560) | B3, B7 | Rozenstein et al., 2019 |
| TNDVI | [(R842 - R665)/(R842 + R665) + 0.5]0.5 | B4, B8 | Rozenstein et al., 2019 |
| WDVI | R842 - 0.5R665 | B4, B8 | Rozenstein et al., 2019 |
| NDI45 | (R705 - R665)/(R705 + R665) | B4, B5 | Delegido et al., 2011 |
| SAVI | (1 + 0.5) × (R799.09 - R680.045)/(R799.09 + R680.045 + 0.5) | B4, B7 | Huete, 1988 |
| SAVI2 | R799.09/(R680.045 + b/a) (a = 0.97, b = 0.08) | B4, B7 | Major et al., 1990 |
| ARVI | ARVI = (R799.09 -R680.045 + R444.5 + R680.045)/(R799.09 + R680.045 - R444.5 - R680.045) | B1, B4, B7 | Kaufman & Tanre, 1992 |
| SARVI | RB = R680.045 - (R444.5 - R680.045)
SARVI = (1 + 0.5)(R799.09 -R680.045 + R444.5 + R680.045)/(R799.09 + R680.045 -
R444.5 - R680.045 + 0.5) | B1, B4, B7 | Kaufman & Tanre, 1992 |
| EVI | 2.5(R799.09 - R680.045)/(R799.09 + 6R680.045 - 7.5R444.5 + 1) | B1, B4, B7 | Huete et al., 1997 |
| IRECI | (R783 - R665)/(R705/R740) | B4, B5, B6, B7 | Frampton et al., 2013 |
| IPVI | R842/(R842 + R665) | B4, B8 | Rozenstein et al., 2019 |
| PSSRA | R783/R665 | B4, B7 | Rozenstein et al., 2019 |
| RVI | R842/R665 | B4, B8 | Rozenstein et al., 2019 |
| mNDVI705 | (R750 - R705)/( R750 + R705 - 2R445) | B1, B5, B6 | Datt, 1999 |
| mSR705 | (R750 - R445)/( R705 + R445) | B1, B6 | Datt, 1999 |
| SIPI | (R800 - R445)/( R800 - R680) | B1, B7 | Penuelas et al., 1995 |
| NDWI | (R865 - R1614)/( R865 - R1614) | B8A, B11 | McFeeters, 1996 |
R表示range, 其右下角数值表示光谱值范围.ARI, 花青素反射指数; ARVI, 耐大气植被指数; CRI, 类胡萝卜素反射指数; D, 双峰光学指数; DATT, DATT植被指数; EVI, 增强型植被指数; Gitelson, Gitelson植被指数; GNDVI, 绿色归一化差异植被指数; IPVI, 红外植被百分比指数; IRECI, 倒红边叶绿素指数; mNDVI705, 改进红边归一化植被指数; MSI, 水分胁迫指数; mSR705, 改进红边比值植被指数; NDI45, 归一化差异指数; NDII, 归一化红外指数; NDVI, 归一化植被指数; NDWI, 归一化差值水体指数; OSAVI, 优化型土壤调节植被指数; PSRI, 植物衰老反射指数; PSSRA, 特征色素简单比值指数; RVI, 比值植被指数; SARVI, 土壤大气阻抗植被指数; SAVI, 土壤调节植被指数; SIPI, 结构不敏感色素植被指数; SR, 比值植被指数; TCARI, 转换型叶绿素吸收植被指数; TNDVI, 转化后的归一化植被指数; WDVI, 加权差分植被指数. ...
Relationships between leaf chlorophyll content and spectral reflectance and algorithms for non-destructive chlorophyll assessment in higher plant leaves
1
2003
... Calculating formula of vegetation index
Table 1 植被指数
Vegetation index | 计算公式
Calculate formula | Sentinel-2波段
Sentinel-2 band used | 参考文献
Reference |
| TCARI | 3[(R699.19 - R668.98) - 0.2(R699.19 - R550.67)(R699.19/R668.98)] | B3, B4, B5 | Kim et al., 1994 |
| OSAVI | (1 + 0.16)(R750 - R705)/(R750 + R705 + 0.16) | B5, B6 | Wu et al., 2008 |
| OSAVI2 | (1 + 0.16) (R800 - R670)/(R800 + R670 + 0.16) | B4, B7 | Rondeaux et al., 1996 |
| D | R730/R706 | B5, B6 | Zarco-Tejada et al., 2003 |
| Datt | (R850 - R710)/(R850 - R680) | B4, B5, B8 | Datt, 1999 |
| Datt2 | R850/R710 | B5, B8 | Datt, 1999 |
| Gitelson | 1/R700 | B5 | Gitelson et al., 1999 |
| SR | R750/R700 | B5, B6 | Gitelson & Merzlyak, 1997 |
| SR2 | R700/R670 | B4, B5 | McMurtrey III et al., 1994 |
| MSI | R1600/R819 | B8, B11 | Hunt Jr & Rock, 1989 |
| NDVI705 | (R750 - R705)/( R750 + R705) | B5, B6 | Sims & Gamon, 2002 |
| CRI1 | 1/R510 - 1/R550 | B2, B3 | Gitelson et al., 2003 |
| CRI2 | 1/R510 - 1/R700 | B2, B5 | Gitelson et al., 2002 |
| ARI1 | 1/R550 - 1/R700 | B3, B5 | Sims & Gamon, 2002 |
| ARI2 | R800(1/R550 - 1/R700) | B3, B5, B7 | Gitelson et al., 2002 |
| NDVI | (R842 - R665)/(R842 + R665) | B4, B8 | Huete et al., 1997 |
| GNDVI | (R783 - R560)/(R783 + R560) | B3, B7 | Rozenstein et al., 2019 |
| TNDVI | [(R842 - R665)/(R842 + R665) + 0.5]0.5 | B4, B8 | Rozenstein et al., 2019 |
| WDVI | R842 - 0.5R665 | B4, B8 | Rozenstein et al., 2019 |
| NDI45 | (R705 - R665)/(R705 + R665) | B4, B5 | Delegido et al., 2011 |
| SAVI | (1 + 0.5) × (R799.09 - R680.045)/(R799.09 + R680.045 + 0.5) | B4, B7 | Huete, 1988 |
| SAVI2 | R799.09/(R680.045 + b/a) (a = 0.97, b = 0.08) | B4, B7 | Major et al., 1990 |
| ARVI | ARVI = (R799.09 -R680.045 + R444.5 + R680.045)/(R799.09 + R680.045 - R444.5 - R680.045) | B1, B4, B7 | Kaufman & Tanre, 1992 |
| SARVI | RB = R680.045 - (R444.5 - R680.045)
SARVI = (1 + 0.5)(R799.09 -R680.045 + R444.5 + R680.045)/(R799.09 + R680.045 -
R444.5 - R680.045 + 0.5) | B1, B4, B7 | Kaufman & Tanre, 1992 |
| EVI | 2.5(R799.09 - R680.045)/(R799.09 + 6R680.045 - 7.5R444.5 + 1) | B1, B4, B7 | Huete et al., 1997 |
| IRECI | (R783 - R665)/(R705/R740) | B4, B5, B6, B7 | Frampton et al., 2013 |
| IPVI | R842/(R842 + R665) | B4, B8 | Rozenstein et al., 2019 |
| PSSRA | R783/R665 | B4, B7 | Rozenstein et al., 2019 |
| RVI | R842/R665 | B4, B8 | Rozenstein et al., 2019 |
| mNDVI705 | (R750 - R705)/( R750 + R705 - 2R445) | B1, B5, B6 | Datt, 1999 |
| mSR705 | (R750 - R445)/( R705 + R445) | B1, B6 | Datt, 1999 |
| SIPI | (R800 - R445)/( R800 - R680) | B1, B7 | Penuelas et al., 1995 |
| NDWI | (R865 - R1614)/( R865 - R1614) | B8A, B11 | McFeeters, 1996 |
R表示range, 其右下角数值表示光谱值范围.ARI, 花青素反射指数; ARVI, 耐大气植被指数; CRI, 类胡萝卜素反射指数; D, 双峰光学指数; DATT, DATT植被指数; EVI, 增强型植被指数; Gitelson, Gitelson植被指数; GNDVI, 绿色归一化差异植被指数; IPVI, 红外植被百分比指数; IRECI, 倒红边叶绿素指数; mNDVI705, 改进红边归一化植被指数; MSI, 水分胁迫指数; mSR705, 改进红边比值植被指数; NDI45, 归一化差异指数; NDII, 归一化红外指数; NDVI, 归一化植被指数; NDWI, 归一化差值水体指数; OSAVI, 优化型土壤调节植被指数; PSRI, 植物衰老反射指数; PSSRA, 特征色素简单比值指数; RVI, 比值植被指数; SARVI, 土壤大气阻抗植被指数; SAVI, 土壤调节植被指数; SIPI, 结构不敏感色素植被指数; SR, 比值植被指数; TCARI, 转换型叶绿素吸收植被指数; TNDVI, 转化后的归一化植被指数; WDVI, 加权差分植被指数. ...
Remote estimation of chlorophyll content in higher plant leaves
1
1997
... Calculating formula of vegetation index
Table 1 植被指数
Vegetation index | 计算公式
Calculate formula | Sentinel-2波段
Sentinel-2 band used | 参考文献
Reference |
| TCARI | 3[(R699.19 - R668.98) - 0.2(R699.19 - R550.67)(R699.19/R668.98)] | B3, B4, B5 | Kim et al., 1994 |
| OSAVI | (1 + 0.16)(R750 - R705)/(R750 + R705 + 0.16) | B5, B6 | Wu et al., 2008 |
| OSAVI2 | (1 + 0.16) (R800 - R670)/(R800 + R670 + 0.16) | B4, B7 | Rondeaux et al., 1996 |
| D | R730/R706 | B5, B6 | Zarco-Tejada et al., 2003 |
| Datt | (R850 - R710)/(R850 - R680) | B4, B5, B8 | Datt, 1999 |
| Datt2 | R850/R710 | B5, B8 | Datt, 1999 |
| Gitelson | 1/R700 | B5 | Gitelson et al., 1999 |
| SR | R750/R700 | B5, B6 | Gitelson & Merzlyak, 1997 |
| SR2 | R700/R670 | B4, B5 | McMurtrey III et al., 1994 |
| MSI | R1600/R819 | B8, B11 | Hunt Jr & Rock, 1989 |
| NDVI705 | (R750 - R705)/( R750 + R705) | B5, B6 | Sims & Gamon, 2002 |
| CRI1 | 1/R510 - 1/R550 | B2, B3 | Gitelson et al., 2003 |
| CRI2 | 1/R510 - 1/R700 | B2, B5 | Gitelson et al., 2002 |
| ARI1 | 1/R550 - 1/R700 | B3, B5 | Sims & Gamon, 2002 |
| ARI2 | R800(1/R550 - 1/R700) | B3, B5, B7 | Gitelson et al., 2002 |
| NDVI | (R842 - R665)/(R842 + R665) | B4, B8 | Huete et al., 1997 |
| GNDVI | (R783 - R560)/(R783 + R560) | B3, B7 | Rozenstein et al., 2019 |
| TNDVI | [(R842 - R665)/(R842 + R665) + 0.5]0.5 | B4, B8 | Rozenstein et al., 2019 |
| WDVI | R842 - 0.5R665 | B4, B8 | Rozenstein et al., 2019 |
| NDI45 | (R705 - R665)/(R705 + R665) | B4, B5 | Delegido et al., 2011 |
| SAVI | (1 + 0.5) × (R799.09 - R680.045)/(R799.09 + R680.045 + 0.5) | B4, B7 | Huete, 1988 |
| SAVI2 | R799.09/(R680.045 + b/a) (a = 0.97, b = 0.08) | B4, B7 | Major et al., 1990 |
| ARVI | ARVI = (R799.09 -R680.045 + R444.5 + R680.045)/(R799.09 + R680.045 - R444.5 - R680.045) | B1, B4, B7 | Kaufman & Tanre, 1992 |
| SARVI | RB = R680.045 - (R444.5 - R680.045)
SARVI = (1 + 0.5)(R799.09 -R680.045 + R444.5 + R680.045)/(R799.09 + R680.045 -
R444.5 - R680.045 + 0.5) | B1, B4, B7 | Kaufman & Tanre, 1992 |
| EVI | 2.5(R799.09 - R680.045)/(R799.09 + 6R680.045 - 7.5R444.5 + 1) | B1, B4, B7 | Huete et al., 1997 |
| IRECI | (R783 - R665)/(R705/R740) | B4, B5, B6, B7 | Frampton et al., 2013 |
| IPVI | R842/(R842 + R665) | B4, B8 | Rozenstein et al., 2019 |
| PSSRA | R783/R665 | B4, B7 | Rozenstein et al., 2019 |
| RVI | R842/R665 | B4, B8 | Rozenstein et al., 2019 |
| mNDVI705 | (R750 - R705)/( R750 + R705 - 2R445) | B1, B5, B6 | Datt, 1999 |
| mSR705 | (R750 - R445)/( R705 + R445) | B1, B6 | Datt, 1999 |
| SIPI | (R800 - R445)/( R800 - R680) | B1, B7 | Penuelas et al., 1995 |
| NDWI | (R865 - R1614)/( R865 - R1614) | B8A, B11 | McFeeters, 1996 |
R表示range, 其右下角数值表示光谱值范围.ARI, 花青素反射指数; ARVI, 耐大气植被指数; CRI, 类胡萝卜素反射指数; D, 双峰光学指数; DATT, DATT植被指数; EVI, 增强型植被指数; Gitelson, Gitelson植被指数; GNDVI, 绿色归一化差异植被指数; IPVI, 红外植被百分比指数; IRECI, 倒红边叶绿素指数; mNDVI705, 改进红边归一化植被指数; MSI, 水分胁迫指数; mSR705, 改进红边比值植被指数; NDI45, 归一化差异指数; NDII, 归一化红外指数; NDVI, 归一化植被指数; NDWI, 归一化差值水体指数; OSAVI, 优化型土壤调节植被指数; PSRI, 植物衰老反射指数; PSSRA, 特征色素简单比值指数; RVI, 比值植被指数; SARVI, 土壤大气阻抗植被指数; SAVI, 土壤调节植被指数; SIPI, 结构不敏感色素植被指数; SR, 比值植被指数; TCARI, 转换型叶绿素吸收植被指数; TNDVI, 转化后的归一化植被指数; WDVI, 加权差分植被指数. ...
Assessing carotenoid content in plant leaves with reflectance spectroscopy
2
2002
... Calculating formula of vegetation index
Table 1 植被指数
Vegetation index | 计算公式
Calculate formula | Sentinel-2波段
Sentinel-2 band used | 参考文献
Reference |
| TCARI | 3[(R699.19 - R668.98) - 0.2(R699.19 - R550.67)(R699.19/R668.98)] | B3, B4, B5 | Kim et al., 1994 |
| OSAVI | (1 + 0.16)(R750 - R705)/(R750 + R705 + 0.16) | B5, B6 | Wu et al., 2008 |
| OSAVI2 | (1 + 0.16) (R800 - R670)/(R800 + R670 + 0.16) | B4, B7 | Rondeaux et al., 1996 |
| D | R730/R706 | B5, B6 | Zarco-Tejada et al., 2003 |
| Datt | (R850 - R710)/(R850 - R680) | B4, B5, B8 | Datt, 1999 |
| Datt2 | R850/R710 | B5, B8 | Datt, 1999 |
| Gitelson | 1/R700 | B5 | Gitelson et al., 1999 |
| SR | R750/R700 | B5, B6 | Gitelson & Merzlyak, 1997 |
| SR2 | R700/R670 | B4, B5 | McMurtrey III et al., 1994 |
| MSI | R1600/R819 | B8, B11 | Hunt Jr & Rock, 1989 |
| NDVI705 | (R750 - R705)/( R750 + R705) | B5, B6 | Sims & Gamon, 2002 |
| CRI1 | 1/R510 - 1/R550 | B2, B3 | Gitelson et al., 2003 |
| CRI2 | 1/R510 - 1/R700 | B2, B5 | Gitelson et al., 2002 |
| ARI1 | 1/R550 - 1/R700 | B3, B5 | Sims & Gamon, 2002 |
| ARI2 | R800(1/R550 - 1/R700) | B3, B5, B7 | Gitelson et al., 2002 |
| NDVI | (R842 - R665)/(R842 + R665) | B4, B8 | Huete et al., 1997 |
| GNDVI | (R783 - R560)/(R783 + R560) | B3, B7 | Rozenstein et al., 2019 |
| TNDVI | [(R842 - R665)/(R842 + R665) + 0.5]0.5 | B4, B8 | Rozenstein et al., 2019 |
| WDVI | R842 - 0.5R665 | B4, B8 | Rozenstein et al., 2019 |
| NDI45 | (R705 - R665)/(R705 + R665) | B4, B5 | Delegido et al., 2011 |
| SAVI | (1 + 0.5) × (R799.09 - R680.045)/(R799.09 + R680.045 + 0.5) | B4, B7 | Huete, 1988 |
| SAVI2 | R799.09/(R680.045 + b/a) (a = 0.97, b = 0.08) | B4, B7 | Major et al., 1990 |
| ARVI | ARVI = (R799.09 -R680.045 + R444.5 + R680.045)/(R799.09 + R680.045 - R444.5 - R680.045) | B1, B4, B7 | Kaufman & Tanre, 1992 |
| SARVI | RB = R680.045 - (R444.5 - R680.045)
SARVI = (1 + 0.5)(R799.09 -R680.045 + R444.5 + R680.045)/(R799.09 + R680.045 -
R444.5 - R680.045 + 0.5) | B1, B4, B7 | Kaufman & Tanre, 1992 |
| EVI | 2.5(R799.09 - R680.045)/(R799.09 + 6R680.045 - 7.5R444.5 + 1) | B1, B4, B7 | Huete et al., 1997 |
| IRECI | (R783 - R665)/(R705/R740) | B4, B5, B6, B7 | Frampton et al., 2013 |
| IPVI | R842/(R842 + R665) | B4, B8 | Rozenstein et al., 2019 |
| PSSRA | R783/R665 | B4, B7 | Rozenstein et al., 2019 |
| RVI | R842/R665 | B4, B8 | Rozenstein et al., 2019 |
| mNDVI705 | (R750 - R705)/( R750 + R705 - 2R445) | B1, B5, B6 | Datt, 1999 |
| mSR705 | (R750 - R445)/( R705 + R445) | B1, B6 | Datt, 1999 |
| SIPI | (R800 - R445)/( R800 - R680) | B1, B7 | Penuelas et al., 1995 |
| NDWI | (R865 - R1614)/( R865 - R1614) | B8A, B11 | McFeeters, 1996 |
R表示range, 其右下角数值表示光谱值范围.ARI, 花青素反射指数; ARVI, 耐大气植被指数; CRI, 类胡萝卜素反射指数; D, 双峰光学指数; DATT, DATT植被指数; EVI, 增强型植被指数; Gitelson, Gitelson植被指数; GNDVI, 绿色归一化差异植被指数; IPVI, 红外植被百分比指数; IRECI, 倒红边叶绿素指数; mNDVI705, 改进红边归一化植被指数; MSI, 水分胁迫指数; mSR705, 改进红边比值植被指数; NDI45, 归一化差异指数; NDII, 归一化红外指数; NDVI, 归一化植被指数; NDWI, 归一化差值水体指数; OSAVI, 优化型土壤调节植被指数; PSRI, 植物衰老反射指数; PSSRA, 特征色素简单比值指数; RVI, 比值植被指数; SARVI, 土壤大气阻抗植被指数; SAVI, 土壤调节植被指数; SIPI, 结构不敏感色素植被指数; SR, 比值植被指数; TCARI, 转换型叶绿素吸收植被指数; TNDVI, 转化后的归一化植被指数; WDVI, 加权差分植被指数. ...
... .,
2002 | NDVI | (R842 - R665)/(R842 + R665) | B4, B8 | Huete et al., 1997 |
| GNDVI | (R783 - R560)/(R783 + R560) | B3, B7 | Rozenstein et al., 2019 |
| TNDVI | [(R842 - R665)/(R842 + R665) + 0.5]0.5 | B4, B8 | Rozenstein et al., 2019 |
| WDVI | R842 - 0.5R665 | B4, B8 | Rozenstein et al., 2019 |
| NDI45 | (R705 - R665)/(R705 + R665) | B4, B5 | Delegido et al., 2011 |
| SAVI | (1 + 0.5) × (R799.09 - R680.045)/(R799.09 + R680.045 + 0.5) | B4, B7 | Huete, 1988 |
| SAVI2 | R799.09/(R680.045 + b/a) (a = 0.97, b = 0.08) | B4, B7 | Major et al., 1990 |
| ARVI | ARVI = (R799.09 -R680.045 + R444.5 + R680.045)/(R799.09 + R680.045 - R444.5 - R680.045) | B1, B4, B7 | Kaufman & Tanre, 1992 |
| SARVI | RB = R680.045 - (R444.5 - R680.045)
SARVI = (1 + 0.5)(R799.09 -R680.045 + R444.5 + R680.045)/(R799.09 + R680.045 -
R444.5 - R680.045 + 0.5) | B1, B4, B7 | Kaufman & Tanre, 1992 |
| EVI | 2.5(R799.09 - R680.045)/(R799.09 + 6R680.045 - 7.5R444.5 + 1) | B1, B4, B7 | Huete et al., 1997 |
| IRECI | (R783 - R665)/(R705/R740) | B4, B5, B6, B7 | Frampton et al., 2013 |
| IPVI | R842/(R842 + R665) | B4, B8 | Rozenstein et al., 2019 |
| PSSRA | R783/R665 | B4, B7 | Rozenstein et al., 2019 |
| RVI | R842/R665 | B4, B8 | Rozenstein et al., 2019 |
| mNDVI705 | (R750 - R705)/( R750 + R705 - 2R445) | B1, B5, B6 | Datt, 1999 |
| mSR705 | (R750 - R445)/( R705 + R445) | B1, B6 | Datt, 1999 |
| SIPI | (R800 - R445)/( R800 - R680) | B1, B7 | Penuelas et al., 1995 |
| NDWI | (R865 - R1614)/( R865 - R1614) | B8A, B11 | McFeeters, 1996 |
R表示range, 其右下角数值表示光谱值范围.ARI, 花青素反射指数; ARVI, 耐大气植被指数; CRI, 类胡萝卜素反射指数; D, 双峰光学指数; DATT, DATT植被指数; EVI, 增强型植被指数; Gitelson, Gitelson植被指数; GNDVI, 绿色归一化差异植被指数; IPVI, 红外植被百分比指数; IRECI, 倒红边叶绿素指数; mNDVI705, 改进红边归一化植被指数; MSI, 水分胁迫指数; mSR705, 改进红边比值植被指数; NDI45, 归一化差异指数; NDII, 归一化红外指数; NDVI, 归一化植被指数; NDWI, 归一化差值水体指数; OSAVI, 优化型土壤调节植被指数; PSRI, 植物衰老反射指数; PSSRA, 特征色素简单比值指数; RVI, 比值植被指数; SARVI, 土壤大气阻抗植被指数; SAVI, 土壤调节植被指数; SIPI, 结构不敏感色素植被指数; SR, 比值植被指数; TCARI, 转换型叶绿素吸收植被指数; TNDVI, 转化后的归一化植被指数; WDVI, 加权差分植被指数. ...
Benefits of plant diversity to ecosystems: immediate, filter and founder effects
2
1998
... 群落生产力表征区域环境条件下植被的生产能力, 反映了生态系统的生长特征和健康状况, 早期的很多研究认可了物种多样性对生产力的贡献, 但近年来, 一些研究认为相对于物种多样性, 功能多样性更能影响群落生产力(Díaz & Cabido, 2001; Römermann et al., 2001).因此开展对天然草地的功能多样性遥感监测及其与生产力关系的研究可以更好地探究功能多样性与生态系统功能之间的关系.然而, 功能多样性与生产力的关系较为复杂, 主要有“质量比假说” (Grime, 1998)和“多样性假说” (Tilman et al., 1997).前者认为优势物种的性状大小决定了群落的生产力, 后者认为多样性高导致功能性状差异加大, 从而提高了资源的利用效率.两种假说的相对重要性至今仍有争论, 是研究的热点.地上生物量作为群落生产力的有力度量指标, 因其观测相对便利常用来代替群落生产力(Kassen et al., 2000; Bai et al., 2007).基于单种栽培草地平台, Zhao等(2021)发现无人机高光谱反演的与光合作用相关的叶绿素、碳、氮含量等叶片生理性状, 是草地单种栽培群落地上生物量的重要预测因子, 进一步分析了功能多样性与生产力的关系.然而, 当前基于天然草地的功能多样性遥感监测及其与生产力的关系还鲜有研究. ...
... FEve与群落地上生物量的关系最弱, 且呈负相关关系, 即群落生产力随FEve的增加而降低, 说明生产力可能主要源于对某一资源集中利用的物种的生物量.FEve被用作指示资源的利用程度, 低的均匀度表示有些生态位空间虽被占据但未充分利用, 不对生物量的增加起促进作用.本研究结果支持“质量比”假说, 即群落中起支配作用的物种的属性和相对多度对生态系统过程有决定性作用(Grime, 1998), 优势种利用了大部分资源, 而非优势种则对生物量的贡献较小, 因此地上生物量随FEve的降低而升高(马文静, 2014).FDiv与地上生物量间的相关性并不显著, 功能离散度表示群落功能性状的多度在性状空间内的离散程度, 离散度高说明植物在性状空间边缘较多分布.研究结果显示, 地上生物量随FDiv的增加表现出降低趋势, 可能是由于可利用资源较少, 使得植物功能性状的分布发生改变, 为了获取更多资源, 植物性状不在边缘聚集, 也与之前的研究结果(李晓刚等, 2011; 王海东等, 2013)一致.有研究发现FDiv对生产力的影响在施肥或者干扰的条件下显著, 说明在资源条件较好的情况下, 植物种间竞争增强, 促进了植物不同功能性状的分化, 有利于植物生存和对资源的有效利用, 群落生产力增加(Bernhardt et al., 2011). ...
群落/生态系统功能多样性研究方法及展望
3
2021
... 在以往的研究中, 生态学家主要利用物种为基本单元的多样性指数来探讨群落间的物种多样性, 如: Shannon-Weiner指数, Simpson指数等(韩涛涛等, 2021).然而, 物种间的差异往往体现在长期进化过程中, 以物种为基本单元的研究很难体现不同生态系统间功能的差异(Naeem et al., 2012; Mouillot et al., 2013).植物功能性状能够适应环境变化, 并将环境与植物个体和生态系统结构、过程与功能联系起来(Díaz et al., 2004).基于植物功能性状和功能多样性的研究可以从植物的生长、防御、抵抗等不同的功能策略方面解释不同生态系统间的物种组成、功能特征, 从而有助于进一步理解它们的生态过程和功能(Tilman, 1997; Leps et al., 2006; 韩涛涛等, 2021). ...
... ; 韩涛涛等, 2021). ...
... 近年来, 以植物功能性状为基础的研究方法被广泛应用到各个尺度中, 根据不同的尺度, 可选用不同的性状指标评估特定尺度下生态系统的功能(Tilman et al., 1997; Walker et al., 1999; Gillison, 2013; 刘晓娟和马克平, 2015; 韩涛涛等, 2021).功能多样性是生物多样性的重要组成部分, 是解释和预测生态系统过程和功能的重要驱动力(Petchey & Gaston, 2002; Petchey et al., 2004), 反映了群落、景观、甚至区域尺度内功能性状的变异性, 决定了生态系统的功能和稳定性(Tilman, 1997; Ruiz-Benito et al., 2014).由于对于功能多样性的不同理解会产生不同的研究方法(Mason et al., 2003, 2005; Botta-Dukát, 2005; Laliberté & Legendre, 2010), 而这些方法对于植物功能性状选取、功能多样性计算、生态系统功能评估的影响较大, 因此有必要对功能多样性做一个统一的定义.Tilman (2001)认为功能多样性是影响生态系统功能的群落中所有物种及有机物的功能特征值及其变动范围, 强调的是特征值的差异性.由于此概念具有较强的概括性和可操作性, 因而被普遍接受并广泛用于计算生态系统结构与功能的各个方面(Petchey & Gaston, 2002; Mason et al., 2003, 2005; Petchey et al., 2004). ...
Review of optical-based remote sensing for plant trait mapping
1
2013
... 基于单位质量的叶片物质含量, 利用各物种的地上生物量将上述单位质量的叶片性状上推到冠层性状(Homolová et al., 2013), 公式如下: ...
Resistance and resilience of a grassland ecosystem to climate extremes
1
2014
... 草地是陆地生态系统的重要组成部分, 是世界上分布最广的植被类型之一, 为人类提供了一系列重要的物质产品(肉奶、皮毛、各种草药等)和生态服务(防风固沙、大气调节、涵养水源等)(Bai et al., 2004).然而, 由于气候变化和人类活动干扰, 草地的生物多样性和生态系统功能发生了巨大变化(Hoover et al., 2014).因此, 加强对草地生物多样性及生态系统功能的监测与评估, 对草地生物多样性保护政策的制定和生态系统适应性管理至关重要. ...
A soil-adjusted vegetation index (SAVI)
1
1988
... Calculating formula of vegetation index
Table 1 植被指数
Vegetation index | 计算公式
Calculate formula | Sentinel-2波段
Sentinel-2 band used | 参考文献
Reference |
| TCARI | 3[(R699.19 - R668.98) - 0.2(R699.19 - R550.67)(R699.19/R668.98)] | B3, B4, B5 | Kim et al., 1994 |
| OSAVI | (1 + 0.16)(R750 - R705)/(R750 + R705 + 0.16) | B5, B6 | Wu et al., 2008 |
| OSAVI2 | (1 + 0.16) (R800 - R670)/(R800 + R670 + 0.16) | B4, B7 | Rondeaux et al., 1996 |
| D | R730/R706 | B5, B6 | Zarco-Tejada et al., 2003 |
| Datt | (R850 - R710)/(R850 - R680) | B4, B5, B8 | Datt, 1999 |
| Datt2 | R850/R710 | B5, B8 | Datt, 1999 |
| Gitelson | 1/R700 | B5 | Gitelson et al., 1999 |
| SR | R750/R700 | B5, B6 | Gitelson & Merzlyak, 1997 |
| SR2 | R700/R670 | B4, B5 | McMurtrey III et al., 1994 |
| MSI | R1600/R819 | B8, B11 | Hunt Jr & Rock, 1989 |
| NDVI705 | (R750 - R705)/( R750 + R705) | B5, B6 | Sims & Gamon, 2002 |
| CRI1 | 1/R510 - 1/R550 | B2, B3 | Gitelson et al., 2003 |
| CRI2 | 1/R510 - 1/R700 | B2, B5 | Gitelson et al., 2002 |
| ARI1 | 1/R550 - 1/R700 | B3, B5 | Sims & Gamon, 2002 |
| ARI2 | R800(1/R550 - 1/R700) | B3, B5, B7 | Gitelson et al., 2002 |
| NDVI | (R842 - R665)/(R842 + R665) | B4, B8 | Huete et al., 1997 |
| GNDVI | (R783 - R560)/(R783 + R560) | B3, B7 | Rozenstein et al., 2019 |
| TNDVI | [(R842 - R665)/(R842 + R665) + 0.5]0.5 | B4, B8 | Rozenstein et al., 2019 |
| WDVI | R842 - 0.5R665 | B4, B8 | Rozenstein et al., 2019 |
| NDI45 | (R705 - R665)/(R705 + R665) | B4, B5 | Delegido et al., 2011 |
| SAVI | (1 + 0.5) × (R799.09 - R680.045)/(R799.09 + R680.045 + 0.5) | B4, B7 | Huete, 1988 |
| SAVI2 | R799.09/(R680.045 + b/a) (a = 0.97, b = 0.08) | B4, B7 | Major et al., 1990 |
| ARVI | ARVI = (R799.09 -R680.045 + R444.5 + R680.045)/(R799.09 + R680.045 - R444.5 - R680.045) | B1, B4, B7 | Kaufman & Tanre, 1992 |
| SARVI | RB = R680.045 - (R444.5 - R680.045)
SARVI = (1 + 0.5)(R799.09 -R680.045 + R444.5 + R680.045)/(R799.09 + R680.045 -
R444.5 - R680.045 + 0.5) | B1, B4, B7 | Kaufman & Tanre, 1992 |
| EVI | 2.5(R799.09 - R680.045)/(R799.09 + 6R680.045 - 7.5R444.5 + 1) | B1, B4, B7 | Huete et al., 1997 |
| IRECI | (R783 - R665)/(R705/R740) | B4, B5, B6, B7 | Frampton et al., 2013 |
| IPVI | R842/(R842 + R665) | B4, B8 | Rozenstein et al., 2019 |
| PSSRA | R783/R665 | B4, B7 | Rozenstein et al., 2019 |
| RVI | R842/R665 | B4, B8 | Rozenstein et al., 2019 |
| mNDVI705 | (R750 - R705)/( R750 + R705 - 2R445) | B1, B5, B6 | Datt, 1999 |
| mSR705 | (R750 - R445)/( R705 + R445) | B1, B6 | Datt, 1999 |
| SIPI | (R800 - R445)/( R800 - R680) | B1, B7 | Penuelas et al., 1995 |
| NDWI | (R865 - R1614)/( R865 - R1614) | B8A, B11 | McFeeters, 1996 |
R表示range, 其右下角数值表示光谱值范围.ARI, 花青素反射指数; ARVI, 耐大气植被指数; CRI, 类胡萝卜素反射指数; D, 双峰光学指数; DATT, DATT植被指数; EVI, 增强型植被指数; Gitelson, Gitelson植被指数; GNDVI, 绿色归一化差异植被指数; IPVI, 红外植被百分比指数; IRECI, 倒红边叶绿素指数; mNDVI705, 改进红边归一化植被指数; MSI, 水分胁迫指数; mSR705, 改进红边比值植被指数; NDI45, 归一化差异指数; NDII, 归一化红外指数; NDVI, 归一化植被指数; NDWI, 归一化差值水体指数; OSAVI, 优化型土壤调节植被指数; PSRI, 植物衰老反射指数; PSSRA, 特征色素简单比值指数; RVI, 比值植被指数; SARVI, 土壤大气阻抗植被指数; SAVI, 土壤调节植被指数; SIPI, 结构不敏感色素植被指数; SR, 比值植被指数; TCARI, 转换型叶绿素吸收植被指数; TNDVI, 转化后的归一化植被指数; WDVI, 加权差分植被指数. ...
A comparison of vegetation indices over a global set of TM images for EOS-MODIS
2
1997
... Calculating formula of vegetation index
Table 1 植被指数
Vegetation index | 计算公式
Calculate formula | Sentinel-2波段
Sentinel-2 band used | 参考文献
Reference |
| TCARI | 3[(R699.19 - R668.98) - 0.2(R699.19 - R550.67)(R699.19/R668.98)] | B3, B4, B5 | Kim et al., 1994 |
| OSAVI | (1 + 0.16)(R750 - R705)/(R750 + R705 + 0.16) | B5, B6 | Wu et al., 2008 |
| OSAVI2 | (1 + 0.16) (R800 - R670)/(R800 + R670 + 0.16) | B4, B7 | Rondeaux et al., 1996 |
| D | R730/R706 | B5, B6 | Zarco-Tejada et al., 2003 |
| Datt | (R850 - R710)/(R850 - R680) | B4, B5, B8 | Datt, 1999 |
| Datt2 | R850/R710 | B5, B8 | Datt, 1999 |
| Gitelson | 1/R700 | B5 | Gitelson et al., 1999 |
| SR | R750/R700 | B5, B6 | Gitelson & Merzlyak, 1997 |
| SR2 | R700/R670 | B4, B5 | McMurtrey III et al., 1994 |
| MSI | R1600/R819 | B8, B11 | Hunt Jr & Rock, 1989 |
| NDVI705 | (R750 - R705)/( R750 + R705) | B5, B6 | Sims & Gamon, 2002 |
| CRI1 | 1/R510 - 1/R550 | B2, B3 | Gitelson et al., 2003 |
| CRI2 | 1/R510 - 1/R700 | B2, B5 | Gitelson et al., 2002 |
| ARI1 | 1/R550 - 1/R700 | B3, B5 | Sims & Gamon, 2002 |
| ARI2 | R800(1/R550 - 1/R700) | B3, B5, B7 | Gitelson et al., 2002 |
| NDVI | (R842 - R665)/(R842 + R665) | B4, B8 | Huete et al., 1997 |
| GNDVI | (R783 - R560)/(R783 + R560) | B3, B7 | Rozenstein et al., 2019 |
| TNDVI | [(R842 - R665)/(R842 + R665) + 0.5]0.5 | B4, B8 | Rozenstein et al., 2019 |
| WDVI | R842 - 0.5R665 | B4, B8 | Rozenstein et al., 2019 |
| NDI45 | (R705 - R665)/(R705 + R665) | B4, B5 | Delegido et al., 2011 |
| SAVI | (1 + 0.5) × (R799.09 - R680.045)/(R799.09 + R680.045 + 0.5) | B4, B7 | Huete, 1988 |
| SAVI2 | R799.09/(R680.045 + b/a) (a = 0.97, b = 0.08) | B4, B7 | Major et al., 1990 |
| ARVI | ARVI = (R799.09 -R680.045 + R444.5 + R680.045)/(R799.09 + R680.045 - R444.5 - R680.045) | B1, B4, B7 | Kaufman & Tanre, 1992 |
| SARVI | RB = R680.045 - (R444.5 - R680.045)
SARVI = (1 + 0.5)(R799.09 -R680.045 + R444.5 + R680.045)/(R799.09 + R680.045 -
R444.5 - R680.045 + 0.5) | B1, B4, B7 | Kaufman & Tanre, 1992 |
| EVI | 2.5(R799.09 - R680.045)/(R799.09 + 6R680.045 - 7.5R444.5 + 1) | B1, B4, B7 | Huete et al., 1997 |
| IRECI | (R783 - R665)/(R705/R740) | B4, B5, B6, B7 | Frampton et al., 2013 |
| IPVI | R842/(R842 + R665) | B4, B8 | Rozenstein et al., 2019 |
| PSSRA | R783/R665 | B4, B7 | Rozenstein et al., 2019 |
| RVI | R842/R665 | B4, B8 | Rozenstein et al., 2019 |
| mNDVI705 | (R750 - R705)/( R750 + R705 - 2R445) | B1, B5, B6 | Datt, 1999 |
| mSR705 | (R750 - R445)/( R705 + R445) | B1, B6 | Datt, 1999 |
| SIPI | (R800 - R445)/( R800 - R680) | B1, B7 | Penuelas et al., 1995 |
| NDWI | (R865 - R1614)/( R865 - R1614) | B8A, B11 | McFeeters, 1996 |
R表示range, 其右下角数值表示光谱值范围.ARI, 花青素反射指数; ARVI, 耐大气植被指数; CRI, 类胡萝卜素反射指数; D, 双峰光学指数; DATT, DATT植被指数; EVI, 增强型植被指数; Gitelson, Gitelson植被指数; GNDVI, 绿色归一化差异植被指数; IPVI, 红外植被百分比指数; IRECI, 倒红边叶绿素指数; mNDVI705, 改进红边归一化植被指数; MSI, 水分胁迫指数; mSR705, 改进红边比值植被指数; NDI45, 归一化差异指数; NDII, 归一化红外指数; NDVI, 归一化植被指数; NDWI, 归一化差值水体指数; OSAVI, 优化型土壤调节植被指数; PSRI, 植物衰老反射指数; PSSRA, 特征色素简单比值指数; RVI, 比值植被指数; SARVI, 土壤大气阻抗植被指数; SAVI, 土壤调节植被指数; SIPI, 结构不敏感色素植被指数; SR, 比值植被指数; TCARI, 转换型叶绿素吸收植被指数; TNDVI, 转化后的归一化植被指数; WDVI, 加权差分植被指数. ...
... .,
1997 | IRECI | (R783 - R665)/(R705/R740) | B4, B5, B6, B7 | Frampton et al., 2013 |
| IPVI | R842/(R842 + R665) | B4, B8 | Rozenstein et al., 2019 |
| PSSRA | R783/R665 | B4, B7 | Rozenstein et al., 2019 |
| RVI | R842/R665 | B4, B8 | Rozenstein et al., 2019 |
| mNDVI705 | (R750 - R705)/( R750 + R705 - 2R445) | B1, B5, B6 | Datt, 1999 |
| mSR705 | (R750 - R445)/( R705 + R445) | B1, B6 | Datt, 1999 |
| SIPI | (R800 - R445)/( R800 - R680) | B1, B7 | Penuelas et al., 1995 |
| NDWI | (R865 - R1614)/( R865 - R1614) | B8A, B11 | McFeeters, 1996 |
R表示range, 其右下角数值表示光谱值范围.ARI, 花青素反射指数; ARVI, 耐大气植被指数; CRI, 类胡萝卜素反射指数; D, 双峰光学指数; DATT, DATT植被指数; EVI, 增强型植被指数; Gitelson, Gitelson植被指数; GNDVI, 绿色归一化差异植被指数; IPVI, 红外植被百分比指数; IRECI, 倒红边叶绿素指数; mNDVI705, 改进红边归一化植被指数; MSI, 水分胁迫指数; mSR705, 改进红边比值植被指数; NDI45, 归一化差异指数; NDII, 归一化红外指数; NDVI, 归一化植被指数; NDWI, 归一化差值水体指数; OSAVI, 优化型土壤调节植被指数; PSRI, 植物衰老反射指数; PSSRA, 特征色素简单比值指数; RVI, 比值植被指数; SARVI, 土壤大气阻抗植被指数; SAVI, 土壤调节植被指数; SIPI, 结构不敏感色素植被指数; SR, 比值植被指数; TCARI, 转换型叶绿素吸收植被指数; TNDVI, 转化后的归一化植被指数; WDVI, 加权差分植被指数. ...
Detection of changes in leaf water content using Near- and Middle-Infrared reflectances
1
1989
... Calculating formula of vegetation index
Table 1 植被指数
Vegetation index | 计算公式
Calculate formula | Sentinel-2波段
Sentinel-2 band used | 参考文献
Reference |
| TCARI | 3[(R699.19 - R668.98) - 0.2(R699.19 - R550.67)(R699.19/R668.98)] | B3, B4, B5 | Kim et al., 1994 |
| OSAVI | (1 + 0.16)(R750 - R705)/(R750 + R705 + 0.16) | B5, B6 | Wu et al., 2008 |
| OSAVI2 | (1 + 0.16) (R800 - R670)/(R800 + R670 + 0.16) | B4, B7 | Rondeaux et al., 1996 |
| D | R730/R706 | B5, B6 | Zarco-Tejada et al., 2003 |
| Datt | (R850 - R710)/(R850 - R680) | B4, B5, B8 | Datt, 1999 |
| Datt2 | R850/R710 | B5, B8 | Datt, 1999 |
| Gitelson | 1/R700 | B5 | Gitelson et al., 1999 |
| SR | R750/R700 | B5, B6 | Gitelson & Merzlyak, 1997 |
| SR2 | R700/R670 | B4, B5 | McMurtrey III et al., 1994 |
| MSI | R1600/R819 | B8, B11 | Hunt Jr & Rock, 1989 |
| NDVI705 | (R750 - R705)/( R750 + R705) | B5, B6 | Sims & Gamon, 2002 |
| CRI1 | 1/R510 - 1/R550 | B2, B3 | Gitelson et al., 2003 |
| CRI2 | 1/R510 - 1/R700 | B2, B5 | Gitelson et al., 2002 |
| ARI1 | 1/R550 - 1/R700 | B3, B5 | Sims & Gamon, 2002 |
| ARI2 | R800(1/R550 - 1/R700) | B3, B5, B7 | Gitelson et al., 2002 |
| NDVI | (R842 - R665)/(R842 + R665) | B4, B8 | Huete et al., 1997 |
| GNDVI | (R783 - R560)/(R783 + R560) | B3, B7 | Rozenstein et al., 2019 |
| TNDVI | [(R842 - R665)/(R842 + R665) + 0.5]0.5 | B4, B8 | Rozenstein et al., 2019 |
| WDVI | R842 - 0.5R665 | B4, B8 | Rozenstein et al., 2019 |
| NDI45 | (R705 - R665)/(R705 + R665) | B4, B5 | Delegido et al., 2011 |
| SAVI | (1 + 0.5) × (R799.09 - R680.045)/(R799.09 + R680.045 + 0.5) | B4, B7 | Huete, 1988 |
| SAVI2 | R799.09/(R680.045 + b/a) (a = 0.97, b = 0.08) | B4, B7 | Major et al., 1990 |
| ARVI | ARVI = (R799.09 -R680.045 + R444.5 + R680.045)/(R799.09 + R680.045 - R444.5 - R680.045) | B1, B4, B7 | Kaufman & Tanre, 1992 |
| SARVI | RB = R680.045 - (R444.5 - R680.045)
SARVI = (1 + 0.5)(R799.09 -R680.045 + R444.5 + R680.045)/(R799.09 + R680.045 -
R444.5 - R680.045 + 0.5) | B1, B4, B7 | Kaufman & Tanre, 1992 |
| EVI | 2.5(R799.09 - R680.045)/(R799.09 + 6R680.045 - 7.5R444.5 + 1) | B1, B4, B7 | Huete et al., 1997 |
| IRECI | (R783 - R665)/(R705/R740) | B4, B5, B6, B7 | Frampton et al., 2013 |
| IPVI | R842/(R842 + R665) | B4, B8 | Rozenstein et al., 2019 |
| PSSRA | R783/R665 | B4, B7 | Rozenstein et al., 2019 |
| RVI | R842/R665 | B4, B8 | Rozenstein et al., 2019 |
| mNDVI705 | (R750 - R705)/( R750 + R705 - 2R445) | B1, B5, B6 | Datt, 1999 |
| mSR705 | (R750 - R445)/( R705 + R445) | B1, B6 | Datt, 1999 |
| SIPI | (R800 - R445)/( R800 - R680) | B1, B7 | Penuelas et al., 1995 |
| NDWI | (R865 - R1614)/( R865 - R1614) | B8A, B11 | McFeeters, 1996 |
R表示range, 其右下角数值表示光谱值范围.ARI, 花青素反射指数; ARVI, 耐大气植被指数; CRI, 类胡萝卜素反射指数; D, 双峰光学指数; DATT, DATT植被指数; EVI, 增强型植被指数; Gitelson, Gitelson植被指数; GNDVI, 绿色归一化差异植被指数; IPVI, 红外植被百分比指数; IRECI, 倒红边叶绿素指数; mNDVI705, 改进红边归一化植被指数; MSI, 水分胁迫指数; mSR705, 改进红边比值植被指数; NDI45, 归一化差异指数; NDII, 归一化红外指数; NDVI, 归一化植被指数; NDWI, 归一化差值水体指数; OSAVI, 优化型土壤调节植被指数; PSRI, 植物衰老反射指数; PSSRA, 特征色素简单比值指数; RVI, 比值植被指数; SARVI, 土壤大气阻抗植被指数; SAVI, 土壤调节植被指数; SIPI, 结构不敏感色素植被指数; SR, 比值植被指数; TCARI, 转换型叶绿素吸收植被指数; TNDVI, 转化后的归一化植被指数; WDVI, 加权差分植被指数. ...
Diversity peaks at intermediate productivity in a laboratory microcosm
1
2000
... 群落生产力表征区域环境条件下植被的生产能力, 反映了生态系统的生长特征和健康状况, 早期的很多研究认可了物种多样性对生产力的贡献, 但近年来, 一些研究认为相对于物种多样性, 功能多样性更能影响群落生产力(Díaz & Cabido, 2001; Römermann et al., 2001).因此开展对天然草地的功能多样性遥感监测及其与生产力关系的研究可以更好地探究功能多样性与生态系统功能之间的关系.然而, 功能多样性与生产力的关系较为复杂, 主要有“质量比假说” (Grime, 1998)和“多样性假说” (Tilman et al., 1997).前者认为优势物种的性状大小决定了群落的生产力, 后者认为多样性高导致功能性状差异加大, 从而提高了资源的利用效率.两种假说的相对重要性至今仍有争论, 是研究的热点.地上生物量作为群落生产力的有力度量指标, 因其观测相对便利常用来代替群落生产力(Kassen et al., 2000; Bai et al., 2007).基于单种栽培草地平台, Zhao等(2021)发现无人机高光谱反演的与光合作用相关的叶绿素、碳、氮含量等叶片生理性状, 是草地单种栽培群落地上生物量的重要预测因子, 进一步分析了功能多样性与生产力的关系.然而, 当前基于天然草地的功能多样性遥感监测及其与生产力的关系还鲜有研究. ...
Atmospherically resistant vegetation index (ARVI) for EOS-MODIS
2
1992
... Calculating formula of vegetation index
Table 1 植被指数
Vegetation index | 计算公式
Calculate formula | Sentinel-2波段
Sentinel-2 band used | 参考文献
Reference |
| TCARI | 3[(R699.19 - R668.98) - 0.2(R699.19 - R550.67)(R699.19/R668.98)] | B3, B4, B5 | Kim et al., 1994 |
| OSAVI | (1 + 0.16)(R750 - R705)/(R750 + R705 + 0.16) | B5, B6 | Wu et al., 2008 |
| OSAVI2 | (1 + 0.16) (R800 - R670)/(R800 + R670 + 0.16) | B4, B7 | Rondeaux et al., 1996 |
| D | R730/R706 | B5, B6 | Zarco-Tejada et al., 2003 |
| Datt | (R850 - R710)/(R850 - R680) | B4, B5, B8 | Datt, 1999 |
| Datt2 | R850/R710 | B5, B8 | Datt, 1999 |
| Gitelson | 1/R700 | B5 | Gitelson et al., 1999 |
| SR | R750/R700 | B5, B6 | Gitelson & Merzlyak, 1997 |
| SR2 | R700/R670 | B4, B5 | McMurtrey III et al., 1994 |
| MSI | R1600/R819 | B8, B11 | Hunt Jr & Rock, 1989 |
| NDVI705 | (R750 - R705)/( R750 + R705) | B5, B6 | Sims & Gamon, 2002 |
| CRI1 | 1/R510 - 1/R550 | B2, B3 | Gitelson et al., 2003 |
| CRI2 | 1/R510 - 1/R700 | B2, B5 | Gitelson et al., 2002 |
| ARI1 | 1/R550 - 1/R700 | B3, B5 | Sims & Gamon, 2002 |
| ARI2 | R800(1/R550 - 1/R700) | B3, B5, B7 | Gitelson et al., 2002 |
| NDVI | (R842 - R665)/(R842 + R665) | B4, B8 | Huete et al., 1997 |
| GNDVI | (R783 - R560)/(R783 + R560) | B3, B7 | Rozenstein et al., 2019 |
| TNDVI | [(R842 - R665)/(R842 + R665) + 0.5]0.5 | B4, B8 | Rozenstein et al., 2019 |
| WDVI | R842 - 0.5R665 | B4, B8 | Rozenstein et al., 2019 |
| NDI45 | (R705 - R665)/(R705 + R665) | B4, B5 | Delegido et al., 2011 |
| SAVI | (1 + 0.5) × (R799.09 - R680.045)/(R799.09 + R680.045 + 0.5) | B4, B7 | Huete, 1988 |
| SAVI2 | R799.09/(R680.045 + b/a) (a = 0.97, b = 0.08) | B4, B7 | Major et al., 1990 |
| ARVI | ARVI = (R799.09 -R680.045 + R444.5 + R680.045)/(R799.09 + R680.045 - R444.5 - R680.045) | B1, B4, B7 | Kaufman & Tanre, 1992 |
| SARVI | RB = R680.045 - (R444.5 - R680.045)
SARVI = (1 + 0.5)(R799.09 -R680.045 + R444.5 + R680.045)/(R799.09 + R680.045 -
R444.5 - R680.045 + 0.5) | B1, B4, B7 | Kaufman & Tanre, 1992 |
| EVI | 2.5(R799.09 - R680.045)/(R799.09 + 6R680.045 - 7.5R444.5 + 1) | B1, B4, B7 | Huete et al., 1997 |
| IRECI | (R783 - R665)/(R705/R740) | B4, B5, B6, B7 | Frampton et al., 2013 |
| IPVI | R842/(R842 + R665) | B4, B8 | Rozenstein et al., 2019 |
| PSSRA | R783/R665 | B4, B7 | Rozenstein et al., 2019 |
| RVI | R842/R665 | B4, B8 | Rozenstein et al., 2019 |
| mNDVI705 | (R750 - R705)/( R750 + R705 - 2R445) | B1, B5, B6 | Datt, 1999 |
| mSR705 | (R750 - R445)/( R705 + R445) | B1, B6 | Datt, 1999 |
| SIPI | (R800 - R445)/( R800 - R680) | B1, B7 | Penuelas et al., 1995 |
| NDWI | (R865 - R1614)/( R865 - R1614) | B8A, B11 | McFeeters, 1996 |
R表示range, 其右下角数值表示光谱值范围.ARI, 花青素反射指数; ARVI, 耐大气植被指数; CRI, 类胡萝卜素反射指数; D, 双峰光学指数; DATT, DATT植被指数; EVI, 增强型植被指数; Gitelson, Gitelson植被指数; GNDVI, 绿色归一化差异植被指数; IPVI, 红外植被百分比指数; IRECI, 倒红边叶绿素指数; mNDVI705, 改进红边归一化植被指数; MSI, 水分胁迫指数; mSR705, 改进红边比值植被指数; NDI45, 归一化差异指数; NDII, 归一化红外指数; NDVI, 归一化植被指数; NDWI, 归一化差值水体指数; OSAVI, 优化型土壤调节植被指数; PSRI, 植物衰老反射指数; PSSRA, 特征色素简单比值指数; RVI, 比值植被指数; SARVI, 土壤大气阻抗植被指数; SAVI, 土壤调节植被指数; SIPI, 结构不敏感色素植被指数; SR, 比值植被指数; TCARI, 转换型叶绿素吸收植被指数; TNDVI, 转化后的归一化植被指数; WDVI, 加权差分植被指数. ...
... Kaufman & Tanre,
1992 | EVI | 2.5(R799.09 - R680.045)/(R799.09 + 6R680.045 - 7.5R444.5 + 1) | B1, B4, B7 | Huete et al., 1997 |
| IRECI | (R783 - R665)/(R705/R740) | B4, B5, B6, B7 | Frampton et al., 2013 |
| IPVI | R842/(R842 + R665) | B4, B8 | Rozenstein et al., 2019 |
| PSSRA | R783/R665 | B4, B7 | Rozenstein et al., 2019 |
| RVI | R842/R665 | B4, B8 | Rozenstein et al., 2019 |
| mNDVI705 | (R750 - R705)/( R750 + R705 - 2R445) | B1, B5, B6 | Datt, 1999 |
| mSR705 | (R750 - R445)/( R705 + R445) | B1, B6 | Datt, 1999 |
| SIPI | (R800 - R445)/( R800 - R680) | B1, B7 | Penuelas et al., 1995 |
| NDWI | (R865 - R1614)/( R865 - R1614) | B8A, B11 | McFeeters, 1996 |
R表示range, 其右下角数值表示光谱值范围.ARI, 花青素反射指数; ARVI, 耐大气植被指数; CRI, 类胡萝卜素反射指数; D, 双峰光学指数; DATT, DATT植被指数; EVI, 增强型植被指数; Gitelson, Gitelson植被指数; GNDVI, 绿色归一化差异植被指数; IPVI, 红外植被百分比指数; IRECI, 倒红边叶绿素指数; mNDVI705, 改进红边归一化植被指数; MSI, 水分胁迫指数; mSR705, 改进红边比值植被指数; NDI45, 归一化差异指数; NDII, 归一化红外指数; NDVI, 归一化植被指数; NDWI, 归一化差值水体指数; OSAVI, 优化型土壤调节植被指数; PSRI, 植物衰老反射指数; PSSRA, 特征色素简单比值指数; RVI, 比值植被指数; SARVI, 土壤大气阻抗植被指数; SAVI, 土壤调节植被指数; SIPI, 结构不敏感色素植被指数; SR, 比值植被指数; TCARI, 转换型叶绿素吸收植被指数; TNDVI, 转化后的归一化植被指数; WDVI, 加权差分植被指数. ...
The use of high spectral resolution bands for estimating absorbed photosynthetically active radiation
1
1994
... Calculating formula of vegetation index
Table 1 植被指数
Vegetation index | 计算公式
Calculate formula | Sentinel-2波段
Sentinel-2 band used | 参考文献
Reference |
| TCARI | 3[(R699.19 - R668.98) - 0.2(R699.19 - R550.67)(R699.19/R668.98)] | B3, B4, B5 | Kim et al., 1994 |
| OSAVI | (1 + 0.16)(R750 - R705)/(R750 + R705 + 0.16) | B5, B6 | Wu et al., 2008 |
| OSAVI2 | (1 + 0.16) (R800 - R670)/(R800 + R670 + 0.16) | B4, B7 | Rondeaux et al., 1996 |
| D | R730/R706 | B5, B6 | Zarco-Tejada et al., 2003 |
| Datt | (R850 - R710)/(R850 - R680) | B4, B5, B8 | Datt, 1999 |
| Datt2 | R850/R710 | B5, B8 | Datt, 1999 |
| Gitelson | 1/R700 | B5 | Gitelson et al., 1999 |
| SR | R750/R700 | B5, B6 | Gitelson & Merzlyak, 1997 |
| SR2 | R700/R670 | B4, B5 | McMurtrey III et al., 1994 |
| MSI | R1600/R819 | B8, B11 | Hunt Jr & Rock, 1989 |
| NDVI705 | (R750 - R705)/( R750 + R705) | B5, B6 | Sims & Gamon, 2002 |
| CRI1 | 1/R510 - 1/R550 | B2, B3 | Gitelson et al., 2003 |
| CRI2 | 1/R510 - 1/R700 | B2, B5 | Gitelson et al., 2002 |
| ARI1 | 1/R550 - 1/R700 | B3, B5 | Sims & Gamon, 2002 |
| ARI2 | R800(1/R550 - 1/R700) | B3, B5, B7 | Gitelson et al., 2002 |
| NDVI | (R842 - R665)/(R842 + R665) | B4, B8 | Huete et al., 1997 |
| GNDVI | (R783 - R560)/(R783 + R560) | B3, B7 | Rozenstein et al., 2019 |
| TNDVI | [(R842 - R665)/(R842 + R665) + 0.5]0.5 | B4, B8 | Rozenstein et al., 2019 |
| WDVI | R842 - 0.5R665 | B4, B8 | Rozenstein et al., 2019 |
| NDI45 | (R705 - R665)/(R705 + R665) | B4, B5 | Delegido et al., 2011 |
| SAVI | (1 + 0.5) × (R799.09 - R680.045)/(R799.09 + R680.045 + 0.5) | B4, B7 | Huete, 1988 |
| SAVI2 | R799.09/(R680.045 + b/a) (a = 0.97, b = 0.08) | B4, B7 | Major et al., 1990 |
| ARVI | ARVI = (R799.09 -R680.045 + R444.5 + R680.045)/(R799.09 + R680.045 - R444.5 - R680.045) | B1, B4, B7 | Kaufman & Tanre, 1992 |
| SARVI | RB = R680.045 - (R444.5 - R680.045)
SARVI = (1 + 0.5)(R799.09 -R680.045 + R444.5 + R680.045)/(R799.09 + R680.045 -
R444.5 - R680.045 + 0.5) | B1, B4, B7 | Kaufman & Tanre, 1992 |
| EVI | 2.5(R799.09 - R680.045)/(R799.09 + 6R680.045 - 7.5R444.5 + 1) | B1, B4, B7 | Huete et al., 1997 |
| IRECI | (R783 - R665)/(R705/R740) | B4, B5, B6, B7 | Frampton et al., 2013 |
| IPVI | R842/(R842 + R665) | B4, B8 | Rozenstein et al., 2019 |
| PSSRA | R783/R665 | B4, B7 | Rozenstein et al., 2019 |
| RVI | R842/R665 | B4, B8 | Rozenstein et al., 2019 |
| mNDVI705 | (R750 - R705)/( R750 + R705 - 2R445) | B1, B5, B6 | Datt, 1999 |
| mSR705 | (R750 - R445)/( R705 + R445) | B1, B6 | Datt, 1999 |
| SIPI | (R800 - R445)/( R800 - R680) | B1, B7 | Penuelas et al., 1995 |
| NDWI | (R865 - R1614)/( R865 - R1614) | B8A, B11 | McFeeters, 1996 |
R表示range, 其右下角数值表示光谱值范围.ARI, 花青素反射指数; ARVI, 耐大气植被指数; CRI, 类胡萝卜素反射指数; D, 双峰光学指数; DATT, DATT植被指数; EVI, 增强型植被指数; Gitelson, Gitelson植被指数; GNDVI, 绿色归一化差异植被指数; IPVI, 红外植被百分比指数; IRECI, 倒红边叶绿素指数; mNDVI705, 改进红边归一化植被指数; MSI, 水分胁迫指数; mSR705, 改进红边比值植被指数; NDI45, 归一化差异指数; NDII, 归一化红外指数; NDVI, 归一化植被指数; NDWI, 归一化差值水体指数; OSAVI, 优化型土壤调节植被指数; PSRI, 植物衰老反射指数; PSSRA, 特征色素简单比值指数; RVI, 比值植被指数; SARVI, 土壤大气阻抗植被指数; SAVI, 土壤调节植被指数; SIPI, 结构不敏感色素植被指数; SR, 比值植被指数; TCARI, 转换型叶绿素吸收植被指数; TNDVI, 转化后的归一化植被指数; WDVI, 加权差分植被指数. ...
Quantitative estimation of biomass of alpine grasslands using hyperspectral remote sensing
2
2019
... 本研究利用PLSR对地上群落生物量进行了反演, 反演精度R2 = 0.61 (RMSE = 94.15, p < 0.001), 此结果相比基于Sentinel-2数据估算草地生物量的研究精度更低.如, Kong等(2019)以高寒草地的植被为研究对象, 利用冠层光谱数据和生物量与MOD13 NDVI数据相结合, 基于逐步回归方法反演高山草地生物量, 拟合R2为0.869; Dou等(2020)以滨海湿地的植被为研究对象反演生物量的精度, R2大于0.85, 本研究结果与之相比精度略低, 这可能是受研究区域空间尺度的影响(Kong et al., 2019).不同草地类型的生物量遥感反演结果表明, 草地类型也是影响生物量估算精度的重要因子, 且多种草地类型的数据混合, 有利于提升模型的准确性(Shen et al., 2008), 本研究仅选择草甸草原, 可能会对结果产生一定影响. ...
... ., 2019).不同草地类型的生物量遥感反演结果表明, 草地类型也是影响生物量估算精度的重要因子, 且多种草地类型的数据混合, 有利于提升模型的准确性(Shen et al., 2008), 本研究仅选择草甸草原, 可能会对结果产生一定影响. ...
A distance-based framework for measuring functional diversity from multiple traits
2
2010
... 近年来, 以植物功能性状为基础的研究方法被广泛应用到各个尺度中, 根据不同的尺度, 可选用不同的性状指标评估特定尺度下生态系统的功能(Tilman et al., 1997; Walker et al., 1999; Gillison, 2013; 刘晓娟和马克平, 2015; 韩涛涛等, 2021).功能多样性是生物多样性的重要组成部分, 是解释和预测生态系统过程和功能的重要驱动力(Petchey & Gaston, 2002; Petchey et al., 2004), 反映了群落、景观、甚至区域尺度内功能性状的变异性, 决定了生态系统的功能和稳定性(Tilman, 1997; Ruiz-Benito et al., 2014).由于对于功能多样性的不同理解会产生不同的研究方法(Mason et al., 2003, 2005; Botta-Dukát, 2005; Laliberté & Legendre, 2010), 而这些方法对于植物功能性状选取、功能多样性计算、生态系统功能评估的影响较大, 因此有必要对功能多样性做一个统一的定义.Tilman (2001)认为功能多样性是影响生态系统功能的群落中所有物种及有机物的功能特征值及其变动范围, 强调的是特征值的差异性.由于此概念具有较强的概括性和可操作性, 因而被普遍接受并广泛用于计算生态系统结构与功能的各个方面(Petchey & Gaston, 2002; Mason et al., 2003, 2005; Petchey et al., 2004). ...
... 所有操作均使用R软件“FD”包(Laliberté & Legendre, 2010), 基于各样地每个物种的比叶面积、叶片含水量、叶绿素含量和总氮含量等生理性状与各物种在样地中的生物量占总生物量的比值, 计算FRic、FEve和FDiv指数. ...
Quantifying and interpreting functional diversity of natural communities: practical considerations matter
1
2006
... 在以往的研究中, 生态学家主要利用物种为基本单元的多样性指数来探讨群落间的物种多样性, 如: Shannon-Weiner指数, Simpson指数等(韩涛涛等, 2021).然而, 物种间的差异往往体现在长期进化过程中, 以物种为基本单元的研究很难体现不同生态系统间功能的差异(Naeem et al., 2012; Mouillot et al., 2013).植物功能性状能够适应环境变化, 并将环境与植物个体和生态系统结构、过程与功能联系起来(Díaz et al., 2004).基于植物功能性状和功能多样性的研究可以从植物的生长、防御、抵抗等不同的功能策略方面解释不同生态系统间的物种组成、功能特征, 从而有助于进一步理解它们的生态过程和功能(Tilman, 1997; Leps et al., 2006; 韩涛涛等, 2021). ...
刈割、施肥和浇水对高寒草甸物种多样性、功能多样性与初级生产力关系的影响
1
2011
... FEve与群落地上生物量的关系最弱, 且呈负相关关系, 即群落生产力随FEve的增加而降低, 说明生产力可能主要源于对某一资源集中利用的物种的生物量.FEve被用作指示资源的利用程度, 低的均匀度表示有些生态位空间虽被占据但未充分利用, 不对生物量的增加起促进作用.本研究结果支持“质量比”假说, 即群落中起支配作用的物种的属性和相对多度对生态系统过程有决定性作用(Grime, 1998), 优势种利用了大部分资源, 而非优势种则对生物量的贡献较小, 因此地上生物量随FEve的降低而升高(马文静, 2014).FDiv与地上生物量间的相关性并不显著, 功能离散度表示群落功能性状的多度在性状空间内的离散程度, 离散度高说明植物在性状空间边缘较多分布.研究结果显示, 地上生物量随FDiv的增加表现出降低趋势, 可能是由于可利用资源较少, 使得植物功能性状的分布发生改变, 为了获取更多资源, 植物性状不在边缘聚集, 也与之前的研究结果(李晓刚等, 2011; 王海东等, 2013)一致.有研究发现FDiv对生产力的影响在施肥或者干扰的条件下显著, 说明在资源条件较好的情况下, 植物种间竞争增强, 促进了植物不同功能性状的分化, 有利于植物生存和对资源的有效利用, 群落生产力增加(Bernhardt et al., 2011). ...
植物功能性状研究进展
1
2015
... 近年来, 以植物功能性状为基础的研究方法被广泛应用到各个尺度中, 根据不同的尺度, 可选用不同的性状指标评估特定尺度下生态系统的功能(Tilman et al., 1997; Walker et al., 1999; Gillison, 2013; 刘晓娟和马克平, 2015; 韩涛涛等, 2021).功能多样性是生物多样性的重要组成部分, 是解释和预测生态系统过程和功能的重要驱动力(Petchey & Gaston, 2002; Petchey et al., 2004), 反映了群落、景观、甚至区域尺度内功能性状的变异性, 决定了生态系统的功能和稳定性(Tilman, 1997; Ruiz-Benito et al., 2014).由于对于功能多样性的不同理解会产生不同的研究方法(Mason et al., 2003, 2005; Botta-Dukát, 2005; Laliberté & Legendre, 2010), 而这些方法对于植物功能性状选取、功能多样性计算、生态系统功能评估的影响较大, 因此有必要对功能多样性做一个统一的定义.Tilman (2001)认为功能多样性是影响生态系统功能的群落中所有物种及有机物的功能特征值及其变动范围, 强调的是特征值的差异性.由于此概念具有较强的概括性和可操作性, 因而被普遍接受并广泛用于计算生态系统结构与功能的各个方面(Petchey & Gaston, 2002; Mason et al., 2003, 2005; Petchey et al., 2004). ...
Biodiversity and ecosystem functioning: current knowledge and future challenges
1
2001
... 越来越多的研究证明, 功能多样性即群落中物种的功能差异性(Tilman, 2001; Petchey & Gaston, 2002)是生态系统过程的决定因素(Díaz & Cabido, 2001; Loreau et al., 2001; 臧岳铭等, 2009).植物功能性状是研究生态系统结构与功能变化的中间桥梁(孙国钧等, 2003).Wan等(2011)指出可以通过改变植物的种类组成和性状来影响区域尺度上的功能多样性, 本研究所选的生态系统功能仅为地上生物量, 覆盖面较小.因此, 研究各性状有何种功能, 各种性状组合计算得到的功能多样性具体又指代生态系统的何种功能, 可作为下一步研究的重点. ...
1
2014
... FEve与群落地上生物量的关系最弱, 且呈负相关关系, 即群落生产力随FEve的增加而降低, 说明生产力可能主要源于对某一资源集中利用的物种的生物量.FEve被用作指示资源的利用程度, 低的均匀度表示有些生态位空间虽被占据但未充分利用, 不对生物量的增加起促进作用.本研究结果支持“质量比”假说, 即群落中起支配作用的物种的属性和相对多度对生态系统过程有决定性作用(Grime, 1998), 优势种利用了大部分资源, 而非优势种则对生物量的贡献较小, 因此地上生物量随FEve的降低而升高(马文静, 2014).FDiv与地上生物量间的相关性并不显著, 功能离散度表示群落功能性状的多度在性状空间内的离散程度, 离散度高说明植物在性状空间边缘较多分布.研究结果显示, 地上生物量随FDiv的增加表现出降低趋势, 可能是由于可利用资源较少, 使得植物功能性状的分布发生改变, 为了获取更多资源, 植物性状不在边缘聚集, 也与之前的研究结果(李晓刚等, 2011; 王海东等, 2013)一致.有研究发现FDiv对生产力的影响在施肥或者干扰的条件下显著, 说明在资源条件较好的情况下, 植物种间竞争增强, 促进了植物不同功能性状的分化, 有利于植物生存和对资源的有效利用, 群落生产力增加(Bernhardt et al., 2011). ...
A ratio vegetation index adjusted for soil brightness
1
1990
... Calculating formula of vegetation index
Table 1 植被指数
Vegetation index | 计算公式
Calculate formula | Sentinel-2波段
Sentinel-2 band used | 参考文献
Reference |
| TCARI | 3[(R699.19 - R668.98) - 0.2(R699.19 - R550.67)(R699.19/R668.98)] | B3, B4, B5 | Kim et al., 1994 |
| OSAVI | (1 + 0.16)(R750 - R705)/(R750 + R705 + 0.16) | B5, B6 | Wu et al., 2008 |
| OSAVI2 | (1 + 0.16) (R800 - R670)/(R800 + R670 + 0.16) | B4, B7 | Rondeaux et al., 1996 |
| D | R730/R706 | B5, B6 | Zarco-Tejada et al., 2003 |
| Datt | (R850 - R710)/(R850 - R680) | B4, B5, B8 | Datt, 1999 |
| Datt2 | R850/R710 | B5, B8 | Datt, 1999 |
| Gitelson | 1/R700 | B5 | Gitelson et al., 1999 |
| SR | R750/R700 | B5, B6 | Gitelson & Merzlyak, 1997 |
| SR2 | R700/R670 | B4, B5 | McMurtrey III et al., 1994 |
| MSI | R1600/R819 | B8, B11 | Hunt Jr & Rock, 1989 |
| NDVI705 | (R750 - R705)/( R750 + R705) | B5, B6 | Sims & Gamon, 2002 |
| CRI1 | 1/R510 - 1/R550 | B2, B3 | Gitelson et al., 2003 |
| CRI2 | 1/R510 - 1/R700 | B2, B5 | Gitelson et al., 2002 |
| ARI1 | 1/R550 - 1/R700 | B3, B5 | Sims & Gamon, 2002 |
| ARI2 | R800(1/R550 - 1/R700) | B3, B5, B7 | Gitelson et al., 2002 |
| NDVI | (R842 - R665)/(R842 + R665) | B4, B8 | Huete et al., 1997 |
| GNDVI | (R783 - R560)/(R783 + R560) | B3, B7 | Rozenstein et al., 2019 |
| TNDVI | [(R842 - R665)/(R842 + R665) + 0.5]0.5 | B4, B8 | Rozenstein et al., 2019 |
| WDVI | R842 - 0.5R665 | B4, B8 | Rozenstein et al., 2019 |
| NDI45 | (R705 - R665)/(R705 + R665) | B4, B5 | Delegido et al., 2011 |
| SAVI | (1 + 0.5) × (R799.09 - R680.045)/(R799.09 + R680.045 + 0.5) | B4, B7 | Huete, 1988 |
| SAVI2 | R799.09/(R680.045 + b/a) (a = 0.97, b = 0.08) | B4, B7 | Major et al., 1990 |
| ARVI | ARVI = (R799.09 -R680.045 + R444.5 + R680.045)/(R799.09 + R680.045 - R444.5 - R680.045) | B1, B4, B7 | Kaufman & Tanre, 1992 |
| SARVI | RB = R680.045 - (R444.5 - R680.045)
SARVI = (1 + 0.5)(R799.09 -R680.045 + R444.5 + R680.045)/(R799.09 + R680.045 -
R444.5 - R680.045 + 0.5) | B1, B4, B7 | Kaufman & Tanre, 1992 |
| EVI | 2.5(R799.09 - R680.045)/(R799.09 + 6R680.045 - 7.5R444.5 + 1) | B1, B4, B7 | Huete et al., 1997 |
| IRECI | (R783 - R665)/(R705/R740) | B4, B5, B6, B7 | Frampton et al., 2013 |
| IPVI | R842/(R842 + R665) | B4, B8 | Rozenstein et al., 2019 |
| PSSRA | R783/R665 | B4, B7 | Rozenstein et al., 2019 |
| RVI | R842/R665 | B4, B8 | Rozenstein et al., 2019 |
| mNDVI705 | (R750 - R705)/( R750 + R705 - 2R445) | B1, B5, B6 | Datt, 1999 |
| mSR705 | (R750 - R445)/( R705 + R445) | B1, B6 | Datt, 1999 |
| SIPI | (R800 - R445)/( R800 - R680) | B1, B7 | Penuelas et al., 1995 |
| NDWI | (R865 - R1614)/( R865 - R1614) | B8A, B11 | McFeeters, 1996 |
R表示range, 其右下角数值表示光谱值范围.ARI, 花青素反射指数; ARVI, 耐大气植被指数; CRI, 类胡萝卜素反射指数; D, 双峰光学指数; DATT, DATT植被指数; EVI, 增强型植被指数; Gitelson, Gitelson植被指数; GNDVI, 绿色归一化差异植被指数; IPVI, 红外植被百分比指数; IRECI, 倒红边叶绿素指数; mNDVI705, 改进红边归一化植被指数; MSI, 水分胁迫指数; mSR705, 改进红边比值植被指数; NDI45, 归一化差异指数; NDII, 归一化红外指数; NDVI, 归一化植被指数; NDWI, 归一化差值水体指数; OSAVI, 优化型土壤调节植被指数; PSRI, 植物衰老反射指数; PSSRA, 特征色素简单比值指数; RVI, 比值植被指数; SARVI, 土壤大气阻抗植被指数; SAVI, 土壤调节植被指数; SIPI, 结构不敏感色素植被指数; SR, 比值植被指数; TCARI, 转换型叶绿素吸收植被指数; TNDVI, 转化后的归一化植被指数; WDVI, 加权差分植被指数. ...
A random forest modelling procedure for a multi-sensor assessment of tree species diversity
1
2020
... 另一方面, 尽管基于遥感的功能多样性监测在森林中得到了很好的应用, 如利用机载激光雷达、成像光谱学和高光谱数据获取森林冠层或叶片性状, 成功估算热带森林的功能多样性及其变化(Asner et al., 2017; Durán et al., 2019).但相比于森林生态系统, 草地物种个体小, Sentinel-2数据计算的不是各物种间的变异而是像元所代表的群落间的变异, 估算精度也会存在一定差异(Mallinis et al., 2020).因此, 当影像空间分辨率提升到草地物种个体大小(cm级), 功能多样性的估算精度可能会有所提升.进一步, 高光谱数据的应用也会提升功能性状的反演精度, 进而提升功能多样性的反演精度.无人机具有成本低、操作灵活的优点, 结合地面调查, 辅以高光谱传感器, 可实现对高空间、高光谱和高时间分辨率的草地功能多样性监测, 进一步集成地面观测, 构建多维度、多尺度、高频率的天空地一体化草地多样性监测技术体系, 促使遥感技术方法与生态学理论的有机融合, 为实现小尺度研究到大尺度监测的无缝链接提供了强有力的技术手段. ...
Diversity of leaf traits related to productivity in 31 Populus deltoides × Populus nigra clones
1
2005
... 本研究中遥感预测的功能多样性与地上生物量的关系与实测相一致, 证明了基于遥感反演分析两者关系的潜力.通过遥感预测功能多样性与地上群落生物量的关系发现, FRic对群落地上生物量的解释度最高(R2 = 0.40), 而FEve (R2 = 0.27)和FDiv (R2 = 0.28)与群落地上生物量关系较弱, 这与Zhao等(2021)的研究结果一致.植物的光合作用是物质生产的主要来源(Blackburn, 2007), 与光合作用有关的叶片性状叶绿素、类胡萝卜素和叶片氮含量等与群落生产力直接相关(Marron et al., 2005; da Silveira Pontes et al., 2010; Durán et al., 2019).本研究中用于计算功能多样性的叶绿素含量、比叶面积、叶片氮含量和叶片含水量4种功能性状均被大量研究证实与生产力直接或间接相关, 随着这4种功能性状在植物体内含量的增加, 物种光合作用加强, FRic增加, 生产力上升(Cadotte et al., 2011; Fyllas et al., 2017; Durán et al., 2019).Bernhardt等(2011)的研究结果也表明群落生产力有随着FRic指数增加而增加的趋势. ...
An index of functional diversity
2
2003
... 近年来, 以植物功能性状为基础的研究方法被广泛应用到各个尺度中, 根据不同的尺度, 可选用不同的性状指标评估特定尺度下生态系统的功能(Tilman et al., 1997; Walker et al., 1999; Gillison, 2013; 刘晓娟和马克平, 2015; 韩涛涛等, 2021).功能多样性是生物多样性的重要组成部分, 是解释和预测生态系统过程和功能的重要驱动力(Petchey & Gaston, 2002; Petchey et al., 2004), 反映了群落、景观、甚至区域尺度内功能性状的变异性, 决定了生态系统的功能和稳定性(Tilman, 1997; Ruiz-Benito et al., 2014).由于对于功能多样性的不同理解会产生不同的研究方法(Mason et al., 2003, 2005; Botta-Dukát, 2005; Laliberté & Legendre, 2010), 而这些方法对于植物功能性状选取、功能多样性计算、生态系统功能评估的影响较大, 因此有必要对功能多样性做一个统一的定义.Tilman (2001)认为功能多样性是影响生态系统功能的群落中所有物种及有机物的功能特征值及其变动范围, 强调的是特征值的差异性.由于此概念具有较强的概括性和可操作性, 因而被普遍接受并广泛用于计算生态系统结构与功能的各个方面(Petchey & Gaston, 2002; Mason et al., 2003, 2005; Petchey et al., 2004). ...
... ., 2003, 2005; Petchey et al., 2004). ...
Functional richness, functional evenness and functional divergence: the primary components of functional diversity
2
2005
... 近年来, 以植物功能性状为基础的研究方法被广泛应用到各个尺度中, 根据不同的尺度, 可选用不同的性状指标评估特定尺度下生态系统的功能(Tilman et al., 1997; Walker et al., 1999; Gillison, 2013; 刘晓娟和马克平, 2015; 韩涛涛等, 2021).功能多样性是生物多样性的重要组成部分, 是解释和预测生态系统过程和功能的重要驱动力(Petchey & Gaston, 2002; Petchey et al., 2004), 反映了群落、景观、甚至区域尺度内功能性状的变异性, 决定了生态系统的功能和稳定性(Tilman, 1997; Ruiz-Benito et al., 2014).由于对于功能多样性的不同理解会产生不同的研究方法(Mason et al., 2003, 2005; Botta-Dukát, 2005; Laliberté & Legendre, 2010), 而这些方法对于植物功能性状选取、功能多样性计算、生态系统功能评估的影响较大, 因此有必要对功能多样性做一个统一的定义.Tilman (2001)认为功能多样性是影响生态系统功能的群落中所有物种及有机物的功能特征值及其变动范围, 强调的是特征值的差异性.由于此概念具有较强的概括性和可操作性, 因而被普遍接受并广泛用于计算生态系统结构与功能的各个方面(Petchey & Gaston, 2002; Mason et al., 2003, 2005; Petchey et al., 2004). ...
... , 2005; Petchey et al., 2004). ...
The use of the normalized difference water index (NDWI) in the delineation of open water features
1
1996
... Calculating formula of vegetation index
Table 1 植被指数
Vegetation index | 计算公式
Calculate formula | Sentinel-2波段
Sentinel-2 band used | 参考文献
Reference |
| TCARI | 3[(R699.19 - R668.98) - 0.2(R699.19 - R550.67)(R699.19/R668.98)] | B3, B4, B5 | Kim et al., 1994 |
| OSAVI | (1 + 0.16)(R750 - R705)/(R750 + R705 + 0.16) | B5, B6 | Wu et al., 2008 |
| OSAVI2 | (1 + 0.16) (R800 - R670)/(R800 + R670 + 0.16) | B4, B7 | Rondeaux et al., 1996 |
| D | R730/R706 | B5, B6 | Zarco-Tejada et al., 2003 |
| Datt | (R850 - R710)/(R850 - R680) | B4, B5, B8 | Datt, 1999 |
| Datt2 | R850/R710 | B5, B8 | Datt, 1999 |
| Gitelson | 1/R700 | B5 | Gitelson et al., 1999 |
| SR | R750/R700 | B5, B6 | Gitelson & Merzlyak, 1997 |
| SR2 | R700/R670 | B4, B5 | McMurtrey III et al., 1994 |
| MSI | R1600/R819 | B8, B11 | Hunt Jr & Rock, 1989 |
| NDVI705 | (R750 - R705)/( R750 + R705) | B5, B6 | Sims & Gamon, 2002 |
| CRI1 | 1/R510 - 1/R550 | B2, B3 | Gitelson et al., 2003 |
| CRI2 | 1/R510 - 1/R700 | B2, B5 | Gitelson et al., 2002 |
| ARI1 | 1/R550 - 1/R700 | B3, B5 | Sims & Gamon, 2002 |
| ARI2 | R800(1/R550 - 1/R700) | B3, B5, B7 | Gitelson et al., 2002 |
| NDVI | (R842 - R665)/(R842 + R665) | B4, B8 | Huete et al., 1997 |
| GNDVI | (R783 - R560)/(R783 + R560) | B3, B7 | Rozenstein et al., 2019 |
| TNDVI | [(R842 - R665)/(R842 + R665) + 0.5]0.5 | B4, B8 | Rozenstein et al., 2019 |
| WDVI | R842 - 0.5R665 | B4, B8 | Rozenstein et al., 2019 |
| NDI45 | (R705 - R665)/(R705 + R665) | B4, B5 | Delegido et al., 2011 |
| SAVI | (1 + 0.5) × (R799.09 - R680.045)/(R799.09 + R680.045 + 0.5) | B4, B7 | Huete, 1988 |
| SAVI2 | R799.09/(R680.045 + b/a) (a = 0.97, b = 0.08) | B4, B7 | Major et al., 1990 |
| ARVI | ARVI = (R799.09 -R680.045 + R444.5 + R680.045)/(R799.09 + R680.045 - R444.5 - R680.045) | B1, B4, B7 | Kaufman & Tanre, 1992 |
| SARVI | RB = R680.045 - (R444.5 - R680.045)
SARVI = (1 + 0.5)(R799.09 -R680.045 + R444.5 + R680.045)/(R799.09 + R680.045 -
R444.5 - R680.045 + 0.5) | B1, B4, B7 | Kaufman & Tanre, 1992 |
| EVI | 2.5(R799.09 - R680.045)/(R799.09 + 6R680.045 - 7.5R444.5 + 1) | B1, B4, B7 | Huete et al., 1997 |
| IRECI | (R783 - R665)/(R705/R740) | B4, B5, B6, B7 | Frampton et al., 2013 |
| IPVI | R842/(R842 + R665) | B4, B8 | Rozenstein et al., 2019 |
| PSSRA | R783/R665 | B4, B7 | Rozenstein et al., 2019 |
| RVI | R842/R665 | B4, B8 | Rozenstein et al., 2019 |
| mNDVI705 | (R750 - R705)/( R750 + R705 - 2R445) | B1, B5, B6 | Datt, 1999 |
| mSR705 | (R750 - R445)/( R705 + R445) | B1, B6 | Datt, 1999 |
| SIPI | (R800 - R445)/( R800 - R680) | B1, B7 | Penuelas et al., 1995 |
| NDWI | (R865 - R1614)/( R865 - R1614) | B8A, B11 | McFeeters, 1996 |
R表示range, 其右下角数值表示光谱值范围.ARI, 花青素反射指数; ARVI, 耐大气植被指数; CRI, 类胡萝卜素反射指数; D, 双峰光学指数; DATT, DATT植被指数; EVI, 增强型植被指数; Gitelson, Gitelson植被指数; GNDVI, 绿色归一化差异植被指数; IPVI, 红外植被百分比指数; IRECI, 倒红边叶绿素指数; mNDVI705, 改进红边归一化植被指数; MSI, 水分胁迫指数; mSR705, 改进红边比值植被指数; NDI45, 归一化差异指数; NDII, 归一化红外指数; NDVI, 归一化植被指数; NDWI, 归一化差值水体指数; OSAVI, 优化型土壤调节植被指数; PSRI, 植物衰老反射指数; PSSRA, 特征色素简单比值指数; RVI, 比值植被指数; SARVI, 土壤大气阻抗植被指数; SAVI, 土壤调节植被指数; SIPI, 结构不敏感色素植被指数; SR, 比值植被指数; TCARI, 转换型叶绿素吸收植被指数; TNDVI, 转化后的归一化植被指数; WDVI, 加权差分植被指数. ...
Distinguishing nitrogen fertilization levels in field corn (Zea mays L.) with actively induced fluorescence and passive reflectance measurements
1
1994
... Calculating formula of vegetation index
Table 1 植被指数
Vegetation index | 计算公式
Calculate formula | Sentinel-2波段
Sentinel-2 band used | 参考文献
Reference |
| TCARI | 3[(R699.19 - R668.98) - 0.2(R699.19 - R550.67)(R699.19/R668.98)] | B3, B4, B5 | Kim et al., 1994 |
| OSAVI | (1 + 0.16)(R750 - R705)/(R750 + R705 + 0.16) | B5, B6 | Wu et al., 2008 |
| OSAVI2 | (1 + 0.16) (R800 - R670)/(R800 + R670 + 0.16) | B4, B7 | Rondeaux et al., 1996 |
| D | R730/R706 | B5, B6 | Zarco-Tejada et al., 2003 |
| Datt | (R850 - R710)/(R850 - R680) | B4, B5, B8 | Datt, 1999 |
| Datt2 | R850/R710 | B5, B8 | Datt, 1999 |
| Gitelson | 1/R700 | B5 | Gitelson et al., 1999 |
| SR | R750/R700 | B5, B6 | Gitelson & Merzlyak, 1997 |
| SR2 | R700/R670 | B4, B5 | McMurtrey III et al., 1994 |
| MSI | R1600/R819 | B8, B11 | Hunt Jr & Rock, 1989 |
| NDVI705 | (R750 - R705)/( R750 + R705) | B5, B6 | Sims & Gamon, 2002 |
| CRI1 | 1/R510 - 1/R550 | B2, B3 | Gitelson et al., 2003 |
| CRI2 | 1/R510 - 1/R700 | B2, B5 | Gitelson et al., 2002 |
| ARI1 | 1/R550 - 1/R700 | B3, B5 | Sims & Gamon, 2002 |
| ARI2 | R800(1/R550 - 1/R700) | B3, B5, B7 | Gitelson et al., 2002 |
| NDVI | (R842 - R665)/(R842 + R665) | B4, B8 | Huete et al., 1997 |
| GNDVI | (R783 - R560)/(R783 + R560) | B3, B7 | Rozenstein et al., 2019 |
| TNDVI | [(R842 - R665)/(R842 + R665) + 0.5]0.5 | B4, B8 | Rozenstein et al., 2019 |
| WDVI | R842 - 0.5R665 | B4, B8 | Rozenstein et al., 2019 |
| NDI45 | (R705 - R665)/(R705 + R665) | B4, B5 | Delegido et al., 2011 |
| SAVI | (1 + 0.5) × (R799.09 - R680.045)/(R799.09 + R680.045 + 0.5) | B4, B7 | Huete, 1988 |
| SAVI2 | R799.09/(R680.045 + b/a) (a = 0.97, b = 0.08) | B4, B7 | Major et al., 1990 |
| ARVI | ARVI = (R799.09 -R680.045 + R444.5 + R680.045)/(R799.09 + R680.045 - R444.5 - R680.045) | B1, B4, B7 | Kaufman & Tanre, 1992 |
| SARVI | RB = R680.045 - (R444.5 - R680.045)
SARVI = (1 + 0.5)(R799.09 -R680.045 + R444.5 + R680.045)/(R799.09 + R680.045 -
R444.5 - R680.045 + 0.5) | B1, B4, B7 | Kaufman & Tanre, 1992 |
| EVI | 2.5(R799.09 - R680.045)/(R799.09 + 6R680.045 - 7.5R444.5 + 1) | B1, B4, B7 | Huete et al., 1997 |
| IRECI | (R783 - R665)/(R705/R740) | B4, B5, B6, B7 | Frampton et al., 2013 |
| IPVI | R842/(R842 + R665) | B4, B8 | Rozenstein et al., 2019 |
| PSSRA | R783/R665 | B4, B7 | Rozenstein et al., 2019 |
| RVI | R842/R665 | B4, B8 | Rozenstein et al., 2019 |
| mNDVI705 | (R750 - R705)/( R750 + R705 - 2R445) | B1, B5, B6 | Datt, 1999 |
| mSR705 | (R750 - R445)/( R705 + R445) | B1, B6 | Datt, 1999 |
| SIPI | (R800 - R445)/( R800 - R680) | B1, B7 | Penuelas et al., 1995 |
| NDWI | (R865 - R1614)/( R865 - R1614) | B8A, B11 | McFeeters, 1996 |
R表示range, 其右下角数值表示光谱值范围.ARI, 花青素反射指数; ARVI, 耐大气植被指数; CRI, 类胡萝卜素反射指数; D, 双峰光学指数; DATT, DATT植被指数; EVI, 增强型植被指数; Gitelson, Gitelson植被指数; GNDVI, 绿色归一化差异植被指数; IPVI, 红外植被百分比指数; IRECI, 倒红边叶绿素指数; mNDVI705, 改进红边归一化植被指数; MSI, 水分胁迫指数; mSR705, 改进红边比值植被指数; NDI45, 归一化差异指数; NDII, 归一化红外指数; NDVI, 归一化植被指数; NDWI, 归一化差值水体指数; OSAVI, 优化型土壤调节植被指数; PSRI, 植物衰老反射指数; PSSRA, 特征色素简单比值指数; RVI, 比值植被指数; SARVI, 土壤大气阻抗植被指数; SAVI, 土壤调节植被指数; SIPI, 结构不敏感色素植被指数; SR, 比值植被指数; TCARI, 转换型叶绿素吸收植被指数; TNDVI, 转化后的归一化植被指数; WDVI, 加权差分植被指数. ...
A functional approach reveals community responses to disturbances
1
2013
... 在以往的研究中, 生态学家主要利用物种为基本单元的多样性指数来探讨群落间的物种多样性, 如: Shannon-Weiner指数, Simpson指数等(韩涛涛等, 2021).然而, 物种间的差异往往体现在长期进化过程中, 以物种为基本单元的研究很难体现不同生态系统间功能的差异(Naeem et al., 2012; Mouillot et al., 2013).植物功能性状能够适应环境变化, 并将环境与植物个体和生态系统结构、过程与功能联系起来(Díaz et al., 2004).基于植物功能性状和功能多样性的研究可以从植物的生长、防御、抵抗等不同的功能策略方面解释不同生态系统间的物种组成、功能特征, 从而有助于进一步理解它们的生态过程和功能(Tilman, 1997; Leps et al., 2006; 韩涛涛等, 2021). ...
Functional regularity: a neglected aspect of functional diversity
1
2005
... 早期对于功能多样性的研究大多采用物种多样性及功能型组, 但随着计算机技术的高速发展, 很多复杂的数学公式被引入到功能多样性的研究中, 例如用影响生态系统结构与功能的功能性状替代物种间的遗传距离, 从而可以得出一些计算功能多样性的方法(Botta-Dukát, 2005; Violle et al., 2007).随后, 研究者们认为仅采用一种指数难以代表生态系统功能多样性(Mouillot et al., 2005), 从而将功能多样性进一步细分为: (1)功能丰富度(FRic); (2)功能均匀度(FEve); (3)功能离散度(FDiv)(Villéger et al., 2008).功能丰富度代表群落中物种占据生态位空间的大小, 体现的是生态位空间利用程度的指数, 常使用物种或群落生态位中性状空间的凸包体积计算获得, 而功能均匀度和功能离散度则代表生态位空间中功能性状分布的均匀程度或离散程度. ...
The functions of biological diversity in an age of extinction
1
2012
... 在以往的研究中, 生态学家主要利用物种为基本单元的多样性指数来探讨群落间的物种多样性, 如: Shannon-Weiner指数, Simpson指数等(韩涛涛等, 2021).然而, 物种间的差异往往体现在长期进化过程中, 以物种为基本单元的研究很难体现不同生态系统间功能的差异(Naeem et al., 2012; Mouillot et al., 2013).植物功能性状能够适应环境变化, 并将环境与植物个体和生态系统结构、过程与功能联系起来(Díaz et al., 2004).基于植物功能性状和功能多样性的研究可以从植物的生长、防御、抵抗等不同的功能策略方面解释不同生态系统间的物种组成、功能特征, 从而有助于进一步理解它们的生态过程和功能(Tilman, 1997; Leps et al., 2006; 韩涛涛等, 2021). ...
The role of space agencies in remotely sensed essential biodiversity variables
1
2016
... 当前的功能多样性监测主要以机载和星载的高光谱遥感数据为主, 相较于机载高光谱遥感, 星载高光谱遥感观测尺度更大、监测时间序列更长、数据获取成本更低(Saatchi et al., 2008; Paganini et al., 2016).Sentinel-2号卫星数据作为目前可免费获取的最高空间分辨率的多光谱遥感数据, 是唯一一个在红边范围内含有3个波段的卫星遥感数据, 对监测植被健康十分重要.本研究拟利用Sentinel-2影像, 在内蒙古自治区锡林郭勒盟乌拉盖管理区草甸草原, 探究利用逐步回归、随机森林(RFR)、PLSR 3种方法的草地植物功能多样性反演精度, 进一步分析遥感反演的草地功能多样性与生产力的关系, 为能在大尺度上进行草地功能多样性的评估提供可行的方法和依据, 为草地利用与管理提供参考. ...
Semi-empirical indices to assess carotenoids/chlorophyll-a ratio from leaf spectral reflectance
1
1995
... Calculating formula of vegetation index
Table 1 植被指数
Vegetation index | 计算公式
Calculate formula | Sentinel-2波段
Sentinel-2 band used | 参考文献
Reference |
| TCARI | 3[(R699.19 - R668.98) - 0.2(R699.19 - R550.67)(R699.19/R668.98)] | B3, B4, B5 | Kim et al., 1994 |
| OSAVI | (1 + 0.16)(R750 - R705)/(R750 + R705 + 0.16) | B5, B6 | Wu et al., 2008 |
| OSAVI2 | (1 + 0.16) (R800 - R670)/(R800 + R670 + 0.16) | B4, B7 | Rondeaux et al., 1996 |
| D | R730/R706 | B5, B6 | Zarco-Tejada et al., 2003 |
| Datt | (R850 - R710)/(R850 - R680) | B4, B5, B8 | Datt, 1999 |
| Datt2 | R850/R710 | B5, B8 | Datt, 1999 |
| Gitelson | 1/R700 | B5 | Gitelson et al., 1999 |
| SR | R750/R700 | B5, B6 | Gitelson & Merzlyak, 1997 |
| SR2 | R700/R670 | B4, B5 | McMurtrey III et al., 1994 |
| MSI | R1600/R819 | B8, B11 | Hunt Jr & Rock, 1989 |
| NDVI705 | (R750 - R705)/( R750 + R705) | B5, B6 | Sims & Gamon, 2002 |
| CRI1 | 1/R510 - 1/R550 | B2, B3 | Gitelson et al., 2003 |
| CRI2 | 1/R510 - 1/R700 | B2, B5 | Gitelson et al., 2002 |
| ARI1 | 1/R550 - 1/R700 | B3, B5 | Sims & Gamon, 2002 |
| ARI2 | R800(1/R550 - 1/R700) | B3, B5, B7 | Gitelson et al., 2002 |
| NDVI | (R842 - R665)/(R842 + R665) | B4, B8 | Huete et al., 1997 |
| GNDVI | (R783 - R560)/(R783 + R560) | B3, B7 | Rozenstein et al., 2019 |
| TNDVI | [(R842 - R665)/(R842 + R665) + 0.5]0.5 | B4, B8 | Rozenstein et al., 2019 |
| WDVI | R842 - 0.5R665 | B4, B8 | Rozenstein et al., 2019 |
| NDI45 | (R705 - R665)/(R705 + R665) | B4, B5 | Delegido et al., 2011 |
| SAVI | (1 + 0.5) × (R799.09 - R680.045)/(R799.09 + R680.045 + 0.5) | B4, B7 | Huete, 1988 |
| SAVI2 | R799.09/(R680.045 + b/a) (a = 0.97, b = 0.08) | B4, B7 | Major et al., 1990 |
| ARVI | ARVI = (R799.09 -R680.045 + R444.5 + R680.045)/(R799.09 + R680.045 - R444.5 - R680.045) | B1, B4, B7 | Kaufman & Tanre, 1992 |
| SARVI | RB = R680.045 - (R444.5 - R680.045)
SARVI = (1 + 0.5)(R799.09 -R680.045 + R444.5 + R680.045)/(R799.09 + R680.045 -
R444.5 - R680.045 + 0.5) | B1, B4, B7 | Kaufman & Tanre, 1992 |
| EVI | 2.5(R799.09 - R680.045)/(R799.09 + 6R680.045 - 7.5R444.5 + 1) | B1, B4, B7 | Huete et al., 1997 |
| IRECI | (R783 - R665)/(R705/R740) | B4, B5, B6, B7 | Frampton et al., 2013 |
| IPVI | R842/(R842 + R665) | B4, B8 | Rozenstein et al., 2019 |
| PSSRA | R783/R665 | B4, B7 | Rozenstein et al., 2019 |
| RVI | R842/R665 | B4, B8 | Rozenstein et al., 2019 |
| mNDVI705 | (R750 - R705)/( R750 + R705 - 2R445) | B1, B5, B6 | Datt, 1999 |
| mSR705 | (R750 - R445)/( R705 + R445) | B1, B6 | Datt, 1999 |
| SIPI | (R800 - R445)/( R800 - R680) | B1, B7 | Penuelas et al., 1995 |
| NDWI | (R865 - R1614)/( R865 - R1614) | B8A, B11 | McFeeters, 1996 |
R表示range, 其右下角数值表示光谱值范围.ARI, 花青素反射指数; ARVI, 耐大气植被指数; CRI, 类胡萝卜素反射指数; D, 双峰光学指数; DATT, DATT植被指数; EVI, 增强型植被指数; Gitelson, Gitelson植被指数; GNDVI, 绿色归一化差异植被指数; IPVI, 红外植被百分比指数; IRECI, 倒红边叶绿素指数; mNDVI705, 改进红边归一化植被指数; MSI, 水分胁迫指数; mSR705, 改进红边比值植被指数; NDI45, 归一化差异指数; NDII, 归一化红外指数; NDVI, 归一化植被指数; NDWI, 归一化差值水体指数; OSAVI, 优化型土壤调节植被指数; PSRI, 植物衰老反射指数; PSSRA, 特征色素简单比值指数; RVI, 比值植被指数; SARVI, 土壤大气阻抗植被指数; SAVI, 土壤调节植被指数; SIPI, 结构不敏感色素植被指数; SR, 比值植被指数; TCARI, 转换型叶绿素吸收植被指数; TNDVI, 转化后的归一化植被指数; WDVI, 加权差分植被指数. ...
Functional diversity (FD), species richness and community composition
3
2002
... 近年来, 以植物功能性状为基础的研究方法被广泛应用到各个尺度中, 根据不同的尺度, 可选用不同的性状指标评估特定尺度下生态系统的功能(Tilman et al., 1997; Walker et al., 1999; Gillison, 2013; 刘晓娟和马克平, 2015; 韩涛涛等, 2021).功能多样性是生物多样性的重要组成部分, 是解释和预测生态系统过程和功能的重要驱动力(Petchey & Gaston, 2002; Petchey et al., 2004), 反映了群落、景观、甚至区域尺度内功能性状的变异性, 决定了生态系统的功能和稳定性(Tilman, 1997; Ruiz-Benito et al., 2014).由于对于功能多样性的不同理解会产生不同的研究方法(Mason et al., 2003, 2005; Botta-Dukát, 2005; Laliberté & Legendre, 2010), 而这些方法对于植物功能性状选取、功能多样性计算、生态系统功能评估的影响较大, 因此有必要对功能多样性做一个统一的定义.Tilman (2001)认为功能多样性是影响生态系统功能的群落中所有物种及有机物的功能特征值及其变动范围, 强调的是特征值的差异性.由于此概念具有较强的概括性和可操作性, 因而被普遍接受并广泛用于计算生态系统结构与功能的各个方面(Petchey & Gaston, 2002; Mason et al., 2003, 2005; Petchey et al., 2004). ...
... )认为功能多样性是影响生态系统功能的群落中所有物种及有机物的功能特征值及其变动范围, 强调的是特征值的差异性.由于此概念具有较强的概括性和可操作性, 因而被普遍接受并广泛用于计算生态系统结构与功能的各个方面(Petchey & Gaston, 2002; Mason et al., 2003, 2005; Petchey et al., 2004). ...
... 越来越多的研究证明, 功能多样性即群落中物种的功能差异性(Tilman, 2001; Petchey & Gaston, 2002)是生态系统过程的决定因素(Díaz & Cabido, 2001; Loreau et al., 2001; 臧岳铭等, 2009).植物功能性状是研究生态系统结构与功能变化的中间桥梁(孙国钧等, 2003).Wan等(2011)指出可以通过改变植物的种类组成和性状来影响区域尺度上的功能多样性, 本研究所选的生态系统功能仅为地上生物量, 覆盖面较小.因此, 研究各性状有何种功能, 各种性状组合计算得到的功能多样性具体又指代生态系统的何种功能, 可作为下一步研究的重点. ...
How do different measures of functional diversity perform?
2
2004
... 近年来, 以植物功能性状为基础的研究方法被广泛应用到各个尺度中, 根据不同的尺度, 可选用不同的性状指标评估特定尺度下生态系统的功能(Tilman et al., 1997; Walker et al., 1999; Gillison, 2013; 刘晓娟和马克平, 2015; 韩涛涛等, 2021).功能多样性是生物多样性的重要组成部分, 是解释和预测生态系统过程和功能的重要驱动力(Petchey & Gaston, 2002; Petchey et al., 2004), 反映了群落、景观、甚至区域尺度内功能性状的变异性, 决定了生态系统的功能和稳定性(Tilman, 1997; Ruiz-Benito et al., 2014).由于对于功能多样性的不同理解会产生不同的研究方法(Mason et al., 2003, 2005; Botta-Dukát, 2005; Laliberté & Legendre, 2010), 而这些方法对于植物功能性状选取、功能多样性计算、生态系统功能评估的影响较大, 因此有必要对功能多样性做一个统一的定义.Tilman (2001)认为功能多样性是影响生态系统功能的群落中所有物种及有机物的功能特征值及其变动范围, 强调的是特征值的差异性.由于此概念具有较强的概括性和可操作性, 因而被普遍接受并广泛用于计算生态系统结构与功能的各个方面(Petchey & Gaston, 2002; Mason et al., 2003, 2005; Petchey et al., 2004). ...
... ., 2004). ...
Explaining grassland biomass—The contribution of climate, species and functional diversity depends on fertilization and mowing frequency
1
2001
... 群落生产力表征区域环境条件下植被的生产能力, 反映了生态系统的生长特征和健康状况, 早期的很多研究认可了物种多样性对生产力的贡献, 但近年来, 一些研究认为相对于物种多样性, 功能多样性更能影响群落生产力(Díaz & Cabido, 2001; Römermann et al., 2001).因此开展对天然草地的功能多样性遥感监测及其与生产力关系的研究可以更好地探究功能多样性与生态系统功能之间的关系.然而, 功能多样性与生产力的关系较为复杂, 主要有“质量比假说” (Grime, 1998)和“多样性假说” (Tilman et al., 1997).前者认为优势物种的性状大小决定了群落的生产力, 后者认为多样性高导致功能性状差异加大, 从而提高了资源的利用效率.两种假说的相对重要性至今仍有争论, 是研究的热点.地上生物量作为群落生产力的有力度量指标, 因其观测相对便利常用来代替群落生产力(Kassen et al., 2000; Bai et al., 2007).基于单种栽培草地平台, Zhao等(2021)发现无人机高光谱反演的与光合作用相关的叶绿素、碳、氮含量等叶片生理性状, 是草地单种栽培群落地上生物量的重要预测因子, 进一步分析了功能多样性与生产力的关系.然而, 当前基于天然草地的功能多样性遥感监测及其与生产力的关系还鲜有研究. ...
Optimization of soil-adjusted vegetation indices
1
1996
... Calculating formula of vegetation index
Table 1 植被指数
Vegetation index | 计算公式
Calculate formula | Sentinel-2波段
Sentinel-2 band used | 参考文献
Reference |
| TCARI | 3[(R699.19 - R668.98) - 0.2(R699.19 - R550.67)(R699.19/R668.98)] | B3, B4, B5 | Kim et al., 1994 |
| OSAVI | (1 + 0.16)(R750 - R705)/(R750 + R705 + 0.16) | B5, B6 | Wu et al., 2008 |
| OSAVI2 | (1 + 0.16) (R800 - R670)/(R800 + R670 + 0.16) | B4, B7 | Rondeaux et al., 1996 |
| D | R730/R706 | B5, B6 | Zarco-Tejada et al., 2003 |
| Datt | (R850 - R710)/(R850 - R680) | B4, B5, B8 | Datt, 1999 |
| Datt2 | R850/R710 | B5, B8 | Datt, 1999 |
| Gitelson | 1/R700 | B5 | Gitelson et al., 1999 |
| SR | R750/R700 | B5, B6 | Gitelson & Merzlyak, 1997 |
| SR2 | R700/R670 | B4, B5 | McMurtrey III et al., 1994 |
| MSI | R1600/R819 | B8, B11 | Hunt Jr & Rock, 1989 |
| NDVI705 | (R750 - R705)/( R750 + R705) | B5, B6 | Sims & Gamon, 2002 |
| CRI1 | 1/R510 - 1/R550 | B2, B3 | Gitelson et al., 2003 |
| CRI2 | 1/R510 - 1/R700 | B2, B5 | Gitelson et al., 2002 |
| ARI1 | 1/R550 - 1/R700 | B3, B5 | Sims & Gamon, 2002 |
| ARI2 | R800(1/R550 - 1/R700) | B3, B5, B7 | Gitelson et al., 2002 |
| NDVI | (R842 - R665)/(R842 + R665) | B4, B8 | Huete et al., 1997 |
| GNDVI | (R783 - R560)/(R783 + R560) | B3, B7 | Rozenstein et al., 2019 |
| TNDVI | [(R842 - R665)/(R842 + R665) + 0.5]0.5 | B4, B8 | Rozenstein et al., 2019 |
| WDVI | R842 - 0.5R665 | B4, B8 | Rozenstein et al., 2019 |
| NDI45 | (R705 - R665)/(R705 + R665) | B4, B5 | Delegido et al., 2011 |
| SAVI | (1 + 0.5) × (R799.09 - R680.045)/(R799.09 + R680.045 + 0.5) | B4, B7 | Huete, 1988 |
| SAVI2 | R799.09/(R680.045 + b/a) (a = 0.97, b = 0.08) | B4, B7 | Major et al., 1990 |
| ARVI | ARVI = (R799.09 -R680.045 + R444.5 + R680.045)/(R799.09 + R680.045 - R444.5 - R680.045) | B1, B4, B7 | Kaufman & Tanre, 1992 |
| SARVI | RB = R680.045 - (R444.5 - R680.045)
SARVI = (1 + 0.5)(R799.09 -R680.045 + R444.5 + R680.045)/(R799.09 + R680.045 -
R444.5 - R680.045 + 0.5) | B1, B4, B7 | Kaufman & Tanre, 1992 |
| EVI | 2.5(R799.09 - R680.045)/(R799.09 + 6R680.045 - 7.5R444.5 + 1) | B1, B4, B7 | Huete et al., 1997 |
| IRECI | (R783 - R665)/(R705/R740) | B4, B5, B6, B7 | Frampton et al., 2013 |
| IPVI | R842/(R842 + R665) | B4, B8 | Rozenstein et al., 2019 |
| PSSRA | R783/R665 | B4, B7 | Rozenstein et al., 2019 |
| RVI | R842/R665 | B4, B8 | Rozenstein et al., 2019 |
| mNDVI705 | (R750 - R705)/( R750 + R705 - 2R445) | B1, B5, B6 | Datt, 1999 |
| mSR705 | (R750 - R445)/( R705 + R445) | B1, B6 | Datt, 1999 |
| SIPI | (R800 - R445)/( R800 - R680) | B1, B7 | Penuelas et al., 1995 |
| NDWI | (R865 - R1614)/( R865 - R1614) | B8A, B11 | McFeeters, 1996 |
R表示range, 其右下角数值表示光谱值范围.ARI, 花青素反射指数; ARVI, 耐大气植被指数; CRI, 类胡萝卜素反射指数; D, 双峰光学指数; DATT, DATT植被指数; EVI, 增强型植被指数; Gitelson, Gitelson植被指数; GNDVI, 绿色归一化差异植被指数; IPVI, 红外植被百分比指数; IRECI, 倒红边叶绿素指数; mNDVI705, 改进红边归一化植被指数; MSI, 水分胁迫指数; mSR705, 改进红边比值植被指数; NDI45, 归一化差异指数; NDII, 归一化红外指数; NDVI, 归一化植被指数; NDWI, 归一化差值水体指数; OSAVI, 优化型土壤调节植被指数; PSRI, 植物衰老反射指数; PSSRA, 特征色素简单比值指数; RVI, 比值植被指数; SARVI, 土壤大气阻抗植被指数; SAVI, 土壤调节植被指数; SIPI, 结构不敏感色素植被指数; SR, 比值植被指数; TCARI, 转换型叶绿素吸收植被指数; TNDVI, 转化后的归一化植被指数; WDVI, 加权差分植被指数. ...
What does remote sensing do for ecology?
1
1991
... 传统的功能多样性的计算通常依赖大量的野外调查, 基于野外获得的生物多样性和功能性状进一步得到功能多样性, 测定手段费时费力, 同时也受时间和空间尺度的制约, 不适用于长期大规模的区域监测.遥感数据具有探测范围广、数据获取周期短、可重复等特点, 使得其在大尺度生物多样性监测和评估及制图方面具有极大的优势(Roughgarden et al., 1991), 已经成为评估生态系统功能多样性的重要工具.目前, 基于遥感的功能多样性的监测方法已经在森林生态系统中成功应用.Asner等(2017)和Schneider等(2017)分别基于聚类分析和基于像元的功能多样性遥感反演方法, 利用机载高光谱数据成功绘制了高空间分辨率的植物功能多样性空间分布图.Durán等(2019)利用成像光谱学和叶片性状相结合的方法, 基于偏最小二乘回归(PLSR)估算了亚马孙至安第斯山脉热带森林不同海拔高度的功能多样性, 同时发现通过遥感获得的单一性状或多性状计算得到的功能多样性是净初级生产力和总生产力变化的重要预测因素.但由于草地类型多样、覆盖度低、植株矮小且多数混合生长等特点, 相较于森林生态系统, 在大尺度上进行草地生态系统监测难度较高(辛晓平等, 2018). ...
Validation of the cotton crop coefficient estimation model based on Sentinel-2 imagery and eddy covariance measurements
6
2019
... Calculating formula of vegetation index
Table 1 植被指数
Vegetation index | 计算公式
Calculate formula | Sentinel-2波段
Sentinel-2 band used | 参考文献
Reference |
| TCARI | 3[(R699.19 - R668.98) - 0.2(R699.19 - R550.67)(R699.19/R668.98)] | B3, B4, B5 | Kim et al., 1994 |
| OSAVI | (1 + 0.16)(R750 - R705)/(R750 + R705 + 0.16) | B5, B6 | Wu et al., 2008 |
| OSAVI2 | (1 + 0.16) (R800 - R670)/(R800 + R670 + 0.16) | B4, B7 | Rondeaux et al., 1996 |
| D | R730/R706 | B5, B6 | Zarco-Tejada et al., 2003 |
| Datt | (R850 - R710)/(R850 - R680) | B4, B5, B8 | Datt, 1999 |
| Datt2 | R850/R710 | B5, B8 | Datt, 1999 |
| Gitelson | 1/R700 | B5 | Gitelson et al., 1999 |
| SR | R750/R700 | B5, B6 | Gitelson & Merzlyak, 1997 |
| SR2 | R700/R670 | B4, B5 | McMurtrey III et al., 1994 |
| MSI | R1600/R819 | B8, B11 | Hunt Jr & Rock, 1989 |
| NDVI705 | (R750 - R705)/( R750 + R705) | B5, B6 | Sims & Gamon, 2002 |
| CRI1 | 1/R510 - 1/R550 | B2, B3 | Gitelson et al., 2003 |
| CRI2 | 1/R510 - 1/R700 | B2, B5 | Gitelson et al., 2002 |
| ARI1 | 1/R550 - 1/R700 | B3, B5 | Sims & Gamon, 2002 |
| ARI2 | R800(1/R550 - 1/R700) | B3, B5, B7 | Gitelson et al., 2002 |
| NDVI | (R842 - R665)/(R842 + R665) | B4, B8 | Huete et al., 1997 |
| GNDVI | (R783 - R560)/(R783 + R560) | B3, B7 | Rozenstein et al., 2019 |
| TNDVI | [(R842 - R665)/(R842 + R665) + 0.5]0.5 | B4, B8 | Rozenstein et al., 2019 |
| WDVI | R842 - 0.5R665 | B4, B8 | Rozenstein et al., 2019 |
| NDI45 | (R705 - R665)/(R705 + R665) | B4, B5 | Delegido et al., 2011 |
| SAVI | (1 + 0.5) × (R799.09 - R680.045)/(R799.09 + R680.045 + 0.5) | B4, B7 | Huete, 1988 |
| SAVI2 | R799.09/(R680.045 + b/a) (a = 0.97, b = 0.08) | B4, B7 | Major et al., 1990 |
| ARVI | ARVI = (R799.09 -R680.045 + R444.5 + R680.045)/(R799.09 + R680.045 - R444.5 - R680.045) | B1, B4, B7 | Kaufman & Tanre, 1992 |
| SARVI | RB = R680.045 - (R444.5 - R680.045)
SARVI = (1 + 0.5)(R799.09 -R680.045 + R444.5 + R680.045)/(R799.09 + R680.045 -
R444.5 - R680.045 + 0.5) | B1, B4, B7 | Kaufman & Tanre, 1992 |
| EVI | 2.5(R799.09 - R680.045)/(R799.09 + 6R680.045 - 7.5R444.5 + 1) | B1, B4, B7 | Huete et al., 1997 |
| IRECI | (R783 - R665)/(R705/R740) | B4, B5, B6, B7 | Frampton et al., 2013 |
| IPVI | R842/(R842 + R665) | B4, B8 | Rozenstein et al., 2019 |
| PSSRA | R783/R665 | B4, B7 | Rozenstein et al., 2019 |
| RVI | R842/R665 | B4, B8 | Rozenstein et al., 2019 |
| mNDVI705 | (R750 - R705)/( R750 + R705 - 2R445) | B1, B5, B6 | Datt, 1999 |
| mSR705 | (R750 - R445)/( R705 + R445) | B1, B6 | Datt, 1999 |
| SIPI | (R800 - R445)/( R800 - R680) | B1, B7 | Penuelas et al., 1995 |
| NDWI | (R865 - R1614)/( R865 - R1614) | B8A, B11 | McFeeters, 1996 |
R表示range, 其右下角数值表示光谱值范围.ARI, 花青素反射指数; ARVI, 耐大气植被指数; CRI, 类胡萝卜素反射指数; D, 双峰光学指数; DATT, DATT植被指数; EVI, 增强型植被指数; Gitelson, Gitelson植被指数; GNDVI, 绿色归一化差异植被指数; IPVI, 红外植被百分比指数; IRECI, 倒红边叶绿素指数; mNDVI705, 改进红边归一化植被指数; MSI, 水分胁迫指数; mSR705, 改进红边比值植被指数; NDI45, 归一化差异指数; NDII, 归一化红外指数; NDVI, 归一化植被指数; NDWI, 归一化差值水体指数; OSAVI, 优化型土壤调节植被指数; PSRI, 植物衰老反射指数; PSSRA, 特征色素简单比值指数; RVI, 比值植被指数; SARVI, 土壤大气阻抗植被指数; SAVI, 土壤调节植被指数; SIPI, 结构不敏感色素植被指数; SR, 比值植被指数; TCARI, 转换型叶绿素吸收植被指数; TNDVI, 转化后的归一化植被指数; WDVI, 加权差分植被指数. ...
... .,
2019 | WDVI | R842 - 0.5R665 | B4, B8 | Rozenstein et al., 2019 |
| NDI45 | (R705 - R665)/(R705 + R665) | B4, B5 | Delegido et al., 2011 |
| SAVI | (1 + 0.5) × (R799.09 - R680.045)/(R799.09 + R680.045 + 0.5) | B4, B7 | Huete, 1988 |
| SAVI2 | R799.09/(R680.045 + b/a) (a = 0.97, b = 0.08) | B4, B7 | Major et al., 1990 |
| ARVI | ARVI = (R799.09 -R680.045 + R444.5 + R680.045)/(R799.09 + R680.045 - R444.5 - R680.045) | B1, B4, B7 | Kaufman & Tanre, 1992 |
| SARVI | RB = R680.045 - (R444.5 - R680.045)
SARVI = (1 + 0.5)(R799.09 -R680.045 + R444.5 + R680.045)/(R799.09 + R680.045 -
R444.5 - R680.045 + 0.5) | B1, B4, B7 | Kaufman & Tanre, 1992 |
| EVI | 2.5(R799.09 - R680.045)/(R799.09 + 6R680.045 - 7.5R444.5 + 1) | B1, B4, B7 | Huete et al., 1997 |
| IRECI | (R783 - R665)/(R705/R740) | B4, B5, B6, B7 | Frampton et al., 2013 |
| IPVI | R842/(R842 + R665) | B4, B8 | Rozenstein et al., 2019 |
| PSSRA | R783/R665 | B4, B7 | Rozenstein et al., 2019 |
| RVI | R842/R665 | B4, B8 | Rozenstein et al., 2019 |
| mNDVI705 | (R750 - R705)/( R750 + R705 - 2R445) | B1, B5, B6 | Datt, 1999 |
| mSR705 | (R750 - R445)/( R705 + R445) | B1, B6 | Datt, 1999 |
| SIPI | (R800 - R445)/( R800 - R680) | B1, B7 | Penuelas et al., 1995 |
| NDWI | (R865 - R1614)/( R865 - R1614) | B8A, B11 | McFeeters, 1996 |
R表示range, 其右下角数值表示光谱值范围.ARI, 花青素反射指数; ARVI, 耐大气植被指数; CRI, 类胡萝卜素反射指数; D, 双峰光学指数; DATT, DATT植被指数; EVI, 增强型植被指数; Gitelson, Gitelson植被指数; GNDVI, 绿色归一化差异植被指数; IPVI, 红外植被百分比指数; IRECI, 倒红边叶绿素指数; mNDVI705, 改进红边归一化植被指数; MSI, 水分胁迫指数; mSR705, 改进红边比值植被指数; NDI45, 归一化差异指数; NDII, 归一化红外指数; NDVI, 归一化植被指数; NDWI, 归一化差值水体指数; OSAVI, 优化型土壤调节植被指数; PSRI, 植物衰老反射指数; PSSRA, 特征色素简单比值指数; RVI, 比值植被指数; SARVI, 土壤大气阻抗植被指数; SAVI, 土壤调节植被指数; SIPI, 结构不敏感色素植被指数; SR, 比值植被指数; TCARI, 转换型叶绿素吸收植被指数; TNDVI, 转化后的归一化植被指数; WDVI, 加权差分植被指数. ...
... .,
2019 | NDI45 | (R705 - R665)/(R705 + R665) | B4, B5 | Delegido et al., 2011 |
| SAVI | (1 + 0.5) × (R799.09 - R680.045)/(R799.09 + R680.045 + 0.5) | B4, B7 | Huete, 1988 |
| SAVI2 | R799.09/(R680.045 + b/a) (a = 0.97, b = 0.08) | B4, B7 | Major et al., 1990 |
| ARVI | ARVI = (R799.09 -R680.045 + R444.5 + R680.045)/(R799.09 + R680.045 - R444.5 - R680.045) | B1, B4, B7 | Kaufman & Tanre, 1992 |
| SARVI | RB = R680.045 - (R444.5 - R680.045)
SARVI = (1 + 0.5)(R799.09 -R680.045 + R444.5 + R680.045)/(R799.09 + R680.045 -
R444.5 - R680.045 + 0.5) | B1, B4, B7 | Kaufman & Tanre, 1992 |
| EVI | 2.5(R799.09 - R680.045)/(R799.09 + 6R680.045 - 7.5R444.5 + 1) | B1, B4, B7 | Huete et al., 1997 |
| IRECI | (R783 - R665)/(R705/R740) | B4, B5, B6, B7 | Frampton et al., 2013 |
| IPVI | R842/(R842 + R665) | B4, B8 | Rozenstein et al., 2019 |
| PSSRA | R783/R665 | B4, B7 | Rozenstein et al., 2019 |
| RVI | R842/R665 | B4, B8 | Rozenstein et al., 2019 |
| mNDVI705 | (R750 - R705)/( R750 + R705 - 2R445) | B1, B5, B6 | Datt, 1999 |
| mSR705 | (R750 - R445)/( R705 + R445) | B1, B6 | Datt, 1999 |
| SIPI | (R800 - R445)/( R800 - R680) | B1, B7 | Penuelas et al., 1995 |
| NDWI | (R865 - R1614)/( R865 - R1614) | B8A, B11 | McFeeters, 1996 |
R表示range, 其右下角数值表示光谱值范围.ARI, 花青素反射指数; ARVI, 耐大气植被指数; CRI, 类胡萝卜素反射指数; D, 双峰光学指数; DATT, DATT植被指数; EVI, 增强型植被指数; Gitelson, Gitelson植被指数; GNDVI, 绿色归一化差异植被指数; IPVI, 红外植被百分比指数; IRECI, 倒红边叶绿素指数; mNDVI705, 改进红边归一化植被指数; MSI, 水分胁迫指数; mSR705, 改进红边比值植被指数; NDI45, 归一化差异指数; NDII, 归一化红外指数; NDVI, 归一化植被指数; NDWI, 归一化差值水体指数; OSAVI, 优化型土壤调节植被指数; PSRI, 植物衰老反射指数; PSSRA, 特征色素简单比值指数; RVI, 比值植被指数; SARVI, 土壤大气阻抗植被指数; SAVI, 土壤调节植被指数; SIPI, 结构不敏感色素植被指数; SR, 比值植被指数; TCARI, 转换型叶绿素吸收植被指数; TNDVI, 转化后的归一化植被指数; WDVI, 加权差分植被指数. ...
... .,
2019 | PSSRA | R783/R665 | B4, B7 | Rozenstein et al., 2019 |
| RVI | R842/R665 | B4, B8 | Rozenstein et al., 2019 |
| mNDVI705 | (R750 - R705)/( R750 + R705 - 2R445) | B1, B5, B6 | Datt, 1999 |
| mSR705 | (R750 - R445)/( R705 + R445) | B1, B6 | Datt, 1999 |
| SIPI | (R800 - R445)/( R800 - R680) | B1, B7 | Penuelas et al., 1995 |
| NDWI | (R865 - R1614)/( R865 - R1614) | B8A, B11 | McFeeters, 1996 |
R表示range, 其右下角数值表示光谱值范围.ARI, 花青素反射指数; ARVI, 耐大气植被指数; CRI, 类胡萝卜素反射指数; D, 双峰光学指数; DATT, DATT植被指数; EVI, 增强型植被指数; Gitelson, Gitelson植被指数; GNDVI, 绿色归一化差异植被指数; IPVI, 红外植被百分比指数; IRECI, 倒红边叶绿素指数; mNDVI705, 改进红边归一化植被指数; MSI, 水分胁迫指数; mSR705, 改进红边比值植被指数; NDI45, 归一化差异指数; NDII, 归一化红外指数; NDVI, 归一化植被指数; NDWI, 归一化差值水体指数; OSAVI, 优化型土壤调节植被指数; PSRI, 植物衰老反射指数; PSSRA, 特征色素简单比值指数; RVI, 比值植被指数; SARVI, 土壤大气阻抗植被指数; SAVI, 土壤调节植被指数; SIPI, 结构不敏感色素植被指数; SR, 比值植被指数; TCARI, 转换型叶绿素吸收植被指数; TNDVI, 转化后的归一化植被指数; WDVI, 加权差分植被指数. ...
... .,
2019 | RVI | R842/R665 | B4, B8 | Rozenstein et al., 2019 |
| mNDVI705 | (R750 - R705)/( R750 + R705 - 2R445) | B1, B5, B6 | Datt, 1999 |
| mSR705 | (R750 - R445)/( R705 + R445) | B1, B6 | Datt, 1999 |
| SIPI | (R800 - R445)/( R800 - R680) | B1, B7 | Penuelas et al., 1995 |
| NDWI | (R865 - R1614)/( R865 - R1614) | B8A, B11 | McFeeters, 1996 |
R表示range, 其右下角数值表示光谱值范围.ARI, 花青素反射指数; ARVI, 耐大气植被指数; CRI, 类胡萝卜素反射指数; D, 双峰光学指数; DATT, DATT植被指数; EVI, 增强型植被指数; Gitelson, Gitelson植被指数; GNDVI, 绿色归一化差异植被指数; IPVI, 红外植被百分比指数; IRECI, 倒红边叶绿素指数; mNDVI705, 改进红边归一化植被指数; MSI, 水分胁迫指数; mSR705, 改进红边比值植被指数; NDI45, 归一化差异指数; NDII, 归一化红外指数; NDVI, 归一化植被指数; NDWI, 归一化差值水体指数; OSAVI, 优化型土壤调节植被指数; PSRI, 植物衰老反射指数; PSSRA, 特征色素简单比值指数; RVI, 比值植被指数; SARVI, 土壤大气阻抗植被指数; SAVI, 土壤调节植被指数; SIPI, 结构不敏感色素植被指数; SR, 比值植被指数; TCARI, 转换型叶绿素吸收植被指数; TNDVI, 转化后的归一化植被指数; WDVI, 加权差分植被指数. ...
... .,
2019 | mNDVI705 | (R750 - R705)/( R750 + R705 - 2R445) | B1, B5, B6 | Datt, 1999 |
| mSR705 | (R750 - R445)/( R705 + R445) | B1, B6 | Datt, 1999 |
| SIPI | (R800 - R445)/( R800 - R680) | B1, B7 | Penuelas et al., 1995 |
| NDWI | (R865 - R1614)/( R865 - R1614) | B8A, B11 | McFeeters, 1996 |
R表示range, 其右下角数值表示光谱值范围.ARI, 花青素反射指数; ARVI, 耐大气植被指数; CRI, 类胡萝卜素反射指数; D, 双峰光学指数; DATT, DATT植被指数; EVI, 增强型植被指数; Gitelson, Gitelson植被指数; GNDVI, 绿色归一化差异植被指数; IPVI, 红外植被百分比指数; IRECI, 倒红边叶绿素指数; mNDVI705, 改进红边归一化植被指数; MSI, 水分胁迫指数; mSR705, 改进红边比值植被指数; NDI45, 归一化差异指数; NDII, 归一化红外指数; NDVI, 归一化植被指数; NDWI, 归一化差值水体指数; OSAVI, 优化型土壤调节植被指数; PSRI, 植物衰老反射指数; PSSRA, 特征色素简单比值指数; RVI, 比值植被指数; SARVI, 土壤大气阻抗植被指数; SAVI, 土壤调节植被指数; SIPI, 结构不敏感色素植被指数; SR, 比值植被指数; TCARI, 转换型叶绿素吸收植被指数; TNDVI, 转化后的归一化植被指数; WDVI, 加权差分植被指数. ...
Diversity increases carbon storage and tree productivity in Spanish forests
1
2014
... 近年来, 以植物功能性状为基础的研究方法被广泛应用到各个尺度中, 根据不同的尺度, 可选用不同的性状指标评估特定尺度下生态系统的功能(Tilman et al., 1997; Walker et al., 1999; Gillison, 2013; 刘晓娟和马克平, 2015; 韩涛涛等, 2021).功能多样性是生物多样性的重要组成部分, 是解释和预测生态系统过程和功能的重要驱动力(Petchey & Gaston, 2002; Petchey et al., 2004), 反映了群落、景观、甚至区域尺度内功能性状的变异性, 决定了生态系统的功能和稳定性(Tilman, 1997; Ruiz-Benito et al., 2014).由于对于功能多样性的不同理解会产生不同的研究方法(Mason et al., 2003, 2005; Botta-Dukát, 2005; Laliberté & Legendre, 2010), 而这些方法对于植物功能性状选取、功能多样性计算、生态系统功能评估的影响较大, 因此有必要对功能多样性做一个统一的定义.Tilman (2001)认为功能多样性是影响生态系统功能的群落中所有物种及有机物的功能特征值及其变动范围, 强调的是特征值的差异性.由于此概念具有较强的概括性和可操作性, 因而被普遍接受并广泛用于计算生态系统结构与功能的各个方面(Petchey & Gaston, 2002; Mason et al., 2003, 2005; Petchey et al., 2004). ...
Modeling distribution of Amazonian tree species and diversity using remote sensing measurements
1
2008
... 当前的功能多样性监测主要以机载和星载的高光谱遥感数据为主, 相较于机载高光谱遥感, 星载高光谱遥感观测尺度更大、监测时间序列更长、数据获取成本更低(Saatchi et al., 2008; Paganini et al., 2016).Sentinel-2号卫星数据作为目前可免费获取的最高空间分辨率的多光谱遥感数据, 是唯一一个在红边范围内含有3个波段的卫星遥感数据, 对监测植被健康十分重要.本研究拟利用Sentinel-2影像, 在内蒙古自治区锡林郭勒盟乌拉盖管理区草甸草原, 探究利用逐步回归、随机森林(RFR)、PLSR 3种方法的草地植物功能多样性反演精度, 进一步分析遥感反演的草地功能多样性与生产力的关系, 为能在大尺度上进行草地功能多样性的评估提供可行的方法和依据, 为草地利用与管理提供参考. ...
Mapping functional diversity from remotely sensed morphological and physiological forest traits
1
2017
... 传统的功能多样性的计算通常依赖大量的野外调查, 基于野外获得的生物多样性和功能性状进一步得到功能多样性, 测定手段费时费力, 同时也受时间和空间尺度的制约, 不适用于长期大规模的区域监测.遥感数据具有探测范围广、数据获取周期短、可重复等特点, 使得其在大尺度生物多样性监测和评估及制图方面具有极大的优势(Roughgarden et al., 1991), 已经成为评估生态系统功能多样性的重要工具.目前, 基于遥感的功能多样性的监测方法已经在森林生态系统中成功应用.Asner等(2017)和Schneider等(2017)分别基于聚类分析和基于像元的功能多样性遥感反演方法, 利用机载高光谱数据成功绘制了高空间分辨率的植物功能多样性空间分布图.Durán等(2019)利用成像光谱学和叶片性状相结合的方法, 基于偏最小二乘回归(PLSR)估算了亚马孙至安第斯山脉热带森林不同海拔高度的功能多样性, 同时发现通过遥感获得的单一性状或多性状计算得到的功能多样性是净初级生产力和总生产力变化的重要预测因素.但由于草地类型多样、覆盖度低、植株矮小且多数混合生长等特点, 相较于森林生态系统, 在大尺度上进行草地生态系统监测难度较高(辛晓平等, 2018). ...
Plant spectral diversity integrates functional and phylogenetic components of biodiversity and predicts ecosystem function
1
2018
... 遥感反演功能多样性的原理是基于系统发育差异和资源限制导致的植物性状不同(Schweiger et al., 2018), 进而影响光学遥感测量的光谱反射率(Wang et al., 2018).而功能多样性计算中涉及的功能性状需要既考虑其生态意义(如生存策略和生态系统过程或功能), 也要兼顾其遥感反演精度.然而, 对于不同的物种组成类型, 在不同的环境梯度下, 哪些性状和多少性状最能反映生态策略或功能的主要变化, 目前尚不清楚, 因此在具体研究中应考虑二者的权衡来反演功能多样性. ...
How to predict plant functional types using imaging spectroscopy: linking vegetation community traits, plant functional types and spectral response
2
2017
... PLSR是一种线性非参数回归模型(Verrelst et al., 2015), 是为了解决多变量共线性和数据规模大的问题而开发的一种多元回归算法(Schweiger et al., 2017).PLSR分析在建模过程中集中了主成分分析、典型相关分析和线性回归分析方法的特点, 因此在分析结果中, 除了可以提供一个更为合理的回归模型外, 还可以同时完成一些类似于主成分分析和典型相关分析的研究内容, 提供一些更丰富、深入的信息.同时, 它考虑到多指数结合法的预测准确性较差和物理模型的输入参数较为复杂, PLSR将目标变量与全波段光谱信息联系在一起, 易于实现并可以较优的精度反演多种性状, 已成功地应用于森林和草地生态系统中的性状研究中(Asner & Martin, 2008; Dahlin et al., 2013; Schweiger et al., 2017), 是目前较优的反演方法.本研究使用Unscrambler X 10.4软件, 基于46个特征变量, 利用PLSR方法, 与实测草地功能多样性和生物量建立回归模型, 预测FRic、FEve、FDiv和生物量并反演成图. ...
... ., 2017), 是目前较优的反演方法.本研究使用Unscrambler X 10.4软件, 基于46个特征变量, 利用PLSR方法, 与实测草地功能多样性和生物量建立回归模型, 预测FRic、FEve、FDiv和生物量并反演成图. ...
Estimation of aboveground biomass using in situ hyperspectral measurements in five major grassland ecosystems on the Tibetan Plateau
1
2008
... 本研究利用PLSR对地上群落生物量进行了反演, 反演精度R2 = 0.61 (RMSE = 94.15, p < 0.001), 此结果相比基于Sentinel-2数据估算草地生物量的研究精度更低.如, Kong等(2019)以高寒草地的植被为研究对象, 利用冠层光谱数据和生物量与MOD13 NDVI数据相结合, 基于逐步回归方法反演高山草地生物量, 拟合R2为0.869; Dou等(2020)以滨海湿地的植被为研究对象反演生物量的精度, R2大于0.85, 本研究结果与之相比精度略低, 这可能是受研究区域空间尺度的影响(Kong et al., 2019).不同草地类型的生物量遥感反演结果表明, 草地类型也是影响生物量估算精度的重要因子, 且多种草地类型的数据混合, 有利于提升模型的准确性(Shen et al., 2008), 本研究仅选择草甸草原, 可能会对结果产生一定影响. ...
Relationships between leaf pigment content and spectral reflectance across a wide range of species, leaf structures and developmental stages
2
2002
... Calculating formula of vegetation index
Table 1 植被指数
Vegetation index | 计算公式
Calculate formula | Sentinel-2波段
Sentinel-2 band used | 参考文献
Reference |
| TCARI | 3[(R699.19 - R668.98) - 0.2(R699.19 - R550.67)(R699.19/R668.98)] | B3, B4, B5 | Kim et al., 1994 |
| OSAVI | (1 + 0.16)(R750 - R705)/(R750 + R705 + 0.16) | B5, B6 | Wu et al., 2008 |
| OSAVI2 | (1 + 0.16) (R800 - R670)/(R800 + R670 + 0.16) | B4, B7 | Rondeaux et al., 1996 |
| D | R730/R706 | B5, B6 | Zarco-Tejada et al., 2003 |
| Datt | (R850 - R710)/(R850 - R680) | B4, B5, B8 | Datt, 1999 |
| Datt2 | R850/R710 | B5, B8 | Datt, 1999 |
| Gitelson | 1/R700 | B5 | Gitelson et al., 1999 |
| SR | R750/R700 | B5, B6 | Gitelson & Merzlyak, 1997 |
| SR2 | R700/R670 | B4, B5 | McMurtrey III et al., 1994 |
| MSI | R1600/R819 | B8, B11 | Hunt Jr & Rock, 1989 |
| NDVI705 | (R750 - R705)/( R750 + R705) | B5, B6 | Sims & Gamon, 2002 |
| CRI1 | 1/R510 - 1/R550 | B2, B3 | Gitelson et al., 2003 |
| CRI2 | 1/R510 - 1/R700 | B2, B5 | Gitelson et al., 2002 |
| ARI1 | 1/R550 - 1/R700 | B3, B5 | Sims & Gamon, 2002 |
| ARI2 | R800(1/R550 - 1/R700) | B3, B5, B7 | Gitelson et al., 2002 |
| NDVI | (R842 - R665)/(R842 + R665) | B4, B8 | Huete et al., 1997 |
| GNDVI | (R783 - R560)/(R783 + R560) | B3, B7 | Rozenstein et al., 2019 |
| TNDVI | [(R842 - R665)/(R842 + R665) + 0.5]0.5 | B4, B8 | Rozenstein et al., 2019 |
| WDVI | R842 - 0.5R665 | B4, B8 | Rozenstein et al., 2019 |
| NDI45 | (R705 - R665)/(R705 + R665) | B4, B5 | Delegido et al., 2011 |
| SAVI | (1 + 0.5) × (R799.09 - R680.045)/(R799.09 + R680.045 + 0.5) | B4, B7 | Huete, 1988 |
| SAVI2 | R799.09/(R680.045 + b/a) (a = 0.97, b = 0.08) | B4, B7 | Major et al., 1990 |
| ARVI | ARVI = (R799.09 -R680.045 + R444.5 + R680.045)/(R799.09 + R680.045 - R444.5 - R680.045) | B1, B4, B7 | Kaufman & Tanre, 1992 |
| SARVI | RB = R680.045 - (R444.5 - R680.045)
SARVI = (1 + 0.5)(R799.09 -R680.045 + R444.5 + R680.045)/(R799.09 + R680.045 -
R444.5 - R680.045 + 0.5) | B1, B4, B7 | Kaufman & Tanre, 1992 |
| EVI | 2.5(R799.09 - R680.045)/(R799.09 + 6R680.045 - 7.5R444.5 + 1) | B1, B4, B7 | Huete et al., 1997 |
| IRECI | (R783 - R665)/(R705/R740) | B4, B5, B6, B7 | Frampton et al., 2013 |
| IPVI | R842/(R842 + R665) | B4, B8 | Rozenstein et al., 2019 |
| PSSRA | R783/R665 | B4, B7 | Rozenstein et al., 2019 |
| RVI | R842/R665 | B4, B8 | Rozenstein et al., 2019 |
| mNDVI705 | (R750 - R705)/( R750 + R705 - 2R445) | B1, B5, B6 | Datt, 1999 |
| mSR705 | (R750 - R445)/( R705 + R445) | B1, B6 | Datt, 1999 |
| SIPI | (R800 - R445)/( R800 - R680) | B1, B7 | Penuelas et al., 1995 |
| NDWI | (R865 - R1614)/( R865 - R1614) | B8A, B11 | McFeeters, 1996 |
R表示range, 其右下角数值表示光谱值范围.ARI, 花青素反射指数; ARVI, 耐大气植被指数; CRI, 类胡萝卜素反射指数; D, 双峰光学指数; DATT, DATT植被指数; EVI, 增强型植被指数; Gitelson, Gitelson植被指数; GNDVI, 绿色归一化差异植被指数; IPVI, 红外植被百分比指数; IRECI, 倒红边叶绿素指数; mNDVI705, 改进红边归一化植被指数; MSI, 水分胁迫指数; mSR705, 改进红边比值植被指数; NDI45, 归一化差异指数; NDII, 归一化红外指数; NDVI, 归一化植被指数; NDWI, 归一化差值水体指数; OSAVI, 优化型土壤调节植被指数; PSRI, 植物衰老反射指数; PSSRA, 特征色素简单比值指数; RVI, 比值植被指数; SARVI, 土壤大气阻抗植被指数; SAVI, 土壤调节植被指数; SIPI, 结构不敏感色素植被指数; SR, 比值植被指数; TCARI, 转换型叶绿素吸收植被指数; TNDVI, 转化后的归一化植被指数; WDVI, 加权差分植被指数. ...
... Sims & Gamon,
2002 | ARI2 | R800(1/R550 - 1/R700) | B3, B5, B7 | Gitelson et al., 2002 |
| NDVI | (R842 - R665)/(R842 + R665) | B4, B8 | Huete et al., 1997 |
| GNDVI | (R783 - R560)/(R783 + R560) | B3, B7 | Rozenstein et al., 2019 |
| TNDVI | [(R842 - R665)/(R842 + R665) + 0.5]0.5 | B4, B8 | Rozenstein et al., 2019 |
| WDVI | R842 - 0.5R665 | B4, B8 | Rozenstein et al., 2019 |
| NDI45 | (R705 - R665)/(R705 + R665) | B4, B5 | Delegido et al., 2011 |
| SAVI | (1 + 0.5) × (R799.09 - R680.045)/(R799.09 + R680.045 + 0.5) | B4, B7 | Huete, 1988 |
| SAVI2 | R799.09/(R680.045 + b/a) (a = 0.97, b = 0.08) | B4, B7 | Major et al., 1990 |
| ARVI | ARVI = (R799.09 -R680.045 + R444.5 + R680.045)/(R799.09 + R680.045 - R444.5 - R680.045) | B1, B4, B7 | Kaufman & Tanre, 1992 |
| SARVI | RB = R680.045 - (R444.5 - R680.045)
SARVI = (1 + 0.5)(R799.09 -R680.045 + R444.5 + R680.045)/(R799.09 + R680.045 -
R444.5 - R680.045 + 0.5) | B1, B4, B7 | Kaufman & Tanre, 1992 |
| EVI | 2.5(R799.09 - R680.045)/(R799.09 + 6R680.045 - 7.5R444.5 + 1) | B1, B4, B7 | Huete et al., 1997 |
| IRECI | (R783 - R665)/(R705/R740) | B4, B5, B6, B7 | Frampton et al., 2013 |
| IPVI | R842/(R842 + R665) | B4, B8 | Rozenstein et al., 2019 |
| PSSRA | R783/R665 | B4, B7 | Rozenstein et al., 2019 |
| RVI | R842/R665 | B4, B8 | Rozenstein et al., 2019 |
| mNDVI705 | (R750 - R705)/( R750 + R705 - 2R445) | B1, B5, B6 | Datt, 1999 |
| mSR705 | (R750 - R445)/( R705 + R445) | B1, B6 | Datt, 1999 |
| SIPI | (R800 - R445)/( R800 - R680) | B1, B7 | Penuelas et al., 1995 |
| NDWI | (R865 - R1614)/( R865 - R1614) | B8A, B11 | McFeeters, 1996 |
R表示range, 其右下角数值表示光谱值范围.ARI, 花青素反射指数; ARVI, 耐大气植被指数; CRI, 类胡萝卜素反射指数; D, 双峰光学指数; DATT, DATT植被指数; EVI, 增强型植被指数; Gitelson, Gitelson植被指数; GNDVI, 绿色归一化差异植被指数; IPVI, 红外植被百分比指数; IRECI, 倒红边叶绿素指数; mNDVI705, 改进红边归一化植被指数; MSI, 水分胁迫指数; mSR705, 改进红边比值植被指数; NDI45, 归一化差异指数; NDII, 归一化红外指数; NDVI, 归一化植被指数; NDWI, 归一化差值水体指数; OSAVI, 优化型土壤调节植被指数; PSRI, 植物衰老反射指数; PSSRA, 特征色素简单比值指数; RVI, 比值植被指数; SARVI, 土壤大气阻抗植被指数; SAVI, 土壤调节植被指数; SIPI, 结构不敏感色素植被指数; SR, 比值植被指数; TCARI, 转换型叶绿素吸收植被指数; TNDVI, 转化后的归一化植被指数; WDVI, 加权差分植被指数. ...
植物功能多样性与功能群研究进展
1
2003
... 越来越多的研究证明, 功能多样性即群落中物种的功能差异性(Tilman, 2001; Petchey & Gaston, 2002)是生态系统过程的决定因素(Díaz & Cabido, 2001; Loreau et al., 2001; 臧岳铭等, 2009).植物功能性状是研究生态系统结构与功能变化的中间桥梁(孙国钧等, 2003).Wan等(2011)指出可以通过改变植物的种类组成和性状来影响区域尺度上的功能多样性, 本研究所选的生态系统功能仅为地上生物量, 覆盖面较小.因此, 研究各性状有何种功能, 各种性状组合计算得到的功能多样性具体又指代生态系统的何种功能, 可作为下一步研究的重点. ...
Distinguishing between the effects of species diversity and species composition
2
1997
... 在以往的研究中, 生态学家主要利用物种为基本单元的多样性指数来探讨群落间的物种多样性, 如: Shannon-Weiner指数, Simpson指数等(韩涛涛等, 2021).然而, 物种间的差异往往体现在长期进化过程中, 以物种为基本单元的研究很难体现不同生态系统间功能的差异(Naeem et al., 2012; Mouillot et al., 2013).植物功能性状能够适应环境变化, 并将环境与植物个体和生态系统结构、过程与功能联系起来(Díaz et al., 2004).基于植物功能性状和功能多样性的研究可以从植物的生长、防御、抵抗等不同的功能策略方面解释不同生态系统间的物种组成、功能特征, 从而有助于进一步理解它们的生态过程和功能(Tilman, 1997; Leps et al., 2006; 韩涛涛等, 2021). ...
... 近年来, 以植物功能性状为基础的研究方法被广泛应用到各个尺度中, 根据不同的尺度, 可选用不同的性状指标评估特定尺度下生态系统的功能(Tilman et al., 1997; Walker et al., 1999; Gillison, 2013; 刘晓娟和马克平, 2015; 韩涛涛等, 2021).功能多样性是生物多样性的重要组成部分, 是解释和预测生态系统过程和功能的重要驱动力(Petchey & Gaston, 2002; Petchey et al., 2004), 反映了群落、景观、甚至区域尺度内功能性状的变异性, 决定了生态系统的功能和稳定性(Tilman, 1997; Ruiz-Benito et al., 2014).由于对于功能多样性的不同理解会产生不同的研究方法(Mason et al., 2003, 2005; Botta-Dukát, 2005; Laliberté & Legendre, 2010), 而这些方法对于植物功能性状选取、功能多样性计算、生态系统功能评估的影响较大, 因此有必要对功能多样性做一个统一的定义.Tilman (2001)认为功能多样性是影响生态系统功能的群落中所有物种及有机物的功能特征值及其变动范围, 强调的是特征值的差异性.由于此概念具有较强的概括性和可操作性, 因而被普遍接受并广泛用于计算生态系统结构与功能的各个方面(Petchey & Gaston, 2002; Mason et al., 2003, 2005; Petchey et al., 2004). ...
Functional diversity
2
2001
... 近年来, 以植物功能性状为基础的研究方法被广泛应用到各个尺度中, 根据不同的尺度, 可选用不同的性状指标评估特定尺度下生态系统的功能(Tilman et al., 1997; Walker et al., 1999; Gillison, 2013; 刘晓娟和马克平, 2015; 韩涛涛等, 2021).功能多样性是生物多样性的重要组成部分, 是解释和预测生态系统过程和功能的重要驱动力(Petchey & Gaston, 2002; Petchey et al., 2004), 反映了群落、景观、甚至区域尺度内功能性状的变异性, 决定了生态系统的功能和稳定性(Tilman, 1997; Ruiz-Benito et al., 2014).由于对于功能多样性的不同理解会产生不同的研究方法(Mason et al., 2003, 2005; Botta-Dukát, 2005; Laliberté & Legendre, 2010), 而这些方法对于植物功能性状选取、功能多样性计算、生态系统功能评估的影响较大, 因此有必要对功能多样性做一个统一的定义.Tilman (2001)认为功能多样性是影响生态系统功能的群落中所有物种及有机物的功能特征值及其变动范围, 强调的是特征值的差异性.由于此概念具有较强的概括性和可操作性, 因而被普遍接受并广泛用于计算生态系统结构与功能的各个方面(Petchey & Gaston, 2002; Mason et al., 2003, 2005; Petchey et al., 2004). ...
... 越来越多的研究证明, 功能多样性即群落中物种的功能差异性(Tilman, 2001; Petchey & Gaston, 2002)是生态系统过程的决定因素(Díaz & Cabido, 2001; Loreau et al., 2001; 臧岳铭等, 2009).植物功能性状是研究生态系统结构与功能变化的中间桥梁(孙国钧等, 2003).Wan等(2011)指出可以通过改变植物的种类组成和性状来影响区域尺度上的功能多样性, 本研究所选的生态系统功能仅为地上生物量, 覆盖面较小.因此, 研究各性状有何种功能, 各种性状组合计算得到的功能多样性具体又指代生态系统的何种功能, 可作为下一步研究的重点. ...
The influence of functional diversity and composition on ecosystem processes
2
1997
... 近年来, 以植物功能性状为基础的研究方法被广泛应用到各个尺度中, 根据不同的尺度, 可选用不同的性状指标评估特定尺度下生态系统的功能(Tilman et al., 1997; Walker et al., 1999; Gillison, 2013; 刘晓娟和马克平, 2015; 韩涛涛等, 2021).功能多样性是生物多样性的重要组成部分, 是解释和预测生态系统过程和功能的重要驱动力(Petchey & Gaston, 2002; Petchey et al., 2004), 反映了群落、景观、甚至区域尺度内功能性状的变异性, 决定了生态系统的功能和稳定性(Tilman, 1997; Ruiz-Benito et al., 2014).由于对于功能多样性的不同理解会产生不同的研究方法(Mason et al., 2003, 2005; Botta-Dukát, 2005; Laliberté & Legendre, 2010), 而这些方法对于植物功能性状选取、功能多样性计算、生态系统功能评估的影响较大, 因此有必要对功能多样性做一个统一的定义.Tilman (2001)认为功能多样性是影响生态系统功能的群落中所有物种及有机物的功能特征值及其变动范围, 强调的是特征值的差异性.由于此概念具有较强的概括性和可操作性, 因而被普遍接受并广泛用于计算生态系统结构与功能的各个方面(Petchey & Gaston, 2002; Mason et al., 2003, 2005; Petchey et al., 2004). ...
... 群落生产力表征区域环境条件下植被的生产能力, 反映了生态系统的生长特征和健康状况, 早期的很多研究认可了物种多样性对生产力的贡献, 但近年来, 一些研究认为相对于物种多样性, 功能多样性更能影响群落生产力(Díaz & Cabido, 2001; Römermann et al., 2001).因此开展对天然草地的功能多样性遥感监测及其与生产力关系的研究可以更好地探究功能多样性与生态系统功能之间的关系.然而, 功能多样性与生产力的关系较为复杂, 主要有“质量比假说” (Grime, 1998)和“多样性假说” (Tilman et al., 1997).前者认为优势物种的性状大小决定了群落的生产力, 后者认为多样性高导致功能性状差异加大, 从而提高了资源的利用效率.两种假说的相对重要性至今仍有争论, 是研究的热点.地上生物量作为群落生产力的有力度量指标, 因其观测相对便利常用来代替群落生产力(Kassen et al., 2000; Bai et al., 2007).基于单种栽培草地平台, Zhao等(2021)发现无人机高光谱反演的与光合作用相关的叶绿素、碳、氮含量等叶片生理性状, 是草地单种栽培群落地上生物量的重要预测因子, 进一步分析了功能多样性与生产力的关系.然而, 当前基于天然草地的功能多样性遥感监测及其与生产力的关系还鲜有研究. ...
Optical remote sensing and the retrieval of terrestrial vegetation bio-geophysical properties—A review
1
2015
... PLSR是一种线性非参数回归模型(Verrelst et al., 2015), 是为了解决多变量共线性和数据规模大的问题而开发的一种多元回归算法(Schweiger et al., 2017).PLSR分析在建模过程中集中了主成分分析、典型相关分析和线性回归分析方法的特点, 因此在分析结果中, 除了可以提供一个更为合理的回归模型外, 还可以同时完成一些类似于主成分分析和典型相关分析的研究内容, 提供一些更丰富、深入的信息.同时, 它考虑到多指数结合法的预测准确性较差和物理模型的输入参数较为复杂, PLSR将目标变量与全波段光谱信息联系在一起, 易于实现并可以较优的精度反演多种性状, 已成功地应用于森林和草地生态系统中的性状研究中(Asner & Martin, 2008; Dahlin et al., 2013; Schweiger et al., 2017), 是目前较优的反演方法.本研究使用Unscrambler X 10.4软件, 基于46个特征变量, 利用PLSR方法, 与实测草地功能多样性和生物量建立回归模型, 预测FRic、FEve、FDiv和生物量并反演成图. ...
New multidimensional functional diversity indices for a multifaceted framework in functional ecology
1
2008
... 早期对于功能多样性的研究大多采用物种多样性及功能型组, 但随着计算机技术的高速发展, 很多复杂的数学公式被引入到功能多样性的研究中, 例如用影响生态系统结构与功能的功能性状替代物种间的遗传距离, 从而可以得出一些计算功能多样性的方法(Botta-Dukát, 2005; Violle et al., 2007).随后, 研究者们认为仅采用一种指数难以代表生态系统功能多样性(Mouillot et al., 2005), 从而将功能多样性进一步细分为: (1)功能丰富度(FRic); (2)功能均匀度(FEve); (3)功能离散度(FDiv)(Villéger et al., 2008).功能丰富度代表群落中物种占据生态位空间的大小, 体现的是生态位空间利用程度的指数, 常使用物种或群落生态位中性状空间的凸包体积计算获得, 而功能均匀度和功能离散度则代表生态位空间中功能性状分布的均匀程度或离散程度. ...
Let the concept of trait be functional!
1
2007
... 早期对于功能多样性的研究大多采用物种多样性及功能型组, 但随着计算机技术的高速发展, 很多复杂的数学公式被引入到功能多样性的研究中, 例如用影响生态系统结构与功能的功能性状替代物种间的遗传距离, 从而可以得出一些计算功能多样性的方法(Botta-Dukát, 2005; Violle et al., 2007).随后, 研究者们认为仅采用一种指数难以代表生态系统功能多样性(Mouillot et al., 2005), 从而将功能多样性进一步细分为: (1)功能丰富度(FRic); (2)功能均匀度(FEve); (3)功能离散度(FDiv)(Villéger et al., 2008).功能丰富度代表群落中物种占据生态位空间的大小, 体现的是生态位空间利用程度的指数, 常使用物种或群落生态位中性状空间的凸包体积计算获得, 而功能均匀度和功能离散度则代表生态位空间中功能性状分布的均匀程度或离散程度. ...
Original articles: plant attribute diversity, resilience, and ecosystem function: the nature and significance of dominant and minor species
1
1999
... 近年来, 以植物功能性状为基础的研究方法被广泛应用到各个尺度中, 根据不同的尺度, 可选用不同的性状指标评估特定尺度下生态系统的功能(Tilman et al., 1997; Walker et al., 1999; Gillison, 2013; 刘晓娟和马克平, 2015; 韩涛涛等, 2021).功能多样性是生物多样性的重要组成部分, 是解释和预测生态系统过程和功能的重要驱动力(Petchey & Gaston, 2002; Petchey et al., 2004), 反映了群落、景观、甚至区域尺度内功能性状的变异性, 决定了生态系统的功能和稳定性(Tilman, 1997; Ruiz-Benito et al., 2014).由于对于功能多样性的不同理解会产生不同的研究方法(Mason et al., 2003, 2005; Botta-Dukát, 2005; Laliberté & Legendre, 2010), 而这些方法对于植物功能性状选取、功能多样性计算、生态系统功能评估的影响较大, 因此有必要对功能多样性做一个统一的定义.Tilman (2001)认为功能多样性是影响生态系统功能的群落中所有物种及有机物的功能特征值及其变动范围, 强调的是特征值的差异性.由于此概念具有较强的概括性和可操作性, 因而被普遍接受并广泛用于计算生态系统结构与功能的各个方面(Petchey & Gaston, 2002; Mason et al., 2003, 2005; Petchey et al., 2004). ...
Effects of grazing management system on plant community structure and functioning in a semiarid steppe: scaling from species to community
1
2011
... 越来越多的研究证明, 功能多样性即群落中物种的功能差异性(Tilman, 2001; Petchey & Gaston, 2002)是生态系统过程的决定因素(Díaz & Cabido, 2001; Loreau et al., 2001; 臧岳铭等, 2009).植物功能性状是研究生态系统结构与功能变化的中间桥梁(孙国钧等, 2003).Wan等(2011)指出可以通过改变植物的种类组成和性状来影响区域尺度上的功能多样性, 本研究所选的生态系统功能仅为地上生物量, 覆盖面较小.因此, 研究各性状有何种功能, 各种性状组合计算得到的功能多样性具体又指代生态系统的何种功能, 可作为下一步研究的重点. ...
刈割、施肥对高寒草甸物种多样性与生态系统功能关系的影响及群落稳定性机制
1
2013
... FEve与群落地上生物量的关系最弱, 且呈负相关关系, 即群落生产力随FEve的增加而降低, 说明生产力可能主要源于对某一资源集中利用的物种的生物量.FEve被用作指示资源的利用程度, 低的均匀度表示有些生态位空间虽被占据但未充分利用, 不对生物量的增加起促进作用.本研究结果支持“质量比”假说, 即群落中起支配作用的物种的属性和相对多度对生态系统过程有决定性作用(Grime, 1998), 优势种利用了大部分资源, 而非优势种则对生物量的贡献较小, 因此地上生物量随FEve的降低而升高(马文静, 2014).FDiv与地上生物量间的相关性并不显著, 功能离散度表示群落功能性状的多度在性状空间内的离散程度, 离散度高说明植物在性状空间边缘较多分布.研究结果显示, 地上生物量随FDiv的增加表现出降低趋势, 可能是由于可利用资源较少, 使得植物功能性状的分布发生改变, 为了获取更多资源, 植物性状不在边缘聚集, 也与之前的研究结果(李晓刚等, 2011; 王海东等, 2013)一致.有研究发现FDiv对生产力的影响在施肥或者干扰的条件下显著, 说明在资源条件较好的情况下, 植物种间竞争增强, 促进了植物不同功能性状的分化, 有利于植物生存和对资源的有效利用, 群落生产力增加(Bernhardt et al., 2011). ...
Influence of species richness, evenness, and composition on optical diversity: a simulation study
1
2018
... 遥感反演功能多样性的原理是基于系统发育差异和资源限制导致的植物性状不同(Schweiger et al., 2018), 进而影响光学遥感测量的光谱反射率(Wang et al., 2018).而功能多样性计算中涉及的功能性状需要既考虑其生态意义(如生存策略和生态系统过程或功能), 也要兼顾其遥感反演精度.然而, 对于不同的物种组成类型, 在不同的环境梯度下, 哪些性状和多少性状最能反映生态策略或功能的主要变化, 目前尚不清楚, 因此在具体研究中应考虑二者的权衡来反演功能多样性. ...
草地碳循环遥感研究进展
1
2018
... 传统的功能多样性的计算通常依赖大量的野外调查, 基于野外获得的生物多样性和功能性状进一步得到功能多样性, 测定手段费时费力, 同时也受时间和空间尺度的制约, 不适用于长期大规模的区域监测.遥感数据具有探测范围广、数据获取周期短、可重复等特点, 使得其在大尺度生物多样性监测和评估及制图方面具有极大的优势(Roughgarden et al., 1991), 已经成为评估生态系统功能多样性的重要工具.目前, 基于遥感的功能多样性的监测方法已经在森林生态系统中成功应用.Asner等(2017)和Schneider等(2017)分别基于聚类分析和基于像元的功能多样性遥感反演方法, 利用机载高光谱数据成功绘制了高空间分辨率的植物功能多样性空间分布图.Durán等(2019)利用成像光谱学和叶片性状相结合的方法, 基于偏最小二乘回归(PLSR)估算了亚马孙至安第斯山脉热带森林不同海拔高度的功能多样性, 同时发现通过遥感获得的单一性状或多性状计算得到的功能多样性是净初级生产力和总生产力变化的重要预测因素.但由于草地类型多样、覆盖度低、植株矮小且多数混合生长等特点, 相较于森林生态系统, 在大尺度上进行草地生态系统监测难度较高(辛晓平等, 2018). ...
高寒矮嵩草草甸物种多样性与功能多样性对初级生产力的影响
1
2009
... 越来越多的研究证明, 功能多样性即群落中物种的功能差异性(Tilman, 2001; Petchey & Gaston, 2002)是生态系统过程的决定因素(Díaz & Cabido, 2001; Loreau et al., 2001; 臧岳铭等, 2009).植物功能性状是研究生态系统结构与功能变化的中间桥梁(孙国钧等, 2003).Wan等(2011)指出可以通过改变植物的种类组成和性状来影响区域尺度上的功能多样性, 本研究所选的生态系统功能仅为地上生物量, 覆盖面较小.因此, 研究各性状有何种功能, 各种性状组合计算得到的功能多样性具体又指代生态系统的何种功能, 可作为下一步研究的重点. ...
Steady-state chlorophyll a fluorescence detection from canopy derivative reflectance and double-peak red-edge effects
1
2003
... Calculating formula of vegetation index
Table 1 植被指数
Vegetation index | 计算公式
Calculate formula | Sentinel-2波段
Sentinel-2 band used | 参考文献
Reference |
| TCARI | 3[(R699.19 - R668.98) - 0.2(R699.19 - R550.67)(R699.19/R668.98)] | B3, B4, B5 | Kim et al., 1994 |
| OSAVI | (1 + 0.16)(R750 - R705)/(R750 + R705 + 0.16) | B5, B6 | Wu et al., 2008 |
| OSAVI2 | (1 + 0.16) (R800 - R670)/(R800 + R670 + 0.16) | B4, B7 | Rondeaux et al., 1996 |
| D | R730/R706 | B5, B6 | Zarco-Tejada et al., 2003 |
| Datt | (R850 - R710)/(R850 - R680) | B4, B5, B8 | Datt, 1999 |
| Datt2 | R850/R710 | B5, B8 | Datt, 1999 |
| Gitelson | 1/R700 | B5 | Gitelson et al., 1999 |
| SR | R750/R700 | B5, B6 | Gitelson & Merzlyak, 1997 |
| SR2 | R700/R670 | B4, B5 | McMurtrey III et al., 1994 |
| MSI | R1600/R819 | B8, B11 | Hunt Jr & Rock, 1989 |
| NDVI705 | (R750 - R705)/( R750 + R705) | B5, B6 | Sims & Gamon, 2002 |
| CRI1 | 1/R510 - 1/R550 | B2, B3 | Gitelson et al., 2003 |
| CRI2 | 1/R510 - 1/R700 | B2, B5 | Gitelson et al., 2002 |
| ARI1 | 1/R550 - 1/R700 | B3, B5 | Sims & Gamon, 2002 |
| ARI2 | R800(1/R550 - 1/R700) | B3, B5, B7 | Gitelson et al., 2002 |
| NDVI | (R842 - R665)/(R842 + R665) | B4, B8 | Huete et al., 1997 |
| GNDVI | (R783 - R560)/(R783 + R560) | B3, B7 | Rozenstein et al., 2019 |
| TNDVI | [(R842 - R665)/(R842 + R665) + 0.5]0.5 | B4, B8 | Rozenstein et al., 2019 |
| WDVI | R842 - 0.5R665 | B4, B8 | Rozenstein et al., 2019 |
| NDI45 | (R705 - R665)/(R705 + R665) | B4, B5 | Delegido et al., 2011 |
| SAVI | (1 + 0.5) × (R799.09 - R680.045)/(R799.09 + R680.045 + 0.5) | B4, B7 | Huete, 1988 |
| SAVI2 | R799.09/(R680.045 + b/a) (a = 0.97, b = 0.08) | B4, B7 | Major et al., 1990 |
| ARVI | ARVI = (R799.09 -R680.045 + R444.5 + R680.045)/(R799.09 + R680.045 - R444.5 - R680.045) | B1, B4, B7 | Kaufman & Tanre, 1992 |
| SARVI | RB = R680.045 - (R444.5 - R680.045)
SARVI = (1 + 0.5)(R799.09 -R680.045 + R444.5 + R680.045)/(R799.09 + R680.045 -
R444.5 - R680.045 + 0.5) | B1, B4, B7 | Kaufman & Tanre, 1992 |
| EVI | 2.5(R799.09 - R680.045)/(R799.09 + 6R680.045 - 7.5R444.5 + 1) | B1, B4, B7 | Huete et al., 1997 |
| IRECI | (R783 - R665)/(R705/R740) | B4, B5, B6, B7 | Frampton et al., 2013 |
| IPVI | R842/(R842 + R665) | B4, B8 | Rozenstein et al., 2019 |
| PSSRA | R783/R665 | B4, B7 | Rozenstein et al., 2019 |
| RVI | R842/R665 | B4, B8 | Rozenstein et al., 2019 |
| mNDVI705 | (R750 - R705)/( R750 + R705 - 2R445) | B1, B5, B6 | Datt, 1999 |
| mSR705 | (R750 - R445)/( R705 + R445) | B1, B6 | Datt, 1999 |
| SIPI | (R800 - R445)/( R800 - R680) | B1, B7 | Penuelas et al., 1995 |
| NDWI | (R865 - R1614)/( R865 - R1614) | B8A, B11 | McFeeters, 1996 |
R表示range, 其右下角数值表示光谱值范围.ARI, 花青素反射指数; ARVI, 耐大气植被指数; CRI, 类胡萝卜素反射指数; D, 双峰光学指数; DATT, DATT植被指数; EVI, 增强型植被指数; Gitelson, Gitelson植被指数; GNDVI, 绿色归一化差异植被指数; IPVI, 红外植被百分比指数; IRECI, 倒红边叶绿素指数; mNDVI705, 改进红边归一化植被指数; MSI, 水分胁迫指数; mSR705, 改进红边比值植被指数; NDI45, 归一化差异指数; NDII, 归一化红外指数; NDVI, 归一化植被指数; NDWI, 归一化差值水体指数; OSAVI, 优化型土壤调节植被指数; PSRI, 植物衰老反射指数; PSSRA, 特征色素简单比值指数; RVI, 比值植被指数; SARVI, 土壤大气阻抗植被指数; SAVI, 土壤调节植被指数; SIPI, 结构不敏感色素植被指数; SR, 比值植被指数; TCARI, 转换型叶绿素吸收植被指数; TNDVI, 转化后的归一化植被指数; WDVI, 加权差分植被指数. ...
Hyperspectral retrieval of leaf physiological traits and their links to ecosystem productivity in grassland monocultures
2
2021
... 群落生产力表征区域环境条件下植被的生产能力, 反映了生态系统的生长特征和健康状况, 早期的很多研究认可了物种多样性对生产力的贡献, 但近年来, 一些研究认为相对于物种多样性, 功能多样性更能影响群落生产力(Díaz & Cabido, 2001; Römermann et al., 2001).因此开展对天然草地的功能多样性遥感监测及其与生产力关系的研究可以更好地探究功能多样性与生态系统功能之间的关系.然而, 功能多样性与生产力的关系较为复杂, 主要有“质量比假说” (Grime, 1998)和“多样性假说” (Tilman et al., 1997).前者认为优势物种的性状大小决定了群落的生产力, 后者认为多样性高导致功能性状差异加大, 从而提高了资源的利用效率.两种假说的相对重要性至今仍有争论, 是研究的热点.地上生物量作为群落生产力的有力度量指标, 因其观测相对便利常用来代替群落生产力(Kassen et al., 2000; Bai et al., 2007).基于单种栽培草地平台, Zhao等(2021)发现无人机高光谱反演的与光合作用相关的叶绿素、碳、氮含量等叶片生理性状, 是草地单种栽培群落地上生物量的重要预测因子, 进一步分析了功能多样性与生产力的关系.然而, 当前基于天然草地的功能多样性遥感监测及其与生产力的关系还鲜有研究. ...
... 本研究中遥感预测的功能多样性与地上生物量的关系与实测相一致, 证明了基于遥感反演分析两者关系的潜力.通过遥感预测功能多样性与地上群落生物量的关系发现, FRic对群落地上生物量的解释度最高(R2 = 0.40), 而FEve (R2 = 0.27)和FDiv (R2 = 0.28)与群落地上生物量关系较弱, 这与Zhao等(2021)的研究结果一致.植物的光合作用是物质生产的主要来源(Blackburn, 2007), 与光合作用有关的叶片性状叶绿素、类胡萝卜素和叶片氮含量等与群落生产力直接相关(Marron et al., 2005; da Silveira Pontes et al., 2010; Durán et al., 2019).本研究中用于计算功能多样性的叶绿素含量、比叶面积、叶片氮含量和叶片含水量4种功能性状均被大量研究证实与生产力直接或间接相关, 随着这4种功能性状在植物体内含量的增加, 物种光合作用加强, FRic增加, 生产力上升(Cadotte et al., 2011; Fyllas et al., 2017; Durán et al., 2019).Bernhardt等(2011)的研究结果也表明群落生产力有随着FRic指数增加而增加的趋势. ...


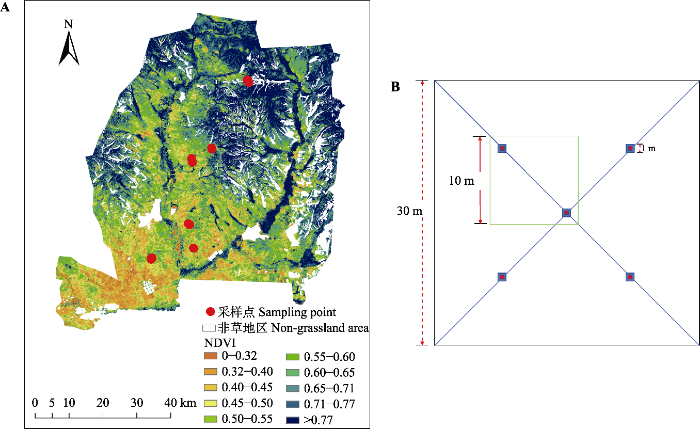
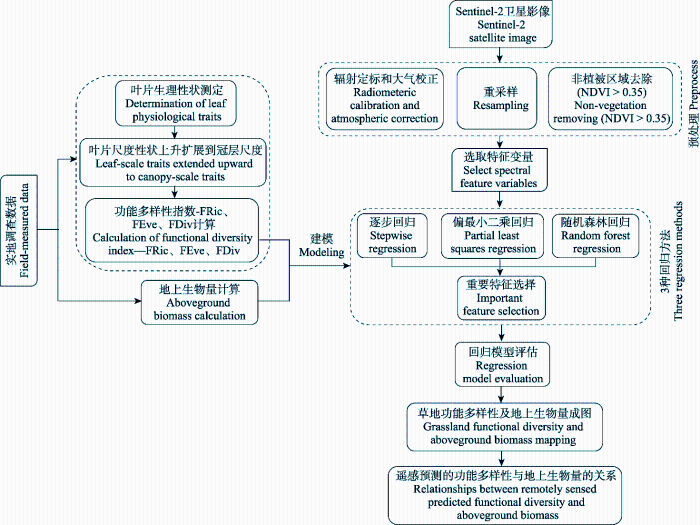
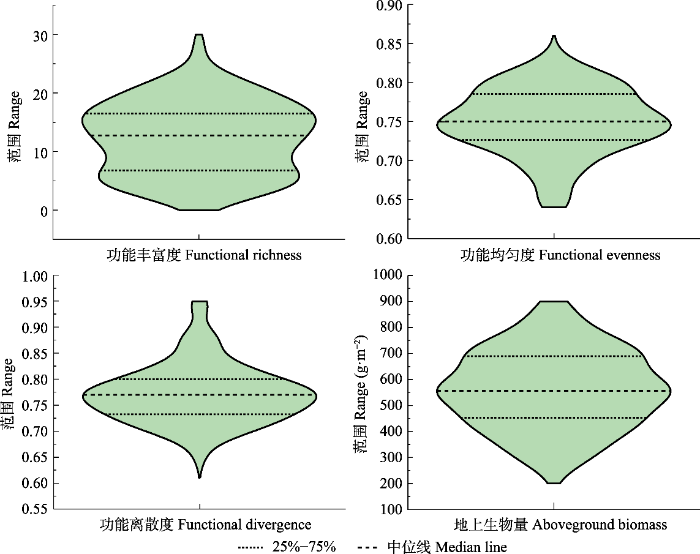
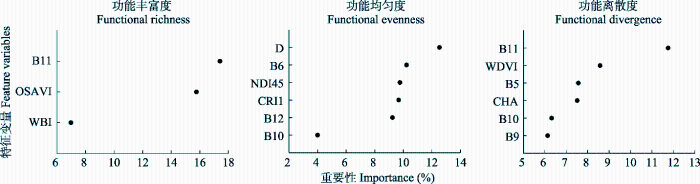
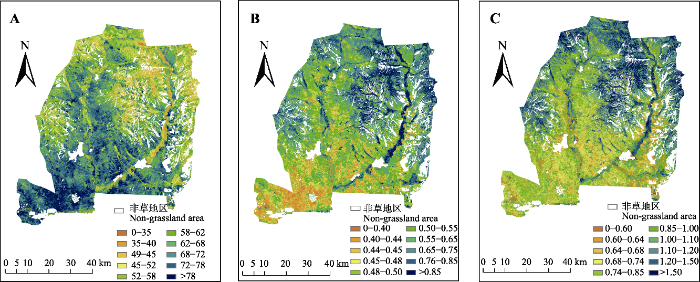
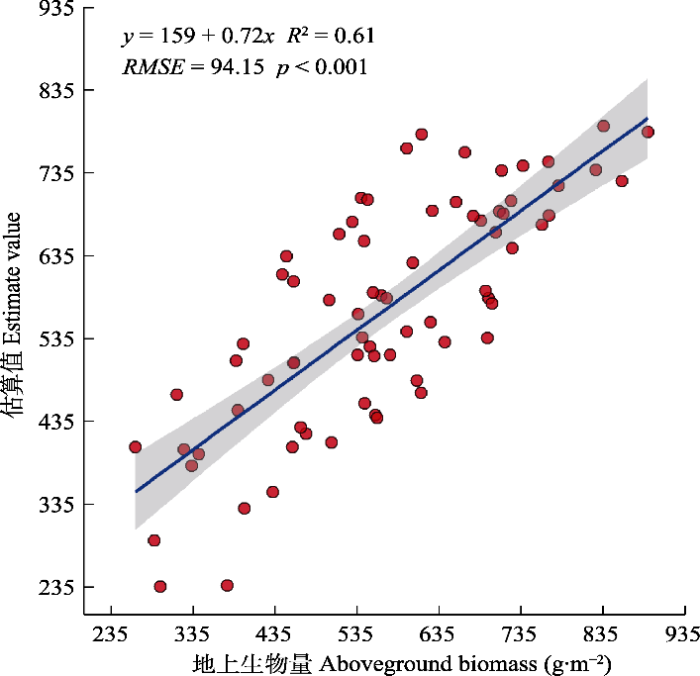
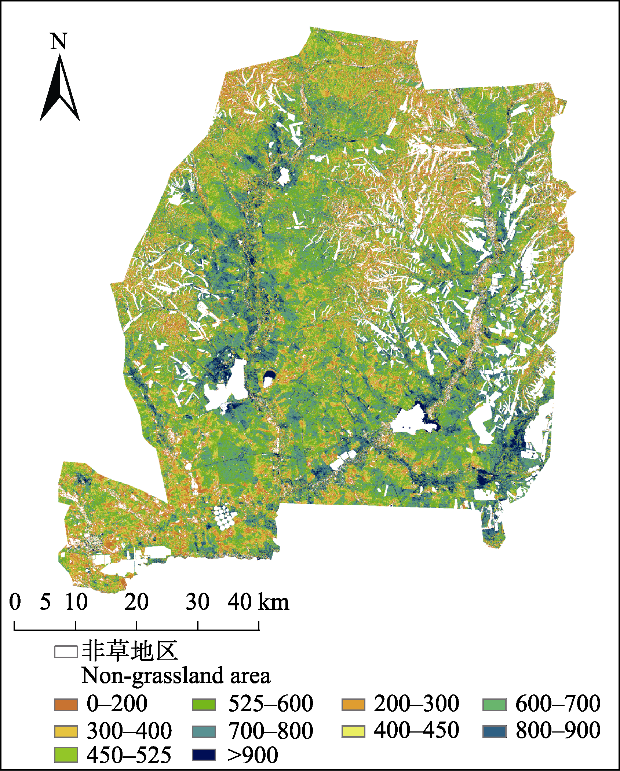
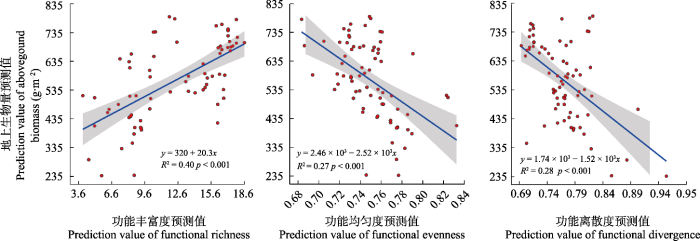

