


常用的草地地上生物量(AGB)估算方法主要包括野外实地调查和近地面遥感(Xu et al., 2020)。野外实地调查的方法基于直接收割草地样方, 此方法不仅费时费力, 破坏性大, 同时会对研究区域植被结构造成严重干扰(Catchpole & Wheeler, 1992)。近地面遥感的方法是基于光学遥感进行的草地地上生物量估算, 其研究尺度较大, 但往往因光学成像的饱和效应和空间分辨率的限制, 使得小尺度样方的地上生物量难以准确估算(Jin et al., 2009; Xu et al., 2020)。此外, 基于不同光学影像和分类方法的地上生物量估算结果也存在较大差异。其中, 利用激光雷达估算的地上生物量较为准确(Cooper et al., 2017), 但由于设备成本较高, 难以广泛推广。因此, 探索简单、快速且非破坏性的草地样方地上生物量估测方法, 对于草地生态学长期定位研究具有重要价值, 也有助于提高基于尺度外推的区域地上生物量评估的精度。
植被覆盖度(FVC)是评估植被生长季节动态和草地退化的重要指标(Gao et al., 2020), 更是决定干旱半干旱草地地上生物量最核心的参数。草地地上生物量通常与植被覆盖度显著正相关(Wei, 2010; Dusseux et al., 2015; Yang et al., 2018)。传统的植被覆盖度监测方法主要包括采样法和目视估测法。采样法通过对选定样方进行等距不连续采样, 计算出现植被的采样点占全部采样点的比值, 得到植被覆盖度。这种方法虽然比较准确, 但费时费力(张云霞等, 2003)。目视估测法则是研究人员凭经验判断样方内植被覆盖的比例, 由于样方异质性和调查人员的观测标准存在差异, 植被覆盖度的个人目估误差最高可达40% (章文波等, 2001)。近年来, 利用数码相机从照片中获取植被覆盖度的新方法不断发展, 获得的植被覆盖度结果也更为精确(胡健波等, 2011)。
除了植被覆盖度和植被高度外, 草地冠层结构的复杂度是决定草地地上生物量的另一个关键参数(Fang et al., 2021)。叶面积指数(LAI)是表征草地冠层复杂程度的一个较易获取的参数, 其测定方法较为成熟, 且与草地地上生物量呈现显著的正相关关系(Friedl et al., 1994; Fang et al., 2019)。另一个指征冠层复杂程度的指标为植株间高度的变异, 它可以用样方内植物高度的变异系数来衡量(Li et al., 2021)。同时, 不同植物可能具有互补的枝条结构, 因此冠层的复杂度受生物多样性的影响。通常多样性越高, 在垂直和水平方向上冠层的异质性也就越强, 冠层结构也越复杂(Tappeiner & Cernusca, 1989; Spehn, 2000), 物种丰富度或多样性可能也会影响地上生物量。
为了探究快速准确的草地地上生物量估算方法, 本研究依托内蒙古一典型草地刈割控制实验平台, 获取样方植被覆盖度、植被高度、高度变异系数、物种丰富度、LAI、香农-维纳多样性指数以及植物含水量等指标; 同时基于以上观测指标, 通过多元统计模型和随机森林等方法, 估算草地样方地上生物量, 建立草地样方地上生物量非破坏性取样的评估方法。
1 材料和方法
1.1 研究区概况及实验设计
本研究在土地利用变化野外控制实验平台进行。实验平台的土地利用分为4个处理: 对照、中度刈割、重度刈割、翻耕, 每个处理6个重复。每年5月到9月初, 对中度刈割和重度刈割处理的样地剪草一次, 分别在地面上留茬10 cm和5 cm, 对翻耕处理的样地人工去除植物生物量一次(翻耕样地于2013年翻耕20 cm深的表土)。本研究在对照草地设置了6个1 m × 1 m样方, 同时在3种不同土地利用方式的样地内, 各设置了12个1 m × 1 m的样方, 共计42个样方。
1.2 数据采集及处理
野外调查于2020年7月底进行, 实地测量每个样方的植被平均高度(hmean)、植被最小高度(hmin)、植被最大高度(hmax)、叶面积指数、物种丰富度(richness)和地上生物量, 并通过数码相机照片获取每个样方植被覆盖度。
首先, 在物种水平上, 针对最大、中等和最小高度, 分别选取3株个体作为重复, 用钢尺测量其高度, 得到物种水平上的平均高度、最小高度和最大高度, 并计算样方内所有物种的高度平均值作为样方内植被对应的平均高度、最小高度以及最大高度。然后, 通过AccuPAR植物冠层分析仪(AccuPAR LP-80, METER, Pullman, USA)测定每个样方对应的LAI: 具体按先上后下, 从左到右的顺序, 对植被冠层和基部分别测定5次, 取平均值作为该样方的LAI。此外, 对样方进行物种调查, 得到物种丰富度。最后, 在样方内沿基部进行刈割并收获植物样品, 测定样品鲜质量; 将样品放入65 ℃的烘箱中烘干至恒质量, 得到该样方对应的地上生物量, 根据公式(3)计算植物样品含水量。
为评估植被覆盖度, 本研究利用垂直固定在离地1.3 m处的数码相机拍摄样方照片。照片取景范围为1 m × 1.3 m, 将照片裁剪至只保留样方区域后, 使用ENVI软件(版本5.2)提取植被覆盖度。ENVI软件依据最大似然分类法, 使用与特定像素相适应的先验概率进行分类(Strahler, 1980)。该分类方法精度较高, 且计算速度快, 是目前使用较多的基准分类方法(Khatami et al., 2016)。具体分析过程主要包括定义训练样本、执行监督分类、评价分类结果3个步骤。首先, 利用ENVI软件导入拍摄的样方照片, 校准RGB; 其次, 使用ROI工具定义植被区和非植被区, 定义的植被区需涵盖所有的植被类型; 然后, 对图片进行最大似然分类处理; 最后, 利用软件自带的统计工具对输出的双色图片进行分析, 得到样方的植被覆盖度。经过处理的图像与原图像中的植被区域较为一致(图1)。
图1
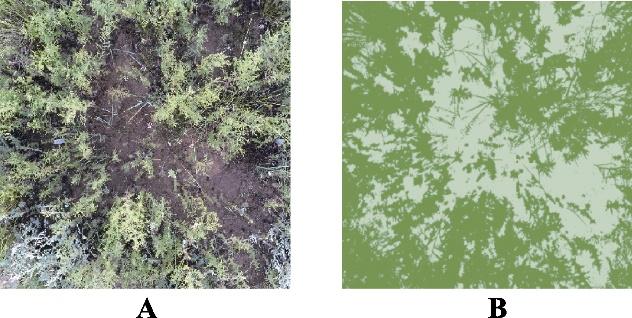
图1
数码相机获取的原始植被图片(A)和ENVI处理后的植被图片(B)。B中绿色区域为植被区域, 浅色区域为非植被区域。
Fig. 1
Original digital photo obtained by digital camera (A) and the photo processed by ENVI (B). The green area in figure B indicates vegetation area, and light-colored area indicates non-vegetation area.
植被高度变异系数(CV)计算公式如下:
式中, hsd代表样方内植物高度的标准差。
香农-维纳多样性指数(H'), 即植被多样性指数, 计算公式如下:
式中, S表示样方内植物物种丰富度, ni表示样方中第i个物种的个体数, N表示样方内所有物种对应的总个体数。
样方植物的含水量(MC)计算公式如下:
式中,
1.3 模型的建立和验证
本研究对采集的所有数据进行皮尔逊相关分析, 包括地上生物量、植被覆盖度、植被平均高度、植被最小高度、植被最大高度、LAI、物种丰富度、植被高度变异系数、香农-维纳多样性指数以及植物含水量10个变量。此步骤使用R语言中的“corrplot”包完成。在相关分析结果的基础上进行模型预测, 首先选取与地上生物量相关性最高的6个参数, 分别建立单一变量与地上生物量关系的线性模型与指数模型; 然后使用逐步回归模型和随机森林模型, 建立实测变量与地上生物量的最优模型, 并对实测和预测生物量进行对比和交叉验证, 综合多因素对地上生物量进行估算。
本研究所构建的逐步回归模型的因变量为草地地上生物量, 自变量为植被覆盖度、植被平均高度、植被最小高度、植被最大高度、LAI、物种丰富度、植被高度变异系数、香农-维纳多样性指数、植物含水量, 以及植被覆盖度、LAI、植被平均高度这3个变量之间的交互作用项。通过选择最小的赤池信息量(AIC)获得最优模型。逐步回归模型的建立和验证由R语言中的“stepwise”包实现。
本研究使用的另一多元统计模型为随机森林模型, 这是一种基于分类树算法的多元统计方法(Breiman, 2001)。在机器学习的诸多算法中, 随机森林因高效准确而备受关注, 在生态学等研究中应用得越来越广泛(Cutler et al., 2007; Genuer et al., 2010), 特别是在处理存在多重共线性和交互作用的数据时准确率较高(李欣海, 2019)。在构建模型时, 随机森林包含两个非常重要的参数: mtry和ntree。其中, 参数ntree表示模型中的决策树数量; 参数mtry表示每个节点上随机选择的预测变量数量(李欣海, 2013)。随机森林模型的变量与逐步回归模型中的变量一致。随机森林模型的构建和验证均采用R软件中的“RandomForest”包实现。
在模型构建后, 通过计算预测生物量和实测生物量之间的决定系数(R2)和均方根误差(RMSE)来完成模型的精度评价, 相关计算公式如下:
式中, n代表样方的数量,
此外, 本研究使用交叉验证, 对每个模型的泛化能力表现进行了评估(Stone, 1977)。首先, 对所有样本进行多次随机抽样, 依次随机抽取70%、72%、74%、76%、78%、80%的样本用于模型训练, 剩余样本作为测试样本对训练模型进行验证。然后, 通过计算预测生物量和实测生物量之间的R2和RMSE来评估模型的泛化能力(附录图A-N)。以上所有分析均由R 4.0.5软件实现。
2 结果
2.1 相关性分析
图2
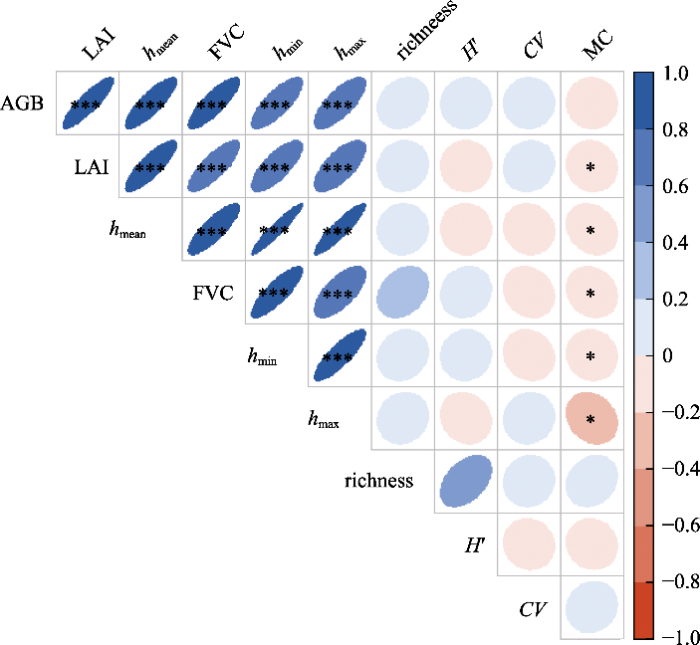
图2
草地地上生物量估算中各变量的相关矩阵。每个方框内的椭圆颜色和尺寸大小代表变量间的相关方向和程度, 蓝色代表正相关, 红色代表负相关, 颜色越深代表相关性越强。AGB, 地上生物量; CV, 高度变异系数; FVC, 植被覆盖度; H', 香农-维纳多样性指数; hmax, 植被最大高度; hmean, 植被平均高度; hmin, 植被最小高度; LAI, 叶面积指数; MC, 含水量; richness, 物种丰富度。*, p < 0.05; ***, p < 0.001。
Fig. 2
Correlation matrix among variables in grassland aboveground biomass estimation. The color and size of each ellipse represent the correlation direction and degree between variables; the blue and red colors represent positive and negative correlations, respectively, and the correlation degree is stronger when the red or blue color of each ellipse gets deeper. AGB, aboveground biomass; CV, coefficient of variation for vegetation height; FVC, fractional vegetation cover; H', Shannon-Wiener index; hmax, maximum vegetation height; hmean, mean vegetation height; hmin, minimum vegetation height; LAI, leaf area index; MC, moisture content; richness, species richness. *, p < 0.05; ***, p < 0.001.
2.2 一元回归模型
图3
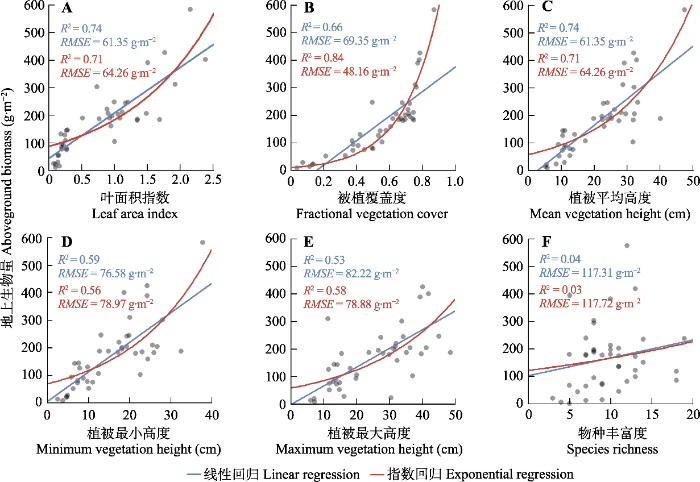
图3
草地地上生物量一元回归模型的预测结果。决定系数(R2)和均方根误差(RMSE)以对应的颜色显示。
Fig. 3
Prediction results of univariate regression model of grassland aboveground biomass. The determination coefficient (R2) and root-mean-square error (RMSE) from linear regression (blue) and exponential regression (red) are given.
2.3 逐步回归模型与随机森林模型
使用LAI、植被平均高度、植被覆盖度、植被最小高度、植被最大高度、物种丰富度、香农-维纳多样性指数、植被高度变异系数及样方植物含水量, 以及LAI、植被平均高度和植被覆盖度三者的交互作用项, 建立逐步回归模型。通过逐步回归筛选的最优模型对地上生物量的预测精度可达到91%, 模型的RMSE = 35.60 g·m-2 (图4A), 最优模型如下:
图4
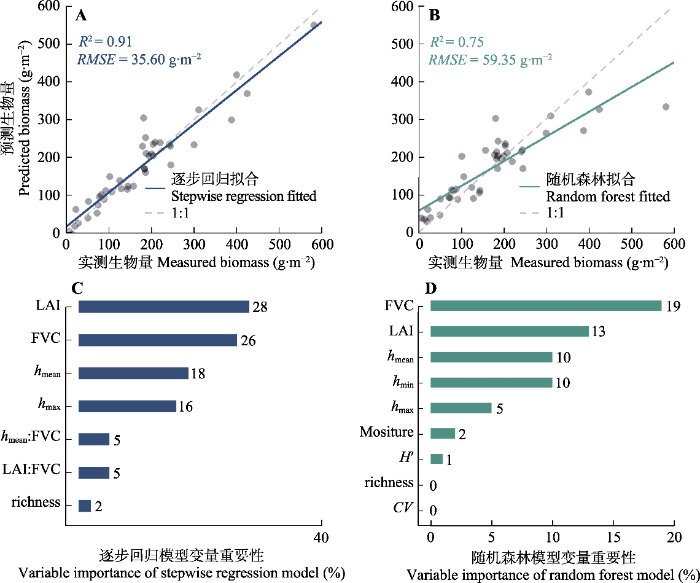
图4
草地地上生物量预测模型及变量相对重要性。蓝色实线代表逐步回归模型(A)的拟合线, 绿色实线代表随机森林模型(B)的拟合线, 灰色虚线为1:1线, 对应模型的决定系数(R2)和均方根误差(RMSE)在左上角进行标示。模型变量重要性: 逐步回归模型(C), 随机森林模型(D)。条柱旁边的数字代表变量对应的相对重要性, 冒号连接的变量代表变量间的交互作用; 逐步回归模型的变量重要性来源于不同变量对R2的贡献, 随机森林模型的变量重要性来源于均值递减精度的方法。CV, 高度变异系数; FVC, 植被覆盖度; hmean, 植被平均高度; hmax, 植被最大高度; hmin, 植被最小高度; H', 香农-维纳多样性指数; LAI, 叶面积指数。
Fig. 4
Grassland aboveground biomass prediction models and relative importance of variables. The blue and green solid lines represent the fitted lines of the stepwise regression model (A) and random forest model (B), respectively; the grey dashed line denotes the 1:1 line. The determination coefficient (R2) and root mean square error (RMSE) of the two models are also marked by the corresponding color. The relative importance of variables in the stepwise regression model (C) and random forest model (D) are shown; numbers next to the bars indicate the relative importance of each variable; variables connected by colons represent interactions between variables; the variable importance of stepwise regression model is derived from the contributions of different variables to R2, and the variable importance of random forest model is derived from the mean decrease accuracy. CV, coefficient of variation for vegetation height; FVC, fractional vegetation cover; hmean, mean vegetation height; hmax, maximum vegetation height; hmin, minimum vegetation height; H', Shannon-Wiener index; LAI, leaf area index.
由于随机森林模型本身可以量化交互作用, 因此在该模型中无需加入变量的交互作用项。随机森林的预测精度为R2 = 0.75, RMSE = 59.35 g·m-2。
通过交叉验证, 对逐步回归模型和随机森林模型的泛化能力进行评估。和随机森林模型相比, 逐步回归模型的泛化能力更强, 预测生物量和实测生物量之间的R2大于0.8; 随机森林模型的泛化能力次之, 预测生物量和实测生物量之间的R2大于0.7 (附录图M、N)。
3 讨论
相关性分析显示, LAI、植被覆盖度、植被平均高度、植被最小高度和植被最大高度是预测草地地上生物量最重要的变量, 物种丰富度、香农-维纳多样性指数、植被高度变异以及植物含水量与地上生物量的关系并不显著(图2)。此外, 各相关变量对地上生物量的预测能力和解释度存在明显差异。
本研究发现, 当建立各变量与地上生物量的线性模型时, LAI对地上生物量的预测精度最高, 解释度可达到74% (图3A)。这是因为LAI可以较为准确地反映植被冠层的结构(Chen & Black, 1992), 且与植物群落光合能力密切相关, 因此最能反映草地生长状况和生物量(Wang et al., 2019)。此外, 一项对法国西部草地的研究发现LAI可以解释68%的地上生物量变异, 而植被覆盖度仅能解释50% (Dusseux et al., 2015)。本研究的线性模型模拟结果与其类似, 植被覆盖度的解释度仅为66% (图3B)。这是因为植被覆盖度与地上生物量存在非线性关系(Sanaei et al., 2019), 导致植被覆盖度在线性模型中对地上生物量解释度偏低。本研究发现在指数模型中, 植被覆盖度对地上生物量的预测能力显著提升, 且超过LAI对地上生物量的解释度(图3B)。因此, 就一元模型而言, 以植被覆盖度作为单一变量的指数模型对草地地上生物量的预测最为准确, 这一结果与先前的研究结果(Xu et al., 2020)基本一致。
除植被覆盖度外, 逐步回归模型表明LAI、植被平均高度、植被最大高度和物种丰富度4个关键参数对地上生物量影响较大(图4C)。以往研究表明, LAI与草地地上生物量显著正相关(Wang et al., 2019); 在植被覆盖度的基础上加入植被高度这一变量后, 草地地上生物量预测模型拟合R2从43%上升至68%(Liang et al., 2016)。在本研究中, LAI、植被高度以及物种丰富度的加入, 同样使得模型对地上生物量的预测度提升, 其解释度由84%上升到91% (图3, 图4)。本研究进一步发现, 与植被最小高度和植被最大高度相比, 植被平均高度对地上生物量的预测效果更好(图4C、4D)。植被覆盖度表征植物群落的水平二维结构(Jacquemoud et al., 2009), 结合LAI和植被高度的信息, 能较好地表征植被冠层的三维特征, 准确指示草地样方的地上生物量状况。由LAI、植被覆盖度、植被平均高度、植被最大高度和物种丰富度构筑的逐步回归模型, 可以克服单一变量模型不够稳定、容易造成较大误差的缺点, 估算精度提高。在本研究中, 与应用广泛的机器学习模型相比, 逐步回归模型表现出更好的预测能力(图4A、4B), 原因可能是多元线性模型比机器学习模型更加适合样本量较少的回归分析(Abrougui et al., 2019)。
由于空间异质性和人为主观性的限制, 草地样方的实地测量很难在更大的区域开展(葛静等, 2017), 而简单地利用有限的实地单点调查数据推算整个区域的生物量可能产生较大误差(Fang et al., 2010)。以往使用目视估测法获取覆盖度的同类研究, 对地上生物量的解释非常有限(Sanaei et al., 2019), 而本研究对地上生物量的预测精度超过90%。本研究提供的方法可以在一定程度上解决当前草地样方地上生物量测定存在的问题, 如破坏性取样和样方地上生物量估测精度有限。本研究的目的并非是建立普适性的地上生物量估算模型, 事实上由于采样点较少, 草地样方本身的代表性有限, 所得到的草地地上生物量估算模型仅适用于本研究样地。但本研究所采用的非破坏性、快速、高精度获取植被地上生物量的方法, 可为相关研究提供借鉴。
4 结论
本研究在内蒙古设置的长期土地利用变化野外控制实验平台, 通过野外实际测定草地LAI、植被高度、物种丰富度和地上生物量等参数, 结合ENVI软件处理植被数码照片, 获取植被覆盖度, 建立草地地上生物量估算模型。相对于以往的目视估测法, 本研究使用ENVI软件处理数码照片, 将可有效提高植被覆盖度提取的效率和精度; 基于对植被覆盖度的准确量化, 结合植被高度和LAI测定, 构建了低成本、快速定量草地地上生物量的方法, 可实现不同样方地上生物量的估算。最终, 本研究发现, 使用单一变量时, 植被覆盖度的指数模型最适用于草地样方地上生物量的估算。多变量模型时, 利用LAI、植被覆盖度、植被平均高度、植被最大高度和物种丰富度, 构建了泛化能力较强的多参数模型, 为估算草地地上生物量提供方法指导, 同时也在传统的生物量估算方法基础上做出了补充。未来我们可以通过以点扩面的形式, 结合遥感手段获取LAI和植被覆盖度、植被高度等信息, 通过遥感和模型相结合的方法进行多尺度研究, 进一步解决草地地上生物量估算中的尺度转换问题, 为草地生态系统研究和草地资源调查提供支持。
附录 草地地上生物量估算所有模型的泛化能力表现评估结果
Supplement Results of generalization ability of all models for grassland aboveground biomass estimation
参考文献
Prediction of organic potato yield using tillage systems and soil properties by artificial neural network (ANN) and multiple linear regressions (MLR)
DOI:10.1016/j.still.2019.01.011
[本文引用: 1]

Tillage aims to prepare the soil with the adequate treatment to create the ideal and most favorable conditions for cultivation. To evaluate the effect of tillage systems on soil environment, it is mandatory to measure the modifications in physical, chemical and biological properties. In recent decades, artificial intelligence systems were used for developing predictive models to simplify, estimate and predict many farming processes. They are also employed to optimize performance and control risks. These systems have become true virtual helpers, and more so when integrated with predictive analytics. In the present study, the effects of tillage systems on soil properties and crop production and the predictive capabilities of multiple linear regressions (MLR) and artificial neural networks (ANN) are evaluated to estimate organic potato crop yield including soil microbial biomass (MB), soil resistance to penetration, soil organic matter (OM) and tillage system. Potato yield was found to be significantly impacted by tillage and soil properties. The results showed that MLR model estimated crop yield more accuracy than ANN model. Correlation coefficient and root mean squared (RMSE) were 0.97 and 0.077 between the measured and the estimated data by the ANN model, respectively. Generally, the ANN model showed greater potential in determining the relationship between potato yield, tillage and soil properties.
Assessment of ecosystem services and ecological regionalization of grasslands support establishment of ecological security barriers in Northern China
中国北方草地生态系统服务评估和功能区划助力生态安全屏障建设
Random forests
DOI:10.1023/A:1010933404324 URL [本文引用: 1]
Estimating plant biomass: a review of techniques
Direct and indirect effects of nitrogen enrichment on soil organisms and carbon and nitrogen mineralization in a semi-arid grassland
DOI:10.1111/1365-2435.13226 URL [本文引用: 1]
Defining leaf area index for non-flat leaves
Examination of the potential of terrestrial laser scanning and structure- from-motion photogrammetry for rapid nondestructive field measurement of grass biomass
DOI:10.3390/rs9060531 [本文引用: 1]
Random forests for classification in ecology
DOI:10.1890/07-0539.1
PMID:18051647
[本文引用: 1]
Classification procedures are some of the most widely used statistical methods in ecology. Random forests (RF) is a new and powerful statistical classifier that is well established in other disciplines but is relatively unknown in ecology. Advantages of RF compared to other statistical classifiers include (1) very high classification accuracy; (2) a novel method of determining variable importance; (3) ability to model complex interactions among predictor variables; (4) flexibility to perform several types of statistical data analysis, including regression, classification, survival analysis, and unsupervised learning; and (5) an algorithm for imputing missing values. We compared the accuracies of RF and four other commonly used statistical classifiers using data on invasive plant species presence in Lava Beds National Monument, California, USA, rare lichen species presence in the Pacific Northwest, USA, and nest sites for cavity nesting birds in the Uinta Mountains, Utah, USA. We observed high classification accuracy in all applications as measured by cross-validation and, in the case of the lichen data, by independent test data, when comparing RF to other common classification methods. We also observed that the variables that RF identified as most important for classifying invasive plant species coincided with expectations based on the literature.
Evaluation of SPOT imagery for the estimation of grassland biomass
DOI:10.1016/j.jag.2014.12.003 URL [本文引用: 2]
An overview of global leaf area index (LAI): methods, products, validation, and applications
DOI:10.1029/2018RG000608 URL [本文引用: 1]
New insights of global vegetation structural properties through an analysis of canopy clumping index, fractional vegetation cover, and leaf area index
DOI:10.1016/j.srs.2021.100027 [本文引用: 1]
Ecosystem carbon stocks and their changes in China’s grasslands
DOI:10.1007/s11427-010-4029-x URL [本文引用: 1]
Estimating grassland biomass and leaf area index using ground and satellite data
DOI:10.1080/01431169408954174 URL [本文引用: 1]
Using the random forest model and validated MODIS with the field spectrometer measurement promote the accuracy of estimating aboveground biomass and coverage of alpine grasslands on the Qinghai-Tibetan Plateau
DOI:10.1016/j.ecolind.2020.106114 [本文引用: 1]
Dynamic monitoring of alpine grassland coverage based on UAV technology and MODIS remote sensing data—A case study in the headwaters of the Yellow River
基于UAV技术和MODIS遥感数据的高寒草地盖度动态变化监测研究——以黄河源东部地区为例
Variable selection using random forests
DOI:10.1016/j.patrec.2010.03.014 URL [本文引用: 1]
Novel algorithms for remote estimation of vegetation fraction
DOI:10.1016/S0034-4257(01)00289-9 URL [本文引用: 1]
Quickly determining grassland cover using the digital image
基于数码照片的草地植被覆盖度快速提取方法
PROSPECT+ SAIL models: a review of use for vegetation characterization
Deepened snow cover alters biotic and abiotic controls on nitrogen loss during non-growing season in temperate grasslands
DOI:10.1007/s00374-020-01514-4 URL [本文引用: 1]
Estimating aboveground biomass of grassland having a high canopy cover: an exploratory analysis of in situ hyperspectral data
DOI:10.1080/01431160902882496 URL [本文引用: 1]
A meta-analysis of remote sensing research on supervised pixel-based land-cover image classification processes: general guidelines for practitioners and future research
DOI:10.1016/j.rse.2016.02.028 URL [本文引用: 1]
Deepened snow cover mitigates soil carbon loss from intensive land-use in a semi-arid temperate grassland
DOI:10.1111/1365-2435.13958 URL [本文引用: 1]
Using “random forest” for classification and regression
随机森林模型在分类与回归分析中的应用
Random forest is a specific algorithm, not omnipotent for all datasets
随机森林是特点鲜明的模型, 不是万能的模型
Multi-factor modeling of above-ground biomass in alpine grassland: a case study in the Three- River Headwaters Region, China
DOI:10.1016/j.rse.2016.08.014 URL [本文引用: 1]
Biomass carbon stocks and their changes in northern China’s grasslands during 1982-2006
DOI:10.1007/s11427-010-4020-6 URL [本文引用: 1]
Spatial distribution of grassland biomass in China
中国草地植被生物量及其空间分布格局
DOI:10.17521/cjpe.2004.0067
[本文引用: 1]
草地生态系统是陆地生态系统分布最广的生态系统类型之一,它在全球变化中的作用越来越受到重视。利用中国草地资源清查资料,并结合同期的遥感影像,建立了基于最新修正的归一化植被指数(NDVI)的我国草地植被生物量估测模型,并利用该模型研究了我国草地植被生物量及其空间分布特征。结果表明:草地植被地上生物量与当年最大NDVI值具有很好的相关关系,两者可以用幂函数很好地拟合(R2=0.71, p
Generalized and species-specific prediction models for aboveground biomass in semi-steppe rangelands
DOI:10.1093/jpe/rty037
[本文引用: 2]
The accurate estimation of aboveground biomass in vegetation is critical for global carbon accounting. Regression models provide an easy estimation of aboveground biomass at large spatial and temporal scales. Yet, only few prediction models are available for aboveground biomass in rangelands, as compared with forests. In addition to the development of prediction models, we tested whether such prediction models vary with plant growth forms and life spans, and with the inclusion of site and/or quadrat-specific factors. We collected dataset of aboveground biomass from destructive harvesting of 8088 individual plants belonging to 79 species in 735 quadrats across 35 sites in semi-steppe rangelands in Iran. A logarithmic transformation of the power-law model was used to develop simple prediction models for the easy estimation of aboveground biomass using plant coverage and vegetation density as predictors for the species-specific model, multispecies and plants of different growth forms and life spans. In addition, additive and multiplicative linear regression models were developed by using plant coverage and one categorical variable from the site and/or quadrat-specific factors. The log-transformed power-law model based on plant coverage precisely predicted aboveground biomass across the whole dataset for either most of the species-specific model, multispecies or plants of the same growth forms (shrubs, forbs or graminoids) and life spans (annuals, biennials or perennials). The addition of vegetation density as a single or in a compound predictor variable had relatively poor performance compared with the model having plant coverage only. Although generalizing at the levels of plant group forms and/or life spans did not substantially enhance the model-fit and validation of the plant coverage-based multispecies model, the inclusion of plant growth forms or life spans as a categorical predictor variable had performed well. Generalized models in this study will greatly contribute to the accurate and easy prediction of aboveground biomass in the studied rangelands and will be also useful to rangeland practitioners and ecological modellers interested in the global relationship between biodiversity and aboveground biomass productivity across space and time in natural rangelands.
Analysis of current grassland resources in China
中国草地资源的现状分析
Above-ground resource use increases with plant species richness in experimental grassland ecosystems
DOI:10.1046/j.1365-2435.2000.00437.x URL [本文引用: 1]
An asymptotic equivalence of choice of model by cross-validation and Akaike’s criterion
The use of prior probabilities in maximum likelihood classification of remotely sensed data
DOI:10.1016/0034-4257(80)90011-5 URL [本文引用: 1]
Canopy structure and light climate of different alpine plant communities: analysis by means of a model
DOI:10.1007/BF00867794 URL [本文引用: 1]
Modeling aboveground biomass in Hulunber grassland ecosystem by using unmanned aerial vehicle discrete lidar
DOI:10.3390/s17010180 [本文引用: 1]
Estimating leaf area index and aboveground biomass of grazing pastures using Sentinel-1, Sentinel-2 and Landsat images
DOI:10.1016/j.isprsjprs.2019.06.007 URL [本文引用: 2]
Biomass estimation: a remote sensing approach
DOI:10.1111/j.1749-8198.2010.00352.x URL [本文引用: 1]
The superiority of the normalized difference phenology index (NDPI) for estimating grassland aboveground fresh biomass
DOI:10.1016/j.rse.2021.112578 [本文引用: 1]
Estimation of degraded grassland aboveground biomass using machine learning methods from terrestrial laser scanning data
DOI:10.1016/j.ecolind.2019.105747 [本文引用: 4]
Modeling grassland above-ground biomass based on artificial neural network and remote sensing in the Three-River Headwaters Region
DOI:10.1016/j.rse.2017.10.011 URL [本文引用: 1]
Error assessment of visual estimation plant coverage
目估法测量植被覆盖度的精度分析
Overview of field and multi-scale remote sensing measurement approaches to grassland vegetation coverage
草地植被盖度的多尺度遥感与实地测量方法综述
DOI:10.11867/j.issn.1001-8166.2003.01.0085
[本文引用: 1]
植被盖度作为一个重要的生态学参数被用在许多气候模型和生态模型中。地表实测和遥感测量是获取植被盖度的两种基本途径。以草地植被盖度的测量为研究对象,综合讨论了目前地表实测和遥感测量常用的方法,分析了它们的优缺点,并对如何提高草地植被盖度的测量精度做出展望。数码相机、高光谱遥感以及多尺度遥感数据的综合使用可能是未来草地植被盖度测量发展的趋势。
