


传统的AGB估算方法从异速生长方程以及面积的统计学角度出发, 这种方法依赖于实地调查数据, 主要是统计样方内单木的树高、胸径、冠层等相关参数, 并根据树种信息(Dong et al., 2016), 通过异速生长方程建立生物量回归模型(Bond-Lamberty et al., 2002; Dong et al., 2016)。通过这种方式测算出的生物量可以作为基础数据进行宏观估算, 从而获知整个研究区域的生物量状况(Houghton et al., 2001; Chave et al., 2005)。但是, 这种方式时间成本高、劳动强度大, 在实际操作中表现出费时、费力、效率低下等缺点, 且在时间尺度和空间范围上都有局限性, 无法准确实现宏观AGB定量监测(Lu et al., 2016; Tsitsi, 2016)。
遥感作为采集地球表面数据及其变化信息的重要技术手段, 与传统的调查方法相比, 可以很大程度上节省人力、物力、财力和时间。遥感还具有长期、全天候且大面积的对地同步观测能力, 这极大地提升了获取森林信息的效率, 已被广泛应用于森林信息的观测和提取(郭志华等, 2002)。20世纪90年代, 由于卫星遥感技术在地理科学和宏观生态学中的成熟运用, 一些学者利用Landsat遥感影像和卫星雷达图像研究了全球不同地区的森林生物量(Hame et al., 1997; White et al., 1997)。随着遥感技术的快速发展, 不同的遥感方式可以快速获取大面积、可靠和一致的信息, 遥感图像可以记录单木属性(例如叶面积结构、基面积、茎体积等)在不同空间和时间尺度上的变化, 因此可以补充时间不全和空间有限的实地森林数据。
近年来, 国内外学者从不同的角度对生物量遥感监测相关研究进行了综述。Guo等(2017)对湿地植被生物量遥感研究进行综述, 认为基于不同数据源反演AGB的精度仍需继续提升; Xu等(2021)对激光雷达(LiDAR)数据在森林单木尺度AGB的估算进行了概述, 明确了LiDAR数据在AGB估算领域的潜力和优势, 并且提出了现有LiDAR估算方法的局限性以及进一步改进的方法; Abbas等(2020)阐述了基于不同的遥感方式估算热带森林AGB的理论基础及估算原理, 并强调LiDAR对森林冠层高度及垂直结构的观测很大程度上会影响林地AGB的估算。然而, 以上综述关注不同遥感方式在其他植被类型AGB估算中的应用, 或特定的遥感方式对森林单木尺度的观测, 也有基于森林整体尺度AGB估算的研究。然而, 近年来遥感技术迅猛发展, 新型遥感数据的出现给森林AGB估算带来了新的进展。因此, 本文综合了新型遥感技术及传统遥感方式对森林AGB估算进行了更进一步的综述, 从光学遥感、合成孔径雷达(SAR)和LiDAR等遥感方式出发, 对遥感技术在森林AGB估算方向的应用与发展进行对比和分析, 归纳已有研究在森林AGB估算方面取得的进展以及面临的问题, 以期为相关研究提供参考和支持。
1 基于光学遥感的AGB研究
1.1 概述
最早于20世纪80年代, 光学遥感技术开始应用于生物量估算领域(Eriksson et al., 2003)。随着遥感技术的逐步发展, 越来越多高时空分辨率和高光谱分辨率的传感器被用于估算森林的生物量, 国外较为典型的卫星有美国的Landsat-8、欧洲航天局的Sentinel-2和印度的CartoSat1-1。国内的资源三号卫星(ZY-3)和高分系列光学卫星等也能够提供较高分辨率的卫星影像, 其中, ZY-3采用三线阵立体测绘体制, 利用其多角度遥感影像构建立体模型, 可完成对生物量等信息的估测(曹海翊等, 2012; 高洪涛等, 2016); 高分系列卫星是我国自主研制的卫星, 具有较高的分辨率, 突破了依赖于国外卫星的局限性。目前常用于AGB估算的高分系列光学卫星有GF-1 (Liu et al., 2022a)、GF-2 (Gou et al., 2019)和GF-7号卫星。新发射的GF-7号卫星采用了双线阵相机与激光测高仪主被动复合测绘的新体制, 融合了多角度信息与激光测高数据, 这在生物量反演中具有很大潜力(曹海翊等, 2020)。这些高性能传感器所获取的数据有效地支持了基于光学遥感的森林AGB研究(田静, 2017)。
光学遥感影像上记录的是光谱信息, 例如红、绿、红外和近红外波段。然而, 这些光谱信息与生物量并无明确的关联(Song, 2013)。因此, 目前应用光学遥感估算生物量的主要方式是提取出光学影像中的纹理信息和植被指数, 它们被证明与生物量有明确相关的关系, 依此可以估算大范围的生物量。纹理信息与林分结构具有很强的相关性, 可以减少异质性的影响, 将光谱变量和纹理信息合并到一个模型中可以得到比单独的光谱变量更好的估测效果(Lu & Batistella, 2005)。植被指数是对地表植被状况的简单、有效和经验的度量, 被广泛应用于评估植被生长状况、植被初级生产力和作物估产等方面(Foody et al., 2003; Zheng et al., 2004)。表1列出了部分常用的植被指数及其特点。
表1 部分常用植被指数及其特点
Table 1
| 植被指数 Vegetation index | 计算公式 Calculation formula | 特点 Characteristic |
|---|---|---|
| 归一化植被指数 Normalized differential vegetation index (NDVI) | NDVI = (NIR - Red)/(NIR + Red) | 应用广泛、反映植被空间分布与生长状况 It is widely used and reflects the spatial distribution and growth of vegetation |
| 增强型植被指数 Enhanced vegetation index (EVI) | EVI = 2.5 × (NIR - Red)/(NIR + 6Red - 7.5Blue + 1) | 可纠正大气和土壤背景的影响, 不易饱和 It can correct the influence of atmospheric and soil background and is not easily saturated |
| 比值植被指数 Ratio vegetation index (RVI) | RVI = NIR/Red | 计算简单, 在植被密集区域灵敏度高 It’s easy to calculate and has high sensitivity in densely vegetated areas |
| 差值植被指数 Differential vegetation index (DVI) | DVI = NIR - Red | 对土壤背景变化敏感, 易区分土壤和植被 It’s sensitive to soil background changes and easy to distinguish between soil and vegetation |
| 重归一化植被指数 Re-normalized differential vegetation index (RDVI) | RDVI = (NIR – Red)/ | 可区分土壤和植被, 也可以反映植被信息 It can distinguish between soil and vegetation and reflect vegetation information |
| 土壤调节植被指数 Soil-adjusted vegetation index (SAVI) | SAVI = 1.5 × (NIR - Red)/(NIR + Red + 0.5) | 考虑土壤光学性质, 适用于稀疏植被区域 It can take into account soil optical properties and is suitable for areas of sparse vegetation |
| 修正土壤调节植被指数 Modified soil-adjusted vegetation index (MSAVI) | MSAVI = 1/2 × (2NIR + 1 – | 可消除土壤背景 It can remove the soil background |
| 垂直植被指数 Perpendicular vegetation index (PVI) | PVI = (NIR – 0.791Red – 0.043)/ | 用于地表植被参数的反演 It can be used for inversion of surface vegetation parameters |
Blue, 蓝光波段; NIR, 近红外波段; Red, 红光波段。
Blue, blue band; NIR, near infrared band; Red, red band.
1.2 光学遥感估算AGB的常用方法
光学遥感既可以提供多光谱遥感影像, 也可以提供高光谱遥感影像。多光谱遥感影像可以很好地提供森林冠层的光谱信息, 且具有较高的时空分辨率。然而, 在实际使用中, 基于多光谱的估算方案常常会由于缺乏足够的光谱信息而难以达到最佳效果。高光谱数据可以获得多种不同时间和空间尺度的生物物理特征、精细的光谱分辨率和丰富的光谱信息, 可以减少混合像元的产生, 能反映更精细的森林结构(Colomina & Molina, 2014), 在森林AGB估测研究中表现出较高的预测精度。值得注意的是, 相比于水平分布结构, 森林的垂直结构更加复杂, 因此, 在进行森林AGB估算时, 往往需要结合光学数据获得水平分布信息和其他遥感数据获得的垂直结构信息以协同进行AGB估算(Zhu et al., 2020; Tang et al., 2022)。目前基于多光谱和高光谱遥感估算森林AGB的方法大致可分为回归分析法和非参数法, 如图1所示。
图1
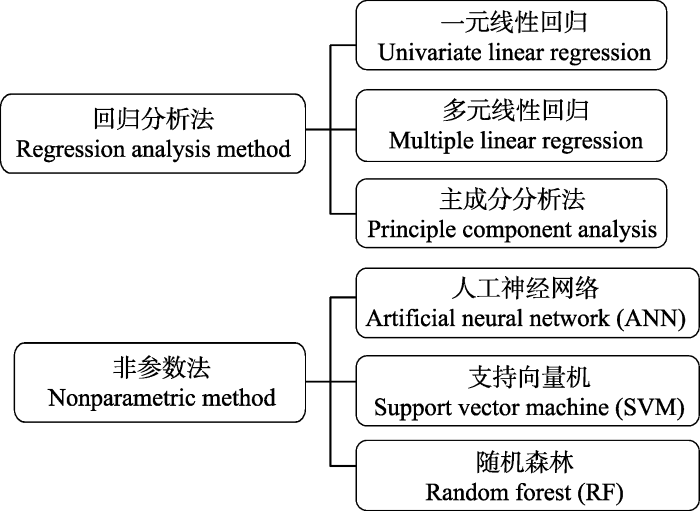
图1
光学遥感估算地上生物量的方法。
Fig. 1
Methods for estimating aboveground biomass by optical remote sensing.
1.2.1 回归分析法
由于植被指数与AGB之间具有较好的相关性, 因此可以通过建立回归模型来进行AGB的遥感估算。AGB遥感估测研究的初期阶段主要是建立多光谱和高光谱遥感生成的单一遥感植被指数与森林AGB实测值之间的线性回归模型, 然后利用模型将AGB估测值上推到区域尺度(田静, 2017)。Naik (2021)基于多时相的Sentinal-2、RapidEye数据提取出的波段反射率和植被指数, 采用了线性回归方式进行了森林AGB的反演, 决定系数(R2)分别为0.53和0.51。Du等(2019)从Pleiades数据中计算出数10种植被指数, 包括比值植被指数(RVI)、归一化植被指数(NDVI)、绿色归一化植被指数(GNDVI)以及大气阻抗植被指数(ARVI)等, 将这些植被指数通过建模估算生物量, 最后发现ARVI的预测结果相关性最好, R2为0.939。
植被指数可以通过与生物量建立回归关系来进行生物量估算, 然而, 这种方法也存在局限性。例如, 植被指数无法最大限度地减少土壤背景效应, 这代表着植被指数中存在一定比例的值代表的是土壤背景亮度(Silleos et al., 2006), 这会影响生物量估算的精度。此外, 在冠层密度较大或叶面积指数较高的区域, 植被指数的信号饱和现象十分明显(Mutanga& Skidmore, 2004)。如NDVI指数主要是通过红光波段和近红外波段来计算, 但是当冠层覆盖率达到100%时, 植被可以吸收的红光量(610-690 nm)达到峰值, 而近红波段反射率由于多重散射效应继续增加(Mutanga et al., 2004), 这种信号饱和方面的不匹配会导致NDVI与植被AGB之间的相关性降低。因此, 与直接反映植被生物特征的因子(例如: 树高、胸径、冠幅等)相比, 植被指数在AGB估算方面精度明显偏低。
回归模型法计算简单, 容易拟合, 解释性较强, 但是需要回归因子与AGB存在明确的线性关系或指数关系。当变量较多、计算较复杂时, 传统的回归模型就会显示出其局限性, 存在较大的误差和不确定性。
1.2.2 非参数法
由于在估算AGB的过程中, 特征因子的复杂性会进一步影响传统回归模型的计算效率。因此, 对模型的高复杂性和非线性要求就使得近年来利用非参数法结合遥感数据开展森林AGB估测的研究逐渐增多, 并逐步替代传统的线性回归成为森林AGB建模的主流方法。非参数法也可称为机器学习法, 机器学习法不必对数据分布作出提前假设, 可以利用一组参考样本中的已有信息进行训练进而生成性能更好的AGB估算模型(Breiman et al., 1984)。
人工神经网络(artificial neural network, ANN)是目前较多应用于生物量估算的机器学习算法。ANN不需要对模型方法进行假设, 它能够调节神经元之间的连接权重, 不断逼近输入变量与输出变量之间的非线性关系(梁瑞婷等, 2022)。因此, 与传统回归模型相比, ANN模型预测AGB的精度更高; 与其他机器学习方式相比, 其在准确性、稳定性和计算速度方面综合效果较好(Ali et al., 2015)。梁瑞婷等(2022)基于生物量估算因子的最优组合(胸径、树高、冠幅)建立了ANN生物量模型, 并采用留一交叉验证法对模型进行检验, 结果表明ANN提高了生物量估算模型的精确性。ANN可以自动分析变量之间的关系, 可以发现植被因子与生物量之间较复杂和动态的关系, 在处理非线性关系时更为灵活和有效。然而, 对于大型数据集, ANN的训练速度往往比其他类型的算法慢, 且除了输入数据外, 无法人为调控模型的计算过程。
支持向量机(support vector machine, SVM)也是目前应用较多的机器学习方式, 它可以通过核函数将训练数据转换到高维特征空间, 确定一个最佳超平面, 使超平面与最近的正反面之间的距离达到最大。如Zhang等(2015)采用SVM算法对提取的Landsat-7的波谱参数进行生物量估算, 研究结果显示, SVM算法生物量估算模型的R2高于0.9。SVM算法的优点在于能够利用有限的样本信息, 在模型复杂度和拟合能力之间寻找较好的平衡点, 尽量避免过拟合和欠拟合问题的产生, 使模型具有较好的泛化推广能力。然而, 在实际应用中, SVM仍然在如何确定最佳输入特征集、输入特征数量和最佳拟合效果如何平衡等方面存在一些限制, 需要进一步研究。
随机森林(random forest, RF)是一种集成学习方法, 它结合了大量回归树。回归树表示一种条件或限制, 这些条件或限制按层次结构进行组织, 并连续应用于树的根和叶子, RF算法适用于解决分类和回归问题(Breiman et al., 1984)。Zhang等(2019a)通过多元线性回归模型(MSLR)、SVM、RF和K最近邻算法(KNN)对广东从化森林AGB进行了估算, 且对不同模型在估算效果方面进行了对比分析, 结果表明RF模型与其他模型相比, 精度更高且在性能方面表现得更好, 因为RF模型具有独特的回归技术和概念设计, 从而在噪声和异常值方面具有灵活性和鲁棒性, 在AGB估算中显示更高的相关性(图2)。
图2
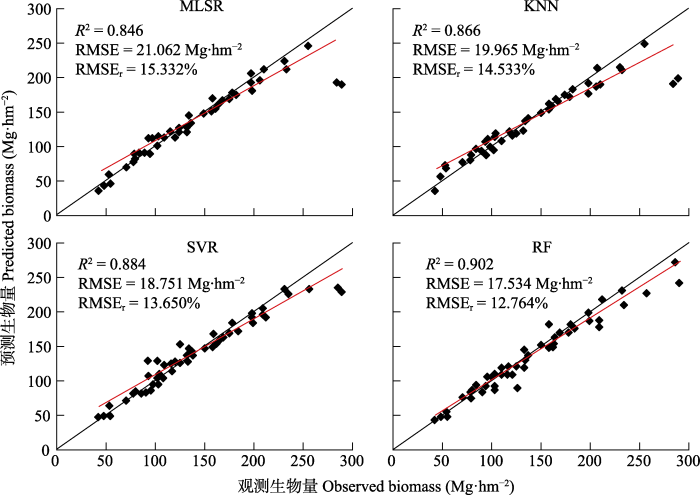
图2
不同机器学习模型——多元逐步线性回归(MLSR)、K最近邻算法(KNN)、支持向量回归(SVR)和随机森林(RF)算法预测地上生物量的性能对比(据Zhang等(2019a)修改)。R2, 决定系数; RMSE, 均方根误差; RMSEr, 相对均方根误差。
Fig. 2
Performance of aboveground biomass estimation with different machine learning models: multiple stepwise linear regression (MLSR), K-nearest neighbor (KNN), support vector regression (SVR), and random forest (RF) (modified from Zhang et al. (2019a)). R2, coefficient of determination; RMSE, root mean squared error; RMSEr, relative root mean squared error.
非参数法在AGB的估算中拟合出来的模型效果通常好于线性模型, 因为它可以通过样本数据自身的逻辑和关联来判别数据间的隐藏性关系, 随着数据集的增加, 结果也可以得到进一步的改善。许多研究表明, 林分和气候等非植被因子也会影响生物量(Dong et al., 2020; Widagdo et al., 2020), 在之后的研究中, 也可加入非植被因子, 如气候类型和土壤肥力等, 这些因子可以拓展机器学习模型的适用范围, 也可以提高模型的预测精度。然而, 机器学习还存在着一些自身固有的模型拟合问题, 如欠拟合和过拟合。此外, 机器学习在训练时通常需要大量的数据来进行模型拟合, 数据量过小会对模型精度造成一定程度的影响; 但在数据量较大时, 训练速度会变慢。因此, 数据量大小与模型精度如何平衡这一问题仍然值得进一步研究。
2 基于SAR的AGB研究
2.1 概述
SAR数据最初多为机载载荷获取的单频、单极化信息(Sherwin et al., 1962)。随后, 多个国家都相继发射了载有SAR传感器的卫星(杨浩, 2015; 李增元等, 2020), 如表2所示。这些卫星的发射极大地丰富了SAR的数据源和数据量, SAR数据也从单频率、单角度、单极化逐步转变为多频率、多角度、多极化。基于SAR数据的AGB估算也经历了从应用单极化信息到多极化信息、干涉信息、极化干涉信息、多频信息的发展过程。与传统光学遥感不同, SAR克服了多云、多雾等天气影响的局限性, 具有获取森林冠层面状、垂直结构等特征的能力, 成为目前森林AGB反演具有潜力的遥感数据源(Zeng et al., 2022b)。
表2 常用于生物量估算的合成孔径雷达卫星
Table 2
| 国家或机构 Country or agency | 卫星名称 Satellite name | 年份 Year | 极化方式 Polarization mode |
|---|---|---|---|
| 中国 China | HJ-1 | 2012 | VV (S波段) VV (S band) |
| GF-3 | 2016 | 可选单极化(C波段) Optional unipolarization (C band) | |
| Qilu-1 | 2021 | Ku谱段 Ku band | |
| 海丝一号 Hisea-1 | 2022 | VV (C波段) VV (C band) | |
| LT-1A | 2022 | 全极化(L波段) Full polarization (L band) | |
| LT-1B | 2022 | 全极化(L波段) Full polarization (L band) | |
| 巢湖一号 Chaohu-1 | 2022 | (C波段) (C band) | |
| 美国 USA | Seasat-A | 1978 | HH (L波段) HH (L band) |
| Capalla-1 | 2018 | HH (X波段) HH (X band) | |
| Capalla-2 | 2020 | HH (X波段) HH (X band) | |
| Capalla-3 | 2021 | HH (X波段) HH (X band) | |
| Capalla-4 | 2021 | HH (X波段) HH (X band) | |
| 欧洲航天局 European Space Agency (ESA) | ENVISAT | 2002 | 双极化(C波段) Bipolarization (C band) |
| Sentinel-1A | 2014 | 双极化(C波段) Bipolarization (C band) | |
| Sentinel-1B | 2016 | 双极化(C波段) Bipolarization (C band) | |
| 加拿大 Canada | RADARSAT-2 | 2006 | 全极化(L、C波段) Full polarization (L, C band) |
| 德国宇航局 Deutsches Zentrum für Luft- und Raumfahrt (DLR) | TerraSAR-X | 2007 | 单极化、双极化、全极化(X波段) Unipolarization, bipolarization, full polarization (X band) |
| TanDEM-X | 2010 | 单极化、双极化、全极化(X波段) Unipolarization, bipolarization, full polarization (X band) | |
| 日本 Japan | ALOS-PALSAR1 | 2006 | 全极化(L、C波段) Full polarization (L, C band) |
| ALOS2-PALSAR2 | 2014 | 全极化(L、C波段) Full polarization (L, C band) |
HH, 水平发射水平接收; HV, 水平发射垂直接收; VV, 垂直发射垂直接收。
HH, horizontal transmitting, horizontal reception; HV, horizontal transmitting, vertical reception; VV, vertical transmitting, vertical reception.
2.2 SAR估算AGB的常用方法
SAR波长较长, 具有全天时全天候观测能力, 不仅能和森林冠层发生作用, 还因其具有穿透能力可以与森林主体枝干发生作用(陈尔学, 1999), 该特点增加了SAR在估测森林生物量方面的潜力。当前, SAR估算森林AGB的方法主要是后向散射系数、干涉合成孔径雷达(interferometric synthetic aperture radar, InSAR)、极化干涉合成孔径雷达(polarimetric synthetic aperture radar interferometric, POLInSAR)、层析SAR (TomoSAR)等(Franklin & Strahler, 1988)。
2.2.1 后向散射系数估算生物量
SAR图像强度信息通常用后向散射系数进行表述, 表征单位面积上目标地物对微波的后向散射能力, 后向散射信息包括纹理和极化分解特征。众多学者将SAR的不同波段、极化方式、传感器的雷达后向散射强度与森林生物量之间的关系进行了研究(李增元等, 2020), 研究表明雷达后向散射系数和森林结构参数与森林AGB呈正相关关系。不同波段的后向散射系数对生物量的敏感性不同, L和P波段在研究中显示出与森林结构参数(树龄、树高、生物量等)较高的相关性, 而C波段的相关性较低, 这是因为L和P波段的波长较C波段更长, 穿透能力更强, 而后向散射主要由冠层中树枝和树叶主导, 因此L和P波段可以得到更多植被的三维结构信息; 同一波段的不同极化方式对生物量的敏感程度也是不同的, HV(水平发射垂直接收)极化方式对生物量较为敏感, VV(垂直发射垂直接)极化方式敏感性较低, 原因是HV极化方式下植被与水体、裸地等地物的后向差异较大(Le et al., 1992), 故在估算AGB方面精度更高。目前基于后向散射系数获取植被AGB的方法大致分为经验模型法、半经验模型法、机理模型法。
2.2.1.1 经验模型法
基于生物量与雷达后向散射系数之间的相关性(Sherwin et al., 1962; 孟宝平, 2018), 经验模型法直接将后向散射系数与森林AGB或相关植被参数进行经验拟合, 构建估算模型, 进而实现森林AGB估算, 是目前运用最广泛的方法, 常见的经验模型有线性模型(Villard & le Toan, 2014)和对数模型(Lucas et al., 2006)。然而, 在实际估算中, 经验法强烈依赖于地面实测AGB数据, 且后向散射系数对森林AGB的敏感性必须高于其他干扰因子, 否则难以取得满意的效果(Sinha et al., 2015)。SAR数据后向散射系数取决于很多方面, 如森林参数(树干密度、叶片密度等) (Smith-Jonforsen et al., 2007)、森林下垫面状况(温度、土壤水分、地表粗糙度等) (Ranson & Sun, 2000; Bai et al., 2016)等。因此, 在考虑并解决以上干扰因素带来的问题之后, 方可将SAR后向散射系数广泛用于森林AGB估算。
2.2.1.2 半经验模型法
半经验模型在经验模型的基础上进行了改进提升, 引入森林的物理特征, 根据微波在森林冠层、茎秆和下垫面不同的散射机制, 与统计方法进行有机结合, 进而生成了半经验模型法(查东平, 2022)。目前, 基于半经验模型法的研究相对较少, 其中一种半经验模型法是基于水云模型(water cloud model)得到的。水云模型是在辐射传输模型的基础之上提出的用于估算植被覆盖地表的土壤水分, 是一种根据电磁波辐射传输理论, 以植被为研究对象来估算植被地表覆盖的模型(Attema & Ulaby, 1978)。Santoro等(2002)基于水云模型, 将其中的森林冠层透过率参数通过立木蓄积量进行表征, 从而构建出了可直接估算立木积蓄量的半经验模型。此后, 该半经验模型又被用于C波段SAR数据对北方森林立木蓄积的量进行估算(Santoro et al., 2011)。Cartus等(2012)又将该半经验模型中的立木蓄积量替换成森林生物量, 并基于该模型实现了美国东北部森林生物量的估算。但是在利用半经验模型前需要对模型中的参数进行调试优化, 否则可能会引入较大的不确定性。
2.2.1.3 机理模型法
机理模型能够充分考虑森林不同散射机理, 能明确关联具有物理意义的森林参数。目前已经发展了诸多的微波辐射传输模型, 包括MIMICS模型(Ulaby et al., 1990)和森林三维雷达后向散射模型等(Sun & Ranson, 1995)。然而目前的相关研究大多只将模型用于森林后向散射系数的模拟, 以分析森林参数以及环境参数对后向散射系数的影响, 很少有直接将物理模型用于森林参数以及生物量的估算(Ranson et al., 1997)。Ranson等(1997)利用森林生长模型为森林冠层辐射传输模型提供输入参数, 以模拟森林的后向散射系数, 再通过模型构建出森林后向散射系数与生物量之间的关系, 完成了森林生物量的估算。虽然机理模型能够充分考虑森林的不同散射机理和森林结构参数的影响, 在这一点上机理模型被认为更具有普适性, 但由于其原理复杂且模型众多参数难以定标, 因此相对于经验模型与半经验模型, 机理模型目前在实际应用中推广还存在一定的难度。
综上所述, 在目前可以使用的SAR信息中, 后向散射信息是分析最全面、积累研究成果最多的SAR信息, 适合于森林AGB的估算。需要注意的是, 当生物量达到一定水平时, 后向散射系数会出现信号饱和的现象, C、L和P波段反演AGB的饱和点分别为30-50、60-100和100-200 t·hm-2 (Askne et al., 1997)。许多因素会影响反演AGB的饱和点, 例如, 给定研究区域中环境条件的变化在导致饱和点变化中起着关键作用(Sarker et al., 2012)。目前已有研究表明, 在森林AGB估算过程中, 对于波段和极化方式的选取以及提取合适的极化参数有助于改善信号饱和的现象。Zeng等(2022b)探讨了使用不同极化通道的后向散射系数, 以及从C波段和L波段全极化SAR数据中提取的极化参数来估算森林AGB的潜力, 结果表明, 对于森林冠层组分的生物量, 表现较好的极化特征没有出现明显的饱和现象。Liu等(2022b)基于后向散射系数、地形因素和极化分解参数估算AGB, 并且将三者相结合, 建立了长波长全偏振数据估算森林AGB的模型, 最终模型有效改善了反演AGB的饱和点。
2.2.2 InSAR/Pol InSAR估算生物量
与SAR后向散射系数相比, 合成孔径雷达干涉(InSAR)可以进一步提供相干强度信息以及干涉相位信息。极化干涉合成孔径雷达(Pol InSAR)兼具InSAR地表森林散射体的空间分布和Pol SAR森林散射体形状和方向敏感的特性, 还具有从数据中分解得到不同散射机制的特征分量的能力(廖展芒, 2019)。故目前InSAR和Pol InSAR也被引入到生物量估测的研究中, 主要有2种类型。
2.2.2.1 基于相干强度信息估算
与后向散射系数不同, 相干强度主要表示森林的时相稳定性和其体积效应(Zebker & Villasenor, 1992; Hagberg et al., 1995; Askne et al., 1997)。相干强度通常是由时间失相干、空间失相干和噪声失相干决定的(Askne et al., 1997; Bamler & Hartl, 1998)。时间失相干是指两次SAR成像之间的地物及环境变化导致的失相干; 空间失相干在森林区域主要包含两部分, 森林地表散射失相干和森林体散射失相干(Askne et al., 1997), 森林高度越高, 森林体散射失相干强度就越低; 而噪声失相干是由噪声引起的失相干; 这三个方面的失相干会导致相干强度的降低。因此森林AGB越高, 往往会产生更大的失相干影响, 从而导致更低的相干强度, 而裸土区域的相干强度一般是最高的(Treuhaft et al., 2010)。基于相干强度的传统估算方法通常是实测森林AGB与相干强度信息构建估算模型, 然后用于森林AGB估算(Fransson et al., 2001; Koskinen et al., 2001; Cartus et al., 2011)。一般直接建立相干强度信息与生物量间的经验模型和半机理模型。与后向散射信息估算AGB相同, 基于相干强度信息的估算也存在饱和的情况(Askne et al., 1999; Eriksson et al., 2003)。SAR相干强度与森林AGB有较好的负相关关系, 但是两者之间的相关度易受多方面因素影响, 如成像时的环境以及气象条件(Castel et al., 2000), 从而导致估算精度降低。
2.2.2.2 基于干涉相位估算
基于干涉相位估算的实质是数字高程模型(DEM)差分法, 主要利用单波段单极化InSAR数据获取地表(DSM)信息, 并将DSM近似作为冠层高度, 对于地面高度则采用其他手段获取, 如将森林边缘非植被区域的高度作为地面高度, 利用已发布的DEM产品获取地面高度, 或利用LiDAR数据获取地面高度。Ranson等(1977)通过InSAR高度与DEM之差获取了森林有效干涉高度, 发现干涉高度与LiDAR数据获取的森林冠层高度有较好相关性。InSAR高度与DEM之间的高度差难以直接作为森林的高度, 但该高度差与森林高度及森林生物量存在较好的相关度, 因此许多研究直接利用该高度差与地面实测生物量进行拟合, 以进行森林生物量模型构建并估算。基于干涉相位的方法较相干强度估算而言更稳健, 更不容易达到饱和点。
2.2.3 TomoSAR估算生物量
森林垂直结构直接影响生物量, TomoSAR是利用层析技术获得不同冠层高度的散射强度来得到森林垂直结构参数(Cloude, 2007), 挖掘与生物量相关的特征, 继而建立模型估算森林AGB。而森林垂直结构的参数需要在层析剖面中得到, 层析剖面的获取方法主要分为以下两类: 单基线的极化干涉层析法(李兰等, 2017)与多基线的谱分析法(Cloude, 2007)。在提取森林参数的研究中主要有2种方法: 提取层析剖面得到几何参数建立估算模型; 提取层析剖面上的相对反射率特征, 分析反射率特征与森林参数间的关系进而建立估算模型。目前基于TomoSAR的生物量估算研究较少, 在该类研究中, 散射机制的分离与地面散射机制的消除是一个难点, 目前已有的方法尚未充分利用TomoSAR获取的三维剖面信息。
总体来看, SAR在区域及全球尺度快速获取数据和AGB估算中具有独特的优势, 采用部分SAR技术可以在较大程度上突破遥感技术估算森林AGB的饱和点限制, 在区域和全球尺度开展的部分研究也可以证明有效利用SAR技术和不同SAR数据源可以提高区域和全球尺度森林AGB高精度反演的可行性。然而, SAR估算AGB仍然存在较大的局限性, 如SAR极化信息对森林结构变化敏感, 但是极化信息中可以表征森林散射的体散射模型过于单一, 无法全面描述森林的复杂结构特征。采用单频、单极化后向散射信息进行森林AGB反演饱和点低, 在森林AGB高于300 t·hm-2的区域, 后向散射对森林AGB的变化不再敏感。此外, SAR数据处理较为复杂, 受地形影响较大, 而InSAR和Pol InSAR对数据要求较高, 数据源还有待进一步丰富。TomoSAR尽管在森林AGB估算提高饱和点这一方面极具潜力, 但目前已有的研究方法尚不能充分利用层析SAR获取的森林三维剖面信息。在Pol InSAR和TomoSAR技术应用研究方面, 目前依赖国外共享的机载实验数据, 数据处理与参数不清晰, SAR相关的技术和方法大多仍处在研究阶段, 较少进行大范围的应用和推广。由于多频SAR数据较TomoSAR、InSAR和Pol InSAR数据源丰富且易于获取, 因此未来通过多频SAR数据协同进行森林AGB估算将成为利用SAR进行森林AGB反演的热点之一。
3 基于LiDAR的AGB研究
3.1 概述
3.2 LiDAR估算AGB的常用方法
根据传感器所在平台以及平台高度的不同, LiDAR可具体分为地基激光雷达(terrestrial laser scanning, TLS)、移动激光雷达(mobile laser scanning, MLS)、无人机激光雷达(unmanned aerial vehicle laser scanning, UAV-LS)、机载激光雷达(airborne laser scanning, ALS)和星载激光雷达(spaceflight LiDAR system, SLS)。
3.2.1 TLS
TLS是一种基于地面的LiDAR扫描系统, 使用可见光或近红外波段测量森林的三维结构(Wang et al., 2020)。传统的测量森林三维结构的方式成本高、劳动力强, TLS可以改善这一点并在单木尺度上提取森林三维结构(Stovall et al., 2017), 如: 胸径、树高、林分密度、叶面积指数等, 在AGB估算领域具有很大的潜力。TLS不仅适用于单木尺度分割, 如Wu等(2019)开发了一种用于树干检测和树冠分割的比较最短路径算法(CSP), 该算法显著提高了单树分割的准确性(Tao et al., 2015)。Kim等(2016)为TLS点云开发了一种高保真树体素模型(VoxLAD), 以提高单树尺度上冠层分割的准确性, 然后进行AGB估算。随着技术的发展, 还可以从TLS中提取出单木层面更为精细的树木结构, 如树叶、树桩和树冠(Stovall et al., 2017; Wang et al., 2020)。TLS在单木水平上可以以较高的精度估算森林AGB, 但TLS点云的获取非常耗时(Brede et al., 2019), 且由于相邻树冠之间的遮挡重叠, 在茂密森林中估算AGB也是一个挑战。此外, 在垂直分布较复杂的森林中, TLS区分上层冠层结构的能力有限, 这一点可以通过TLS多次扫描得以改善。
3.2.2 MLS
MLS收集靠近地面的点云数据, 主要是在森林冠层下, 这与TLS类似。与TLS相比, 使用MLS可以有效地获取大面积的3D点云数据(Bauwens et al., 2016)。目前有两种类型的MLS, 分别是车载激光雷达(VLS)和背包激光雷达(BLS)。目前, VLS和BLS的研究都处于单木检测和分割阶段, 这是估算单木的树木参数和AGB的基础。其中, BLS引起了较多的关注, 是因为它优于TLS和VLS, BLS采用了同步定位与地图构建(SLAM)技术, 无须进行多站数据拼接(Yan et al., 2019)。Lu等(2020)使用BLS数据生成的种子点进行UAV-LS的单个树木检测, 显著提高了单个树木检测和分割的准确性。Zhang等(2020)比较了TLS和BLS估算苹果(Malus pumila)树枝长度和数量的潜力, 结果表明, TLS在估计树枝长度方面更好, BLS在树枝数量计数方面更好。然而, BLS的应用仍处于早期阶段, 其测量精度和误差源尚未得到系统的探索。
3.2.3 UAV-LS
UAV-LS在50-300 m的高度飞行, 比ALS更灵活, 更方便, 且成本更低(Wu et al., 2019), 但覆盖面积小。UAV-LS在垂直和水平方向上的点云密度较高(Yan et al., 2018), 提高了点云区分树冠的能力(Bazezew et al., 2018)。UAV-LS应用于森林AGB估算的挑战是单木检测和分割, 单木检测和树冠分割的方法主要分为两类。第一种是基于冠层高度模型(CHM)的, 这种方法将CHM应用于搜索窗口(搜索窗口的宽度小于树冠直径), 以找到树冠最大值并首先识别树木位置, 然后根据分割算法分离单木(Wallace et al., 2014)。第二种是基于体素的方法, 在体素空间中对LiDAR数据的点云进行聚类分析(例如, K均值聚类), 首先分割所有单木, 然后在3D聚类中搜索局部最大值作为单木位置(Yan et al., 2019)。目前从UAV-LS点云估计AGB的方法仍然依赖于异速生长算法(Lu et al., 2020); 因此, 需要对单木因子进行自动和直接提取来估算AGB。
3.2.4 ALS
ALS在500-3 000 m的高空获取点云数据, 相比于TLS可以更大范围地测算森林三维结构, 因此ALS可以在区域或国家尺度上估算森林AGB, ALS在树冠结构(如树冠大小、树冠形态等)提取方面也优于TLS。基于ALS估算AGB可以分为区域和单木尺度, 区域尺度估算AGB通常使用ALS提取的结构因子与地面测量数据构建的统计和经验模型(Kaartinen et al., 2012), 单木尺度进行森林AGB估算通常依赖于传统的异速生长模型(Vauhkonen et al., 2010)。然而异速生长模型对树高和胸径的数据准确性要求较高, 尽管ALS在测量单木树高方面较有潜力, 但使用ALS和现有的异速生长体积模型计算胸径或者单木体积仍然是一个挑战(Vauhkonen et al., 2010), 这一点可以根据统计模型从激光雷达提取的树木参数(例如树高)估计胸径(Kim et al., 2012), 或使用不依赖胸径的森林生物量算法来克服。由于森林垂直分布的复杂性, ALS在估算AGB过程中依然会受到林分数据重叠或遮掩的影响, 因此, 研究人员利用ALS (即提取树高、株数、冠幅和冠面积)和TLS (单木树高、胸径和体积, 以及林分体积或冠层高度)进行AGB估算(Apostol et al., 2016)。ALS和TLS数据的协同作用已被证明可以改善林分体积和AGB估算(Hauglin et al., 2014)。
3.2.5 SLS
SLS以卫星为平台, 运行轨道高, 观测视野广, 数据获取成本低, 可以对全球进行持续大范围长时间的监测。目前常见的SLS包括地球科学激光高度计系统(geoscience laser altimeter system, GLAS)、离散光子计数的先进地形激光高度计系统(advanced topographic laser altimeter system, ATLAS)、全球生态系统动态调查(global ecosystem dynamics investigation, GEDI)以及高分卫星。
第一代对地星载LiDAR系统GLAS, 于2003年搭载在ICESat卫星上成功发射升空(Wang et al., 2011)。GLAS信号通常能够穿透森林冠层到达地面, 进而反映森林垂直结构及其分布信息, 国内外大量研究表明星载LiDAR系统GLAS能够提供可靠的数据进行森林AGB估算(黄克标等, 2013; Tang et al., 2022)。Hayashi等(2015)使用GLAS数据对加里曼丹岛的冠层高度和AGB进行了估算, 估测的大范围内AGB平均为191.8 Mg·hm-2, 结果表明, GLAS数据能够以可接受的精度估测大范围的森林AGB。在地形平缓地区, 基于GLAS数据能够获取高精度的森林冠层高度。然而在地形复杂区域, 由于GLAS的大光斑可能使得植被和地面信号混合在一起无法区分, 这也是国际研究热点和难题之一。
不同于GLAS的波形系统, 搭载于ICESat-2卫星之上的新一代LiDAR系统ATLAS采用光子计数技术。ATLAS发射的脉冲能量低、频率高、持续时间短, 记录所有返回光子的坐标信息(Abdalati et al., 2010)。光子计数LiDAR在森林AGB估算中具有两个明显的优势: 一是数据光斑直径小, 可减弱地形对森林冠层参数提取精度的影响; 二是数据密度更高, 可更加真实地记录探测目标的垂向信息, 有利于森林冠层参数的高精度反演。Song等(2022)使用ATLAS数据来估算处于高海拔、生态脆弱地区的云南香格里拉山区森林AGB, 通过超参数优化RF模型拟合来自54个地面样本的生物量数据, 结果证明ATLAS数据可以提高山地森林AGB估算的准确性。不过, 光子计数LiDAR发射信号采用的微脉冲, 容易受到噪声干扰(太阳背景、系统因素以及大气散射等), 且光子噪声的空间分布极广(空中、冠层内部、地下等), 导致地面和冠层高度信息提取困难, 这给森林冠层参数反演以及AGB估算研究带来了挑战(宋涵玥等, 2022)。因此, 如何准确剔除光子噪声, 建立更优的森林AGB估算模型, 是ATLAS在AGB估算中需要解决的关键问题和难点。
GEDI是一种星载多波束波形激光雷达, 搭载了全球首台用于森林参数检测的多波束线性体制的激光测高仪, 是首个应用于监测森林参数的多波束星载激光雷达。GEDI对接收波形进行处理并生产了一系列数据产品用来研究森林的冠层高度等结构参数以及AGB等功能参数。自2019年数据公布以来, 国内外学者对于森林AGB的反演已有不少研究(Silva et al., 2021; 韩明辉等, 2022)。Killisly等 (2022)提取并处理了GEDI数据, 以估计物种组成复杂和粗糙地面的小尺度林区的树高和AGB, 证明将GEDI与多光谱和雷达影像结合可降低估算的不确定性以及信号饱和现象。Shendryk (2022)等提出了融合GEDI、Sentinel-1、Sentinel-2、高程和土地覆盖数据以进行大面积AGB制图的机器学习方法, 对澳大利亚和美国部分地区进行了AGB的制图。研究发现GEDI会在高分辨率的制图中增加不确定性, 这是由于GEDI自身的建模误差、地理定位等测量误差所带来的。由于GEDI数据公布时间较短, 对于GEDI数据反演地面高程的应用仍处于研究中。大多数情况下, GEDI地面高程估计的准确度始终很高, 但坡度陡峭的地区除外, 陡坡(坡度>30°)对GEDI是最大的挑战, 高大树木和茂密树冠(郁闭度>90%)的森林生态系统也会降低冠层高度估计的准确性。
GF-7卫星于2020年8月20日正式投入使用, 有效提高了我国高分辨率遥感立体观测能力, 服务于自然资源三维立体调查监测。与国外高水平遥感卫星相比, GF-7影像的定位精度较高, 激光测高精度优异, 三维立体数据获取效率更高(王中建, 2020), 在森林AGB估算中有很大的潜力。由于其发射时间较短, 故目前在森林AGB估算领域的应用较少。
综上, 基于LiDAR的森林AGB估算方法的主要优势在于该方法不仅能够获取森林的垂直结构信息, 而且还克服了信号饱和的局限性(Xu et al., 2021)。然而此类方案在应用中也存在一些不足: 机载激光雷达可以获取更高精度的点云数据, 从而更加精确地估算森林结构参数, 但是数据获取成本相对于其他遥感方式较高。为了降低数据获取成本, 大多增大飞行高度, 这将会导致点云密度降低, 影响后期数据处理精度, 有时会丢失冠层信息而低估森林高度。然而降低飞行高度, 增大激光点密度, 势必会带来成本的增高。因此, 机载激光雷达在飞行高度和点云密度方面的平衡至关重要。星载激光雷达可获取全球尺度的数据, 但由于光斑直径较大, 容易错失林下地形和树木空间结构等信息。对于小区域, 可能落在区域范围内光斑点较少, 无法有效开展研究应用, 因此大多用于估算大范围及全球尺度的森林结构参数, 精度具有一定的限制。并且由于缺乏历史数据, 基于LiDAR的森林生物量的多时相动态监测仍然面临巨大的挑战。
4 多源遥感数据协同的AGB研究
光学卫星数据的主要局限性在于云覆盖会显著影响获取数据的质量从而影响森林AGB的估算, 当树冠茂密或AGB较高时, 光学数据易饱和。SAR数据与AGB的关系受植被物理性质的影响, 当森林三维结构信息比较复杂时, SAR识别AGB的灵敏度会显著下降。LiDAR虽然与生物量有较高的相关性, 但是采集成本、数据处理以及在空间和时间上重复获取的局限使其应用较困难(表3)。为了克服这些局限性, 目前森林AGB的反演通常采用多源遥感数据融合的方式: 基于光学数据与LiDAR数据、光学数据与SAR数据、LiDAR数据与SAR数据, 光学、LiDAR与SAR数据的协同, 旨在解决单一类型传感器数据难以满足高精度的AGB估算需求的问题。
表3 使用光学遥感、合成孔径雷达(SAR)和激光雷达(LiDAR)估算生物量对比
Table 3
| 遥感类型 Sensor type | 优势 Advantage | 不足 Disadvantage |
|---|---|---|
| 光学遥感 Optical remote sensing | 光谱信息丰富, 易得多种时空分辨率影像, 可用于不同尺度的生物量估算研究。数据提取方法较简便, 结果可视化程度较高 Spectral information is abundant, and various spatial and temporal resolution images are easily available, which can be used for biomass estimation research at different scales. The data extraction methods are relatively straightforward, and the results can be visualized to a high degree | 光学传感器易受天气影响, 遥感信号难以到达植被冠层之下, 不能有效反映森林的垂直结构信息, 且受植被密度影响而易导致光饱和现象 Optical sensors are susceptible to weather conditions, and remote sensing signals struggle to penetrate beneath the vegetation canopy, thus failing to effectively capture vertical structural information of forests. Additionally, optical sensors are prone to saturation effects due to variations in vegetation density |
| SAR | 能与树叶、树干和树冠发生作用, 成像受云雨影响小, 可快速获取大区域、全覆盖的影像, 对生物量敏感 SAR can interact with leaves, tree trunks, and canopies, with minimal impact from clouds and rain. It can rapidly acquire large-area, full-coverage images and is highly sensitive to biomass measurements | SAR影像来源相对较少, 数据处理较为复杂, 受地形和土壤条件影响较大, 后向散射系数估算存在饱和性 SAR images have relatively limited data sources and require more complex data processing. They are significantly influenced by terrain and soil conditions. Estimating the backscattering coefficient in SAR images can be subject to saturation effects |
| LiDAR | LiDAR数据的空间分辨率较高, 不仅能够获取森林的垂直结构信息, 而且还克服了信号饱和的局限性 LiDAR data possesses a high spatial resolution, enabling the acquisition of vertical structural information of forests. Moreover, LiDAR data overcomes the limitations of signal saturation | 成本较高, 缺乏历史数据, 具体模型方法受研究区域限制; 机载LiDAR在大尺度空间上采样不连续, 无法达到无缝覆盖, 波形受林下地形和树木空间结构影响较大 LiDAR technology is associated with higher costs and lacks historical data. The specific models and methods may be limited by the research area. Airborne LiDAR suffers from discontinuous sampling at large spatial scales, making it challenging to achieve seamless coverage. The LiDAR waveform is greatly affected by the understory terrain and spatial structure of trees |
4.1 光学与LiDAR数据联合估算生物量
光学遥感数据能够获取到水平方向连续的区域性数据, 其获取途径更为广泛, 且部分数据免费对用户开放, 易于获取。此外, 高分辨率光学遥感影像包含了大量的纹理、形状等空间几何信息, 在进行森林AGB反演时, 可以提供冠层表面光谱信息, 并且其提取的纹理和细节信息更加丰富(李德仁等, 2012; 菅勇峰等, 2021)。但是, 光学遥感穿透力弱,难以获取森林的三维结构信息。LiDAR数据为光斑激光传感器, 点云密度较高的情况下可以更加精确地获取森林的三维结构信息, 但是其无法达到大尺度无缝覆盖, 很难在点云密度、数据分析精度和分析效率之间取得平衡, 因此在大尺度应用上存在限制(赵鑫等, 2022)。而将两种数据结合可以提高树种识别能力, 提高森林AGB估算精度。
光学与LiDAR数据联合估算森林AGB的原理主要是通过建立统计模型或者物理模型反映波谱信息与波形、点云特征之间的关系, 并利用光学数据扩展LiDAR的估算区域, 实现空间连续。温雨笑等(2022)从LiDAR数据中提取出的第一回波的分位数高度特征变量与密度特征变量, 结合了GF-1高光谱数据中提取出的植被指数、波段组合因子等特征, 并结合地面调查数据, 采用机器学习算法反演了美国Howland森林AGB, 估算结果R2为0.927。Dekker等(2022)使用了Landsat-8多光谱数据和具有两种空间分辨率下的树冠高度和图像纹理比率的LiDAR数据, 提出了一种估算森林AGB的新模型, 对美国北卡罗莱纳州东部进行了AGB估算, 模型的相关系数为0.625。Tang等(2022)将MODIS光学数据和LiDAR数据结合在一起开发了6种基于机器学习算法的模型对中国森林AGB进行了估算, 结果表明, 中国的森林AGB密度约为(53.16 ± 1.63) Mg·hm-2。
4.2 光学与SAR数据联合估算生物量
SAR数据穿透能力强, 可获得垂直结构信息, 光学数据具有充足的时空数据源, 但是只能获取冠层表面信息, 且易受天气云层影响。因此结合光学数据与SAR数据对大范围长时间序列的森林AGB估算具有重要前景。
目前光学数据与SAR数据联合估算AGB的主要方式是将光学数据或者SAR数据获取的不同森林生态生化参数(例如植被指数、纹理信息、森林参数和后向散射系数等)作为模型的输入参数, 构建相应的回归模型, 完成森林AGB的反演。Zhu等(2020)协同Landsat-8 OLI数据和ALOS-2 PALSAR-2数据提取出的后向散射信息构建了RF模型和多元线性回归模型对北京的森林AGB进行了估算, 研究发现多元线性回归估算AGB的精度更高。Zhang等(2022)使用Landsat-8、GF-1两幅光学影像和GF-3 SAR影像, 提出了一种结合RF和K最近邻域优势的新算法, 帮助监测不同类型森林AGB随着时间的推移与气候变化相关的变化。Li等(2022)使用来自PALSAR-2和Sentinel-2数据的48个变量, 训练出RF回归模型估算了日本茨城县雪松(Cedrus deodara)的森林AGB, 研究表明, 组合来自多个传感器的信息可以提高森林AGB估算的准确性和稳定性。Shao和Zhang (2016)同时结合基于光学反射率得到的植被指数和SAR数据的HV极化后向散射系数构建了新的植被指数Combined VI (COVI), 结果表明该指数在森林AGB估算上具有应用前景。
虽然目前已有诸多协同使用SAR以及光学数据获取的地表参数进行森林AGB估算, 但大部分研究还是基于提取参数建立回归模型法, 虽然该类方法能够在一些情况下提高估算精度, 但缺乏从机理上对两种数据的协同与融合, 因此这类简单回归模型的融合方法在大范围应用中可能会受到挑战。
4.3 LiDAR与SAR数据联合估算生物量
SAR数据不受天气影响, 穿透能力强, 但易受地形影响, 而且在生物量较高时容易饱和, LiDAR克服了SAR的不足, 但是不能够获取大尺度空间连续分布的冠层结构信息, 与SAR数据联合可实现高精度连续分布的生物量制图。其中LiDAR数据主要以两种功能加以协同使用, 即作为参考数据使用(训练样本), 以及作为估算模型的输入变量使用。
将LiDAR作为参考数据主要是出于两方面原因, 一是LiDAR在森林AGB估算中的精度较高, 二是地面实测数据往往较少, 基于LiDAR数据可以拓展参数数据。Musthafa和Singh (2022)用Radarsat-2 C波段、ALOS-2/PALSAR-2 L波段和GEDI数据来构建RF学习方法对森林AGB进行建模, 结果表明, SAR数据与LiDAR数据相结合在估算森林AGB上起到较好的作用, 均方根误差为22.11 Mg·hm-2。Wang等(2022)使用ICESat/GLAS的LiDAR数据和L波段PALSAR数据, 对中国东北大兴安岭和小兴安岭的森林AGB进行估算, 经过地形校正的GLAS数据与PALSAR特征与RF回归的组合在地块尺度上产生了最好的结果, 预测的森林AGB在(79.81 ± 16.00) Mg·hm-2范围内。Zeng等(2022a)将从LiDAR数据中提取出的森林强度、密度、高度参数, 从InSAR数据中提取的相干系数以及从PolSAR数据中提取的后行散射系数和极化分解参数, 来估算森林AGB, 结果表明, 三者结合具有更高的精度, R2高于0.81。
4.4 光学、SAR与LiDAR数据联合估算生物量
多源遥感数据协同可以克服单一遥感数据源的局限性, 综合多种数据源(包括光学数据、SAR数据和LiDAR等)的优势可以更好地提高森林AGB估算的精度(Ehlers et al., 2022)。Gupta和Shrma (2022)使用了多光谱光学数据、SAR数据和LiDAR数据, 构建RF模型, 对印度古吉拉特邦野生动物保护区的混合热带森林AGB进行了估算, 结果表明估算AGB的均方根误差为30.44 Mg·hm-2, R2为0.46。Wang等(2022)系统比较了用于森林AGB估算的3种遥感数据源的性能, 使用的数据分别为GLAS数据、MODIS数据和PALSAR数据, 结果表明经过地形校正的GLAS和PALSAR特征信息与RF回归的组合在地块尺度上产生了最好的估算效果。Kanmegne Tamga等(2022)使用了Sentinel-2光学数据、Sentinel-1和ALOS-2 SAR数据以及GEDI数据, 从中提取出植被指数和纹理参数等信息作为机器学习的预测因子对非洲西部部分地区AGB进行了估算, 结果发现, RF算法与光学数据和SAR数据结合取得了最好的结果。
需要注意的是, 在实际估算中, 不同遥感数据和辅助数据在时间尺度和空间尺度均存在差异, 这将不可避免地引入数据间的配准误差, 造成生物量估算精度下降。例如不同遥感数据的获取时间不同, 表征了不同时间点的植被状态, 因此难以保证融合反演精度, 且在进行协同时可能会存在一方数据源时间数据缺失的情况; 遥感数据源与实际调查数据在精度上也会存在较大的差异(Wang et al., 2022)。因此, 在进行不同数据源协同估算AGB时, 应该充分考虑这种差异所带来的影响, 探测不同类型遥感数据和辅助数据的数据特点, 研究不同协同方式下的解决方案, 解决数据融合过程中的精度问题, 从而降低数据协同过程中因为尺度不匹配所带来的影响。
5 讨论
5.1 森林物理特征对AGB估算的影响
森林分布范围广, 不同的森林类型(针叶林/阔叶林)和林分结构(单一林/混交林)在结构分布上有巨大的差异(Cho et al., 2007; Bargali et al., 2018)。光学遥感可提供植被冠层的光谱信息, 但其使用的电磁波波长较短, 对茂密森林的穿透能力不足, 无法获取冠层以下的森林结构和地表位置信息, 导致在森林AGB估算领域精度不足(曹海翊等, 2022)。SAR穿透性更强, 且不同波段的穿透能力不同, 可以获取垂直分布的树木物理结构信息以及森林的三维结构信息(Gama et al., 2010), 因此, 更适用于森林AGB估算。LiDAR可以获取更高密度的光子点云以及更加完整的波形数据, 从而获取更高精度的单木信息以及森林冠层高度等结构参数, 也适合作为森林AGB估算的数据源(Hill & Thomson, 2005)。
目前大部分森林AGB估算的方法是建立胸径、树木冠幅和生物量之间的关系, 然而, 对于不同的树种, 其胸径和树木冠幅与生物量之间的函数关系也存在差异, 因此在建立森林AGB相关生物模型时, 应根据研究需要确定森林生物量估算的对象和范围, 最好分别对不同森林类型建立森林AGB与遥感数据的关系模型, 不同区域也应分别建立生物量预测模型, 区域的划分应考虑保持同一区域内没有较大的地表状况差别。森林AGB估算过程需要根据树种类型构建相对应的模型, 目前一般使用地面调查实测数据获取的单木信息。然而目前仍有大部分区域缺少实测数据, 需要依赖卫星影像进行植被分类以获取森林的分布信息(Zhang et al., 2022)。
如今, 森林AGB的研究已受到广大研究人员的广泛关注, 学者们不再满足单一的遥感数据源, 采用多源遥感数据来进行森林AGB估测的研究。利用光学遥感影像获取的水平结构与雷达遥感影像获取的垂直结构进行信息互补, 可以更加完整地获取森林三维结构的详细信息, 使生物量的估测结果更加可靠。因此, 在森林AGB估算时, 结合不同树种类型的特点, 选取对相应树种类型更加适合的估算模型、采用合适的多源数据协同方案, 对于森林AGB估算是非常重要且必要的。
5.2 辅助信息对AGB估算的影响
在AGB估算过程中, 遥感数据可以提供大范围、多时相、时空分辨率较高的数据, 遥感的这些特点为AGB估算提供了大尺度时空的数据支持。虽然遥感在时空分辨率方面已经得到了极大的改进和提升, 然而精度仍比不上地面实测数据。因此, 将遥感数据与不同类型的辅助数据相结合, 如郁闭度(canopy closure)、冠层高度(canopy height)、年降水量(AP)、年平均温度(MAT)和DEM, 也有助于提高森林AGB估算的准确性(Hall et al., 2006; Main-Knorn et al., 2011)。研究表明, 生物量在年降水量为900-1 600 mm之间时波动幅度较小, 比较稳定; 而年平均气温6 ℃左右时, 生物量的值达到最大, 说明此温度条件更适合于AGB的积累(Zhang et al., 2019b)。DEM和冠层高度的数据精度越高, AGB的估算也就会更加精准。此外, 除了现有的两种遥感方式协同估算AGB之外, 更多源遥感方式的协同估算使实地AGB与估算AGB具有更高的相关性。如Ehlers等(2022)使用Landsat光学影像提供的物种组成信息、LiDAR数据提供的冠层高度数据、Radar数据提供的冠层体积数据, 基于这3种不同数据源提供的信息, 构建RF模型估算了北卡罗来纳州东部的森林AGB, 估算出来的AGB与实地AGB显示出了较强的相关性。
6 总结和展望
本文归纳了当前基于遥感技术进行森林AGB估算的相关研究, 对使用光学遥感、SAR、LiDAR以及多源遥感协同方式估算森林AGB的原理和研究方法进行了归纳总结,得出了如下结论:
(1)森林AGB估算经历了从统计分析到遥感方式估算的转变, 将地形、环境因子、森林物理特性作为辅助因子添加到AGB的估算过程中可以有效地提高估算精度。在此过程中, 新型遥感数据在森林AGB监测中的应用愈加广泛, 在空间分辨率、时间分辨率或光谱分辨率等方面不断突破, 进一步丰富了森林AGB估算的研究数据来源。
(2)多源遥感数据协同方式能更好地提高森林AGB估算的精度, 具有很大的发展潜力。但是在实际估算中, 不同遥感数据源时空尺度存在差异性, 遥感数据与实际调查数据在尺度上也存在差异性。因此, 需要探测不同类型遥感数据源的规律, 研究不同组合条件下的解决方案, 突破数据结合过程中的精度问题, 从而降低模型融合带来的不确定性。
(3)生物量取决于树种、冠幅、林分密度等森林参数, 目前大多数估算模型可移植性不强, 因此, 森林AGB估算的相关模型仍需进行深层次的优化, 例如, 引入实地调查数据或其他辅助数据以优化模型等。此外, 目前机器学习、人工智能、深度学习的发展和应用较广, 可以应用于森林AGB的估算, 但是遥感机理的研究是创新的根源, 因此应该将遥感数据的用途侧重于提取森林的生物物理参数再进行AGB估算。
参考文献
Approaches of satellite remote sensing for the assessment of above-ground biomass across tropical forests: pan-tropical to national scales
The ICESat-2 laser altimetry mission
DOI:10.1109/JPROC.2009.2034765 URL [本文引用: 1]
Review of machine learning approaches for biomass and soil moisture retrievals from remote sensing data
DOI:10.3390/rs71215841 URL [本文引用: 1]
Height extraction and stand volume estimation based on fusion airborne LiDAR data and terrestrial measurements for a Norway spruce (Picea abies (L.) Karst.) test site in Romania
DOI:10.15835/nbha44110155
URL
[本文引用: 1]

The objective of this study was to analyze the efficiency of individual tree identification and stand volume estimation from LiDAR data. The study was located in Norway spruce [Picea abies (L.) Karst.] stands in southwestern Romania and linked airborne laser scanning (ALS) with terrestrial measurements through empirical modelling. The proposed method uses the Canopy Maxima algorithm for individual tree detection together with biometric field measurements and individual trees positioning. Field data was collected using Field-Map real-time GIS-laser equipment, a high-accuracy GNSS receiver and a Vertex IV ultrasound inclinometer. ALS data were collected using a Riegl LMS-Q560 instrument and processed using LP360 and Fusion software to extract digital terrain, surface and canopy height models. For the estimation of tree heights, number of trees and tree crown widths from the ALS data, the Canopy Maxima algorithm was used together with local regression equations relating field-measured tree heights and crown widths at each plot. When compared to LiDAR detected trees, about 40-61% of the field-measured trees were correctly identified. Such trees represented, in general, predominant, dominant and co-dominant trees from the upper canopy. However, it should be noted that the volume of the correctly identified trees represented 60-78% of the total plot volume. The estimation of stand volume using the LiDAR data was achieved by empirical modelling, taking into account the individual tree heights (as identified from the ALS data) and the corresponding ground reference stem volume. The root mean square error (RMSE) between the individual tree heights measured in the field and the corresponding heights identified in the ALS data was 1.7-2.2 meters. Comparing the ground reference estimated stem volume (at trees level) with the corresponding ALS estimated tree stem volume, an RMSE of 0.5-0.7 m3 was achieved. The RMSE was slightly lower when comparing the ground reference stem volume at plot level with the ALS-estimated one, taking into account both the identified and unidentified trees in the LiDAR data (0.4-0.6 m3).
Understanding ERS InSAR coherence of boreal forests
C-band repeat-pass interferometric SAR observations of the forest
DOI:10.1109/36.551931 URL [本文引用: 4]
Vegetation modeled as a water cloud
DOI:10.1029/RS013i002p00357
URL
[本文引用: 1]
Because the microwave dielectric constant of dry vegetative matter is much smaller (by an order of magnitude or more) than the dielectric constant of water, and because a vegetation canopy is usually composed of more than 99% air by volume, it is proposed that the canopy can be modeled as a water cloud whose droplets are held in place by the vegetative matter. Such a model was developed assuming that the canopy “cloud” contains identical water droplets randomly distributed within the canopy. By integrating the scattering and attenuation cross‐section contributions of N droplets per unit volume over the signal pathlength through the canopy, an expression was derived for the backscattering coefficient as a function of three target parameters: volumetric moisture content of the soil, volumetric water content of the vegetation, and plant height. Regression analysis of the model predictions against scattering data acquired over a period of four months at several angles of incidence (0°–70°) and frequencies (8–18 GHz) for HH and VV polarizations yields correlation coefficients that range from.7 to.99 depending on frequency, polarization, and crop type. The corresponding standard errors of estimate range from 1.1 to 2.6 dB.
Optimum surface roughness to parameterize advanced integral equation model for soil moisture retrieval in prairie area using radarsat-2 data
DOI:10.1109/TGRS.2015.2501372 URL [本文引用: 1]
Synthetic aperture radar interferometry
Effect of vegetation type and season on microbial biomass carbon in Central Himalayan forest soils, India
DOI:10.1016/j.catena.2018.07.001 URL [本文引用: 1]
Forest inventory with terrestrial LiDAR: a comparison of static and hand-held mobile laser scanning
Integrating airborne LiDAR and terrestrial laser scanner forest parameters for accurate above-ground biomass/carbon estimation in Ayer Hitam tropical forest, Malaysia
DOI:10.1016/j.jag.2018.07.026 URL [本文引用: 1]
Aboveground and belowground biomass and sapwood area allometric equations for six boreal tree species of northern Manitoba
DOI:10.1139/x02-063
URL
[本文引用: 1]
Allometric equations were developed relating aboveground biomass, coarse root biomass, and sapwood area to stem diameter at 17 study sites located in the boreal forests near Thompson, Man. The six species studied were trembling aspen (Populus tremuloides Michx.), paper birch (Betula papyrifera Marsh.), black spruce (Picea mariana (Mill.) BSP), jack pine (Pinus banksiana Lamb.), tamarack (Larix laricina (Du Roi) Koch.), and willow (Salix spp.). Stands ranged in age from 4 to 130 years and were categorized as well or poorly drained. Stem diameter ranged from 0.1 to 23.7 cm. Stem diameter was measured at both the soil surface (D0) and breast height (DBH). The relationship between biomass and diameter, fitted on a log\u0096log scale, changed significantly at ~3 cm DBH, suggesting that allometry differed between saplings and older trees. To eliminate this nonlinearity, a model of form log10Y = a + b(log10D) + c(AGE) + d(log10D × AGE) was used, where D is stem diameter, AGE is stand age, and the cross product is the interaction between diameter and age. Most aboveground biomass equations (N = 326) exhibited excellent fits (R2> 0.95). Coarse root biomass equations (N = 205) exhibited good fits (R2> 0.90). Both D0and DBH were excellent (R2> 0.95) sapwood area predictors (N = 413). Faster growing species had significantly higher ratios of sapwood area to stem area than did slower growing species. Nonlinear aspects of some of the pooled biomass equations serve as a caution against extrapolating allometric equations beyond the original sample diameter range.
Non-destructive tree volume estimation through quantitative structure modelling: comparing UAV laser scanning with terrestrial LIDAR
ZY-3 satellite remote sensing technology
“资源三号”卫星遥感技术
Review on development of forest biomass remote sensing satellites
森林生物量遥感卫星发展综述
System design and key technologies of the GF-7 satellite
高分七号卫星总体设计与技术创新
Mapping forest aboveground biomass in the Northeastern United States with ALOS PALSAR dual-polarization L-band
DOI:10.1016/j.rse.2012.05.029 URL [本文引用: 1]
Large area forest stem volume mapping in the boreal zone using synergy of ERS-1/2 tandem coherence and MODIS vegetation continuous fields
DOI:10.1016/j.rse.2010.12.003 URL [本文引用: 1]
ERS INSAR data for remote sensing hilly forested areas
DOI:10.1016/S0034-4257(00)00083-3 URL [本文引用: 1]
Tree allometry and improved estimation of carbon stocks and balance in tropical forests
DOI:10.1007/s00442-005-0100-x
PMID:15971085
[本文引用: 1]
Tropical forests hold large stores of carbon, yet uncertainty remains regarding their quantitative contribution to the global carbon cycle. One approach to quantifying carbon biomass stores consists in inferring changes from long-term forest inventory plots. Regression models are used to convert inventory data into an estimate of aboveground biomass (AGB). We provide a critical reassessment of the quality and the robustness of these models across tropical forest types, using a large dataset of 2,410 trees >or= 5 cm diameter, directly harvested in 27 study sites across the tropics. Proportional relationships between aboveground biomass and the product of wood density, trunk cross-sectional area, and total height are constructed. We also develop a regression model involving wood density and stem diameter only. Our models were tested for secondary and old-growth forests, for dry, moist and wet forests, for lowland and montane forests, and for mangrove forests. The most important predictors of AGB of a tree were, in decreasing order of importance, its trunk diameter, wood specific gravity, total height, and forest type (dry, moist, or wet). Overestimates prevailed, giving a bias of 0.5-6.5% when errors were averaged across all stands. Our regression models can be used reliably to predict aboveground tree biomass across a broad range of tropical forests. Because they are based on an unprecedented dataset, these models should improve the quality of tropical biomass estimates, and bring consensus about the contribution of the tropical forest biome and tropical deforestation to the global carbon cycle.
Development of forest biomass estimation using SAR data
合成孔径雷达森林生物量估测研究进展
Estimation of green grass/herb biomass from airborne hyperspectral imagery using spectral indices and partial least squares regression
DOI:10.1016/j.jag.2007.02.001 URL [本文引用: 1]
Dual-baseline coherence tomography
DOI:10.1109/LGRS.2006.885893 URL [本文引用: 2]
Unmanned aerial systems for photogrammetry and remote sensing: a review
DOI:10.1016/j.isprsjprs.2014.02.013 URL [本文引用: 1]
Developing two additive biomass equations for three coniferous plantation species in northeast China
Comparison of tree biomass modeling approaches for larch (Larix olgensis Henry) trees in northeast China
Evaluation on spaceborne multispectral images, airborne hyperspectral, and LiDAR data for extracting spatial distribution and estimating aboveground biomass of wetland vegetation Suaeda salsa
DOI:10.1109/JSTARS.4609443 URL [本文引用: 1]
Mapping forest aboveground biomass using multisource remotely sensed data
Multitemporal JERS repeat-pass coherence for growing-stock volume estimation of Siberian forest
DOI:10.1109/TGRS.2003.814131 URL [本文引用: 2]
Predictive relations of tropical forest biomass from Landsat TM data and their transferability between regions
DOI:10.1016/S0034-4257(03)00039-7 URL [本文引用: 1]
Invertible canopy reflectance modeling of vegetation structure in semiarid woodland
DOI:10.1109/36.7712 URL [本文引用: 1]
Stem volume estimation in boreal forests using ERS-1/2 coherence and SPOT XS optical data
DOI:10.1080/01431160010006872 URL [本文引用: 1]
Eucalyptus biomass and volume estimation using interferometric and polarimetric SAR data
DOI:10.3390/rs2040939 URL [本文引用: 1]
Structural stability design and implementation of ZY-3 satellite
资源三号卫星结构稳定性设计与实现
Inversion of aboveground biomass of Pinus tabuliformis plantations based on GF-2 data
A review of wetland remote sensing
Estimating forest biomass in western Guangdong using landsat TM data
利用TM数据提取粤西地区的森林生物量
Repeat-pass SAR interferometry over forested terrain
DOI:10.1109/TGRS.36 URL [本文引用: 1]
Modeling forest stand structure attributes using Landsat ETM+ data: application to mapping of aboveground biomass and stand volume
DOI:10.1016/j.foreco.2006.01.014 URL [本文引用: 1]
A new methodology for the estimation of biomass of coniferdominated boreal forest using NOAA AVHRR data
DOI:10.1080/014311697217053 URL [本文引用: 1]
Comparison of the accuracy of the maximum canopy height and biomass inversion of the data of different GEDI algorithm groups
GEDI不同算法组数据反演森林最大冠层高度和生物量精度比较
Estimating single-tree crown biomass of Norway spruce by airborne laser scanning: a comparison of methods with and without the use of terrestrial laser scanning to obtain the ground reference data
DOI:10.3390/f5030384 URL [本文引用: 1]
Regional forest biomass estimation using ICESat/GLAS spaceborne LiDAR over Borneo
DOI:10.1080/17583004.2015.1066638 URL [本文引用: 1]
Mapping woodland species composition and structure using airborne spectral and LiDAR data
DOI:10.1080/01431160500114706 URL [本文引用: 1]
The spatial distribution of forest biomass in the Brazilian Amazon: a comparison of estimates
DOI:10.1111/gcb.2001.7.issue-7 URL [本文引用: 1]
Aboveground forest biomass estimation using ICESat GLAS in Yunnan, China
基于ICESat GLAS的云南省森林地上生物量反演
An international comparison of individual tree detection and extraction using airborne laser scanning
DOI:10.3390/rs4040950 URL [本文引用: 1]
Estimation of aboveground biomass in agroforestry systems over three climatic regions in west Africa Using Sentinel-1, Sentinel-2, ALOS, and GEDI Data
Biomass quantification in forest: a review and use case with Gedi Lidar data
Simulated full-waveform lidar compared to Riegl VZ-400 terrestrial laser scans
Estimation of forest biomass from airborne LiDAR data as measures against global warming-individual tree unit and forest stand unit
The seasonal behavior of interferometric coherence in boreal forest
DOI:10.1109/36.917903 URL [本文引用: 1]
Remote sensing of above-ground biomass
Lidar remote sensing of above-ground biomass in three biomes
DOI:10.1046/j.1466-822x.2002.00303.x
URL
[本文引用: 1]
Estimation of the amount of carbon stored in forests is a key challenge for understanding the global carbon cycle, one which remote sensing is expected to help address. However, estimation of carbon storage in moderate to high biomass forests is difficult for conventional optical and radar sensors. Lidar (light detection and ranging) instruments measure the vertical structure of forests and thus hold great promise for remotely sensing the quantity and spatial organization of forest biomass. In this study, we compare the relationships between lidar‐measured canopy structure and coincident field measurements of above‐ground biomass at sites in the temperate deciduous, temperate coniferous, and boreal coniferous biomes. A single regression for all three sites is compared with equations derived for each site individually. The single equation explains 84% of variance in above‐ground biomass (P < 0.0001) and shows no statistically significant bias in its predictions for any individual site.
Relating forest biomass to SAR data
DOI:10.1109/36.134089 URL [本文引用: 1]
General review on remote sensing-based biomass estimation
遥感技术估算森林生物量的研究进展
Estimation of forest aboveground biomass of two major conifers in Ibaraki Prefecture, Japan, from PALSAR-2 and sentinel-2 data
Forest above-ground biomass estimation based on multi-baseline InSAR tomography
森林地上生物量的多基线InSAR层析估测方法
Forest above-ground biomass estimation at plot and tree levels using airborne LiDAR data
机载LiDAR数据估算样地和单木尺度森林地上生物量
Review on forest parameters inversion using LiDAR
激光雷达森林参数反演研究进展
A survey of developments on forest resources monitoring technology of synthetic aperture radar
合成孔径雷达森林资源监测技术研究综述
Comparison of artificial neural network with compatible biomass model for predicting aboveground biomass of individual tree
人工神经网络与相容性生物量模型预测单木地上生物量的比较
DOI:10.13287/j.1001-9332.202201.001
[本文引用: 2]
森林生物量是林业生产经营和森林资源监测的重要指标,为探索高效低偏的单木生物量估测方法,引入人工神经网络。本研究采用黑龙江省东折棱河林场的101株长白落叶松地上生物量数据,基于不同变量(胸径、树高、冠幅)组合建立了4个聚合模型体系(AMS),采用加权回归消除模型的异方差。然后,基于最优的变量组合建立人工神经网络(ANN)生物量模型,并采用留一交叉验证法对模型进行检验,比较两种生物量估测方法的精度。结果表明: 仅基于胸径一个变量的生物量模型已经能较准确地估测生物量,引入树高和冠幅因子能进一步提高模型精度,最优模型体系为AMS4。通过两种方法建立的生物量模型都能较准确地进行估测,各组分生物量的决定系数(R<sup>2</sup>)均高于0.87。相比AMS4,人工神经网络模型系统中,树叶生物量模型的R<sup>2</sup>高了约0.05,其余各器官也高了0.01左右。此外,均方根误差(RMSE)等指标明显更小,树干和地上生物量的RMSE分别减小了2.135和3.908 kg,模型的检验指标如平均相对误差(MRE)等也表现更优。总体来看,人工神经网络(ANN)是一种灵活可靠的生物量估计方法,估测林木地上生物量或单独某器官生物量时,ANN模型是值得考虑的替代方法。
Modeling biomass for natural subtropical secondary forest using multi-source data and different regression models in Huangfu Mountain, China
The potential of fully polarized ALOS-2 data for estimating forest above-ground biomass
Exploring TM image texture and its relationships with biomass estimation in Rondônia, Brazilian Amazon
DOI:10.1590/S0044-59672005000200015
URL
[本文引用: 1]
Many texture measures have been developed and used for improving land-cover classification accuracy, but rarely has research examined the role of textures in improving the performance of aboveground biomass estimations. The relationship between texture and biomass is poorly understood. This paper used Landsat Thematic Mapper (TM) data to explore relationships between TM image textures and aboveground biomass in Rondônia, Brazilian Amazon. Eight grey level co-occurrence matrix (GLCM) based texture measures (i.e., mean, variance, homogeneity, contrast, dissimilarity, entropy, second moment, and correlation), associated with seven different window sizes (5x5, 7x7, 9x9, 11x11, 15x15, 19x19, and 25x25), and five TM bands (TM 2, 3, 4, 5, and 7) were analyzed. Pearson's correlation coefficient was used to analyze texture and biomass relationships. This research indicates that most textures are weakly correlated with successional vegetation biomass, but some textures are significantly correlated with mature forest biomass. In contrast, TM spectral signatures are significantly correlated with successional vegetation biomass, but weakly correlated with mature forest biomass. Our findings imply that textures may be critical in improving mature forest biomass estimation, but relatively less important for successional vegetation biomass estimation.
The potential and challenge of remote sensing-based biomass estimation
DOI:10.1080/01431160500486732 URL [本文引用: 1]
A survey of remote sensing-based aboveground biomass estimation methods in forest ecosystems
DOI:10.1080/17538947.2014.990526 URL [本文引用: 1]
Estimation of aboveground biomass of Robinia pseudoacacia forest in the Yellow River Delta based on UAV and Backpack LiDAR point clouds
Empirical relationships between AIRSAR backscatter and LiDAR-derived forest biomass, Queensland, Australia
DOI:10.1016/j.rse.2005.10.019 URL [本文引用: 1]
Evaluating the remote sensing and inventory-based estimation of biomass in the western Carpathians
DOI:10.3390/rs3071427 URL [本文引用: 1]
Improving forest above-ground biomass retrieval using multi-sensor L-and C-band SAR data and multi-temporal spaceborne LiDAR data
Narrow band vegetation indices overcome the saturation problem in biomass estimation
DOI:10.1080/01431160310001654923 URL [本文引用: 2]
Prediction of forest aboveground biomass using multitemporal multispectral remote sensing data
Spatial distribution of grassland biomass in China
中国草地植被生物量及其空间分布格局
Effects of environmental conditions on boreal forest classification and biomass estimates with SAR
DOI:10.1109/36.843016 URL [本文引用: 1]
Forest biomass from combined ecosystem and radar backscatter modeling
DOI:10.1016/S0034-4257(96)00114-9 URL [本文引用: 3]
Stem volume retrieval in boreal forests from ERS-1/2 interferometry
DOI:10.1016/S0034-4257(01)00329-7 URL [本文引用: 1]
Retrieval of growing stock volume in boreal forest using hyper- temporal series of Envisat ASAR ScanSAR backscatter measurements
DOI:10.1016/j.rse.2010.09.018 URL [本文引用: 1]
Potential of texture measurements of two-date dual polarization PALSAR data for the improvement of forest biomass estimation
DOI:10.1016/j.isprsjprs.2012.03.002 URL [本文引用: 1]
Estimating forest aboveground biomass by combining optical and SAR data: a case study in Genhe, Inner Mongolia, China
Fusing GEDI with earth observation data for large area aboveground biomass mapping
Some early developments in synthetic aperture radar systems
Vegetation indices: advances made in biomass estimation and vegetation monitoring in the last 30 years
Fusing simulated GEDI, ICESat-2 and NISAR data for regional aboveground biomass mapping
A review of radar remote sensing for biomass estimation
DOI:10.1007/s13762-015-0750-0 URL [本文引用: 1]
Effects of forest biomass and stand consolidation on P-band backscatter
DOI:10.1109/LGRS.2007.905120 URL [本文引用: 1]
Optical remote sensing of forest leaf area index and biomass
DOI:10.1177/0309133312471367
URL
[本文引用: 1]
Forests are the most complex terrestrial ecosystem on Earth’s land surface, providing vital goods and services upon which the welfare of humanity depends. The quantification of leaves and biomass in forests is critical for understanding the ecological role of forests in the terrestrial ecosystem. Great effort has been dedicated to the mapping of leaf area and biomass using remotely sensed data. This review focuses on the use of optical remote sensing in mapping leaf area index (LAI) and aboveground biomass for forests. Significant progress has been made in mapping LAI in the past few decades. Mapping of LAI started with location-specific empirical approaches and evolved to semi-empirical and biophysical approaches, which can be applied globally. Although there are some biases in the current LAI products, it can be expected that better-quality LAI products will be delivered in the future. At present, mapping biomass remains predominantly empirical because there is no direct physical relationship between reflected energy in visible, near or mid infrared wavelengths and biomass. Mapping biomass relies on the explicit or implicit mapping of forest structural parameters that are related to biomass allometrically. Although optical images have been successfully used in mapping biomass in low biomass areas, it remains a challenge to map biomass in forested areas with high biomass density due to signal saturation.
Remote sensing estimation of forest above-ground biomass based on spaceborne lidar ICESat-2/ATLAS data
基于星载ICESat-2/ATLAS数据的森林地上生物量估测
Non-destructive aboveground biomass estimation of coniferous trees using terrestrial LiDAR
DOI:10.1016/j.rse.2017.08.013 URL [本文引用: 2]
A three-dimensional radar backscatter model of forest canopies
DOI:10.1109/TGRS.36 URL [本文引用: 1]
Estimation of national forest aboveground biomass from multi-source remotely sensed dataset with machine learning algorithms in China
Segmenting tree crowns from terrestrial and mobile LiDAR data by exploring ecological theories
DOI:10.1016/j.isprsjprs.2015.10.007 URL [本文引用: 1]
Above-ground biomass estimation from LiDAR data using random forest algorithms
Biomass estimation in a tropical wet forest using Fourier transforms of profiles from lidar or interferometric SAR
Michigan microwave canopy scattering model
DOI:10.1080/01431169008955090 URL [本文引用: 1]
Imputation of single-tree attributes using airborne laser scanning-based height, intensity, and alpha shape metrics
DOI:10.1016/j.rse.2010.01.016 URL [本文引用: 2]
Relating P-band SAR intensity to biomass for tropical dense forests in hilly terrain: γ0 or t0
DOI:10.1109/JSTARS.4609443 URL
Evaluating tree detection and segmentation routines on very high resolution UAV LiDAR data
DOI:10.1109/TGRS.2014.2315649 URL [本文引用: 1]
LeWoS: a universal leaf-wood classification method to facilitate the 3D modelling of large tropical trees using terrestrial LiDAR
DOI:10.1111/mee3.v11.3 URL [本文引用: 2]
Earth science applications of ICESat/GLAS: a review
DOI:10.1080/01431161.2010.547533 URL [本文引用: 1]
Integrating multi-source remote sensing to assess forest aboveground biomass in the Khingan mountains of north-eastern China using machine-learning algorithms
Gaofen-7 satellite officially put into use
高分七号卫星正式投入使用
Study on inversion of forest biomass by LiDAR and hyperspectral
DOI:10.13474/j.cnki.11-2246.2022.0200
[本文引用: 1]
Estimating forest aboveground biomass (AGB) is critical to achieving global carbon neutral goals. In this study, Howland forest in Maine, USA is taken as the research area. With the ground measured sample site data, different data sources (airborne LiDAR and hyperspectral remote sensing data) and machine learning algorithms (random forest, support vector machine, gradient boosting decision tree and K-nearest neighbor) are compared and analyzed. It is to improve the estimation accuracy of Howland forest AGB. The results show that the optimal accuracy of the model with airborne LiDAR and hyperspectral vegetation index variables is 0.874 and 0.868 respectively. The accuracy of the regression model with the combination of airborne LiDAR and hyperspectral vegetation index variables and gradient boosting decision tree is 0.927, that is, multi-source remote sensing data is better than a single data source. The synergistic use of LiDAR and hyperspectral data has applicability and application prospects for improving the accuracy of biomass estimates in areas such as Howland and beyond.
高光谱和LiDAR联合反演森林生物量研究
DOI:10.13474/j.cnki.11-2246.2022.0200
[本文引用: 1]
估算森林地上生物量(AGB)对于全球实现碳中和目标至关重要。本文以美国缅因州Howland森林为研究区域,借助地面实测样地数据,对比分析协同不同数据源(高光谱和LiDAR)和机器学习算法(随机森林、支持向量机、梯度提升决策树和K最邻近回归)的研究,以改善Howland森林的生物量估计精度。结果表明,采用LiDAR和高光谱植被指数变量模型的最佳精度分别为0.874和0.868,协同高光谱和LiDAR变量并采用梯度提升决策树回归模型的精度为0.927,即多源遥感数据要优于单一数据源。高光谱和LiDAR数据的协同使用对于提高类似于Howland地区或更广泛区域的生物量估计的准确性,具有普遍的适用性与一定的应用前景。
A continental phenology model for monitoring vegetation responses to interannual climatic variability
DOI:10.1029/97GB00330
URL
[本文引用: 1]
Regional phenology is important in ecosystem simulation models and coupled biosphere/atmosphere models. In the continental United States, the timing of the onset of greenness in the spring (leaf expansion, grass green‐up) and offset of greenness in the fall (leaf abscission, cessation of height growth, grass brown‐off) are strongly influenced by meteorological and climatological conditions. We developed predictive phenology models based on traditional phenology research using commonly available meteorological and climatological data. Predictions were compared with satellite phenology observations at numerous 20 km × 20 km contiguous landcover sites. Onset mean absolute error was 7.2 days in the deciduous broadleaf forest (DBF) biome and 6.1 days in the grassland biome. Offset mean absolute error was 5.3 days in the DBF biome and 6.3 days in the grassland biome. Maximum expected errors at a 95% probability level ranged from 10 to 14 days. Onset was strongly associated with temperature summations in both grassland and DBF biomes; DBF offset was best predicted with a photoperiod function, while grassland offset required a combination of precipitation and temperature controls. A long‐term regional test of the DBF onset model captured field‐measured interannual variability trends in lilac phenology. Continental application of the phenology models for 1990–1992 revealed extensive interannual variability in onset and offset. Median continental growing season length ranged from a low of 129 days in 1991 to a high of 146 days in 1992. Potential uses of the models include regulation of the timing and length of the growing season in large‐scale biogeochemical models and monitoring vegetation response to interannual climatic variability.
Aggregated biomass model systems and carbon concentration variations for tree carbon quantification of natural Mongolian oak in northeast China
Assessment of individual tree detection and canopy cover estimation using unmanned aerial vehicle based light detection and ranging (UAV-LiDAR) data in planted forests
LiDAR applications to estimate forest biomass at individual tree scale: opportunities, challenges and future perspectives
An automated hierarchical approach for three-dimensional segmentation of single trees using UAV LiDAR data
A concave hull methodology for calculating the crown volume of individual trees based on vehicle-borne LiDAR data
Decorrelation in interferometric radar echoes
DOI:10.1109/36.175330 URL [本文引用: 1]
Component forest above ground biomass estimation using LiDAR and SAR data
Forest total and component above-ground biomass (AGB) estimation through C- and L-band Polarimetric SAR data
Application of synthetic NDVI time series blended from Landsat and MODIS data for grassland biomass estimation
Apple tree branch information extraction from terrestrial laser scanning and backpack-LiDAR
Deep learning based retrieval of forest aboveground biomass from combined LiDAR and Landsat 8 data
Estimating aboveground biomass in subtropical forests of China by integrating multisource remote sensing and ground data
Forest above-ground biomass inversion using optical and SAR images based on a multi-step feature optimized inversion model
Estimating aboveground biomass using Landsat 7 ETM+ data across a managed landscape in northern Wisconsin, USA
DOI:10.1016/j.rse.2004.08.008 URL [本文引用: 1]
Estimation of forest biomass in Beijing (China) using multisource remote sensing and forest inventory data
