
Chin J Plan Ecolo ›› 2015, Vol. 39 ›› Issue (7): 726-735.DOI: 10.17521/cjpe.2015.0069 cstr: 32100.14.cjpe.2015.0069
• Orginal Article • Previous Articles Next Articles
CHEN Yong-Gang1,2,*( ), TANG Meng-Ping1,2, YANG Chun-Ju1,2, MA Tian-Wu1,2, WANG Li3
Online:2015-07-01
Published:2015-07-22
Contact:
Yong-Gang CHEN
About author:# Co-first authors
CHEN Yong-Gang,TANG Meng-Ping,YANG Chun-Ju,MA Tian-Wu,WANG Li. Spatial analysis of competition in natural Phyllostachys edulis community[J]. Chin J Plan Ecolo, 2015, 39(7): 726-735.
Add to citation manager EndNote|Ris|BibTeX
URL: https://www.plant-ecology.com/EN/10.17521/cjpe.2015.0069
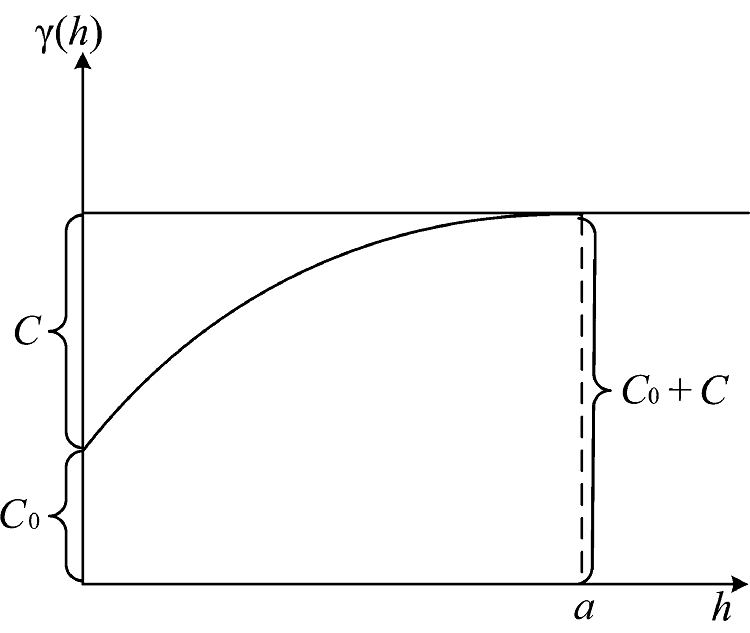
Fig. 1 The curve of semivariograms. γ(h), semivariance; a, range; c, sagitta; C0, nugget; C0 + C, sill; h, distance.
| 径级 Diameter class (cm) | 株数 Number | 百分比 Percentage (%) | 平均值 Average | 中位数 Median | 最大值 Maximum value | 最小值 Minimum value |
|---|---|---|---|---|---|---|
| 2-4 | 2 | 0.04 | 14.23 | 14.23 | 17.13 | 11.34 |
| 4-6 | 8 | 0.15 | 10.29 | 8.39 | 23.84 | 5.53 |
| 6-8 | 197 | 3.69 | 8.340 | 7.71 | 29.08 | 2.71 |
| 8-10 | 1 277 | 23.95 | 6.93 | 6.27 | 43.06 | 2.34 |
| 10-12 | 2 616 | 49.06 | 5.89 | 5.35 | 40.20 | 2.11 |
| 12-14 | 1 123 | 21.06 | 5.39 | 4.97 | 24.68 | 1.88 |
| 14-16 | 107 | 2.01 | 4.51 | 4.31 | 8.13 | 1.34 |
| 16-18 | 0 | 0 | 0 | 0 | 0 | 0 |
| 18-20 | 0 | 0 | 0 | 0 | 0 | 0 |
| 20-22 | 2 | 0.04 | 2.76 | 2.76 | 3.62 | 1.90 |
Table 1 The V_Hegyi competition index of natural Phyllostachys edulis
| 径级 Diameter class (cm) | 株数 Number | 百分比 Percentage (%) | 平均值 Average | 中位数 Median | 最大值 Maximum value | 最小值 Minimum value |
|---|---|---|---|---|---|---|
| 2-4 | 2 | 0.04 | 14.23 | 14.23 | 17.13 | 11.34 |
| 4-6 | 8 | 0.15 | 10.29 | 8.39 | 23.84 | 5.53 |
| 6-8 | 197 | 3.69 | 8.340 | 7.71 | 29.08 | 2.71 |
| 8-10 | 1 277 | 23.95 | 6.93 | 6.27 | 43.06 | 2.34 |
| 10-12 | 2 616 | 49.06 | 5.89 | 5.35 | 40.20 | 2.11 |
| 12-14 | 1 123 | 21.06 | 5.39 | 4.97 | 24.68 | 1.88 |
| 14-16 | 107 | 2.01 | 4.51 | 4.31 | 8.13 | 1.34 |
| 16-18 | 0 | 0 | 0 | 0 | 0 | 0 |
| 18-20 | 0 | 0 | 0 | 0 | 0 | 0 |
| 20-22 | 2 | 0.04 | 2.76 | 2.76 | 3.62 | 1.90 |
| 方法 Method | 参数 Parameter | 数值 Value |
|---|---|---|
| Getis-Ord General G | 指标值 Index value | 0.001 351 |
| 方差 Variance | 0.000 000 | |
| Z值 Z value | 51.894 764 | |
| 概率p Probability | 0.000 000 | |
| Moran’s I | 指标值 Index value | 0.332 195 |
| 方差 Variance | 0.000 041 | |
| Z值 Z value | 51.894 764 | |
| 概率p Probability | 0.000 000 |
Table 2 Spatial autocorrelation and significance test of V_Hegyi index of Phyllostachys edulis community
| 方法 Method | 参数 Parameter | 数值 Value |
|---|---|---|
| Getis-Ord General G | 指标值 Index value | 0.001 351 |
| 方差 Variance | 0.000 000 | |
| Z值 Z value | 51.894 764 | |
| 概率p Probability | 0.000 000 | |
| Moran’s I | 指标值 Index value | 0.332 195 |
| 方差 Variance | 0.000 041 | |
| Z值 Z value | 51.894 764 | |
| 概率p Probability | 0.000 000 |
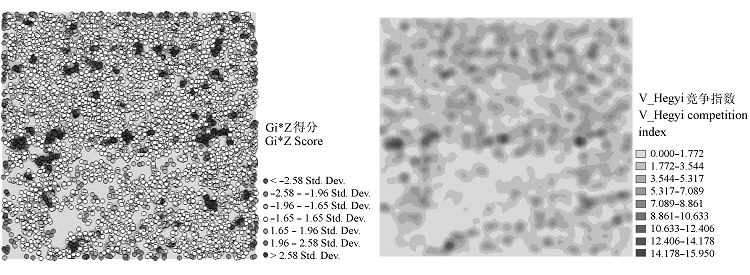
Fig. 2 Getis-Ord Gi* hot spot analysis (A) and Kernel density estimation (B) of V_Hegyi competition index.
| 竞争强度 Competition intensity | 株数 Plant number | 面积 Area (m2) | 密度 Density (ind.·m-2) |
|---|---|---|---|
| 低 Low | 1 117 | 4 218.909 | 0.265 |
| 中 Medium | 2 618 | 4 268.221 | 0.613 |
| 高 High | 1 681 | 1 512.870 | 1.111 |
Table 3 The spatial distribution density of natural Phyllostachys edulis community in various areas with different competition intensity
| 竞争强度 Competition intensity | 株数 Plant number | 面积 Area (m2) | 密度 Density (ind.·m-2) |
|---|---|---|---|
| 低 Low | 1 117 | 4 218.909 | 0.265 |
| 中 Medium | 2 618 | 4 268.221 | 0.613 |
| 高 High | 1 681 | 1 512.870 | 1.111 |
| 竞争强度 Competition intensity | 平均值 Average (a) | 对比 Comparison | t统计量 t statistic | 概率 Probability |
|---|---|---|---|---|
| 低 Low | 7.11 | 低-中 Low-medium | -3.88 | 0.000 |
| 中 Medium | 7.62 | 中-高 Medium-high | -0.95 | 0.341 |
| 高 High | 7.72 | 低-高 Low-high | -4.33 | 0.000 |
Table 4 The 2-samples t test of natural Phyllostachys edulis community age distribution in areas with different natural P. edulis competition intensities
| 竞争强度 Competition intensity | 平均值 Average (a) | 对比 Comparison | t统计量 t statistic | 概率 Probability |
|---|---|---|---|---|
| 低 Low | 7.11 | 低-中 Low-medium | -3.88 | 0.000 |
| 中 Medium | 7.62 | 中-高 Medium-high | -0.95 | 0.341 |
| 高 High | 7.72 | 低-高 Low-high | -4.33 | 0.000 |
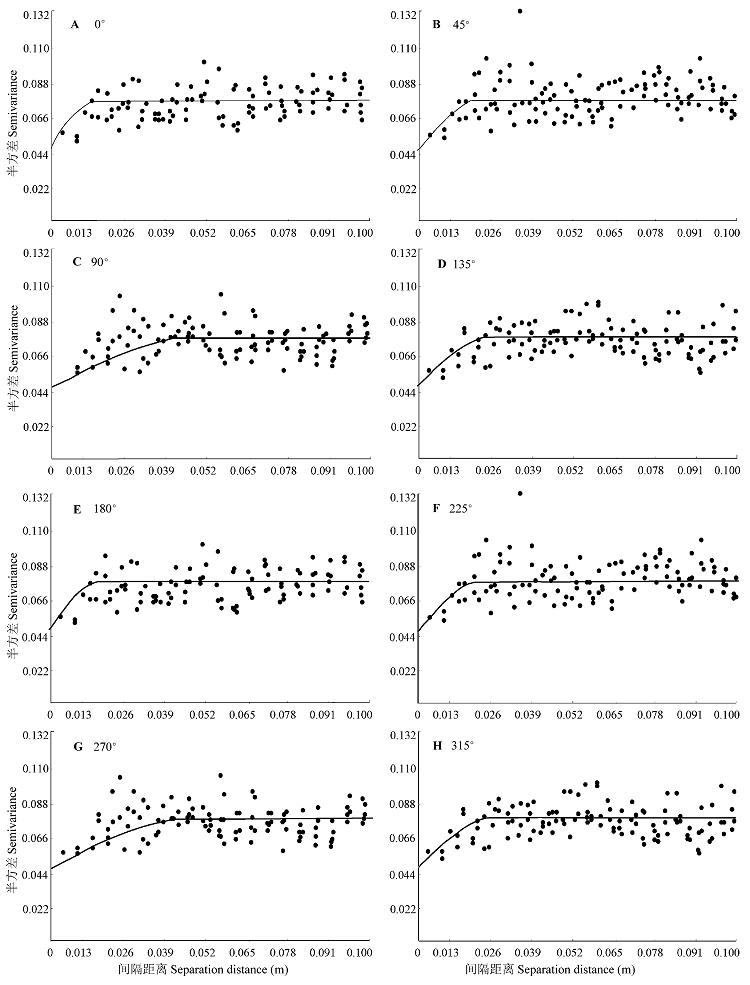
Fig. 3 Semivariogram diagram of anisotropy of natural Phyllostachys edulis competition.
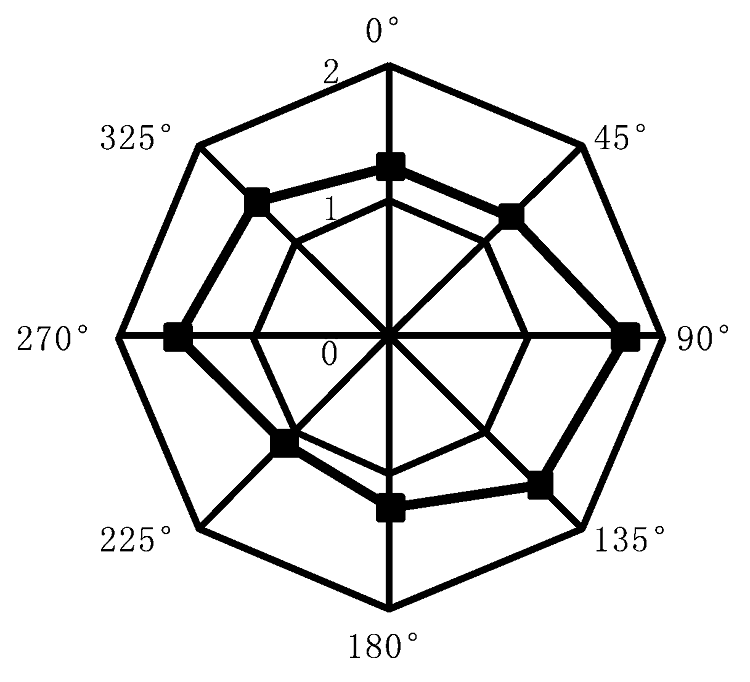
Fig. 4 The wind rose diagram of V_Hegyi index.
Fig. 5 The relationship between natural Phyllostachys edulis’s competition intensity and its aspect.
| [1] | Afforestation Department of Forestry Department of Jiangxi Province (1992). Bamboo Cultivation. China Agricultural Science and Technology Publishing House, Beijing. 97-129. |
| (in Chinese) [江西省林业厅造林处 (1992). 毛竹栽培. 中国农业科技出版社, 北京. 97-129.] | |
| [2] | Baldocchi D, Falge E, Gu L, Olson R, Hollinger D, Running S, Anthoni P, Bernhofer C, Davis K, Evans R, Fuentes J, Goldstein A, Katul G, Law B, Lee X, Malhi Y, Meyers T, Munger W, Oechel W, Paw UKT, Pilegaard K, Schmid HP, Valentini R, Verma S, Vesala T, Wilson K, Wofsyn S (2001). Fluxnet: A new tool to study the temporal and spatial variability of ecosystem-scale carbon dioxide, water vapor, and energy flux densities. Bulletin of the American Meteorological Society, 82, 2415-2434. |
| [3] | Beatty SW (1984). Influence of microtopography and canopy species on spatial patterns of forest understory plants.Ecology, 65, 1406-1419. |
| [4] | Béland M, Lussier J-M, Bergeron Y, Longpré M-H, Béland M (2003). Structure, spatial distribution and competition in mixed jack pine (Pinus banksiana) stands on clay soils of eastern Canada.Annals of Forest Science, 60, 609-617. |
| [5] | Berger U, Piou C, Schiffers K, Grimm V (2008). Competition among plants: Concepts, individual-based modeling approaches, and a proposal for a future research strategy.Perspectives in Plant Ecology, Evolution and Systematics, 9, 121-135. |
| [6] | Cao ZD, Wang JF, Gao YG, Han WG, Feng XL, Zeng G (2008). Risk factors and autocorrelation characteristics on severe a cute respiratory syndrome in Guangzhou.Acta Geographica Sinica, 63, 981-993. |
| (in Chinese with English abstract) [曹志冬, 王劲峰, 高一鸽, 韩卫国, 冯晓磊, 曾光 (2008). 广州SARS流行的空间风险因子与空间相关性特征. 地理学报, 63, 981-993.] | |
| [7] | Chen XF (1996). Cultivation and Utilization of Bamboo. China Forestry Publishing House, Beijing. |
| (in Chinese) [陈兴福 (1996). 毛竹培育与利用. 中国林业出版社, 北京.] | |
| [8] | Croner CM, Sperling J, Broome FR (1996). Geographic information systems (GIS): New perspectives in understanding human health and environmental relationships.Statistics of Medicine, 15, 1961-1977. |
| [9] | Ebdon D (1988). Statistics in Geography. 2nd edn. Blackwell Publishers, Oxford. |
| [10] | Gause GF (1934). Experimental analysis of Vito Volterra’s mathematical theory of the struggle for existence.Science, 79, 16-17. |
| [11] | Gong JZ, Xia BC, Li N (2006). Characteristics of scale and hierachical structure of landscape system under different heterogeneities of land cover patterns in Guangzhou City.Acta Geographica Sinica, 61, 873-881. |
| (in Chinese with English abstract) [龚建周, 夏北成, 李楠 (2006). 广州市土地覆被格局异质性的尺度与等级特征. 地理学报, 61, 873-881.] | |
| [12] | Guo F, Zhao XZ, Yin MF, Huang JR, Liu Q, Li J (2008). Application of nonparametric kernel density estimation to re search in to diameter distribution of broadleaved Pinus koraiensis natural stand.Journal of Henan Agricultural University, 42, 303-305, 312. |
| (in Chinese with English abstract) [郭芳, 赵新振, 殷鸣放, 黄家荣, 刘倩, 李娟 (2008). 非参数核密度估计在阔叶红松天然林直径分布研究中的应用. 河南农业大学学报, 42, 303-305, 312.] | |
| [13] | Haase P (1995). Spatial pattern analysis in ecology based on Ripley’s K-function: Introduction and methods of edge correction.Journal of Vegetation Science, 6, 575-582. |
| [14] | Hegyi F (1974). A simulation model for managing jack-pine stands. In: Royal College of Forestry ed. Growth Models for Tree and Stand Simulation. Royal College of Forestry, Stockholm, Sweden. 74-90. |
| [15] | Hodder I, Orton C (1976). Spatial Analysis in Archaeology. Cambridge University Press, Cambridge, UK. |
| [16] | Jerrett M, Burnett RT, Ma R, Pope CA III, Krewsk D, Newbold KB, Thurston G, Shi Y, Finkelstein N, Calle EE, Thun MJ (2005). Spatial analysis of air pollution and mortality in Los Angeles.Epidemiology, 16, 727-736. |
| [17] | Jin JX, Jiang H, Peng W, Zhang LJ, Lu XH, Xu JH, Zhang XY, Wang Y (2013). Evaluating the impact of soil factors on the potential distribution of Phyllostachys edulis (bamboo) in China based on the species distribution model.Chinese Journal of Plant Ecology, 37, 631-640. |
| (in Chinese with English abstract) [金佳鑫, 江洪, 彭威, 张林静, 卢学鹤, 徐建辉, 张秀英, 王颖 (2013). 基于物种分布模型评价土壤因子对我国毛竹潜在分布的影响. 植物生态学报, 37, 631-640.] | |
| [18] | Klausmeier CA, Tilman D (2002). Spatial models of competition.Ecological Studies, 71, 14-15. |
| [19] | Li SF, Liu WD, Su JR, Lang XD, Zhang ZJ (2013). Intra- and interspecific competitions of Taxus yunnanensis population in Jinsha River Basin of northwest Yunnan Province, Southwest China.Chinese Journal of Ecology, 32, 33-38. |
| (in Chinese with English abstract) [李帅锋, 刘万德, 苏建荣, 郎学东, 张志钧 (2013). 滇西北金沙江流域云南红豆杉群落种内与种间竞争. 生态学杂志, 32, 33-38.] | |
| [20] | Li XY, Zhang SW, Wang ZM, Zhang HL (2004). Spatial variability and pattern analysis of soil properties in Dehui city of Jilin Province.Acta Geographica Sinica, 59, 989-997. |
| (in Chinese with English abstract) [李晓燕, 张树文, 王宗明, 张惠琳 (2004). 吉林省德惠市土壤特性空间变异特征与格局. 地理学报, 59, 989-997.] | |
| [21] | Li ZS (2012). Bamboo planting and management technology.Forest By-Product and Speciality in China, (4), 56-57. |
| (in Chinese) [李志生 (2012). 毛竹种植与管理技术. 中国林副特产, (4), 56-57.] | |
| [22] | Liang FB, Zhang HR (2009). Kernel estimation of clustering center points. Journal of Fuzhou University (Natural Science Edition), 37, 332-325. |
| (in Chinese with English abstract) [梁飞豹, 张惠榕 (2009). 一种集聚中心的核估计法. 福州大学学报(自然科学版), 37, 332-325.] | |
| [23] | Liao JB, Li ZQ, Quets JJ, Nijs I (2013). Effects of space partitioning in a plant species diversity model.Ecological Modelling, 251, 271-278. |
| [24] | Liu T, Li YL, Zhou ZQ, Hu HQ (2007). Intraspecific and interspecific competition of Japanese yew (Taxus cuspidata).Acta Ecologica Sinica, 27, 924-929. |
| (in Chinese with English abstract) [刘彤, 李云灵, 周志强, 胡海清 (2007). 天然东北红豆杉(Taxus cuspidata)种内和种间竞争. 生态学报, 27, 924-929.] | |
| [25] | Lü AM, Li CM, Lin ZJ, Shi WZ (2003). Spatial continuous surface model of population density.Acta Geodaetica et Cartographica Sinica, 32, 344-348. |
| (in Chinese with English abstract) [吕安民, 李成名, 林宗坚, 史文中 (2003). 人口密度的空间连续分布模型. 测绘学报, 32, 344-348.] | |
| [26] | Mei ZX (2008). Spatial heterogeneity analysis of houses’ prices based on semi-variogram: Taking dongguan city asa case. Journal of South China Normal University (Natural Science Edition), (4), 123-128. |
| (in Chinese with English abstract) [梅志雄 (2008). 基于半变异函数的住宅价格空间异质性分析——以东莞市为例. 华南师范大学学报(自然科学版), (4), 123-128.] | |
| [27] | Meng B, Wang JF, Zhang WZ, Liu XH (2005). Evaluation of regional disparity in China based on spatial analysis.Scientia Geographica Sinica, 25, 393-400. |
| (in Chinese with English abstract) [孟斌, 王劲峰, 张文忠, 刘旭华 (2005). 基于空间分析方法的中国区域差异研究. 地理科学, 25, 393-400.] | |
| [28] | Mitchell A (2005). The ESRI Guide to GIS Analysis, Volume 2. ESRI Press. |
| [29] | Pan WB, Deng HB, Tang T, Cai QH (2003). Application of geostatistical analysis in study of macrophytes community’s pattern.Chinese Journal of Applied Ecology, 14, 1692-1696. |
| (in Chinese with English abstract) [潘文斌, 邓红兵, 唐涛, 蔡庆华 (2003). 地统计学在水生植物群落格局研究中的应用. 应用生态学报, 14, 1692-1696.] | |
| [30] | Purves DW, Law R (2002). Fine-scale spatial structure in a grassland community: Quantifying the plant’s-eye view.Journal of Ecology, 90, 121-129. |
| [31] | Rivas JJC, González JGÁ, Aguirre O, Hernandez FJ (2005). The effect of competition on individual tree basal area growth in mature stands of Pinus cooperi Blanco in Durango (Mexico).European Journal of Forest Research, 124, 133-142. |
| [32] | Shi PJ, Guo SQ, Yang QP, Wang B, Yang GY, Fang K (2010). Inhomogeneous spatial point pattern analysis of moso bamboo (Phyllostachys edulis).Acta Ecologica Sinica, 30, 4401-4407. |
| (in Chinese with English abstract) [时培建, 郭世权, 杨清培, 王兵, 杨光耀, 方楷 (2010). 毛竹的异质性空间点格局分析. 生态学报, 30, 4401-4407.] | |
| [33] | Snow J (1855). On the Mode of Communication of Cholera. John Churchill, New Burlington Street, London. |
| [34] | Song XZ, Zhou GM, Jiang H, Yu SQ, Fu JH, Li WZ, Wang WF, Ma ZH, Peng CH (2011). Carbon sequestration by Chinese bamboo forests and their ecological benefits: Assessment of potential, problems, and future challenges.Environmental Reviews, 19, 418-428. |
| [35] | Tang MP, Chen YG, Shi YJ, Zhou GM, Zhao MS (2007). Intraspecific and interspecific competition analysis of community dominant plant populations based on Voronoi diagram.Aata Ecologica Sinica, 27, 4707-4716. |
| (in Chinese with English abstract) [汤孟平, 陈永刚, 施拥军, 周国模, 赵明水 (2007). 基于Voronoi图的群落优势树种种内种间竞争. 生态学报, 27, 4707-4716.] | |
| [36] | Tang MP, Xu WB, Chen YG, Deng YY, Zhao MS (2011). Relationship between spatial structure and biomass of a close-to-nature Phyllostachys edulis stand in Tianmu mountain.Scientla Silvae Sinicae, 47(8), 1-6. |
| (in Chinese with English abstract) [汤孟平, 徐文兵, 陈永刚, 邓英英, 赵明水 (2011). 天目山近自然毛竹林空间结构与生物量的关系. 林业科学, 47(8), 1-6.] | |
| [37] | Wang J, Fu BJ, Qiu Y, Chen LD (2000). Spatiotemporal variability of soil moisture in small catchment on Loess plateau—semivariograms.Acta Geographica Sinica, 55, 428-438. |
| (in Chinese with English abstract) [王军, 傅伯杰, 邱扬, 陈利顶 (2000). 黄土丘陵小流域土壤水分的时空变异特征——半变异函数. 地理学报, 55, 428-438.] | |
| [38] | Wang XC, Han SJ, Zou CJ, Zhou XF (2002). Geostatistical analysis of the pattern of Betula ermanii population in Changbai Mountain.Chinese Journal of Applied Ecology, 13, 781-784. |
| (in Chinese with English abstract) [王晓春, 韩士杰, 邹春静, 周晓峰 (2002). 长白山岳桦种群格局的地统计学分析. 应用生态学报, 13, 781-784.] | |
| [39] | Wang ZQ, Wu GS, Wang JB (2000). Application of competition index in assessing intraspecific and interspecific spatial relations between manchurian ash and dahurian larch.Chinese Journal of Applied Ecology, 11, 641-645. |
| (in Chinese with English abstract) [王政权, 吴巩胜, 王军邦 (2000). 利用竞争指数评价水曲柳落叶松种内种间空间竞争关系. 应用生态学报, 11, 641-645.] | |
| [40] | Wear DN, Bolstad P (1998). Land-use changes in southern Appalachian landscapes: Spatial analysis and forecast evaluation.Ecosystems, 1, 575-594. |
| [41] | Wong DWS, Lee J (2005). Statistical Analysis of Geographic Information with ArcView GIS and ArcGIS. John Wiley & Sons, Hoboken, USA. |
| [42] | Xiang XY, Wu GL, Duan RY, Yan YM, Zhang XP (2015). Intraspecific and interspecific competition of Pinus dabeshanesis.Acta Ecologica Sinica, 35, 389-395. |
| (in Chinese with English abstract) [项小燕, 吴甘霖, 段仁燕, 闫玉梅, 张小平 (2015). 大别山五针松种内和种间竞争强度. 生态学报, 35, 389-395.] | |
| [43] | Zhang C, Huang ZL, Li J, Shi JH, Li L (2006). Quantitative relationships of intra- and interspecific competition in Cryptocarya concinna.Chinese Journal of Applied Ecology, 17, 22-26. |
| (in Chinese with English abstract) [张池, 黄忠良, 李炯, 史军辉, 李林 (2006). 黄果厚壳桂种内与种间竞争的数量关系. 应用生态学报, 17, 22-26.] | |
| [44] | Zhao CY, Li JP, Li JJ (2010). Quantitative analysis of forest stand spatial structure based on Voronoi diagram & delaunay triangulated network.Scientia Silvae Sinicae, 46(6), 78-84. |
| (in Chinese with English abstract) [赵春燕, 李际平, 李建军 (2010). 基于Voronoi图和Delaunay三角网的林分空间结构量化分析. 林业科学, 46(6), 78-84.] | |
| [45] | Zheng LY, Meng LD, Xiong DL, Chen WW, Ge WQ (2012). Study on the impact of Phyllostachys heterocycla (Carr.) Lehaie growth in different slope and soil thickness. Hubei Forestry Science and Technology, (1), 1-2, 64. |
| (in Chinese with English abstract) [郑兰英, 孟翎冬, 熊德礼, 陈文武, 葛武清 (2012). 不同坡度和土层厚度对毛竹生长量的影响研究. 湖北林业科技, (1), 1-2, 64.] | |
| [46] | Zhou J, Guo QX (2007). Geostatistical analysis on spatial pattern of competition index.Journal of North East Forestry University, 35(9), 42-44. |
| (in Chinese with English abstract) [周隽, 国庆喜 (2007). 林木竞争指数空间格局的地统计学分析. 东北林业大学学报, 35(9), 42-44.] | |
| [47] | Zou CJ, Han SJ, Zhang JH (2001). Competition relationship among tree species in broad-leaved korean pine mixed forest and its significance for managing the forest.Chinese Journal of Ecology, 20(4), 35-38. |
| (in Chinese with English abstract) [邹春静, 韩士杰, 张军辉 (2001). 阔叶红松林树种间竞争关系及其营林意义. 生态学杂志, 20(4), 35-38.] |
| Viewed | ||||||
|
Full text |
|
|||||
|
Abstract |
|
|||||
Copyright © 2026 Chinese Journal of Plant Ecology
Tel: 010-62836134, 62836138, E-mail: apes@ibcas.ac.cn, cjpe@ibcas.ac.cn
![]()