
Chin J Plant Ecol ›› 2013, Vol. 37 ›› Issue (1): 26-36.DOI: 10.3724/SP.J.1258.2013.00003
Special Issue: 生物多样性
• Review • Previous Articles Next Articles
XU Han1,2, LI Yi-De2,*( ), LUO Tu-Shou2, CHEN De-Xiang2, LIN Ming-Xian2
Received:2012-05-14
Accepted:2012-12-14
Online:2013-05-14
Published:2013-01-15
Contact:
LI Yi-De
XU Han, LI Yi-De, LUO Tu-Shou, CHEN De-Xiang, LIN Ming-Xian. Environmental factors correlated with species diversity in different tropical rain forest types in Jianfengling, Hainan Island, China[J]. Chin J Plant Ecol, 2013, 37(1): 26-36.
Add to citation manager EndNote|Ris|BibTeX
URL: https://www.plant-ecology.com/EN/10.3724/SP.J.1258.2013.00003
| 环境因子 Environmental factor | 海拔 Elevation | 坡度 Slope degree | 坡向 Slope aspect | 坡位 Slope position | 土壤有机 碳含量 Soil organic carbon content | 土壤全氮含量 Soil total nitrogen content | 土壤全磷含量 Soil total phosphorus content | 土壤全钾 含量 Soil total potassium content | 土壤交换性钙含量 Soil exchangeable calcium content | 土壤交换性镁含量 Soil exchangeable magnesium content | 土壤速效钾含量 Soil available potassium content | 土壤碱解氮含量 Soil alkali dispelled nitrogen content | 土壤速效磷含量 Soil available phosphorus content | 土壤 密度 Soil density | 土壤最大持水量 Soil maximum water holding content | 土壤毛细管持水量 Soil capillary water holding content | 土壤毛管孔 隙度 Soil capillary porosity |
|---|---|---|---|---|---|---|---|---|---|---|---|---|---|---|---|---|---|
| 海拔 Elevation | - | ||||||||||||||||
| 坡度 Slope degree | 0.006 | ||||||||||||||||
| 坡向 Slope aspect | -0.002 | -0.298** | |||||||||||||||
| 坡位 Slope position | 0.009 | -0.190* | 0.146 | ||||||||||||||
| 土壤有机碳含量 Soil organic carbon content | 0.352** | -0.011 | 0.019 | -0.109 | |||||||||||||
| 土壤全氮含量 Soil total nitrogen content | 0.366** | 0.070 | 0.079 | -0.013 | 0.775** | ||||||||||||
| 土壤全磷含量 Soil total phosphorus content | 0.079 | 0.029 | 0.123 | 0.138 | 0.276** | 0.452** | |||||||||||
| 土壤全钾含量 Soil total potassium content | -0.230** | 0.309** | -0.098 | -0.029 | -0.144 | -0.031 | 0.104 | ||||||||||
| 土壤交换性钙含量 Soil exchangeable calcium content | -0.126 | 0.037 | 0.017 | 0.097 | 0.069 | 0.157* | 0.718** | 0.130 | |||||||||
| 土壤交换性镁含量 Soil exchangeable magnesium content | -0.238** | 0.072 | -0.010 | 0.055 | 0.037 | 0.130 | 0.691** | 0.242** | 0.932** | ||||||||
| 土壤速效钾含量 Soil available potassium content | -0.409** | 0.216** | -0.171* | -0.070 | -0.155* | -0.127 | -0.041 | 0.620** | 0.131 | 0.307** | |||||||
| 土壤碱解氮含量 Soil alkali dispelled nitrogen content | 0.471** | -0.034 | 0.131 | -0.018 | 0.521** | 0.667** | 0.444** | -0.109 | 0.074 | 0.017 | -0.180* | ||||||
| 土壤速效磷含量 Soil available phosphorus content | -0.204** | 0.083 | 0.032 | 0.098 | 0.134 | 0.247** | 0.587** | 0.306** | 0.480** | 0.498** | 0.136 | 0.172* | |||||
| 土壤密度 Soil density | -0.759** | 0.071 | -0.033 | 0.062 | -0.345** | -0.371** | -0.186* | 0.327** | 0.045 | 0.168* | 0.403** | -0.597** | 0.171* | ||||
| 土壤最大持水量 Soil maximum water holding content | 0.570** | -0.109 | 0.138 | -0.019 | 0.142 | 0.261** | 0.202** | -0.239** | 0.065 | -0.032 | -0.280** | 0.431** | -0.175* | -0.691** | |||
| 土壤毛细管持水量 Soil capillary water holding content | 0.497** | -0.169* | 0.173* | 0.029 | 0.107 | 0.161* | 0.098 | -0.304** | 0.064 | -0.058 | -0.396** | 0.198* | -0.304** | -0.403** | 0.743** | ||
| 土壤毛管孔隙度 Soil capillary porosity | 0.499** | -0.167* | 0.173* | 0.026 | 0.109 | 0.161* | 0.097 | -0.304** | 0.062 | -0.060 | -0.395** | 0.200* | -0.306** | -0.405** | 0.743** | 1.000** | - |
Table 1 Cross-products matrix contains correlation coefficients among 17 environmental factors
| 环境因子 Environmental factor | 海拔 Elevation | 坡度 Slope degree | 坡向 Slope aspect | 坡位 Slope position | 土壤有机 碳含量 Soil organic carbon content | 土壤全氮含量 Soil total nitrogen content | 土壤全磷含量 Soil total phosphorus content | 土壤全钾 含量 Soil total potassium content | 土壤交换性钙含量 Soil exchangeable calcium content | 土壤交换性镁含量 Soil exchangeable magnesium content | 土壤速效钾含量 Soil available potassium content | 土壤碱解氮含量 Soil alkali dispelled nitrogen content | 土壤速效磷含量 Soil available phosphorus content | 土壤 密度 Soil density | 土壤最大持水量 Soil maximum water holding content | 土壤毛细管持水量 Soil capillary water holding content | 土壤毛管孔 隙度 Soil capillary porosity |
|---|---|---|---|---|---|---|---|---|---|---|---|---|---|---|---|---|---|
| 海拔 Elevation | - | ||||||||||||||||
| 坡度 Slope degree | 0.006 | ||||||||||||||||
| 坡向 Slope aspect | -0.002 | -0.298** | |||||||||||||||
| 坡位 Slope position | 0.009 | -0.190* | 0.146 | ||||||||||||||
| 土壤有机碳含量 Soil organic carbon content | 0.352** | -0.011 | 0.019 | -0.109 | |||||||||||||
| 土壤全氮含量 Soil total nitrogen content | 0.366** | 0.070 | 0.079 | -0.013 | 0.775** | ||||||||||||
| 土壤全磷含量 Soil total phosphorus content | 0.079 | 0.029 | 0.123 | 0.138 | 0.276** | 0.452** | |||||||||||
| 土壤全钾含量 Soil total potassium content | -0.230** | 0.309** | -0.098 | -0.029 | -0.144 | -0.031 | 0.104 | ||||||||||
| 土壤交换性钙含量 Soil exchangeable calcium content | -0.126 | 0.037 | 0.017 | 0.097 | 0.069 | 0.157* | 0.718** | 0.130 | |||||||||
| 土壤交换性镁含量 Soil exchangeable magnesium content | -0.238** | 0.072 | -0.010 | 0.055 | 0.037 | 0.130 | 0.691** | 0.242** | 0.932** | ||||||||
| 土壤速效钾含量 Soil available potassium content | -0.409** | 0.216** | -0.171* | -0.070 | -0.155* | -0.127 | -0.041 | 0.620** | 0.131 | 0.307** | |||||||
| 土壤碱解氮含量 Soil alkali dispelled nitrogen content | 0.471** | -0.034 | 0.131 | -0.018 | 0.521** | 0.667** | 0.444** | -0.109 | 0.074 | 0.017 | -0.180* | ||||||
| 土壤速效磷含量 Soil available phosphorus content | -0.204** | 0.083 | 0.032 | 0.098 | 0.134 | 0.247** | 0.587** | 0.306** | 0.480** | 0.498** | 0.136 | 0.172* | |||||
| 土壤密度 Soil density | -0.759** | 0.071 | -0.033 | 0.062 | -0.345** | -0.371** | -0.186* | 0.327** | 0.045 | 0.168* | 0.403** | -0.597** | 0.171* | ||||
| 土壤最大持水量 Soil maximum water holding content | 0.570** | -0.109 | 0.138 | -0.019 | 0.142 | 0.261** | 0.202** | -0.239** | 0.065 | -0.032 | -0.280** | 0.431** | -0.175* | -0.691** | |||
| 土壤毛细管持水量 Soil capillary water holding content | 0.497** | -0.169* | 0.173* | 0.029 | 0.107 | 0.161* | 0.098 | -0.304** | 0.064 | -0.058 | -0.396** | 0.198* | -0.304** | -0.403** | 0.743** | ||
| 土壤毛管孔隙度 Soil capillary porosity | 0.499** | -0.167* | 0.173* | 0.026 | 0.109 | 0.161* | 0.097 | -0.304** | 0.062 | -0.060 | -0.395** | 0.200* | -0.306** | -0.405** | 0.743** | 1.000** | - |
| 环境因子 Environmental factor | 原始林 Old-growth forest | 径级择伐后恢复森林 Recovered forest after diameter-limit logging | 皆伐后恢复森林 Recovered forest after clear-cutting | ||||||||
|---|---|---|---|---|---|---|---|---|---|---|---|
| 第1轴 Axis 1 | 第2轴 Axis 2 | 第3轴Axis 3 | 第1轴 Axis 1 | 第2轴 Axis 2 | 第3轴Axis 3 | 第1轴 Axis 1 | 第2轴 Axis 2 | 第3轴 Axis 3 | |||
| 海拔 Elevation | 0.01 | -0.18 | 0.31 | -0.03 | 0.36 | 0.15 | 0.11 | -0.32 | -0.07 | ||
| 坡度 Slope degree | -0.14 | 0.12 | -0.39 | 0.03 | -0.03 | 0.04 | -0.04 | -0.02 | 0.42 | ||
| 坡向 Slope aspect | -0.01 | -0.09 | -0.53 | 0.10 | -0.21 | -0.63 | -0.09 | -0.12 | 0.38 | ||
| 坡位 Slope position | 0.34 | -0.83 | -0.11 | -0.09 | 0.87 | 0.08 | -0.60 | -0.51 | 0.24 | ||
| 土壤有机碳含量 Soil organic carbon content | 0.11 | -0.54 | 0.11 | 0.07 | 0.14 | 0.26 | -0.05 | 0.54 | -0.18 | ||
| 土壤全氮含量 Soil total nitrogen content | -0.07 | -0.57 | -0.11 | 0.10 | 0.31 | 0.07 | -0.21 | -0.02 | 0.28 | ||
| 土壤全磷含量 Soil total phosphorus content | -0.26 | -0.10 | -0.54 | 0.79 | 0.12 | -0.33 | 0.08 | 0.09 | 0.76 | ||
| 土壤全钾含量 Soil total potassium content | -0.27 | 0.11 | -0.25 | 0.01 | -0.23 | -0.50 | 0.10 | -0.33 | 0.14 | ||
| 土壤交换性钙含量 Soil exchangeable calcium content | -0.91 | -0.13 | -0.08 | 0.97 | 0.04 | -0.11 | 0.13 | 0.14 | -0.42 | ||
| 土壤交换性镁含量 Soil exchangeable magnesium content | -0.51 | 0.23 | -0.24 | 0.92 | -0.04 | -0.17 | 0.32 | 0.37 | -0.33 | ||
| 土壤速效钾含量 Soil available potassium content | -0.15 | 0.26 | -0.23 | -0.04 | -0.14 | -0.43 | 0.20 | 0.23 | -0.45 | ||
| 土壤碱解氮含量 Soil alkali dispelled nitrogen content | 0.04 | -0.61 | -0.21 | 0.09 | 0.53 | 0.05 | -0.46 | -0.19 | 0.55 | ||
| 土壤速效磷含量 Soil available phosphorus content | -0.34 | 0.29 | -0.31 | 0.60 | -0.27 | -0.14 | 0.81 | -0.13 | 0.47 | ||
| 土壤密度 Soil density | -0.29 | 0.65 | 0.23 | -0.04 | -0.63 | -0.18 | 0.59 | 0.26 | -0.49 | ||
| 土壤最大持水量 Soil maximum water holding content | 0.17 | -0.56 | -0.38 | 0.11 | 0.68 | 0.05 | -0.35 | -0.52 | 0.37 | ||
| 土壤毛细管持水量 Soil capillary water holding content | 0.15 | -0.65 | -0.03 | 0.14 | 0.51 | 0.15 | -0.25 | -0.60 | 0.20 | ||
| 土壤毛管孔隙度 Soil capillary porosity | 0.15 | -0.65 | -0.03 | 0.13 | 0.51 | 0.15 | -0.26 | -0.60 | 0.20 | ||
Table 2 Correlations between 17 environmental factors and the first, second, third ordination axes on canonical correspondence analysis for three forest types
| 环境因子 Environmental factor | 原始林 Old-growth forest | 径级择伐后恢复森林 Recovered forest after diameter-limit logging | 皆伐后恢复森林 Recovered forest after clear-cutting | ||||||||
|---|---|---|---|---|---|---|---|---|---|---|---|
| 第1轴 Axis 1 | 第2轴 Axis 2 | 第3轴Axis 3 | 第1轴 Axis 1 | 第2轴 Axis 2 | 第3轴Axis 3 | 第1轴 Axis 1 | 第2轴 Axis 2 | 第3轴 Axis 3 | |||
| 海拔 Elevation | 0.01 | -0.18 | 0.31 | -0.03 | 0.36 | 0.15 | 0.11 | -0.32 | -0.07 | ||
| 坡度 Slope degree | -0.14 | 0.12 | -0.39 | 0.03 | -0.03 | 0.04 | -0.04 | -0.02 | 0.42 | ||
| 坡向 Slope aspect | -0.01 | -0.09 | -0.53 | 0.10 | -0.21 | -0.63 | -0.09 | -0.12 | 0.38 | ||
| 坡位 Slope position | 0.34 | -0.83 | -0.11 | -0.09 | 0.87 | 0.08 | -0.60 | -0.51 | 0.24 | ||
| 土壤有机碳含量 Soil organic carbon content | 0.11 | -0.54 | 0.11 | 0.07 | 0.14 | 0.26 | -0.05 | 0.54 | -0.18 | ||
| 土壤全氮含量 Soil total nitrogen content | -0.07 | -0.57 | -0.11 | 0.10 | 0.31 | 0.07 | -0.21 | -0.02 | 0.28 | ||
| 土壤全磷含量 Soil total phosphorus content | -0.26 | -0.10 | -0.54 | 0.79 | 0.12 | -0.33 | 0.08 | 0.09 | 0.76 | ||
| 土壤全钾含量 Soil total potassium content | -0.27 | 0.11 | -0.25 | 0.01 | -0.23 | -0.50 | 0.10 | -0.33 | 0.14 | ||
| 土壤交换性钙含量 Soil exchangeable calcium content | -0.91 | -0.13 | -0.08 | 0.97 | 0.04 | -0.11 | 0.13 | 0.14 | -0.42 | ||
| 土壤交换性镁含量 Soil exchangeable magnesium content | -0.51 | 0.23 | -0.24 | 0.92 | -0.04 | -0.17 | 0.32 | 0.37 | -0.33 | ||
| 土壤速效钾含量 Soil available potassium content | -0.15 | 0.26 | -0.23 | -0.04 | -0.14 | -0.43 | 0.20 | 0.23 | -0.45 | ||
| 土壤碱解氮含量 Soil alkali dispelled nitrogen content | 0.04 | -0.61 | -0.21 | 0.09 | 0.53 | 0.05 | -0.46 | -0.19 | 0.55 | ||
| 土壤速效磷含量 Soil available phosphorus content | -0.34 | 0.29 | -0.31 | 0.60 | -0.27 | -0.14 | 0.81 | -0.13 | 0.47 | ||
| 土壤密度 Soil density | -0.29 | 0.65 | 0.23 | -0.04 | -0.63 | -0.18 | 0.59 | 0.26 | -0.49 | ||
| 土壤最大持水量 Soil maximum water holding content | 0.17 | -0.56 | -0.38 | 0.11 | 0.68 | 0.05 | -0.35 | -0.52 | 0.37 | ||
| 土壤毛细管持水量 Soil capillary water holding content | 0.15 | -0.65 | -0.03 | 0.14 | 0.51 | 0.15 | -0.25 | -0.60 | 0.20 | ||
| 土壤毛管孔隙度 Soil capillary porosity | 0.15 | -0.65 | -0.03 | 0.13 | 0.51 | 0.15 | -0.26 | -0.60 | 0.20 | ||
| 环境因子 Environmental factor | 普通最小二乘法模型 Ordinary least-squares model | 联立空间自相关模型 Spatial simultaneous autoregressive error model | |||||
|---|---|---|---|---|---|---|---|
| 估计值±标准误差 Estimated value ± SE | t值 t-value | 显著性检验Pr(>|t|) | 估计值±标准误差 Estimated value ± SE | t值 t-value | 显著性检验 Pr(>|t|) | ||
| 截距 Intercept | 50.838 ± 6.561 | 7.749 | <0.001 | 51.120 ± 6.277 | 8.144 | <0.001 | |
| 海拔 Elevation | 0.037 ± 0.007 | 5.021 | <0.001 | 0.037 ± 0.007 | 5.206 | <0.001 | |
| 土壤交换性钙 Soil exchangeable calcium content | -12.629 ± 3.537 | -3.570 | <0.001 | -12.779 ± 3.414 | -3.743 | <0.001 | |
Table 3 Coefficients of the multiple regression and associated t-tests for species richness regressed against 17 environmental factors of the old-growth forests
| 环境因子 Environmental factor | 普通最小二乘法模型 Ordinary least-squares model | 联立空间自相关模型 Spatial simultaneous autoregressive error model | |||||
|---|---|---|---|---|---|---|---|
| 估计值±标准误差 Estimated value ± SE | t值 t-value | 显著性检验Pr(>|t|) | 估计值±标准误差 Estimated value ± SE | t值 t-value | 显著性检验 Pr(>|t|) | ||
| 截距 Intercept | 50.838 ± 6.561 | 7.749 | <0.001 | 51.120 ± 6.277 | 8.144 | <0.001 | |
| 海拔 Elevation | 0.037 ± 0.007 | 5.021 | <0.001 | 0.037 ± 0.007 | 5.206 | <0.001 | |
| 土壤交换性钙 Soil exchangeable calcium content | -12.629 ± 3.537 | -3.570 | <0.001 | -12.779 ± 3.414 | -3.743 | <0.001 | |
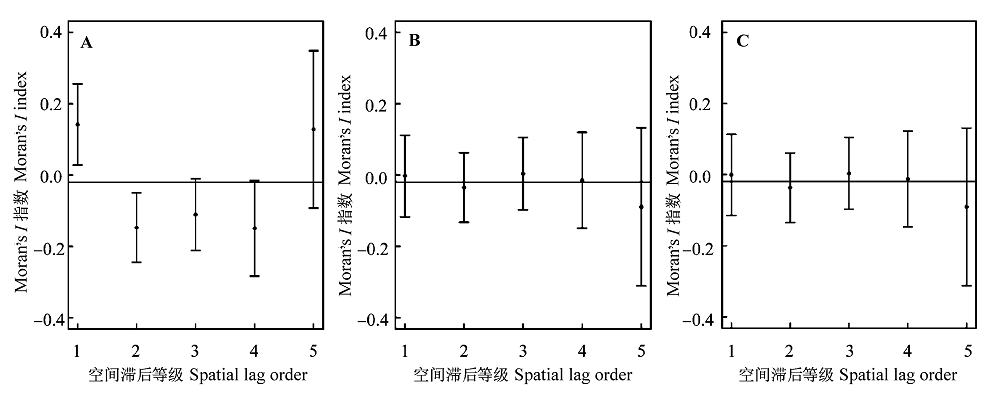
Fig. 1 Assessing model adequacy by testing the autocorrelation in residuals of the models of the old-growth forests. A, Original data. B, Residuals of ordinary least-squares model. C, Residuals of spatial simultaneous autoregressive error model.
| 环境因子 Environmental factor | 普通最小二乘法模型 Ordinary least-squares model | 联立空间自相关模型 Spatial simultaneous autoregressive error model | |||||
|---|---|---|---|---|---|---|---|
| 估计值±标准误差 Estimated value ± SE | t值 t-value | 显著性检验 Pr(>|t|) | 估计值±标准误差 Estimated value ± SE | t值 t-value | 显著性检验 Pr(>|t|) | ||
| 截距 Intercept | 84.918 ± 8.199 | 10.357 | <0.001 | 81.388 ± 8.887 | 9.158 | <0.001 | |
| 海拔 Elevation | 0.024 ± 0.007 | 3.254 | 0.002 | 0.026 ± 0.008 | 3.056 | 0.002 | |
| 土壤全磷含量 Soil total phosphorus content | -100.354 ± 20.090 | -4.996 | <0.001 | -89.345 ± 19.793 | -4.514 | <0.001 | |
| 土壤速效钾含量 Soil available potassium content | -20.187 ± 7.743 | -2.607 | 0.011 | -18.620 ± 7.218 | -2.580 | 0.010 | |
Table 4 Coefficients of the multiple regression and associated t-tests for species richness regressed against 17 environmental factors of the recovered forests after diameter-limit logging
| 环境因子 Environmental factor | 普通最小二乘法模型 Ordinary least-squares model | 联立空间自相关模型 Spatial simultaneous autoregressive error model | |||||
|---|---|---|---|---|---|---|---|
| 估计值±标准误差 Estimated value ± SE | t值 t-value | 显著性检验 Pr(>|t|) | 估计值±标准误差 Estimated value ± SE | t值 t-value | 显著性检验 Pr(>|t|) | ||
| 截距 Intercept | 84.918 ± 8.199 | 10.357 | <0.001 | 81.388 ± 8.887 | 9.158 | <0.001 | |
| 海拔 Elevation | 0.024 ± 0.007 | 3.254 | 0.002 | 0.026 ± 0.008 | 3.056 | 0.002 | |
| 土壤全磷含量 Soil total phosphorus content | -100.354 ± 20.090 | -4.996 | <0.001 | -89.345 ± 19.793 | -4.514 | <0.001 | |
| 土壤速效钾含量 Soil available potassium content | -20.187 ± 7.743 | -2.607 | 0.011 | -18.620 ± 7.218 | -2.580 | 0.010 | |
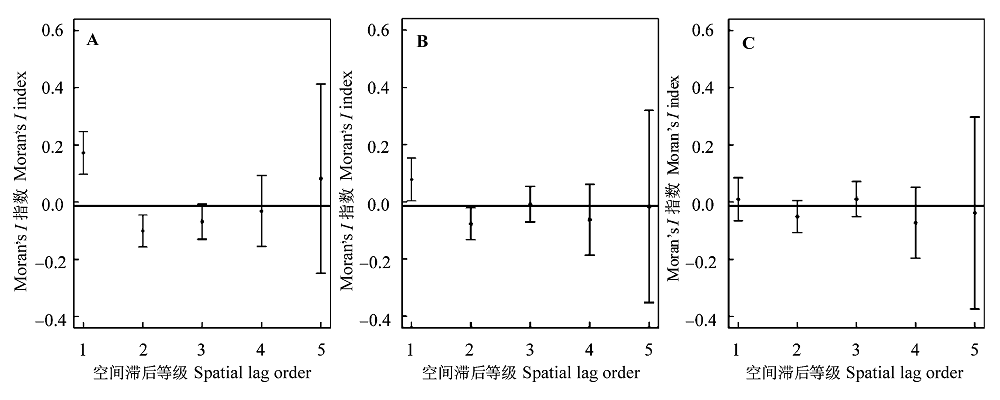
Fig. 2 Assessing model adequacy by testing the autocorrelation in residuals of the models of the recovered forests after diameterlimit logging. A, Original data. B, Residuals of ordinary least-squares model. C, Residuals of spatial simultaneous autoregressive error model.
| 环境因子 Environmental factor | 普通最小二乘法模型 Ordinary least-squares model | 联立空间自相关模型 Spatial simultaneous autoregressive error model | |||||
|---|---|---|---|---|---|---|---|
| 估计值±标准误差 Estimated value ± SE | t值 t-value | 显著性检验 Pr(>|t|) | 估计值±标准误差 Estimated value ± SE | t值 t-value | 显著性检验 Pr(>|t|) | ||
| 截距 Intercept | 59.600 ± 11.037 | 5.400 | <0.001 | 59.720 ± 10.712 | 5.575 | <0.001 | |
| 海拔 Elevation | 0.034 ± 0.014 | 2.390 | 0.022 | 0.033 ± 0.014 | 2.451 | 0.014 | |
Table 5 Coefficients of the multiple regression and associated t-tests for species richness regressed against 17 environmental factors of the recovered forests after clear-cutting
| 环境因子 Environmental factor | 普通最小二乘法模型 Ordinary least-squares model | 联立空间自相关模型 Spatial simultaneous autoregressive error model | |||||
|---|---|---|---|---|---|---|---|
| 估计值±标准误差 Estimated value ± SE | t值 t-value | 显著性检验 Pr(>|t|) | 估计值±标准误差 Estimated value ± SE | t值 t-value | 显著性检验 Pr(>|t|) | ||
| 截距 Intercept | 59.600 ± 11.037 | 5.400 | <0.001 | 59.720 ± 10.712 | 5.575 | <0.001 | |
| 海拔 Elevation | 0.034 ± 0.014 | 2.390 | 0.022 | 0.033 ± 0.014 | 2.451 | 0.014 | |
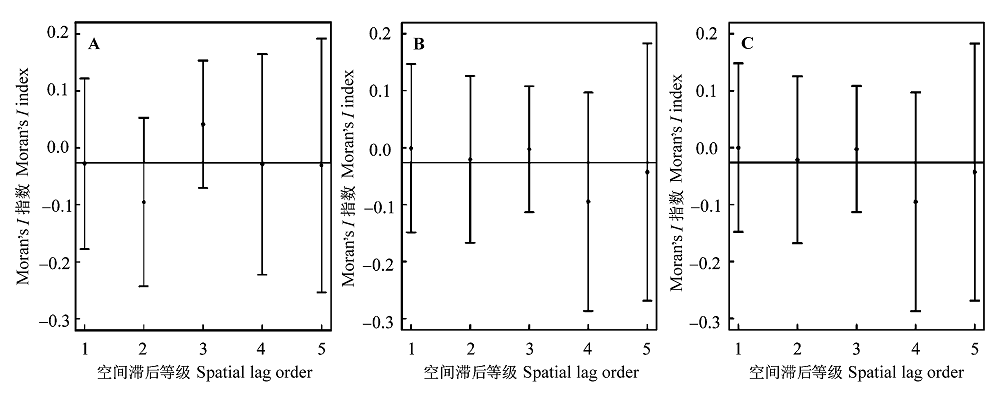
Fig. 3 Assessing model adequacy by testing the autocorrelation in residuals of the models of the recovered forests after clear-cutting. A, Original data. B, Residuals of ordinary least-squares model. C, Residuals of spatial simultaneous autoregressive error model.
| [1] | Badgley C, Fox DL (2000). Ecological biogeography of North American mammals: species density and ecological structure in relation to environmental gradients. Journal of Biogeography, 27, 1437-1467. |
| [2] | Beck J, Chey VK (2008). Explaining the elevational diversity pattern of geometrid moths from Borneo: a test of five hypotheses. Journal of Biogeography, 35, 1452-1464. |
| [3] | Berry NJ, Phillips OL, Ong RC, Hamer KC (2008). Impacts of selective logging on tree diversity across a rainforest landscape: the importance of spatial scale. Landscape Ecology, 23, 915-929. |
| [4] |
Brown KA, Gurevitch J (2004). Long-term impacts of logging on forest diversity in Madagascar. Proceedings of the National Academy of Sciences of the United States of America, 101, 6045-6049.
DOI URL PMID |
| [5] |
Cannon CH, Peart DR, Leighton M (1998). Tree species diversity in commercially logged Bornean rainforest. Science, 281, 1366-1368.
URL PMID |
| [6] | Cramer MJ, Willig MR (2002). Habitat heterogeneity, habitat associations, and rodent species diversity in a sand- shinnery-oak landscape. Journal of Mammalogy, 83, 743-753. |
| [7] | de Deyn GB, Raaijmakers CE, van der Putten WH (2004). Plant community development is affected by nutrients and soil biota. Journal of Ecology, 92, 824-834. |
| [8] | Diniz-Filho JAF, Bini LM, Hawkins BA (2003). Spatial autocorrelation and red herrings in geographical ecology. Global Ecology and Biogeography, 12, 53-64. |
| [9] | Diniz-Filho JAF, de Campos Telles MP (2002). Spatial autocorrelation analysis and the identification of operational units for conservation in continuous populations. Conservation Biology, 16, 924-935. |
| [10] |
Diniz-Filho JAF, Rangel TFLVB, Hawkins BA (2004). A test of multiple hypotheses for the species richness gradient of South American owls. Oecologia, 140, 633-638.
DOI URL PMID |
| [11] | Dormann CF (2007). Effects of incorporating spatial autocorrelation into the analysis of species distribution data. Global Ecology and Biogeography, 16, 129-138. |
| [12] | Dumbrell AJ, Clark EJ, Frost GA, Randell TE, Pitchford JW, Hill JK (2008). Changes in species diversity following habitat disturbance are dependent on spatial scale: theoretical and empirical evidence. Journal of Applied Ecology, 45, 1531-1539. |
| [13] |
Firn J, Erskine PD, Lamb D (2007). Woody species diversity influences productivity and soil nutrient availability in tropical plantations. Oecologia, 154, 521-533.
DOI URL PMID |
| [14] | Foody GM (2004). Spatial nonstationarity and scale- dependency in the relationship between species richness and environmental determinants for the sub-Saharan endemic avifauna. Global Ecology and Biogeography, 13, 315-320. |
| [15] | Hawkins BA, Field R, Cornell HV, Currie DJ, Guégan JF, Kaufman DM, Kerr JT, Mittelbach GG, Oberdorff T, O’Brien EM, Porter EE, Turner JRG (2003). Energy, water, and broad-scale geographic patterns of species richness. Ecology, 84, 3105-3117. |
| [16] | He JS, Chen WL (1997). A review of gradient changes in species diversity of land plant communities. Acta Ecologica Sinica, 17, 91-99. (in Chinses with English abstract) |
| [ 贺金生, 陈伟烈 (1997). 陆地植物群落物种多样性的梯度变化特征. 生态学报, 17, 91-99.] | |
| [17] | Hurlbert AH, White EP (2005). Disparity between range map- and survey-based analyses of species richness: patterns, processes and implications. Ecology Letters, 8, 319-327. |
| [18] | Jiang YX, Lu JP (1991). Tropical Forest Ecosystems of Jianfengling, Hainan Island, China. Science Press, Beijing. 29-42. (in Chinese) |
| [ 蒋有绪, 卢俊培 (1991). 中国海南岛尖峰岭热带林生态系统. 科学出版社, 北京. 29-42.] | |
| [19] | Kaboli M, Guillaumet A, Prodon R (2006). Avifaunal gradients in two arid zones of central Iran in relation to vegetation, climate, and topography. Journal of Biogeography, 33, 133-144. |
| [20] | Kühn I (2007). Incorporating spatial autocorrelation may invert observed patterns. Diversity and Distributions, 13, 66-69. |
| [21] | Legendre P, Legendre L (1998). Numerical Ecology 2nd edn. Elsevier Science, Amsterdam. |
| [22] | Li YD, Chen BF, Zhou GY, Wu ZM, Zeng QB, Luo TS, Huang SN, Xie MD, Huang Q (2002). Research on Tropical Forest and Biodiversity Conservation in Hainan Island, China. Chinese Forest Publishing House, Beijing. 47-51. (in Chinese) |
| [ 李意德, 陈步峰, 周光益, 吴仲民, 曾庆波, 骆土寿, 黄世能, 谢明东, 黄全 (2002). 中国海南岛热带森林及其生物多样性保护研究. 中国林业出版社, 北京. 47-51.] | |
| [23] | Lomolino MV (2001). Elevation gradients of species-density: historical and prospective views. Global Ecology and Biogeography Letters, 10, 3-13. |
| [24] | Paoli GD, Currant LM, Zak DR (2006). Soil nutrients and beta diversity in the Bornean Dipterocarpaceae: evidence for niche partitioning by tropical rain forest trees. Journal of Ecology, 94, 157-170. |
| [25] |
Pimm SL, Brown JH (2004). Domains of diversity. Science, 304, 831-833.
URL PMID |
| [26] | Qian H, Wang S, Li Y, Wang X (2009). Breeding bird diversity in relation to environmental gradients in China. Acta Oecologica, 35, 819-823. |
| [27] |
Rahbek C, Graves GR (2000). Detection of macro-ecological patterns in South American humming birds is affected by spatial scale. Proceedings of the Royal Society of London Series B, 267, 2259-2265.
DOI URL PMID |
| [28] | Rossi JP, Queneherve P (1998). Relating species density to environmental variables in presence of spatial autocorrela- tion: a study case on soil nematodes distribution. Ecography, 21, 117-123. |
| [29] | Rowe RJ, Lidgard S (2009). Elevational gradients and species richness: do methods change pattern perception? Global Ecology and Biogeography, 18, 163-177. |
| [30] | Tognelli MF, Kelt DA (2004). Analysis of determinants of mammalian species richness in South America using spatial autoregressive models. Ecography, 27, 427-436. |
| [31] |
van Rensburg BJ, Chown SL, Gaston KJ (2002). Species richness, environmental correlates, and spatial scale: a test using South African birds. The American Naturalist, 159, 566-577.
URL PMID |
| [32] | Vetaas OR, Grytnes JA (2002). Distribution of vascular plant species richness and endemic richness along the Himalayan elevation gradient in Nepal. Global Ecology and Biogeography, 11, 291-301. |
| [33] | Wang SX, Wang XA, Li GQ, Guo H, Zhu ZH (2010). Species diversity and environmental interpretation in the process of community succession in the Ziwu Mountain of Shaanxi Province. Acta Ecologica Sinica, 30, 1638-1647. (in Chinses with English abstract) |
| [ 王世雄, 王孝安, 李国庆, 郭华, 朱志红 (2010). 陕西子午岭植物群落演替过程中物种多样性变化与环境解释. 生态学报, 30, 1638-1647.] | |
| [34] | Xu H, Li YD, Luo TS, Chen DX, Lin MX, Yang H (2012). Impacts of forest logging on the species diversity of endemic seed plants from Hainan Island. Biodiversity Science, 20, 168-176. (in Chinses with English abstract) |
| [ 许涵, 李意德, 骆土寿, 陈德祥, 林明献, 杨怀 (2012). 森林采伐对尖峰岭海南特有种子植物多样性的影响. 生物多样性, 20, 168-176.] | |
| [35] | Xu YJ, Chen YN, Li WH, Fu AH, Ma XD, Gui DW, Chen YP (2010). Distribution pattern and environmental interpretation of plant species diversity in the mountainous region of Ili River Valley, Xinjiang, China. Chinese Journal of Plant Ecology, 34, 1142-1154. (in Chinses with English abstract) |
| [ 徐远杰, 陈亚宁, 李卫红, 付爱红, 马晓东, 桂东伟, 陈亚鹏 (2010). 伊黎河谷山地植物群落物种多样性分布格局及环境解释. 植物生态学报, 34, 1142-1154.] |
| [1] | Shan-Shan LI xueqin liu. Analysis of functional traits of wetland plants in floodplains in the middle reaches of the Yangtze River [J]. Chin J Plant Ecol, 2024, 48(5): 601-611. |
| [2] | PAN Yuan-Fang, PAN Liang-Hao, QIU Si-Ting, QIU Guang-Long, SU Zhi-Nan, SHI Xiao-Fang, FAN Hang-Qing. Variations in tree height among mangroves and their environmental adaptive mechanisms in China’s coastal areas [J]. Chin J Plant Ecol, 2024, 48(4): 483-495. |
| [3] | NIU Yi-Di, CAI Ti-Jiu. Changes in species diversity and influencing factors in secondary forest succession in northern Da Hinggan Mountains [J]. Chin J Plant Ecol, 2024, 48(3): 349-363. |
| [4] | LI Na, TANG Shi-Ming, GUO Jian-Ying, TIAN Ru, WANG Shan, HU Bing, LUO Yong-Hong, XU Zhu-Wen. Meta-analysis of effects of grazing on plant community properties in Nei Mongol grassland [J]. Chin J Plant Ecol, 2023, 47(9): 1256-1269. |
| [5] | LI An-Yan, HUANG Xian-Fei, TIAN Yuan-Bin, DONG Ji-Xing, ZHENG Fei-Fei, XIA Pin-Hua. Chlorophyll a variation and its driving factors during phase shift from macrophyte- to phytoplankton-dominated states in Caohai Lake, Guizhou, China [J]. Chin J Plant Ecol, 2023, 47(8): 1171-1181. |
| [6] | YANG Xin, REN Ming-Xun. Species distribution pattern and formation mechanism of mangrove plants around the South China Sea [J]. Chin J Plant Ecol, 2023, 47(8): 1105-1115. |
| [7] | YU Xiao, JI Ruo-Xuan, REN Tian-Meng, XIA Xin-Li, YIN Wei-Lun, LIU Chao. Distribution, characteristics and classification of Caryopteris mongholica communities in northern China [J]. Chin J Plant Ecol, 2023, 47(8): 1182-1192. |
| [8] | ZHAO Meng-Juan, JIN Guang-Ze, LIU Zhi-Li. Vertical variations in leaf functional traits of three typical ferns in mixed broadleaved- Korean pine forest [J]. Chin J Plant Ecol, 2023, 47(8): 1131-1143. |
| [9] | YANG Li-Lin, XING Wan-Qiu, WANG Wei-Guang, CAO Ming-Zhu. Variation of sap flow rate of Cunninghamia lanceolata and its response to environmental factors in the source area of Xinʼanjiang River [J]. Chin J Plant Ecol, 2023, 47(4): 571-583. |
| [10] | ZHU Hua, TAN Yun-Hong. Community characteristics, research states and problems of tropical rain forests in China [J]. Chin J Plant Ecol, 2023, 47(4): 447-468. |
| [11] | ZHANG Xiao, WU Juan-Juan, JIA Guo-Dong, LEI Zi-Ran, ZHANG Long-Qi, LIU Rui, LÜ Xiang-Rong, DAI Yuan-Meng. Effects of precipitation variations on characteristics of sap flow and water source of Platycladus orientalis [J]. Chin J Plant Ecol, 2023, 47(11): 1585-1599. |
| [12] | ZHAO Zhen-Xian, CHEN Yin-Ping, WANG Li-Long, WANG Tong-Tong, LI Yu-Qiang. Comparison on leaf construction cost of different plant groups in the desert area of the Hexi Corridor [J]. Chin J Plant Ecol, 2023, 47(11): 1551-1560. |
| [13] | LI Jie, HAO Min-Hui, FAN Chun-Yu, ZHANG Chun-Yu, ZHAO Xiu-Hai. Effect of tree species and functional diversity on ecosystem multifunctionality in temperate forests of northeast China [J]. Chin J Plant Ecol, 2023, 47(11): 1507-1522. |
| [14] | YANG Yuan-He, ZHANG Dian-Ye, WEI Bin, LIU Yang, FENG Xue-Hui, MAO Chao, XU Wei-Jie, HE Mei, WANG Lu, ZHENG Zhi-Hu, WANG Yuan-Yuan, CHEN Lei-Yi, PENG Yun-Feng. Nonlinear responses of community diversity, carbon and nitrogen cycles of grassland ecosystems to external nitrogen input [J]. Chin J Plant Ecol, 2023, 47(1): 1-24. |
| [15] | ZHENG Ning, LI Su-Ying, WANG Xin-Ting, LÜ Shi-Hai, ZHAO Peng-Cheng, ZANG Chen, XU Yu-Long, HE Jing, QIN Wen-Hao, GAO Heng-Rui. Dominance of different plant life forms in the typical steppe evidenced from impacts of environmental factors on chlorophyll [J]. Chin J Plant Ecol, 2022, 46(8): 951-960. |
| Viewed | ||||||
|
Full text |
|
|||||
|
Abstract |
|
|||||
Copyright © 2022 Chinese Journal of Plant Ecology
Tel: 010-62836134, 62836138, E-mail: apes@ibcas.ac.cn, cjpe@ibcas.ac.cn