
植物生态学报 ›› 2026, Vol. 50 ›› Issue (1): 173-187.DOI: 10.17521/cjpe.2024.0288
苏晨飞1,*, 田慰2,1,*, 张楠3,1, 唐龙1,**( ), 赵宇玮4, 王耀1
收稿日期:2024-08-23
接受日期:2025-01-09
出版日期:2026-01-20
发布日期:2026-02-13
通讯作者:
**唐龙(tanglong@mail.xjtu.edu.cn)作者简介:第一联系人:*同等贡献
基金资助:
SU Chen-Fei1,*, TIAN Wei2,1,*, ZHANG Nan3,1, TANG Long1,**(), ZHAO Yu-Wei4, WANG Yao1
Received:2024-08-23
Accepted:2025-01-09
Online:2026-01-20
Published:2026-02-13
Contact:
**TANG Long (tanglong@mail.xjtu.edu.cn)About author:First author contact:*Contributed equally to this work
Supported by:摘要:
近年来, 由于温室气体的大量排放, 极端天气事件的频发已对植物光合作用产生显著影响。光合作用不仅直接关系到植物的生长发育, 其光合速率更是评估植物健康状况与预测未来全球碳循环动态的关键指标。此外, 净光合速率还是设施农业环境调控中的重要参数。因此, 准确预测植物光合速率对农业、林业和草业的科学发展具有重要意义。该研究首先使用光合测量仪获取不同环境下芦苇(Phragmites australis)和互花米草(Spartina alterniflora)的光合数据, 随后拟合了7种单因素光合响应模型, 并基于理论指导的神经网络(TgNN)建立了多因素光合速率预测模型。研究结果表明, 现有的单因素光合响应模型虽取得不错的拟合效果, 但其理论研究的价值有限; 而基于TgNN建立的多因素光合速率预测模型展现了较好的预测能力和泛化能力。该研究为构建准确、可靠的植物光合速率预测模型提供了一种新的方法和思路。
苏晨飞, 田慰, 张楠, 唐龙, 赵宇玮, 王耀. 光合响应模型与理论指导的神经网络融合的多因素光合速率预测模型. 植物生态学报, 2026, 50(1): 173-187. DOI: 10.17521/cjpe.2024.0288
SU Chen-Fei, TIAN Wei, ZHANG Nan, TANG Long, ZHAO Yu-Wei, WANG Yao. Multi-factor photosynthetic rate prediction model by fusion of photosynthetic response model and theory-guided neural network. Chinese Journal of Plant Ecology, 2026, 50(1): 173-187. DOI: 10.17521/cjpe.2024.0288
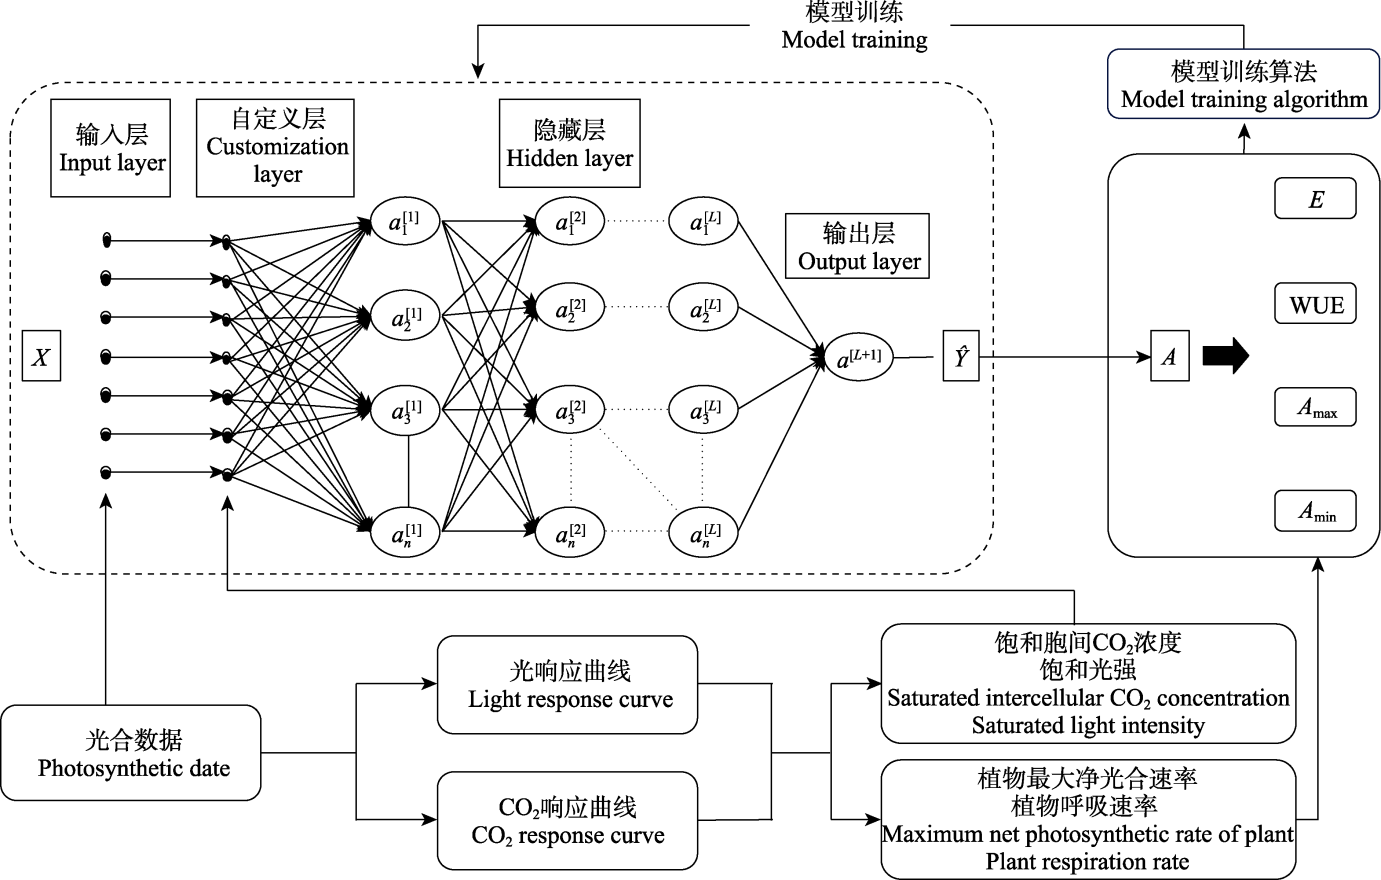
图1 多因素光合速率预测模型建模流程。A, 净光合速率; Amin, 最小净光合速率; Amax, 最大净光合速率; E, 蒸腾速率; WUE, 水分利用效率; X, 芦苇和互花米草的光合数据; Ŷ, 神经网络的输出。
Fig. 1 Modeling process for multifactorial photosynthetic rate prediction model. A, net photosynthetic rate; Amin, minimum net photosynthetic rate; Amax, maximum net photosynthetic rate; E, transpiration rate; WUE, water use efficiency; X, photosynthesis data for Phragmites australis and Spartina alterniflora; Ŷ, the output of the neural network.
| 模型 Model | 叶片温度 Tleaf (℃) | 初始斜率 α | 最大净光合速率 Amax (µmol·m-2·s-1) | 光补偿点 Ic (µmol·m-2·s-1) | 暗呼吸速率 Rd (µmol·m-2·s-1) | 模型拟合的决定系数 R |
|---|---|---|---|---|---|---|
| 直角双曲线模型 Rectangular hyperbola model | 20 | 0.055 4 | 76.109 1 | 108.260 3 | 5.561 6 | 0.983 7 |
| 25 | 0.049 4 | 81.143 2 | 62.736 8 | 2.985 4 | 0.989 0 | |
| 30 | 0.059 2 | 78.160 6 | 97.101 2 | 5.355 6 | 0.975 6 | |
| 35 | 0.059 5 | 77.629 1 | 100.994 0 | 5.574 3 | 0.976 0 | |
| 40 | 0.054 0 | 76.456 4 | 98.070 3 | 4.952 9 | 0.983 6 | |
| 非直角双曲线模型 Non-rectangular hyperbolic model | 20 | 0.033 0 | 43.819 3 | 70.154 9 | 2.314 6 | 0.989 6 |
| 25 | 0.035 7 | 52.939 4 | 29.800 2 | 1.060 3 | 0.990 2 | |
| 30 | 0.031 0 | 39.988 4 | 33.141 6 | 1.028 4 | 0.992 7 | |
| 35 | 0.031 9 | 41.794 3 | 45.647 5 | 1.460 1 | 0.990 5 | |
| 40 | 0.036 4 | 53.005 1 | 59.875 5 | 2.174 3 | 0.985 1 | |
| 直角双曲线修正模型 Modified model of rectangular hyperbola | 20 | 0.040 2 | 37.973 3 | 91.036 5 | 3.584 2 | 0.988 6 |
| 25 | 0.040 5 | 42.891 8 | 43.780 7 | 1.747 9 | 0.989 8 | |
| 30 | 0.043 6 | 39.648 7 | 86.064 3 | 3.670 5 | 0.986 9 | |
| 35 | 0.043 5 | 39.269 2 | 88.745 7 | 3.775 4 | 0.985 7 | |
| 40 | 0.039 5 | 38.420 6 | 77.286 2 | 2.992 2 | 0.987 6 | |
| 指数模型 Exponential Model | 20 | 0.044 2 | 47.011 6 | 25.302 6 | 1.103 9 | 0.985 8 |
| 25 | 0.042 2 | 51.911 4 | 25.027 3 | 1.045 1 | 0.989 6 | |
| 30 | 0.047 7 | 48.645 4 | 23.276 0 | 1.098 4 | 0.979 4 | |
| 35 | 0.047 5 | 48.226 8 | 23.476 4 | 1.102 8 | 0.979 6 | |
| 40 | 0.043 6 | 47.714 3 | 25.250 0 | 1.089 4 | 0.985 4 |
表1 芦苇光响应曲线模型参数平均值
Table 1 Mean values of model parameters for Phragmites australis light response curve
| 模型 Model | 叶片温度 Tleaf (℃) | 初始斜率 α | 最大净光合速率 Amax (µmol·m-2·s-1) | 光补偿点 Ic (µmol·m-2·s-1) | 暗呼吸速率 Rd (µmol·m-2·s-1) | 模型拟合的决定系数 R |
|---|---|---|---|---|---|---|
| 直角双曲线模型 Rectangular hyperbola model | 20 | 0.055 4 | 76.109 1 | 108.260 3 | 5.561 6 | 0.983 7 |
| 25 | 0.049 4 | 81.143 2 | 62.736 8 | 2.985 4 | 0.989 0 | |
| 30 | 0.059 2 | 78.160 6 | 97.101 2 | 5.355 6 | 0.975 6 | |
| 35 | 0.059 5 | 77.629 1 | 100.994 0 | 5.574 3 | 0.976 0 | |
| 40 | 0.054 0 | 76.456 4 | 98.070 3 | 4.952 9 | 0.983 6 | |
| 非直角双曲线模型 Non-rectangular hyperbolic model | 20 | 0.033 0 | 43.819 3 | 70.154 9 | 2.314 6 | 0.989 6 |
| 25 | 0.035 7 | 52.939 4 | 29.800 2 | 1.060 3 | 0.990 2 | |
| 30 | 0.031 0 | 39.988 4 | 33.141 6 | 1.028 4 | 0.992 7 | |
| 35 | 0.031 9 | 41.794 3 | 45.647 5 | 1.460 1 | 0.990 5 | |
| 40 | 0.036 4 | 53.005 1 | 59.875 5 | 2.174 3 | 0.985 1 | |
| 直角双曲线修正模型 Modified model of rectangular hyperbola | 20 | 0.040 2 | 37.973 3 | 91.036 5 | 3.584 2 | 0.988 6 |
| 25 | 0.040 5 | 42.891 8 | 43.780 7 | 1.747 9 | 0.989 8 | |
| 30 | 0.043 6 | 39.648 7 | 86.064 3 | 3.670 5 | 0.986 9 | |
| 35 | 0.043 5 | 39.269 2 | 88.745 7 | 3.775 4 | 0.985 7 | |
| 40 | 0.039 5 | 38.420 6 | 77.286 2 | 2.992 2 | 0.987 6 | |
| 指数模型 Exponential Model | 20 | 0.044 2 | 47.011 6 | 25.302 6 | 1.103 9 | 0.985 8 |
| 25 | 0.042 2 | 51.911 4 | 25.027 3 | 1.045 1 | 0.989 6 | |
| 30 | 0.047 7 | 48.645 4 | 23.276 0 | 1.098 4 | 0.979 4 | |
| 35 | 0.047 5 | 48.226 8 | 23.476 4 | 1.102 8 | 0.979 6 | |
| 40 | 0.043 6 | 47.714 3 | 25.250 0 | 1.089 4 | 0.985 4 |
| 模型 Model | 叶片温度 Tleaf (℃) | 初始斜率 α | 最大净光合速率 Amax (µmol·m-2·s-1) | 光补偿点 Ic (µmol·m-2·s-1) | 暗呼吸速率 Rd (µmol·m-2·s-1) | 模型拟合的决定系数 R | |
|---|---|---|---|---|---|---|---|
| 直角双曲线模型 Rectangular hyperbola model | 20 | 0.094 3 | 61.488 0 | 107.877 6 | 8.732 0 | 0.962 2 | |
| 25 | 0.089 3 | 68.372 4 | 120.464 5 | 9.298 3 | 0.966 2 | ||
| 30 | 0.102 7 | 66.953 5 | 107.877 5 | 9.508 1 | 0.961 5 | ||
| 35 | 0.104 8 | 68.320 1 | 107.877 6 | 9.702 2 | 0.960 3 | ||
| 40 | 0.096 4 | 62.854 3 | 107.877 5 | 8.926 0 | 0.961 1 | ||
| 非直角双曲线模型 Non-rectangular hyperbolic model | 20 | 0.092 9 | 61.667 2 | 107.155 9 | 8.568 8 | 0.962 2 | |
| 25 | 0.042 4 | 39.048 8 | 103.921 2 | 4.400 1 | 0.992 7 | ||
| 30 | 0.045 6 | 39.765 2 | 84.978 2 | 3.864 5 | 0.989 3 | ||
| 35 | 0.046 5 | 40.576 8 | 84.978 5 | 3.943 4 | 0.989 4 | ||
| 40 | 0.042 8 | 37.330 6 | 84.978 1 | 3.627 9 | 0.988 9 | ||
| 直角双曲线修正模型 Modified model of rectangular hyperbola | 20 | 0.055 4 | 32.908 7 | 97.673 4 | 5.216 4 | 0.980 8 | |
| 25 | 0.058 1 | 34.590 9 | 120.743 9 | 6.720 5 | 0.984 6 | ||
| 30 | 0.060 3 | 35.833 9 | 97.673 3 | 5.680 0 | 0.981 1 | ||
| 35 | 0.061 6 | 36.565 2 | 97.673 5 | 5.796 0 | 0.981 3 | ||
| 40 | 0.056 6 | 33.640 0 | 97.673 3 | 5.332 3 | 0.980 2 | ||
| 指数模型 Exponential model | 20 | 0.063 4 | 37.039 3 | 19.380 2 | 1.207 8 | 0.971 5 | |
| 25 | 0.062 3 | 40.246 5 | 19.741 8 | 1.212 0 | 0.974 2 | ||
| 30 | 0.069 0 | 40.331 7 | 17.773 8 | 1.207 8 | 0.972 3 | ||
| 35 | 0.061 6 | 36.565 2 | 97.673 5 | 5.796 0 | 0.980 8 | ||
| 40 | 0.064 8 | 37.862 4 | 18.952 0 | 1.207 8 | 0.978 8 | ||
| 40 | 0.043 6 | 47.714 3 | 25.250 0 | 1.089 4 | 0.985 4 | ||
表2 互花米草光响应曲线模型参数平均值
Table 2 Mean values of model parameters for Spartina alterniflora light response curve
| 模型 Model | 叶片温度 Tleaf (℃) | 初始斜率 α | 最大净光合速率 Amax (µmol·m-2·s-1) | 光补偿点 Ic (µmol·m-2·s-1) | 暗呼吸速率 Rd (µmol·m-2·s-1) | 模型拟合的决定系数 R | |
|---|---|---|---|---|---|---|---|
| 直角双曲线模型 Rectangular hyperbola model | 20 | 0.094 3 | 61.488 0 | 107.877 6 | 8.732 0 | 0.962 2 | |
| 25 | 0.089 3 | 68.372 4 | 120.464 5 | 9.298 3 | 0.966 2 | ||
| 30 | 0.102 7 | 66.953 5 | 107.877 5 | 9.508 1 | 0.961 5 | ||
| 35 | 0.104 8 | 68.320 1 | 107.877 6 | 9.702 2 | 0.960 3 | ||
| 40 | 0.096 4 | 62.854 3 | 107.877 5 | 8.926 0 | 0.961 1 | ||
| 非直角双曲线模型 Non-rectangular hyperbolic model | 20 | 0.092 9 | 61.667 2 | 107.155 9 | 8.568 8 | 0.962 2 | |
| 25 | 0.042 4 | 39.048 8 | 103.921 2 | 4.400 1 | 0.992 7 | ||
| 30 | 0.045 6 | 39.765 2 | 84.978 2 | 3.864 5 | 0.989 3 | ||
| 35 | 0.046 5 | 40.576 8 | 84.978 5 | 3.943 4 | 0.989 4 | ||
| 40 | 0.042 8 | 37.330 6 | 84.978 1 | 3.627 9 | 0.988 9 | ||
| 直角双曲线修正模型 Modified model of rectangular hyperbola | 20 | 0.055 4 | 32.908 7 | 97.673 4 | 5.216 4 | 0.980 8 | |
| 25 | 0.058 1 | 34.590 9 | 120.743 9 | 6.720 5 | 0.984 6 | ||
| 30 | 0.060 3 | 35.833 9 | 97.673 3 | 5.680 0 | 0.981 1 | ||
| 35 | 0.061 6 | 36.565 2 | 97.673 5 | 5.796 0 | 0.981 3 | ||
| 40 | 0.056 6 | 33.640 0 | 97.673 3 | 5.332 3 | 0.980 2 | ||
| 指数模型 Exponential model | 20 | 0.063 4 | 37.039 3 | 19.380 2 | 1.207 8 | 0.971 5 | |
| 25 | 0.062 3 | 40.246 5 | 19.741 8 | 1.212 0 | 0.974 2 | ||
| 30 | 0.069 0 | 40.331 7 | 17.773 8 | 1.207 8 | 0.972 3 | ||
| 35 | 0.061 6 | 36.565 2 | 97.673 5 | 5.796 0 | 0.980 8 | ||
| 40 | 0.064 8 | 37.862 4 | 18.952 0 | 1.207 8 | 0.978 8 | ||
| 40 | 0.043 6 | 47.714 3 | 25.250 0 | 1.089 4 | 0.985 4 | ||
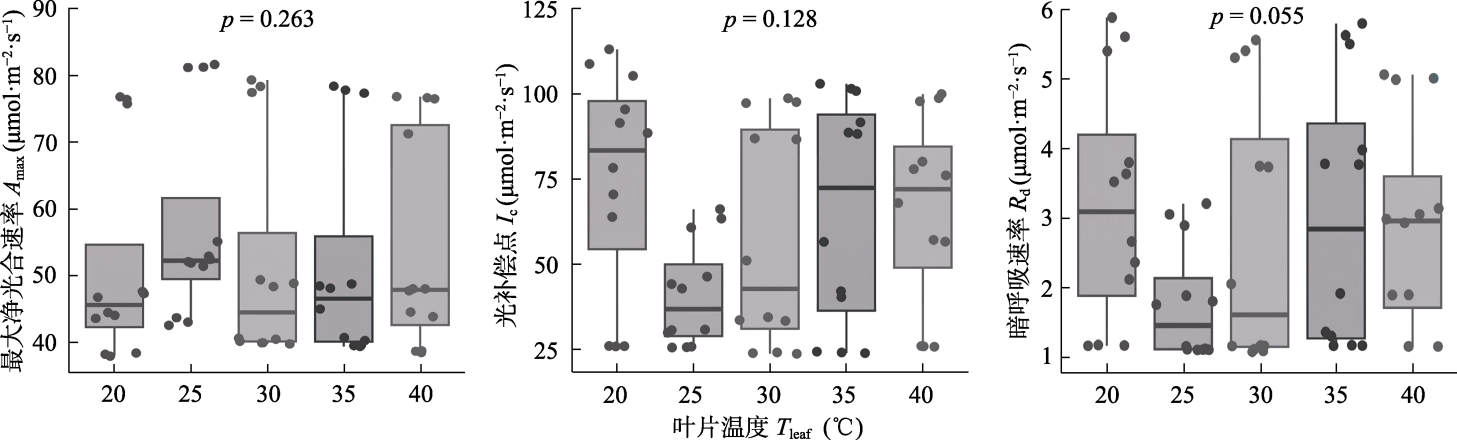
图2 不同温度下芦苇光响应模型参数差异分析。
Fig. 2 Analysis of differences in model parameters of Phragmites australis light response at different temperatures. Amax, maximum net photosynthetic rate; Ic, light compensation point; Rd, dark respiration rate; Tleaf, leaf temperature.
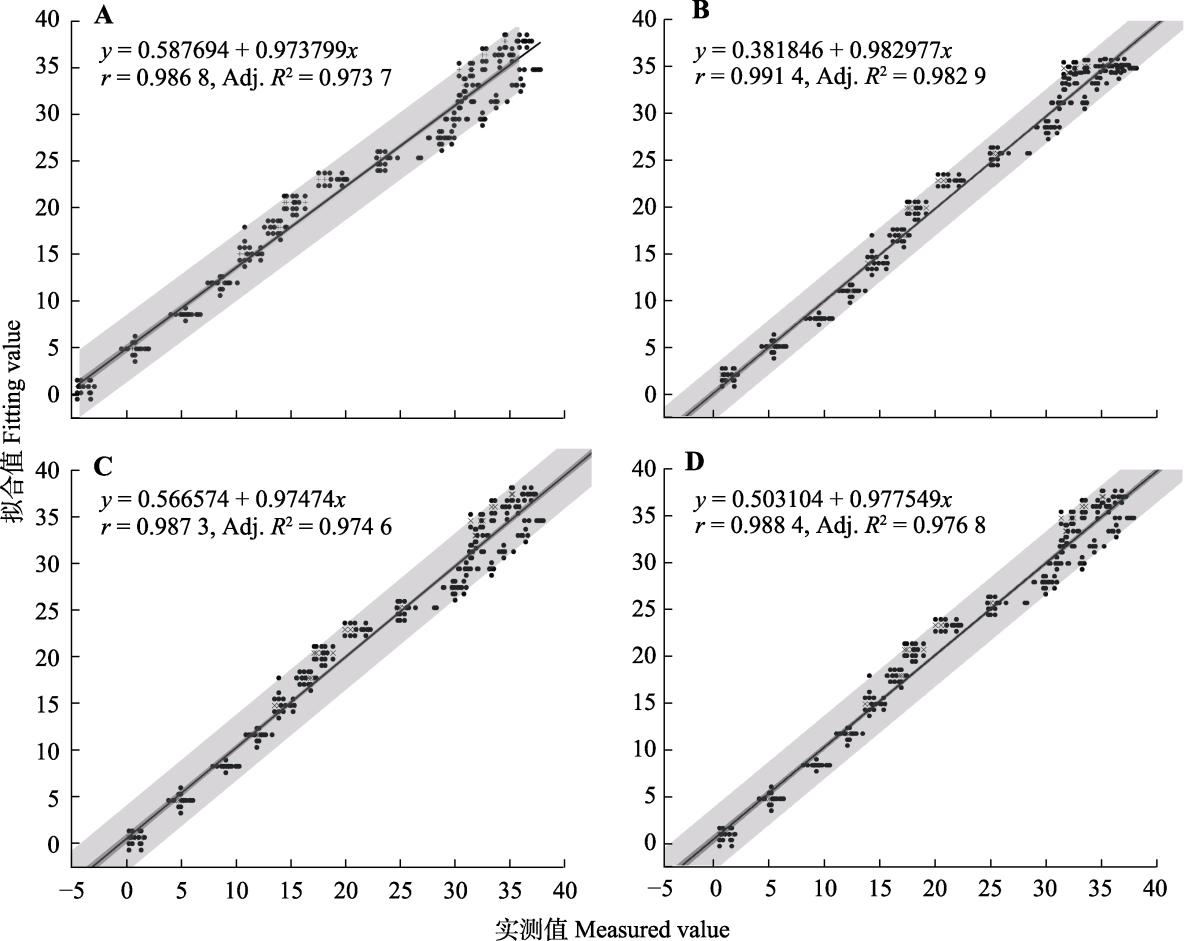
图3 芦苇的4种光响应模型线性回归分析。A, 直角双曲线模型。B, 非直角双曲线模型。C, 指数模型。D, 直角双曲线修正模型。
Fig. 3 Linear regression analysis of four light response models for Phragmites australis. A, Rectangular hyperbola model. B, Non-rectangular hyperbolic model. C, Exponential model. D, Modified model of rectangular hyperbola.
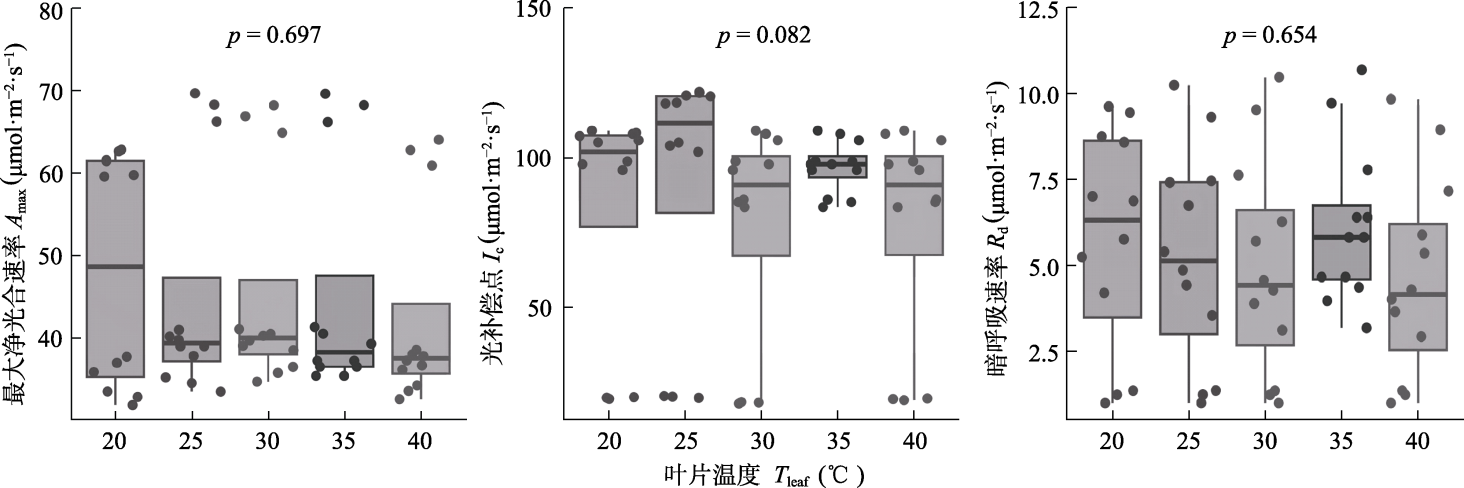
图4 不同温度下互花米草光响应模型参数差异分析。
Fig. 4 Analysis of differences in model parameters of light response of Spartina alterniflora at different temperatures. Amax, maximum net photosynthetic rate; Ic, light compensation point; Rd, dark respiration rate; Tleaf, leaf temperature.
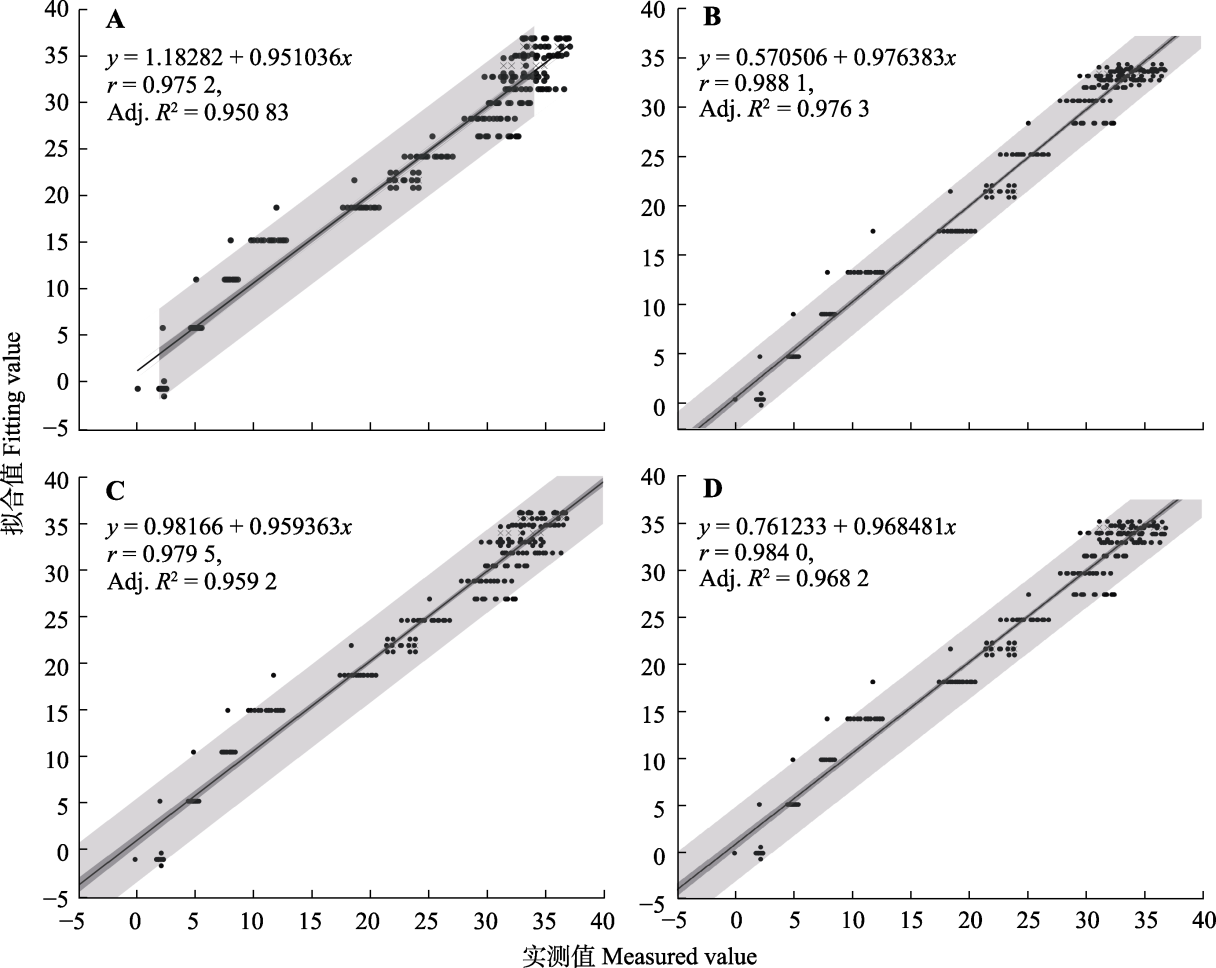
图5 互花米草的4种光响应模型线性回归分析。A, 直角双曲线模型。B, 非直角双曲线模型。C, 指数模型。D, 直角双曲线修正模型。
Fig. 5 Linear regression analysis of four light response models for Spartina alterniflora. A, Rectangular hyperbola model. B, Non-rectangular hyperbolic model. C, Exponential model. D, Modified model of rectangular hyperbola.
| 模型 Model | 叶片温度 Tleaf (℃) | 初始斜率 α | 最大净光合速率 Amax (µmol·m-2·s-1) | CO2补偿点 | 光呼吸速率 Rp (µmol·m-2·s-1) | 模型拟合的决定系数 R |
|---|---|---|---|---|---|---|
| 直角双曲线模型 Rectangular hyperbola model | 20 | 0.183 2 | 119.943 6 | 106.343 3 | 16.737 4 | 0.998 5 |
| 25 | 0.193 8 | 116.599 2 | 74.536 9 | 12.861 2 | 0.996 1 | |
| 30 | 0.207 5 | 115.981 9 | 77.440 0 | 14.119 1 | 0.993 7 | |
| 35 | 0.230 9 | 113.510 7 | 99.638 3 | 19.009 4 | 0.983 6 | |
| 40 | 0.202 5 | 111.775 0 | 101.130 7 | 17.300 0 | 0.998 8 | |
| Michaelis-Menten模型 Michaelis-Menten model | 20 | - | 119.943 6 | 106.343 3 | 16.737 4 | 0.998 5 |
| 25 | - | 116.599 2 | 74.536 9 | 12.861 2 | 0.996 1 | |
| 30 | - | 115.981 9 | 77.440 0 | 14.119 1 | 0.993 7 | |
| 35 | - | 113.510 7 | 99.638 3 | 19.009 4 | 0.983 6 | |
| 40 | - | 111.775 0 | 101.130 7 | 17.300 0 | 0.998 8 | |
| 直角双曲线修正模型 Modified model of rectangular hyperbola | 20 | 0.153 3 | 41.087 1 | 108.154 3 | 15.344 0 | 0.998 8 |
| 25 | 0.159 7 | 44.594 2 | 74.905 0 | 11.331 9 | 0.997 2 | |
| 30 | 0.174 1 | 46.207 5 | 77.867 5 | 12.638 7 | 0.994 6 | |
| 35 | 0.179 5 | 40.513 9 | 101.701 9 | 16.789 8 | 0.986 6 | |
| 40 | 0.169 4 | 41.739 2 | 102.650 3 | 15.800 8 | 0.999 1 |
表3 芦苇CO2响应模型参数平均值
Table 3 Mean values of Phragmites australis CO2 response model parameters
| 模型 Model | 叶片温度 Tleaf (℃) | 初始斜率 α | 最大净光合速率 Amax (µmol·m-2·s-1) | CO2补偿点 | 光呼吸速率 Rp (µmol·m-2·s-1) | 模型拟合的决定系数 R |
|---|---|---|---|---|---|---|
| 直角双曲线模型 Rectangular hyperbola model | 20 | 0.183 2 | 119.943 6 | 106.343 3 | 16.737 4 | 0.998 5 |
| 25 | 0.193 8 | 116.599 2 | 74.536 9 | 12.861 2 | 0.996 1 | |
| 30 | 0.207 5 | 115.981 9 | 77.440 0 | 14.119 1 | 0.993 7 | |
| 35 | 0.230 9 | 113.510 7 | 99.638 3 | 19.009 4 | 0.983 6 | |
| 40 | 0.202 5 | 111.775 0 | 101.130 7 | 17.300 0 | 0.998 8 | |
| Michaelis-Menten模型 Michaelis-Menten model | 20 | - | 119.943 6 | 106.343 3 | 16.737 4 | 0.998 5 |
| 25 | - | 116.599 2 | 74.536 9 | 12.861 2 | 0.996 1 | |
| 30 | - | 115.981 9 | 77.440 0 | 14.119 1 | 0.993 7 | |
| 35 | - | 113.510 7 | 99.638 3 | 19.009 4 | 0.983 6 | |
| 40 | - | 111.775 0 | 101.130 7 | 17.300 0 | 0.998 8 | |
| 直角双曲线修正模型 Modified model of rectangular hyperbola | 20 | 0.153 3 | 41.087 1 | 108.154 3 | 15.344 0 | 0.998 8 |
| 25 | 0.159 7 | 44.594 2 | 74.905 0 | 11.331 9 | 0.997 2 | |
| 30 | 0.174 1 | 46.207 5 | 77.867 5 | 12.638 7 | 0.994 6 | |
| 35 | 0.179 5 | 40.513 9 | 101.701 9 | 16.789 8 | 0.986 6 | |
| 40 | 0.169 4 | 41.739 2 | 102.650 3 | 15.800 8 | 0.999 1 |
| 模型 Model | 叶片温度 Tleaf (℃) | 初始斜率 α | 最大净光合速率 Amax (µmol·m-2·s-1) | CO2补偿点 | 光呼吸速率 Rp (µmol·m-2·s-1) | 模型拟合的决定系数 R |
|---|---|---|---|---|---|---|
| 直角双曲线模型 Rectangular hyperbola model | 20 | 2.260 4 | 74.634 5 | 22.385 1 | 30.155 5 | 0.992 6 |
| 25 | 2.130 4 | 74.802 1 | 22.121 0 | 28.911 8 | 0.993 1 | |
| 30 | 2.169 4 | 75.013 1 | 20.975 6 | 28.322 8 | 0.992 7 | |
| 35 | 1.272 5 | 69.188 4 | 19.595 8 | 18.329 9 | 0.997 4 | |
| 40 | 1.786 0 | 69.854 8 | 18.670 9 | 22.571 1 | 0.993 4 | |
| Michaelis-Mente模型 Michaelis-Menten model | 20 | - | 74.634 5 | 22.385 1 | 30.155 5 | 0.992 6 |
| 25 | - | 74.802 1 | 22.121 0 | 28.911 8 | 0.993 1 | |
| 30 | - | 75.013 1 | 20.975 6 | 28.322 8 | 0.992 7 | |
| 35 | - | 69.188 4 | 19.595 8 | 18.329 9 | 0.997 4 | |
| 40 | - | 69.854 8 | 18.670 9 | 22.571 1 | 0.993 4 | |
| 直角双曲线修正模型 Modified model of rectangular hyperbola | 20 | 0.596 4 | 39.818 2 | 11.817 3 | 6.383 9 | 0.995 3 |
| 25 | 0.626 2 | 40.902 1 | 13.017 0 | 7.305 3 | 0.992 7 | |
| 30 | 0.620 1 | 41.776 0 | 10.861 1 | 6.146 0 | 0.997 5 | |
| 35 | 0.625 3 | 43.911 9 | 13.381 3 | 7.498 2 | 0.997 0 | |
| 40 | 0.617 1 | 42.079 5 | 10.173 1 | 5.762 8 | 0.998 8 |
表4 互花米草CO2响应模型参数平均值
Table 4 Mean values of Spartina alterniflora CO2 response model parameters
| 模型 Model | 叶片温度 Tleaf (℃) | 初始斜率 α | 最大净光合速率 Amax (µmol·m-2·s-1) | CO2补偿点 | 光呼吸速率 Rp (µmol·m-2·s-1) | 模型拟合的决定系数 R |
|---|---|---|---|---|---|---|
| 直角双曲线模型 Rectangular hyperbola model | 20 | 2.260 4 | 74.634 5 | 22.385 1 | 30.155 5 | 0.992 6 |
| 25 | 2.130 4 | 74.802 1 | 22.121 0 | 28.911 8 | 0.993 1 | |
| 30 | 2.169 4 | 75.013 1 | 20.975 6 | 28.322 8 | 0.992 7 | |
| 35 | 1.272 5 | 69.188 4 | 19.595 8 | 18.329 9 | 0.997 4 | |
| 40 | 1.786 0 | 69.854 8 | 18.670 9 | 22.571 1 | 0.993 4 | |
| Michaelis-Mente模型 Michaelis-Menten model | 20 | - | 74.634 5 | 22.385 1 | 30.155 5 | 0.992 6 |
| 25 | - | 74.802 1 | 22.121 0 | 28.911 8 | 0.993 1 | |
| 30 | - | 75.013 1 | 20.975 6 | 28.322 8 | 0.992 7 | |
| 35 | - | 69.188 4 | 19.595 8 | 18.329 9 | 0.997 4 | |
| 40 | - | 69.854 8 | 18.670 9 | 22.571 1 | 0.993 4 | |
| 直角双曲线修正模型 Modified model of rectangular hyperbola | 20 | 0.596 4 | 39.818 2 | 11.817 3 | 6.383 9 | 0.995 3 |
| 25 | 0.626 2 | 40.902 1 | 13.017 0 | 7.305 3 | 0.992 7 | |
| 30 | 0.620 1 | 41.776 0 | 10.861 1 | 6.146 0 | 0.997 5 | |
| 35 | 0.625 3 | 43.911 9 | 13.381 3 | 7.498 2 | 0.997 0 | |
| 40 | 0.617 1 | 42.079 5 | 10.173 1 | 5.762 8 | 0.998 8 |
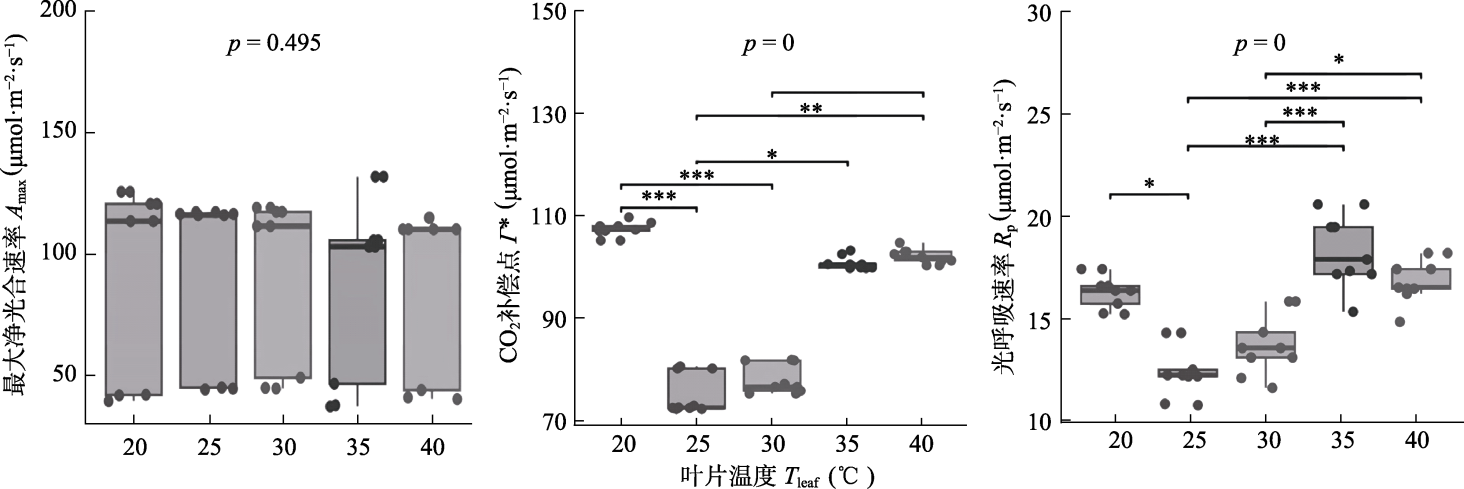
图6 不同温度下芦苇CO2响应模型参数差异分析。
Fig. 6 Analysis of differences in model parameters of Phragmites australis CO2 response at different temperatures. Amax, maximum net photosynthetic rate; Γ*, CO2 compensation point; Rp, light respiration rate; Tleaf, leaf temperature.
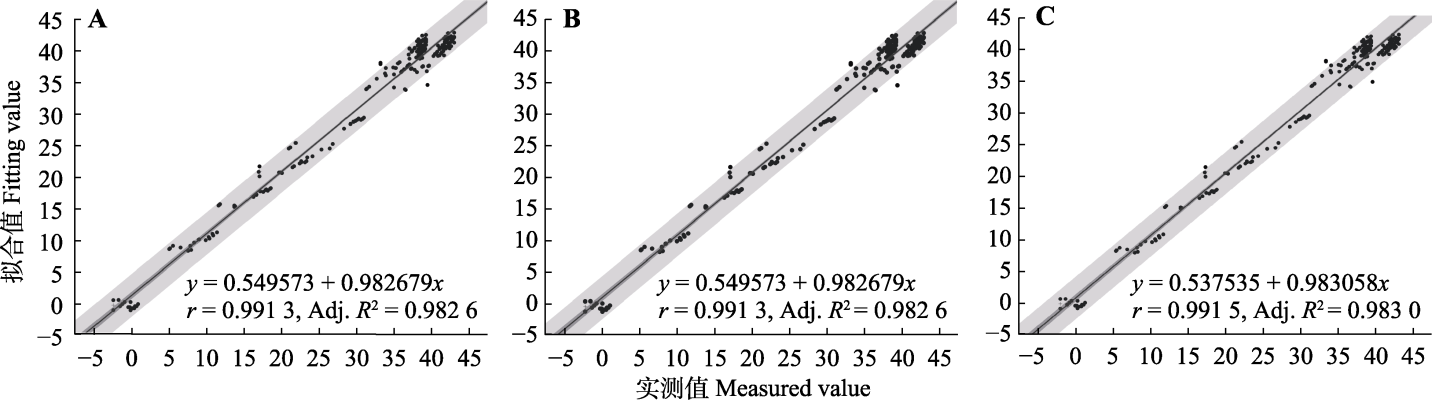
图7 芦苇的3种CO2响应模型线性回归分析。A, 直角双曲线模型。B, Michaelis-Menten模型。C, 直角双曲线修正模型。
Fig. 7 Linear regression analysis of three CO2 response models for Phragmites australis. A, Rectangular hyperbola model. B, Michaelis-Menten model. C, Modified model of rectangular hyperbola.
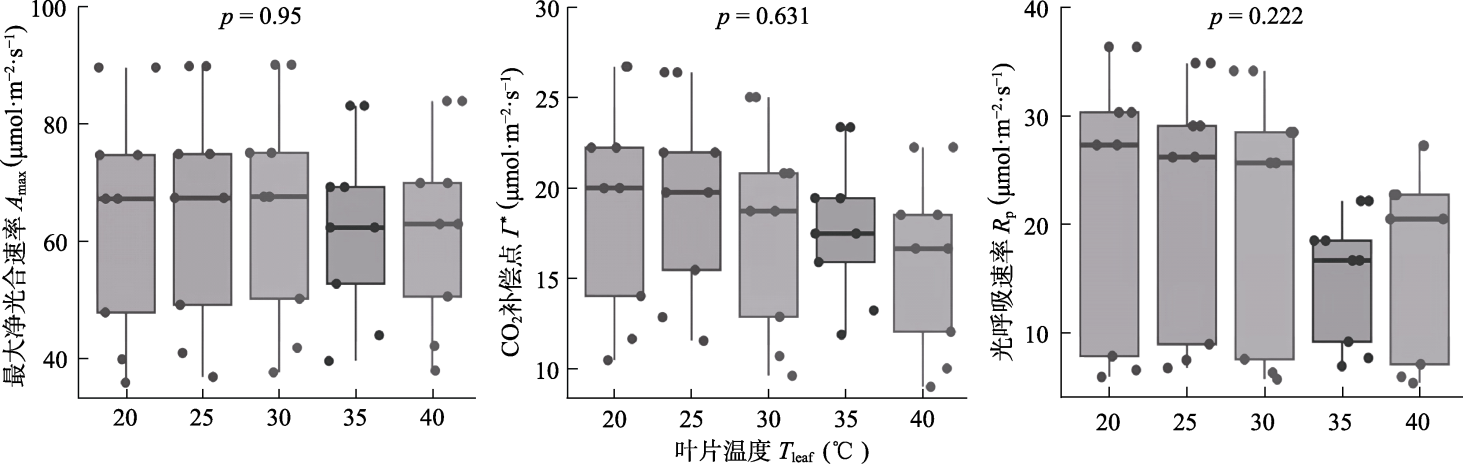
图8 不同温度下互花米草CO2响应模型参数差异分析。
Fig. 8 Difference analysis of model parameters of CO2 response of Spartina alterniflora at different temperatures. Amax, maximum net photosynthetic rate; Γ*, CO2 compensation point; Rp, light respiration rate; Tleaf, leaf temperature.
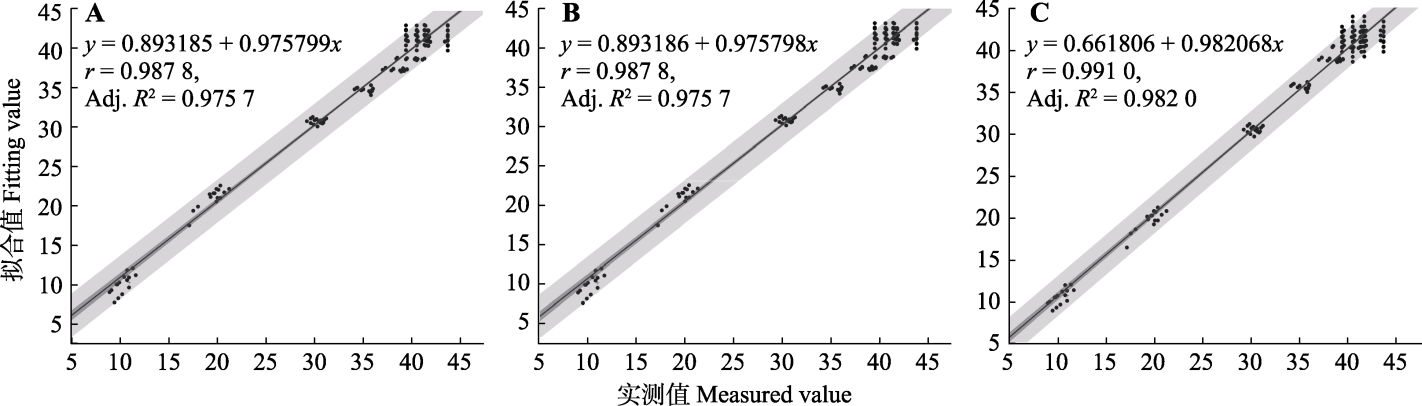
图9 互花米草3种CO2响应模型线性回归分析。A, 直角双曲线模型。B, Michaelis-Menten模型。C, 直角双曲线修正模型。
Fig. 9 Linear regression analysis of three CO2 response models for Spartina alterniflora. A, Rectangular hyperbola model. B, Michaelis-Menten model. C, Modified model of rectangular hyperbola.
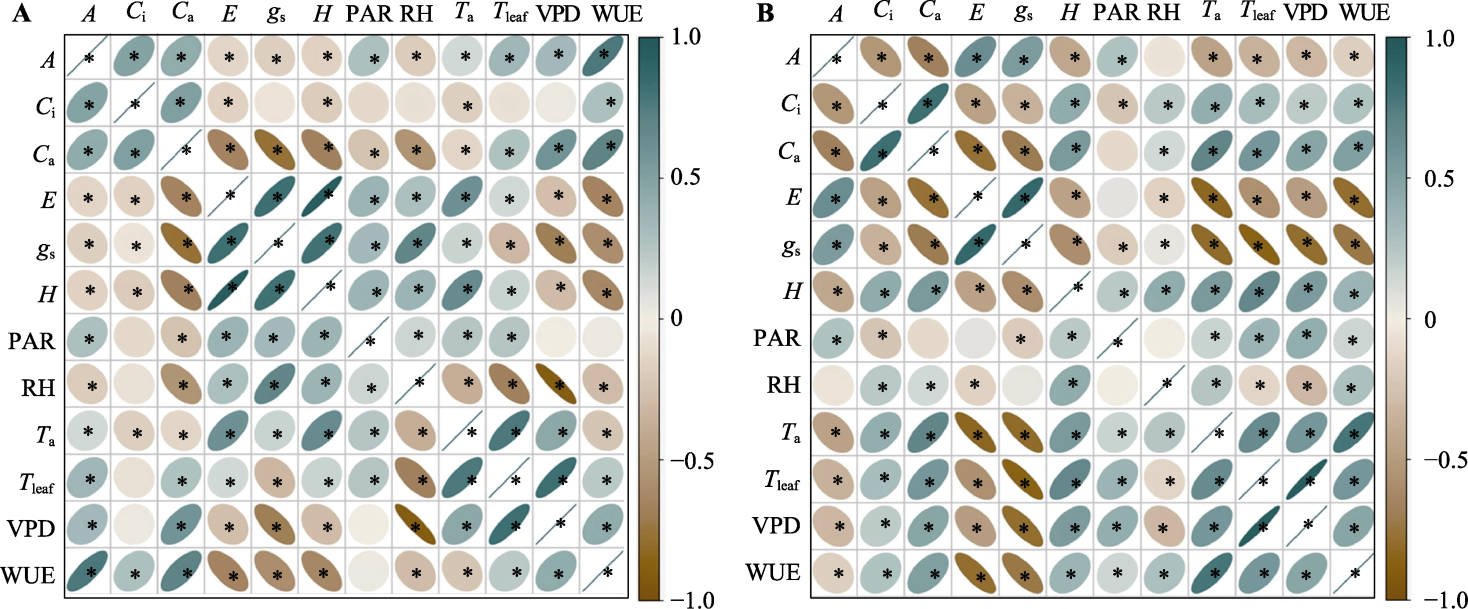
图10 芦苇和互花米草光合指标的相关性分析。A, 芦苇光合指标的相关性分析。B, 互花米草光合指标的相关性分析。A, 净光合速率; Ci, 植物胞间CO2浓度; Ca, 环境CO2浓度; E, 蒸腾速率; gs, 气孔导度; H, 湿度; PAR, 有效光合辐射; RH, 相对湿度; Ta, 气温; Tleaf, 叶片温度; VPD, 水蒸气压亏缺; WUE, 水分利用效率。*, p < 0.05。
Fig. 10 Correlation analysis of photosynthetic metrics in Phragmites australis and Spartina alterniflora. A, Correlation analysis of photosynthetic indexes in Phragmites australis. B, Correlation analysis of photosynthetic indexes in Spartina alterniflora. A, net photosynthetic rate; Ci, plant intercellular CO2 concentration; Ca, ambient CO2 concentration; E, transpiration rate; gs, stomatal conductance; H, humidity; PAR, effective photosynthetic radiation; RH, relative humidity; Ta, temperature; Tleaf, leaf temperature; VPD, water vapor pressure deficit; WUE, water use efficiency. *, p < 0.05.
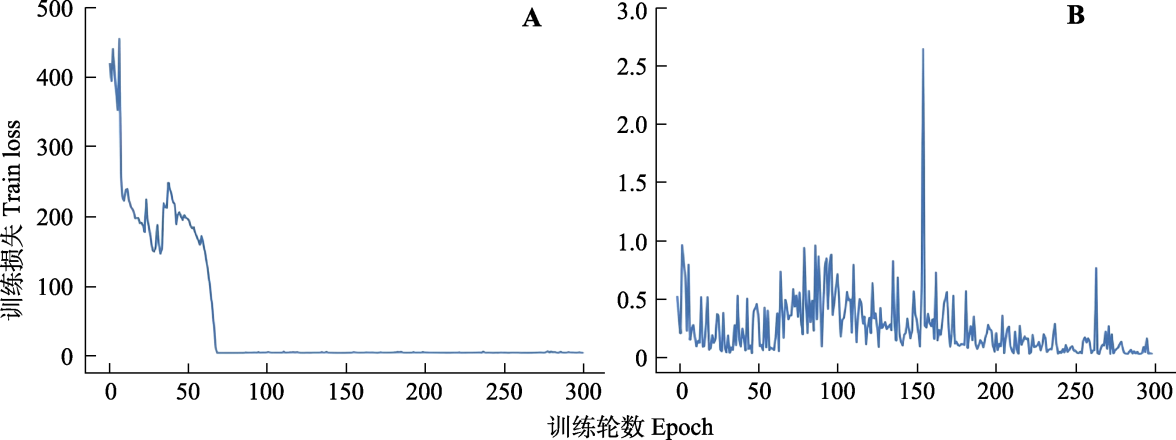
图11 基于理论指导的神经网络(TgNN)的多因素光合速率预测模型训练过程。A, 训练集损失变化。B, 测试集损失变化。
Fig. 11 Training process of a multifactorial photosynthetic rate prediction model based on Theory-guided neural network (TgNN). A, Training set loss variation. B, Test set loss variation.
| 植物类别 Plant category | 模型种类 Types of model | 平均绝对误差 MAE | 平均绝对百分比误差 MAPE | 均方误差 MSE | 均方根误差 RMSE |
|---|---|---|---|---|---|
| 芦苇 Phragmites australis | 多元线性回归 Multiple linear regression | 5.426 1 | 0.128 1 | 5.580 1 | 0.131 8 |
| 神经网络 Neural network | 4.687 0 | 0.110 4 | 4.736 8 | 0.111 5 | |
| 随机森林 Random forest | 4.343 6 | 0.102 5 | 4.345 3 | 0.102 6 | |
| 支持向量回归 Support vector regression | 5.584 9 | 0.131 9 | 5.658 1 | 0.133 7 | |
| 理论指导的神经网络 Theory-guided neural network | 2.574 5 | 0.060 7 | 2.669 2 | 0.063 6 | |
| 互花米草 Spartina alterniflora | 多元线性回归 Multiple linear regression | 3.737 3 | 0.332 3 | 4.215 1 | 0.583 1 |
| 神经网络 Neural network | 3.301 7 | 0.193 2 | 4.457 8 | 0.269 2 | |
| 随机森林 Random forest | 1.801 0 | 0.183 3 | 2.064 0 | 0.494 4 | |
| 支持向量回归 Support vector regression | 3.806 0 | 0.534 4 | 4.712 5 | 1.179 1 | |
| 理论指导的神经网络 Theory-guided neural network | 1.504 3 | 0.094 9 | 1.668 8 | 0.163 0 |
表5 各类模型在测试集上的误差
Table 5 Errors of various models on the test set
| 植物类别 Plant category | 模型种类 Types of model | 平均绝对误差 MAE | 平均绝对百分比误差 MAPE | 均方误差 MSE | 均方根误差 RMSE |
|---|---|---|---|---|---|
| 芦苇 Phragmites australis | 多元线性回归 Multiple linear regression | 5.426 1 | 0.128 1 | 5.580 1 | 0.131 8 |
| 神经网络 Neural network | 4.687 0 | 0.110 4 | 4.736 8 | 0.111 5 | |
| 随机森林 Random forest | 4.343 6 | 0.102 5 | 4.345 3 | 0.102 6 | |
| 支持向量回归 Support vector regression | 5.584 9 | 0.131 9 | 5.658 1 | 0.133 7 | |
| 理论指导的神经网络 Theory-guided neural network | 2.574 5 | 0.060 7 | 2.669 2 | 0.063 6 | |
| 互花米草 Spartina alterniflora | 多元线性回归 Multiple linear regression | 3.737 3 | 0.332 3 | 4.215 1 | 0.583 1 |
| 神经网络 Neural network | 3.301 7 | 0.193 2 | 4.457 8 | 0.269 2 | |
| 随机森林 Random forest | 1.801 0 | 0.183 3 | 2.064 0 | 0.494 4 | |
| 支持向量回归 Support vector regression | 3.806 0 | 0.534 4 | 4.712 5 | 1.179 1 | |
| 理论指导的神经网络 Theory-guided neural network | 1.504 3 | 0.094 9 | 1.668 8 | 0.163 0 |
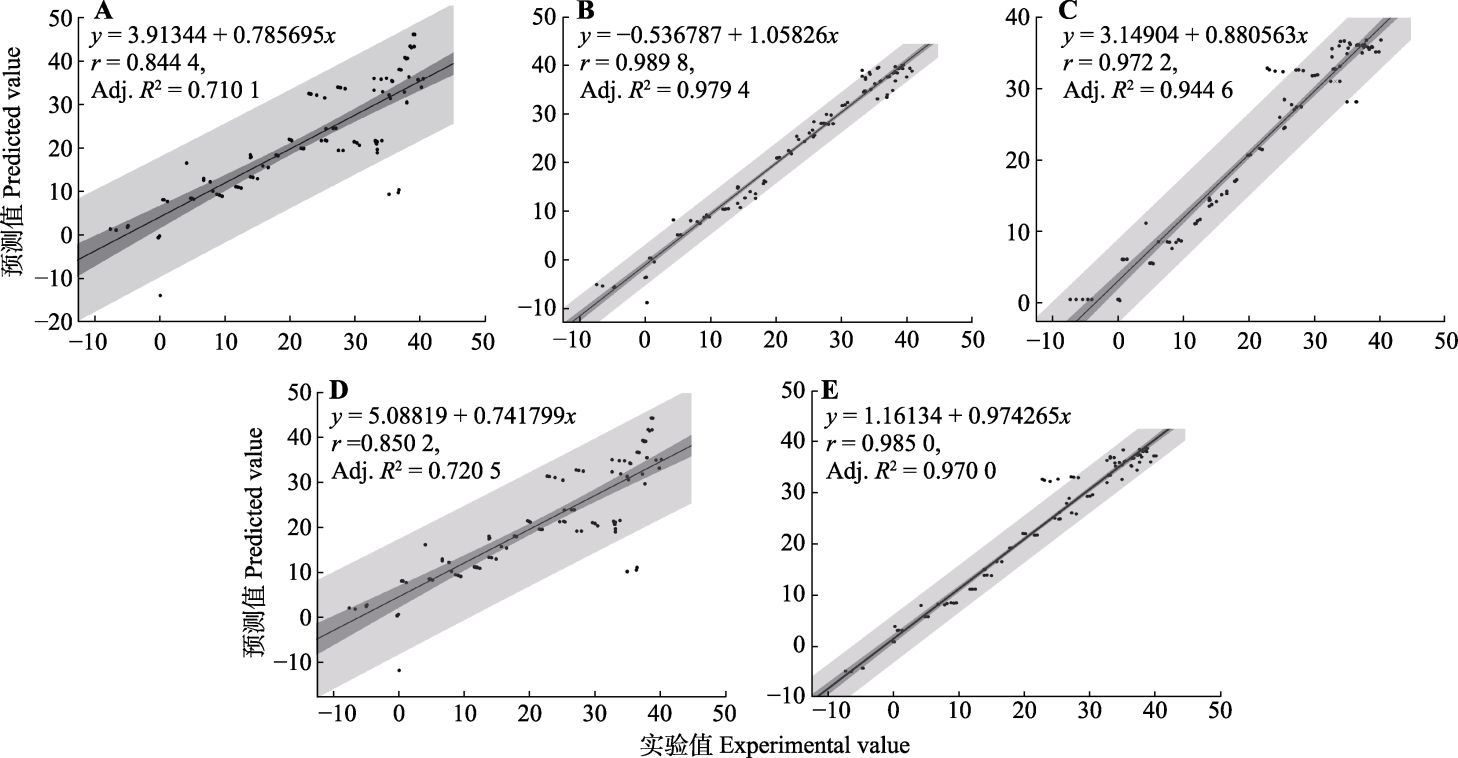
图12 5种芦苇光合速率预测模型的回归分析。A, 多元线性回归。B, 神经网络。C, 随机森林。D, 支持向量回归。E, 理论指导的神经网络。
Fig. 12 Regression analysis of five Phragmites australis photosynthetic rate prediction models. A, Multiple Linear Regression (MLR). B, Neural Network (NN). C, Random Forest (RF). D, Support Vector Regression (SVR). E, Theory-guided Neural Network (TgNN).
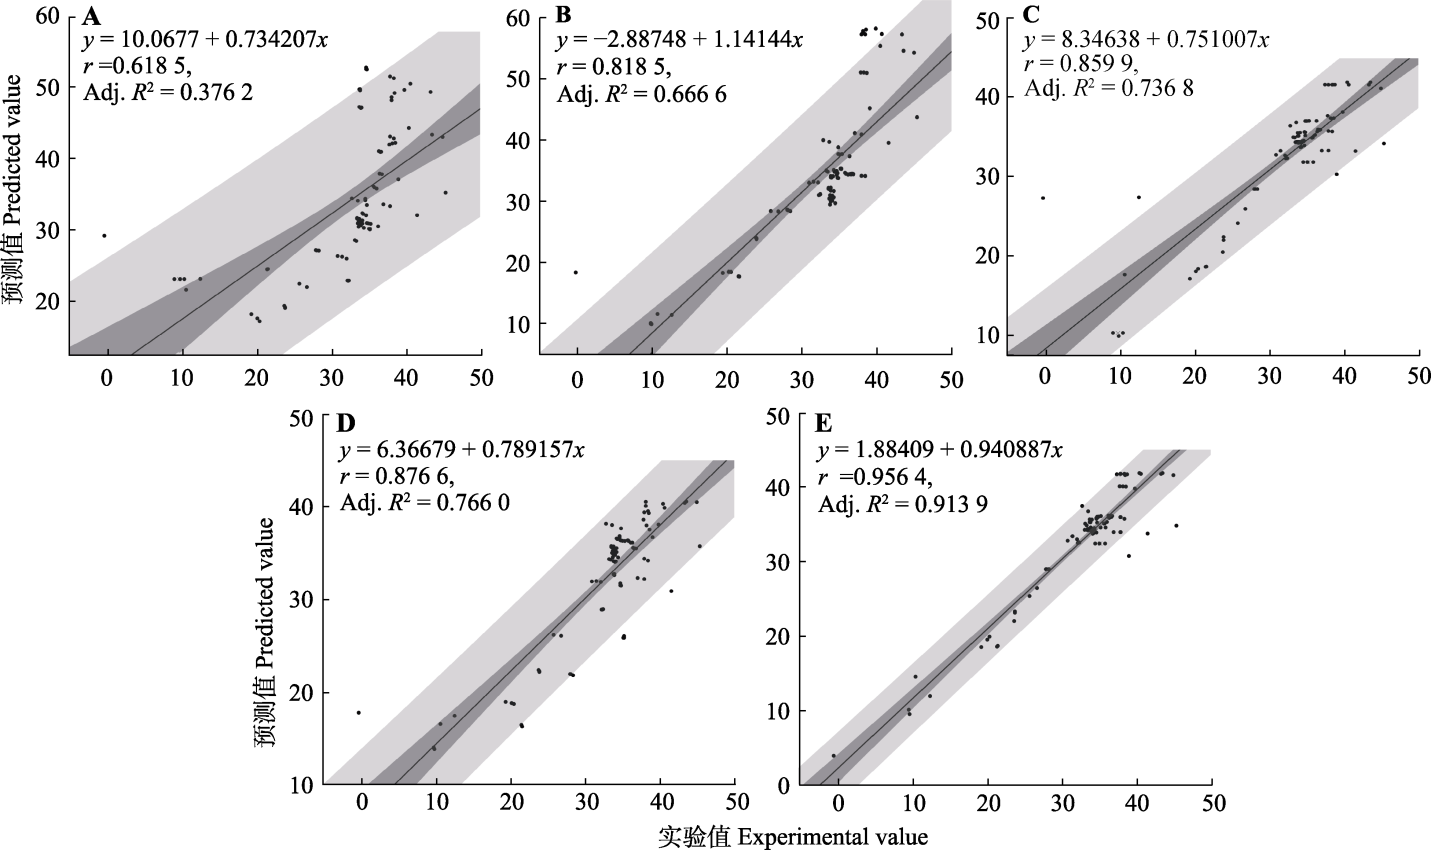
图13 5种互花米草光合速率预测模型的回归分析。A, 多元线性回归。B, 神经网络。C, 随机森林。D, 支持向量回归。E, 理论指导的神经网络。
Fig. 13 Regression analysis of photosynthetic rate prediction models for five species of Spartina alterniflora. A, Multiple Linear Regression (MLR). B, Neural Network (NN). C, Random Forest (RF). D, Support Vector Regression (SVR). E, Theory-guided Neural Network (TgNN).
| [1] | Ali AA, Nugroho B, Moyano FE, Brambach F, Jenkins MW, Pangle R, Stiegler C, Blei E, Cahyo AN, Olchev A, Irawan B, Ariani R, June T, Tarigan S, Corre MD, et al. (2021). Using a bottom-up approach to scale leaf photosynthetic traits of oil palm, rubber, and two coexisting tropical woody species. Forests, 12, 359. DOI: 10.3390/f12030359. |
| [2] | Bai JH (2019). Target Parameter Acquisition Method of Co-regulation of CO2-light in Cucumber Juvenile Based on Photosynthetic Rate Prediction Model. Master degree dissertation, Northwest A&F University, Yangling, Shaanxi. |
| [白京华 (2019). 基于光合速率预测模型的黄瓜幼期CO2-光照协同调控目标参数获取方法. 硕士学位论文, 西北农林科技大学, 陕西杨凌.] | |
| [3] | Baly ECC (1935). The kinetics of photosynthesis. Proceedings of the Royal Society: Biological Sciences, 117, 218-239. |
| [4] | Bambach N, U KTP, Gilbert ME (2020). A dynamic model of RuBP-regeneration limited photosynthesis accounting for photoinhibition, heat and water stress. Agricultural and Forest Meteorology, 285, 107911. DOI: 10.1016/j.agrformet.2020.107911. |
| [5] | Bassman JH, Zwier JC (1991). Gas exchange characteristics of Populus trichocarpa, Populus deltoides and Populus trichocarpa × P. deltoides clones. Tree Physiology, 8, 145-159. |
| [6] | Cai SQ, Xu DQ (2000). Relationship between the CO2 compensation point and photorespiration in soybean leaves. Acta Photophysiologica Sinica, 26, 545-550. |
| [蔡时青, 许大全 (2000). 大豆叶片CO2补偿点和光呼吸的关系. 植物生理学报, 26, 545-550.] | |
| [7] | Chen YT, Zhang DX (2021). Theory-guided deep-learning for electrical load forecasting (TgDLF) via ensemble long short-term memory. Advances in Applied Energy, 1, 100004. DOI: 10.1016/j.adapen.2020.100004. |
| [8] | Choi D, Jang W, Toda H, Yoshikawa M (2021). Differences in characteristics of photosynthesis and nitrogen utilization in leaves of the black locust (Robinia pseudoacacia L.) according to leaf position. Forests, 12, 348. DOI: 10.3390/f12030348. |
| [9] |
Farquhar GD, Caemmerer SV, Berry JA (1980). A biochemical model of photosynthetic CO2 assimilation in leaves of C3 species. Planta, 149, 78-90.
DOI PMID |
| [10] | García-Rodríguez LDC, Prado-Olivarez J, Guzmán-Cruz R, Rodríguez-Licea MA, Barranco-Gutiérrez AI, Perez-Pinal FJ, Espinosa-Calderon A (2022). Mathematical modeling to estimate photosynthesis: a state of the art. Applied Sciences, 12, 5537. DOI: 10.3390/app12115537. |
| [11] |
Harley PC, Sharkey TD (1991). An improved model of C3 photosynthesis at high CO2: reversed O2 sensitivity explained by lack of glycerate reentry into the chloroplast. Photosynthesis Research, 27, 169-178.
DOI PMID |
| [12] | Hu BG, Zhao X, Yan HP, Ph DR, Blaise F, Xiong FL, Wang YM (2001). Plant growth modeling and visualization— Review and perspective. Acta Automatica Sinica, 27, 816-835. |
| [胡包钢, 赵星, 严红平, de Reffye Ph, Blaise F, 熊范纶, 王一鸣 (2001). 植物生长建模与可视化——回顾与展望. 自动化学报, 27, 816-835.] | |
| [13] |
Karpatne A, Atluri G, Faghmous JH, Steinbach M, Banerjee A, Ganguly A, Shekhar S, Samatova N, Kumar V (2017). Theory-guided data science: a new paradigm for scientific discovery from data. IEEE Transactions on Knowledge and Data Engineering, 29, 2318-2331.
DOI URL |
| [14] | Thornley JHM (1976). Mathematical Models in Plant Physiology: A Quantitative Approach to Problems in Plant and Crop Physiology. Academic Press, London. |
| [15] | Millan-Almaraz JR, Guevara-Gonzalez RG, Romero-Troncoso RDJ, Osornio-Rios RA, Torres-Pacheco I (2009). Advantages and disadvantages on photosynthesis measurement techniques: a review. African Journal of Biotechnology, 8, 7340-7349. |
| [16] |
Wang D, Rianti W, Gálvez F, van der Putten PEL, Struik PC, Yin XY (2022). Estimating photosynthetic parameter values of rice, wheat, maize and sorghum to enable smart crop cultivation. Crop and Environment, 1, 119-132.
DOI URL |
| [17] | Wang NZ, Zhang DX, Chang HB, Li H (2020). Deep learning of subsurface flow via theory-guided neural network. Journal of Hydrology, 584, 124700. DOI: 10.1016/j.jhydrol.2020.124700. |
| [18] | Yang WJ, Sun SX, Wang NX, Fan PX, You C, Wang RQ, Zheng PM, Wang H (2023). Dynamics of the distribution of invasive alien plants (Asteraceae) in China under climate change. Science of the Total Environment, 903, 166260. DOI: 10.1016/j.scitotenv.2023.166260. |
| [19] | Ye ZP (2008). A new model of light-response of photosynthesis and its application. Journal of Biomathematics, 23, 710-716. |
| [叶子飘 (2008). 光合作用对光响应新模型及其应用. 生物数学学报, 23, 710-716.] | |
| [20] |
Ye ZP (2007). A new model for relationship between irradiance and the rate of photosynthesis in Oryza sativa. Photosynthetica, 45, 637-640.
DOI URL |
| [1] | 姚霞, 汤守鹏, 曹卫星, 田永超, 朱艳. 应用近红外光谱估测小麦叶片氮含量[J]. 植物生态学报, 2011, 35(8): 844-852. |
| [2] | 范文义, 张海玉, 于颖, 毛学刚, 杨金明. 三种森林生物量估测模型的比较分析[J]. 植物生态学报, 2011, 35(4): 402-410. |
| [3] | 米湘成, 马克平, 邹应斌. 人工神经网络模型及其在农业和生态学研究中的应用[J]. 植物生态学报, 2005, 29(5): 863-870. |
| [4] | 杨健, 池宏康, 莫沫. 应用神经网络和多谱段遥感数据对大屿山岛土地覆盖分类的研究[J]. 植物生态学报, 2002, 26(2): 185-188. |
| 阅读次数 | ||||||
|
全文 |
|
|||||
|
摘要 |
|
|||||
Copyright © 2026 版权所有 《植物生态学报》编辑部
地址: 北京香山南辛村20号, 邮编: 100093
Tel.: 010-62836134, 62836138; Fax: 010-82599431; E-mail: apes@ibcas.ac.cn, cjpe@ibcas.ac.cn
备案号: 京ICP备16067583号-19
![]()