
植物生态学报 ›› 2011, Vol. 35 ›› Issue (4): 402-410.DOI: 10.3724/SP.J.1258.2011.00402
范文义*( ), 张海玉, 于颖, 毛学刚, 杨金明
收稿日期:2010-09-15
接受日期:2010-11-26
出版日期:2011-09-15
发布日期:2011-04-13
作者简介:* E-mail: fanwy@163.com
FAN Wen-Yi*(), ZHANG Hai-Yu, YU Ying, MAO Xue-Gang, YANG Jin-Ming
Received:2010-09-15
Accepted:2010-11-26
Online:2011-09-15
Published:2011-04-13
摘要:
森林生物量的定量估算为全球碳储量、碳循环研究提供了重要的参考依据。该研究采用黑龙江长白山地区的TM影像和133块森林资源一类清查样地的数据, 选取地学参数、遥感反演参数等71个自变量分别构建多元逐步回归模型、传统BP (back propagation)神经网络模型和基于高斯误差函数的BP神经网络改进模型(Gaussian error function, Erf-BP), 进而估算该地区的森林生物量, 并进行比较分析。结果表明, 多元逐步回归模型估测的森林生物量预测精度为75%, 均方根误差为26.87 t·m-2; 传统BP神经网络模型估测森林生物量的预测精度为80.92%, 均方根误差为21.44 t·m-2; Erf-BP估测森林生物量的预测精度为82.22%, 均方根误差为20.83 t·m-2。可见, 改进后的Erf-BP能更好地模拟生物量与各个因子之间的关系, 估算精度更高。
范文义, 张海玉, 于颖, 毛学刚, 杨金明. 三种森林生物量估测模型的比较分析. 植物生态学报, 2011, 35(4): 402-410. DOI: 10.3724/SP.J.1258.2011.00402
FAN Wen-Yi, ZHANG Hai-Yu, YU Ying, MAO Xue-Gang, YANG Jin-Ming. Comparison of three models of forest biomass estimation. Chinese Journal of Plant Ecology, 2011, 35(4): 402-410. DOI: 10.3724/SP.J.1258.2011.00402
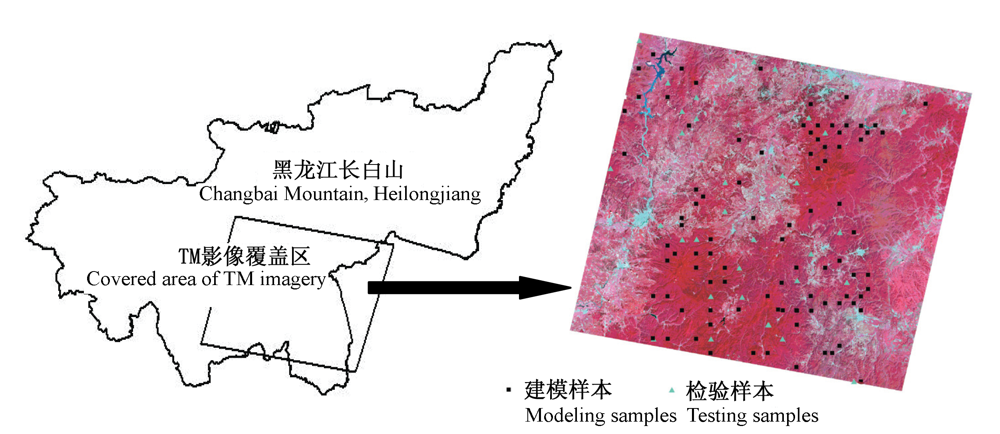
图1 研究区域TM影像及样地分布图。
Fig. 1 TM imagery and distribution of plots in study area.
| 树种1) Species1) | 茎生物量 Stem biomass (WS) | 枝生物量 Branch biomass (WB) | 叶生物量 Foliage biomass (WL) | 出处 Derivation | 树高 Tree height (H) |
|---|---|---|---|---|---|
| 1 | WS = 0.0145(D2H)1.006 | WB = 0.000063(D2H)1.536 | WL = 0.00104(D2H)1.148 | H = 6.6831exp(0.0515D) | |
| 2 | WS = 0.0134(D2H)1.020 | WB = 0.0105(D2H) 0.7386 | WL = 0.181D1.8415 | H = 5.7584exp(0.0499D) | |
| 3 | WS = 0.025(D2H)0.96 | WB = 0.0021(D2H)0.8181 | WL = 0.00126(D2H)0.968 | H = 6.9441exp(0.0468D) | |
| 4 | WS = 0.057D2.4753 | WB = 0.0116D2.4054 | WL = 0.0083D2.3733 | H = 6.8879exp(0.0343D) | |
| 5 | WS = 0.0238(D2H)0.936 | WB = 0.005(D2H)0.9105 | WL = 0.0036(D2H)0.897 | H = 6.8879exp(0.0343D) | |
| 6 | WS = 0.032417D2.3565 | WB = 0.20893D1.7082 | WL = 0.29156D1.2807 | Self-established | H = 6.6831exp(0.0515D) |
| 7 | WS = 0.06013(D2H)0.891 | WB = 0.00652(D2H)1.169 | WL = 0.0044(D2H)0.9919 | H = 8.4834exp(0.0277D) | |
| 8 | WS = 0.02511(D2H)0.927 | WB = 0.00957(D2H)0.974 | WL = 0.8725(D2H)0.2034 | H = 10.6exp(0.0169D) | |
| 9 | WS = 0.2286(D2H)0.6938 | WB = 0.0247(D2H)0.7378 | WL = 0.0108(D2H)0.8181 | Self-established | H = 9.285exp(0.0196D) |
| 10 | WS = 0.3274(D2H)0.7217 | WB = 0.01349(D2H)0.7197 | WL = 0.02347(D2H)0.893 | Self-established | H = 7.0338exp(0.0332D) |
| 11 | WS = 0.03146(D2H)1.032 | WB = 0.007429D2.6745 | WL = 0.002754D2.4965 | H = 8.1427exp(0.0249D) | |
| 12 | WS = 0.07936(D2H)0.901 | WB = 0.014167(D2H)0.764 | WL = 0.01086(D2H)0.847 | Self-established | H = 13.799exp(0.0138D) |
| 13 | WS = 0.14114(D2H)0.723 | WB = 0.00724(D2H)1.0225 | WL = 0.0079(D2H)0.8085 | H = 6.2635exp(0.0334D) | |
| 14 | WS = 0.03141(D2H)0.733 | WB = 0.002127D2.9504 | WL = 0.00321D2.473 5 | H = 8.1877exp(0.0219D) | |
| 15 | WS = 0.01275(D2H)1.009 | WB = 0.00824(D2H)0.975 | WL = 0.00024(D2H)0.991 | H = 7.0889exp(0.0349D) | |
| 16 | WS = 0.1193(D2H)0.8372 | WB = 0.002(D2H)1.12 | WL = 0.000015(D2H)1.47 | H = 9.8065exp(0.0246D) | |
| 17 | WS = 0.2286(D2H)0.6938 | WB = 0.0247(D2H)0.7378 | WL = 0.0108(D2H)0.8181 | H = 12.136exp(0.0133D) |
表1 主要树种生物量方程及树高方程
Table 1 Biomass and tree height functions of main tree species
| 树种1) Species1) | 茎生物量 Stem biomass (WS) | 枝生物量 Branch biomass (WB) | 叶生物量 Foliage biomass (WL) | 出处 Derivation | 树高 Tree height (H) |
|---|---|---|---|---|---|
| 1 | WS = 0.0145(D2H)1.006 | WB = 0.000063(D2H)1.536 | WL = 0.00104(D2H)1.148 | H = 6.6831exp(0.0515D) | |
| 2 | WS = 0.0134(D2H)1.020 | WB = 0.0105(D2H) 0.7386 | WL = 0.181D1.8415 | H = 5.7584exp(0.0499D) | |
| 3 | WS = 0.025(D2H)0.96 | WB = 0.0021(D2H)0.8181 | WL = 0.00126(D2H)0.968 | H = 6.9441exp(0.0468D) | |
| 4 | WS = 0.057D2.4753 | WB = 0.0116D2.4054 | WL = 0.0083D2.3733 | H = 6.8879exp(0.0343D) | |
| 5 | WS = 0.0238(D2H)0.936 | WB = 0.005(D2H)0.9105 | WL = 0.0036(D2H)0.897 | H = 6.8879exp(0.0343D) | |
| 6 | WS = 0.032417D2.3565 | WB = 0.20893D1.7082 | WL = 0.29156D1.2807 | Self-established | H = 6.6831exp(0.0515D) |
| 7 | WS = 0.06013(D2H)0.891 | WB = 0.00652(D2H)1.169 | WL = 0.0044(D2H)0.9919 | H = 8.4834exp(0.0277D) | |
| 8 | WS = 0.02511(D2H)0.927 | WB = 0.00957(D2H)0.974 | WL = 0.8725(D2H)0.2034 | H = 10.6exp(0.0169D) | |
| 9 | WS = 0.2286(D2H)0.6938 | WB = 0.0247(D2H)0.7378 | WL = 0.0108(D2H)0.8181 | Self-established | H = 9.285exp(0.0196D) |
| 10 | WS = 0.3274(D2H)0.7217 | WB = 0.01349(D2H)0.7197 | WL = 0.02347(D2H)0.893 | Self-established | H = 7.0338exp(0.0332D) |
| 11 | WS = 0.03146(D2H)1.032 | WB = 0.007429D2.6745 | WL = 0.002754D2.4965 | H = 8.1427exp(0.0249D) | |
| 12 | WS = 0.07936(D2H)0.901 | WB = 0.014167(D2H)0.764 | WL = 0.01086(D2H)0.847 | Self-established | H = 13.799exp(0.0138D) |
| 13 | WS = 0.14114(D2H)0.723 | WB = 0.00724(D2H)1.0225 | WL = 0.0079(D2H)0.8085 | H = 6.2635exp(0.0334D) | |
| 14 | WS = 0.03141(D2H)0.733 | WB = 0.002127D2.9504 | WL = 0.00321D2.473 5 | H = 8.1877exp(0.0219D) | |
| 15 | WS = 0.01275(D2H)1.009 | WB = 0.00824(D2H)0.975 | WL = 0.00024(D2H)0.991 | H = 7.0889exp(0.0349D) | |
| 16 | WS = 0.1193(D2H)0.8372 | WB = 0.002(D2H)1.12 | WL = 0.000015(D2H)1.47 | H = 9.8065exp(0.0246D) | |
| 17 | WS = 0.2286(D2H)0.6938 | WB = 0.0247(D2H)0.7378 | WL = 0.0108(D2H)0.8181 | H = 12.136exp(0.0133D) |
| 变量 Variable | 相关系数 Correlation coefficient | 变量 Variable | 相关系数 Correlation coefficient | 变量 Variable | 相关系数 Correlation coefficient | |||
|---|---|---|---|---|---|---|---|---|
| 原始波段 Original band | Band1 | -0.029 | 纹理信息 Texture | 对角线方向 diagonal direction | 相异性 Dissimilarity | Dis1 | -0.206 | |
| Band2 | -0.508** | 平均值 Mean | Mean1 | -0.354** | Dis2 | -0.342** | ||
| Band3 | -0.450** | Mean2 | -0.225* | Dis3 | -0.061 | |||
| Band4 | 0.035 | Mean3 | -0.122 | Dis4 | -0.093 | |||
| Band5 | -0.357** | Mean4 | 0.027 | Dis5 | -0.301** | |||
| Band7 | -0.459** | Mean5 | -0.383** | Dis7 | 0.038 | |||
| 波段组合 Band combination | TM73 | 0.100 | Mean7 | -0.323** | 熵 Entropy | Ent1 | -0.233* | |
| TM437 | -0.095 | 方差 Variance | Var1 | -0.250* | Ent2 | -0.342** | ||
| TM452 | 0.511** | Var2 | -0.308** | Ent3 | -0.137 | |||
| TM42 | 0.591** | Var3 | -0.122 | Ent4 | -0.136 | |||
| 差值植被指数 Difference vegetation index (DVI) | 0.121 | Var4 | -0.178 | Ent5 | -0.336** | |||
| 简单比值指数 Simple ratio (SR) | 0.482** | Var5 | -0.305** | Ent7 | -0.017 | |||
| 归一化植被指数 Normalized difference vegetation index (NDVI) | 0.419** | Var7 | -0.062 | 角二阶矩 Angular second moment | Sec1 | 0.230* | ||
| 转换型植被指数 Transformed vegetation index (TVI) | 0.415** | 均一性 Homogeneity | Hom1 | 0.206 | Sec2 | 0.340** | ||
| 垂直植被指数 Perpendicular vegetation index (PVI) | 0.071 | Hom2 | 0.342** | Sec3 | 0.137 | |||
| 红外指数 Infrared index (II) | 0.466** | Hom3 | 0.061 | Sec4 | 0.108 | |||
| 土壤调整植被指数 Soil-adjusted vegetation index (SAVI) | 0.418** | Hom4 | 0.088 | Sec5 | 0.329** | |||
| 优化的简单比值指数 Modified simple ratio (MSR) | 0.469** | Hom5 | 0.301** | Sec7 | 0.019 | |||
| 土壤调整植被指数2 Soil-adjusted vegetation index 2 (SAVI2) | 0.409** | Hom7 | -0.038 | 相关性 Correlation | Cor1 | 0.309** | ||
| 非线性植被指数 Non-linear index (NLI) | 0.330** | 对比度 Contrast | Con1 | -0.206 | Cor2 | 0.366** | ||
| 地学信息 Geographic information | 纵坐标Y Y-coordinate | -0.259* | Con2 | -0.342** | Cor3 | 0.131 | ||
| 横坐标X X-coordinate | -0.231* | Con3 | -0.061 | Cor4 | 0.143 | |||
| 高程 Elevation | 0.598** | Con4 | -0.113 | Cor5 | 0.172 | |||
| 坡向 Slope aspect | -0.280** | Con5 | -0.292** | Cor7 | 0.095 | |||
| 坡度 Slope | -0.125 | Con7 | 0.038 | 郁闭度 Closure | 0.283** | |||
表2 自变量因子与样地生物量的相关系数
Table 2 Correlation coefficients between biomass of plots and independent variables
| 变量 Variable | 相关系数 Correlation coefficient | 变量 Variable | 相关系数 Correlation coefficient | 变量 Variable | 相关系数 Correlation coefficient | |||
|---|---|---|---|---|---|---|---|---|
| 原始波段 Original band | Band1 | -0.029 | 纹理信息 Texture | 对角线方向 diagonal direction | 相异性 Dissimilarity | Dis1 | -0.206 | |
| Band2 | -0.508** | 平均值 Mean | Mean1 | -0.354** | Dis2 | -0.342** | ||
| Band3 | -0.450** | Mean2 | -0.225* | Dis3 | -0.061 | |||
| Band4 | 0.035 | Mean3 | -0.122 | Dis4 | -0.093 | |||
| Band5 | -0.357** | Mean4 | 0.027 | Dis5 | -0.301** | |||
| Band7 | -0.459** | Mean5 | -0.383** | Dis7 | 0.038 | |||
| 波段组合 Band combination | TM73 | 0.100 | Mean7 | -0.323** | 熵 Entropy | Ent1 | -0.233* | |
| TM437 | -0.095 | 方差 Variance | Var1 | -0.250* | Ent2 | -0.342** | ||
| TM452 | 0.511** | Var2 | -0.308** | Ent3 | -0.137 | |||
| TM42 | 0.591** | Var3 | -0.122 | Ent4 | -0.136 | |||
| 差值植被指数 Difference vegetation index (DVI) | 0.121 | Var4 | -0.178 | Ent5 | -0.336** | |||
| 简单比值指数 Simple ratio (SR) | 0.482** | Var5 | -0.305** | Ent7 | -0.017 | |||
| 归一化植被指数 Normalized difference vegetation index (NDVI) | 0.419** | Var7 | -0.062 | 角二阶矩 Angular second moment | Sec1 | 0.230* | ||
| 转换型植被指数 Transformed vegetation index (TVI) | 0.415** | 均一性 Homogeneity | Hom1 | 0.206 | Sec2 | 0.340** | ||
| 垂直植被指数 Perpendicular vegetation index (PVI) | 0.071 | Hom2 | 0.342** | Sec3 | 0.137 | |||
| 红外指数 Infrared index (II) | 0.466** | Hom3 | 0.061 | Sec4 | 0.108 | |||
| 土壤调整植被指数 Soil-adjusted vegetation index (SAVI) | 0.418** | Hom4 | 0.088 | Sec5 | 0.329** | |||
| 优化的简单比值指数 Modified simple ratio (MSR) | 0.469** | Hom5 | 0.301** | Sec7 | 0.019 | |||
| 土壤调整植被指数2 Soil-adjusted vegetation index 2 (SAVI2) | 0.409** | Hom7 | -0.038 | 相关性 Correlation | Cor1 | 0.309** | ||
| 非线性植被指数 Non-linear index (NLI) | 0.330** | 对比度 Contrast | Con1 | -0.206 | Cor2 | 0.366** | ||
| 地学信息 Geographic information | 纵坐标Y Y-coordinate | -0.259* | Con2 | -0.342** | Cor3 | 0.131 | ||
| 横坐标X X-coordinate | -0.231* | Con3 | -0.061 | Cor4 | 0.143 | |||
| 高程 Elevation | 0.598** | Con4 | -0.113 | Cor5 | 0.172 | |||
| 坡向 Slope aspect | -0.280** | Con5 | -0.292** | Cor7 | 0.095 | |||
| 坡度 Slope | -0.125 | Con7 | 0.038 | 郁闭度 Closure | 0.283** | |||
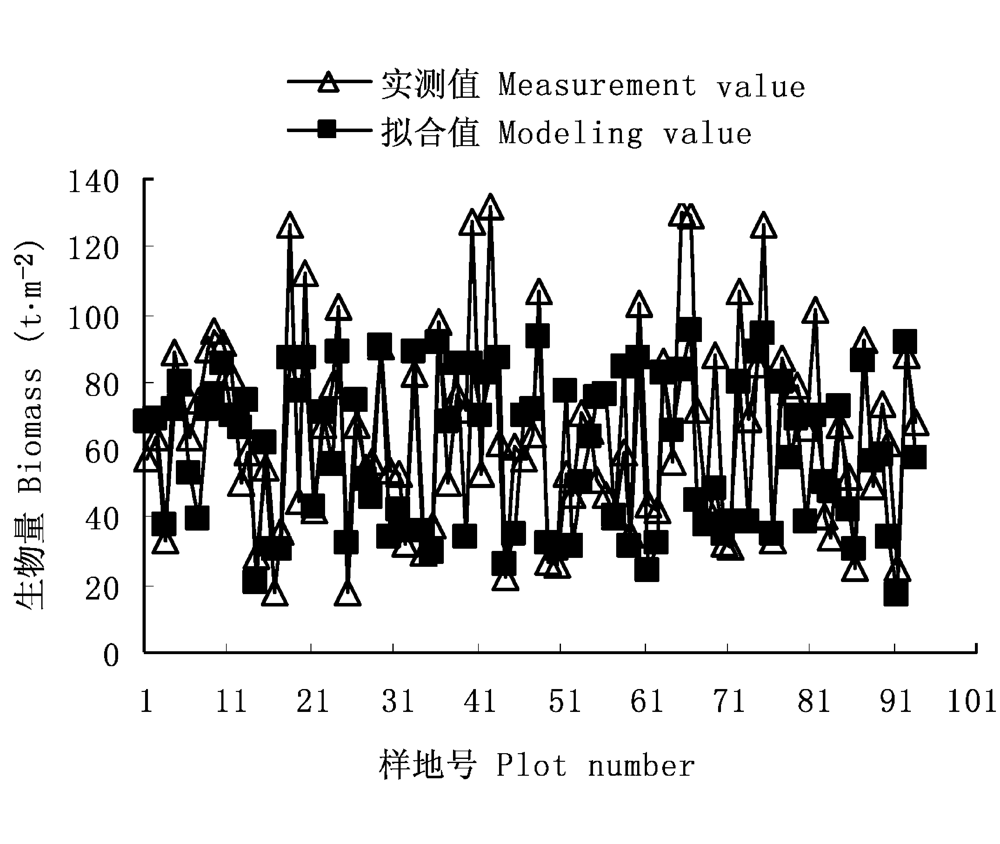
图2 逐步回归法拟合值与真实样地生物量对比。
Fig. 2 Comparison of fitted biomass by regression model and true biomass of plots.
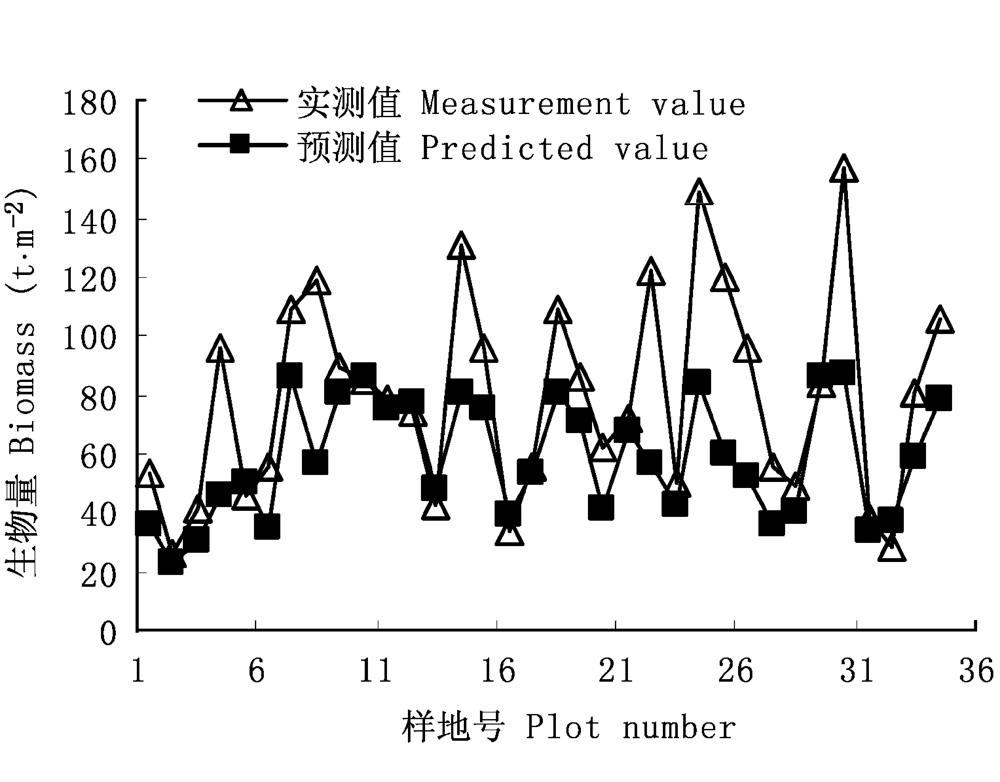
图3 逐步回归法预测值与真实样地生物量对比。
Fig. 3 Comparison of predicted biomass by regression model and true biomass of plots.
| r | R2 | R2adj | SE | Sig. | DW |
|---|---|---|---|---|---|
| 0.887 | 0.788 | 0.776 | 11.57 | 0.000 | 2.054 |
表3 回归模型描述
Table 3 Description of regression model
| r | R2 | R2adj | SE | Sig. | DW |
|---|---|---|---|---|---|
| 0.887 | 0.788 | 0.776 | 11.57 | 0.000 | 2.054 |
| 变量 Variable | Coef_uns | Coef_s | t0.05 | Sig. | VIF |
|---|---|---|---|---|---|
| 常数 Constant | 125.696 8 | 6.211 | 0.000 | ||
| 郁闭度 Closure | 18.692 6 | 0.123 7 | 2.402 | 0.018 | 1.099 |
| 高程 Elevation | 0.024 | 0.134 3 | 2.265 | 0.026 | 1.456 |
| X | -0.000 14 | -0.266 3 | -5.273 | 0.000 | 1.057 |
| Band3 | -0.057 5 | -0.273 1 | -4.258 | 0.000 | 1.704 |
| Cor1 | 0.295 4 | 0.539 5 | 7.903 | 0.000 | 1.931 |
表4 回归模型系数、显著性及共线性检验结果
Table 4 Results of regression model coefficients, significance and collinearity
| 变量 Variable | Coef_uns | Coef_s | t0.05 | Sig. | VIF |
|---|---|---|---|---|---|
| 常数 Constant | 125.696 8 | 6.211 | 0.000 | ||
| 郁闭度 Closure | 18.692 6 | 0.123 7 | 2.402 | 0.018 | 1.099 |
| 高程 Elevation | 0.024 | 0.134 3 | 2.265 | 0.026 | 1.456 |
| X | -0.000 14 | -0.266 3 | -5.273 | 0.000 | 1.057 |
| Band3 | -0.057 5 | -0.273 1 | -4.258 | 0.000 | 1.704 |
| Cor1 | 0.295 4 | 0.539 5 | 7.903 | 0.000 | 1.931 |
图4 传统BP神经网络模型的拟合结果。
Fig. 4 Fitted results of traditional BP neural network model.
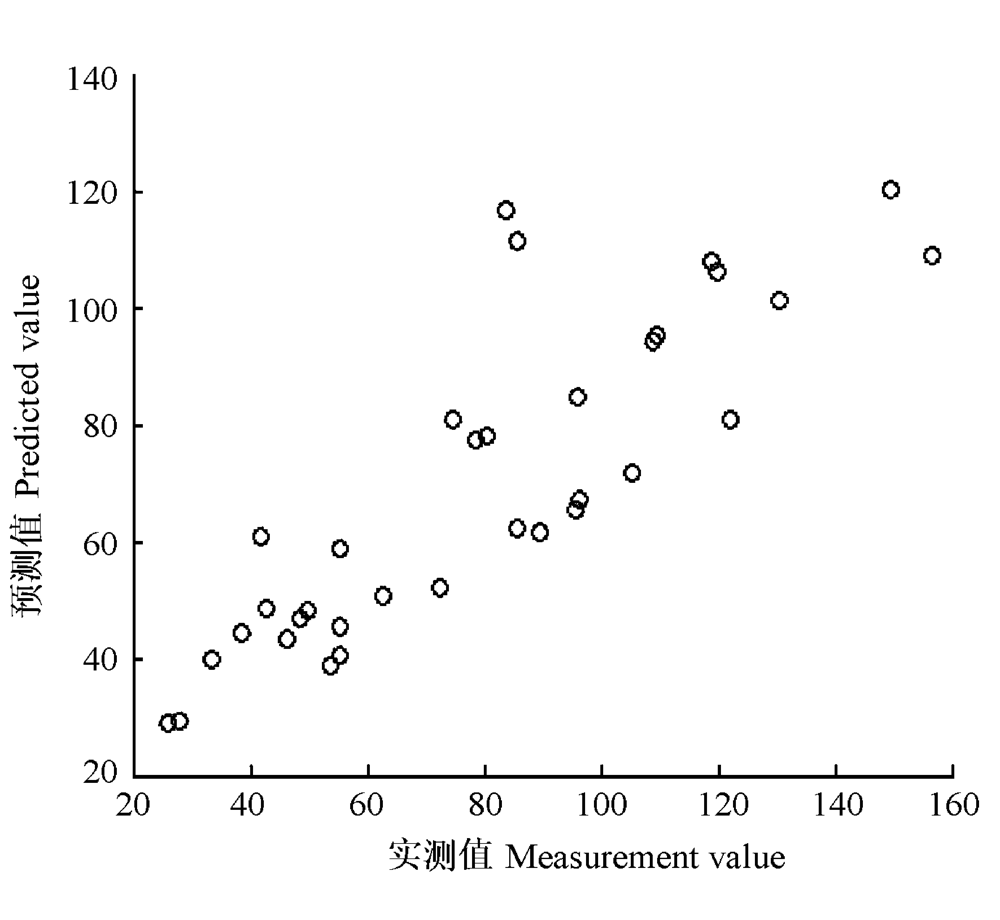
图5 传统BP神经网络模型的预测结果。
Fig. 5 Predicted results of traditional BP neural network model.
图6 Erf-BP的拟合结果。
Fig. 6 Fitted results of Erf-BP.
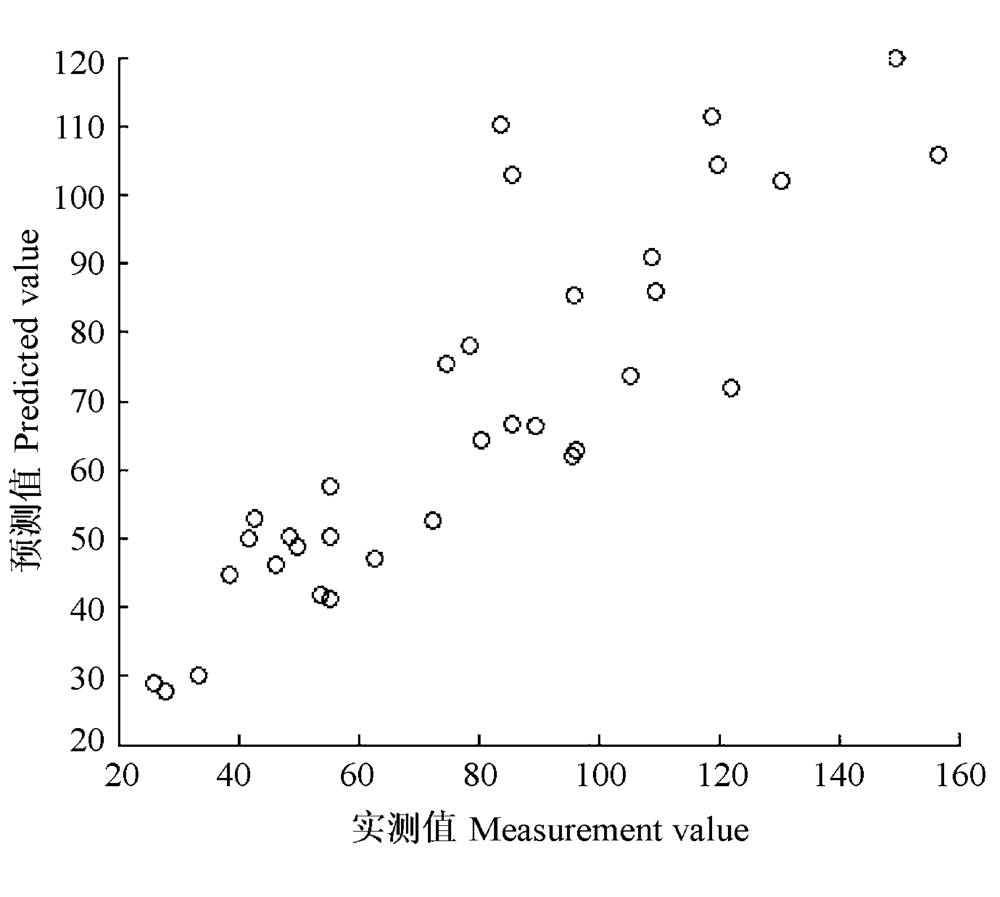
图7 Erf-BP的预测结果。
Fig. 7 Predicted results of Erf-BP.
| 激活函数 Activation function | 最小训练次数 Minimum training times | 最大训练次数 Maximum training times | 平均训练次数 Average training times | 预测平方差和 Squared prediction error |
|---|---|---|---|---|
| Erf-BP | 317 | 359 | 338 | 20.83 |
| 传统BP神经网络模型 Traditonal BP neutral network model | 509 | 723 | 616 | 21.44 |
表5 传统BP神经网络模型与Erf-BP训练结果对比
Table 5 Comparisons of training results by traditional BP neutral network model and Erf-BP
| 激活函数 Activation function | 最小训练次数 Minimum training times | 最大训练次数 Maximum training times | 平均训练次数 Average training times | 预测平方差和 Squared prediction error |
|---|---|---|---|---|
| Erf-BP | 317 | 359 | 338 | 20.83 |
| 传统BP神经网络模型 Traditonal BP neutral network model | 509 | 723 | 616 | 21.44 |
| 建模方法 Modeling method | R2 | 预测精度 PRECISIONmod | 预测精度 PRECISIONpre | 均方根误差 RMSEmod (t·m-2) | 均方根误差 RMSEpre (t·m-2) |
|---|---|---|---|---|---|
| 逐步回归法 Regression | 0.788 | 76.00% | 75.00% | 18.91 | 26.87 |
| Erf-BP | 0.975 | 86.04% | 82.22% | 10.17 | 20.83 |
表6 不同建模方法的精度比较
Table 6 Comparisons of precisions by different models
| 建模方法 Modeling method | R2 | 预测精度 PRECISIONmod | 预测精度 PRECISIONpre | 均方根误差 RMSEmod (t·m-2) | 均方根误差 RMSEpre (t·m-2) |
|---|---|---|---|---|---|
| 逐步回归法 Regression | 0.788 | 76.00% | 75.00% | 18.91 | 26.87 |
| Erf-BP | 0.975 | 86.04% | 82.22% | 10.17 | 20.83 |
| [1] | Brown S, Sathaye J, Canell M, Kauppi PE (1996). Mitigation of carbon emission to the atmosphere by forest management. Commonwealth Forestry Review, 75, 80-91. |
| [2] | Chen CG (陈传国), Zhu JF (朱俊凤) (1989). Northeast Main Forest Biomass Handbook (东北主要林木生物量手册). China Forestry Publishing House, Beijing. (in Chinese) |
| [3] | Ding BY (丁宝永), Sun JH (孙继华) (1989). Studies on biological productivity and nutrient cycling of artificial forest ecosystem of Korean pine. Journal of Northeast Forestry University (东北林业大学学报), 17(Suppl. 2), 18-19. (in Chinese with English abstract) |
| [4] | Efron B (1979). Bootstrap methods: another look at the jackknife. Annals of Statistics, 7, 1-26. |
| [5] | Guo QX (国庆喜), Zhang F (张锋) (2003). Estimation of forest biomass based on remote sensing. Journal of Northeast Forestry University (东北林业大学学报), 31(2), 13-16. (in Chinese with English abstract) |
| [6] | Guo ZH (郭志华), Peng SL (彭少麟), Wang BS (王伯荪) (2002). Estimating forest biomass in western Guangdong using landsat TM data. Acta Ecologica Sinica (生态学报), 22, 1832-1839. (in Chinese with English abstract) |
| [7] | Hall RJ, Skakun RS, Arsenault EJ, Case BS (2006). Modeling forest stand structure attributes using Landsat ETM+ data: application to mapping of aboveground biomass and stand volume. Forest Ecology and Management, 225, 378-390. |
| [8] | Haralick RM (1979). Statistical and structural approaches to texture. Proceeding of the IEEE, 67, 786-804. |
| [9] | Holben B, Tucker CJ, Fan CJ (1980). Spectral assessment of soybean leaf area and leaf biomass. Photogrammetric Engineering and Remote Sensing, 46, 651-656. |
| [10] | Ingram JC, Dawson TP, Whittaker RJ (2005). Mapping tropical forest structure in southeastern Madagascar using remote sensing and artificial neural networks. Remote Sensing of Environment, 94, 491-507. |
| [11] | Jiang H (江洪) (1992). Study on Donglingshan Mountain Deciduous Broadleaved Forest Biomass and NPP Research (东灵山落叶阔叶林森林生物量和NPP的研究). Postdoctoral research report, Institute of Botany, Chinese Academy of Sciences, Beijing. (in Chinese with English abstract) |
| [12] | Lu D, Batistella M (2005). Exploring TM image texture and its relationship with biomass estimation in Rondonia, Brazilian Amazon. Acta Amazonica, 35, 249-257. |
| [13] | Luo TX (罗天祥) (1996). Patterns of Net Primary Productivity for Chinese Major Forest Types and Their Mathematical Models (中国主要森林类型生物生产力格局及其数学模型). PhD dissertation, The Commission for Integrated Survey of Natural Resources, Chinese Academy of Sciences, Beijing. 181-184. (in Chinese with English abstract) |
| [14] | Pang Y (庞勇), Li ZY (李增元), Chen EX (陈尔学), Sun GQ (孙国清) (2005). Lidar remote sensing technology and its application in forestry. Scientia Silvae Sinicae (林业科学), 41(3), 129-136. (in Chinese with English abstract) |
| [15] | Singh KP, Ojha P, Malik A, Jain G (2009). Partial least squares and artificial neural networks modeling for predicting chlorophenol removal from aqueous solution. Chemometrics and Intelligent Laboratory Systems, 99, 150-160. |
| [16] | Tang SZ (唐守正), Zhang HR (张会儒), Xu H (胥辉) (2000). Study on establish and estimate method of compatible biomass model. Scientia Silvae Sinicae (林业科学), 36(1), 19-27. (in Chinese with English abstract) |
| [17] | Wang HW (王惠文), Wu ZB (吴载斌), Meng J (孟洁) (2006). Partial Least-Squares Regression-Linear and Nonlinear Methods (偏最小二乘回归的线性与非线性方法). National Defence Industrial Press, Beijing. 57. (in Chinese) |
| [18] | Xue L (薛立), Yang P (杨鹏) (2004). Summary of research on forest biomass. Journal of Fujian College of Forestry (福建林学院学报), 24, 283-288. (in Chinese with English abstract) |
| [19] | Yang CJ (杨存建), Liu JY (刘纪远), Zhang ZX (张增祥) (2004). Study on the estimation of the tropical forest vegetation biomass by using remote sensing data, meteorological data and topographical data. Geography and Geo-Information Science (地理与地理信息科学), 20(6), 22-25. (in Chinese with English abstract) |
| [20] | Zhang HY (张海燕), Feng TJ (冯天瑾) (2002). A study on BP networks with combined activitation functions. Journal of Ocean University of Qingdao (青岛海洋大学学报), 32, 621-626. (in Chinese with English abstract) |
| [21] | Zeng WH (曾文华) (2006). Texture Information Extraction in Remote Sensing Imageries with Gray Level Co-occurrence Matrix and Wavelet Transform (基于灰度共生法和小波变换的遥感影像纹理信息提取). PhD dissertation, Northeast Normal University, Changchun. 11-14. (in Chinese with English abstract) |
| [1] | 王袼, 胡姝娅, 李阳, 陈晓鹏, 李红玉, 董宽虎, 何念鹏, 王常慧. 不同类型草原土壤净氮矿化速率的温度敏感性[J]. 植物生态学报, 2024, 48(4): 523-533. |
| [2] | 梁逸娴, 王传宽, 臧妙涵, 上官虹玉, 刘逸潇, 全先奎. 落叶松径向生长和生物量分配对气候变暖的响应[J]. 植物生态学报, 2024, 48(4): 459-468. |
| [3] | 黄玲, 王榛, 马泽, 杨发林, 李岚, SEREKPAYEV Nurlan, NOGAYEV Adilbek, 侯扶江. 长期放牧和氮添加对黄土高原典型草原长芒草种群生长的影响[J]. 植物生态学报, 2024, 48(3): 317-330. |
| [4] | 耿雪琪, 唐亚坤, 王丽娜, 邓旭, 张泽凌, 周莹. 氮添加增加中国陆生植物生物量并降低其氮利用效率[J]. 植物生态学报, 2024, 48(2): 147-157. |
| [5] | 李娜, 唐士明, 郭建英, 田茹, 王姗, 胡冰, 罗永红, 徐柱文. 放牧对内蒙古草地植物群落特征影响的meta分析[J]. 植物生态学报, 2023, 47(9): 1256-1269. |
| [6] | 赵艳超, 陈立同. 土壤养分对青藏高原高寒草地生物量响应增温的调节作用[J]. 植物生态学报, 2023, 47(8): 1071-1081. |
| [7] | 苏炜, 陈平, 吴婷, 刘岳, 宋雨婷, 刘旭军, 刘菊秀. 氮添加与干季延长对降香黄檀幼苗非结构性碳水化合物、养分与生物量的影响[J]. 植物生态学报, 2023, 47(8): 1094-1104. |
| [8] | 李冠军, 陈珑, 余雯静, 苏亲桂, 吴承祯, 苏军, 李键. 固体培养内生真菌对土壤盐胁迫下木麻黄幼苗渗透调节和抗氧化系统的影响[J]. 植物生态学报, 2023, 47(6): 804-821. |
| [9] | 罗娜娜, 盛茂银, 王霖娇, 石庆龙, 何宇. 长期植被恢复对中国西南喀斯特石漠化土壤活性有机碳组分含量和酶活性的影响[J]. 植物生态学报, 2023, 47(6): 867-881. |
| [10] | 杜英东, 袁相洋, 冯兆忠. 不同形态氮对杨树光合特性及生长的影响[J]. 植物生态学报, 2023, 47(3): 348-360. |
| [11] | 和璐璐, 张萱, 章毓文, 王晓霞, 刘亚栋, 刘岩, 范子莹, 何远洋, 席本野, 段劼. 辽东山区不同坡向长白落叶松人工林树冠特征与林木生长关系[J]. 植物生态学报, 2023, 47(11): 1523-1539. |
| [12] | 刘艳杰, 刘玉龙, 王传宽, 王兴昌. 东北温带森林5个羽状复叶树种叶成本-效益关系比较[J]. 植物生态学报, 2023, 47(11): 1540-1550. |
| [13] | 郝晴, 黄昌. 森林地上生物量遥感估算研究综述[J]. 植物生态学报, 2023, 47(10): 1356-1374. |
| [14] | 李变变, 张凤华, 赵亚光, 孙秉楠. 不同刈割程度对油莎豆非结构性碳水化合物代谢及生物量的影响[J]. 植物生态学报, 2023, 47(1): 101-113. |
| [15] | 袁春阳, 李济宏, 韩鑫, 洪宗文, 刘宣, 杜婷, 游成铭, 李晗, 谭波, 徐振锋. 树种对土壤微生物生物量碳氮的影响: 同质园实验[J]. 植物生态学报, 2022, 46(8): 882-889. |
| 阅读次数 | ||||||
|
全文 |
|
|||||
|
摘要 |
|
|||||
Copyright © 2022 版权所有 《植物生态学报》编辑部
地址: 北京香山南辛村20号, 邮编: 100093
Tel.: 010-62836134, 62836138; Fax: 010-82599431; E-mail: apes@ibcas.ac.cn, cjpe@ibcas.ac.cn
备案号: 京ICP备16067583号-19