
植物生态学报 ›› 2009, Vol. 33 ›› Issue (5): 842-851.DOI: 10.3773/j.issn.1005-264x.2009.05.002
张斌, 张金屯*( ), 苏日古嘎, 张钦弟, 程佳佳, 田世广
收稿日期:2009-04-03
修回日期:2009-06-21
出版日期:2009-04-03
发布日期:2009-09-30
通讯作者:
张金屯
作者简介:*(zhangjintun@yahoo.com.cn,Zhangjt@bnu.edu.cn)基金资助:
ZHANG Bin, ZHANG Jin-Tun*(), Suriguga, ZHANG Qin-Di, CHENG Jia-Jia, TIAN Shi-Guang
Received:2009-04-03
Revised:2009-06-21
Online:2009-04-03
Published:2009-09-30
Contact:
ZHANG Jin-Tun
摘要:
采用协惯量分析(PCA-CA COIA)和典范对应分析(CCA)两种排序方法, 对北京小龙门林场的黄檗 (Phellodendron amurense)群落进行了分析, 并用Spearman秩相关系数检验了对应排序轴的相关性。两种排序方法得出的结果基本一致, 两者的第一排序轴都反映了海拔高度和坡向对群落分布的影响, 而各自第二、第三排序轴所代表的环境意义有所差异, 并出现了交叉, 但是两者的前3个排序轴均反映了海拔、坡位、土壤厚度和凋落物层厚度的变化趋势, 说明在环境因子个数较少或共线性效应不明显的情况下, 协惯量分析也能达到CCA的分析效果, 并且在排序轴特征值解释量上高于典范对应分析。
张斌, 张金屯, 苏日古嘎, 张钦弟, 程佳佳, 田世广. 协惯量分析与典范对应分析在植物群落排序中的应用比较. 植物生态学报, 2009, 33(5): 842-851. DOI: 10.3773/j.issn.1005-264x.2009.05.002
ZHANG Bin, ZHANG Jin-Tun, Suriguga, ZHANG Qin-Di, CHENG Jia-Jia, TIAN Shi-Guang. A COMPARISON OF CO-INERTIA ANALYSIS AND CANONICAL CORRESPONDENCE ANALYSIS IN PLANT COMMUNITY ORDINATION. Chinese Journal of Plant Ecology, 2009, 33(5): 842-851. DOI: 10.3773/j.issn.1005-264x.2009.05.002
| 排序轴 Ordination axis | ||||||||
|---|---|---|---|---|---|---|---|---|
| 1 | 2 | 3 | 4 | 5 | 6 | 典范特征值之和 Sum of all canonical eigenvalues | ||
| 特征值 Eigenvalues | CCA | 0.248 | 0.155 | 0.124 | 0.063 | ab. | ab. | 0.679 |
| PCA-CA COIA | 0.616 9 | 0.353 9 | 0.192 8 | 0.067 3 | 0.056 8 | 0.049 8 | 1.337 5 | |
| CCA (未降偶见种权重) (No downweighting of rare species) | 0.278 | 0.24 | 0.165 | 0.133 | ab. | ab. | 0.969 | |
| 对物种-环境关系方差解释的累计百分比 (%) The cumulative percentage variance of species-environment relation (%) | CCA | 36.6 | 59.4 | 77.7 | 87.0 | ab. | ab. | |
| PCA-CA COIA | 46.1 | 72.6 | 87.0 | 92.0 | 96.3 | 100.0 | ||
| CCA (未降偶见种权重) (No downweighting of rare species) | 28.7 | 53.6 | 70.6 | 84.4 | ab. | ab. | ||
表1 各排序轴的特征值及对物种-环境关系解释的累计百分比
Table 1 Eigenvalues of the ordination axes and the cumulative percentage variance of species-environment relation explained by ordination axes
| 排序轴 Ordination axis | ||||||||
|---|---|---|---|---|---|---|---|---|
| 1 | 2 | 3 | 4 | 5 | 6 | 典范特征值之和 Sum of all canonical eigenvalues | ||
| 特征值 Eigenvalues | CCA | 0.248 | 0.155 | 0.124 | 0.063 | ab. | ab. | 0.679 |
| PCA-CA COIA | 0.616 9 | 0.353 9 | 0.192 8 | 0.067 3 | 0.056 8 | 0.049 8 | 1.337 5 | |
| CCA (未降偶见种权重) (No downweighting of rare species) | 0.278 | 0.24 | 0.165 | 0.133 | ab. | ab. | 0.969 | |
| 对物种-环境关系方差解释的累计百分比 (%) The cumulative percentage variance of species-environment relation (%) | CCA | 36.6 | 59.4 | 77.7 | 87.0 | ab. | ab. | |
| PCA-CA COIA | 46.1 | 72.6 | 87.0 | 92.0 | 96.3 | 100.0 | ||
| CCA (未降偶见种权重) (No downweighting of rare species) | 28.7 | 53.6 | 70.6 | 84.4 | ab. | ab. | ||
| CCA | PCA-CA COIA | ||||||||
|---|---|---|---|---|---|---|---|---|---|
| 排序轴 Ordination axis | 排序轴 Ordination axis | ||||||||
| 1 | 2 | 3 | 4 | 1 | 2 | 3 | 4 | ||
| 海拔 ELE | -0. 821 2 | -0.191 3 | -0.197 0 | -0.458 8 | -0.625 0 | -0.141 0 | -0.280 9 | -0.131 8 | |
| 坡向 ASP | 0.614 2 | -0.493 5 | 0.202 7 | -0.278 4 | 0.553 2 | -0.195 0 | -0.301 8 | -0.039 2 | |
| 坡位 POS | 0.492 6 | 0.264 6 | -0.786 0 | -0.243 0 | 0.287 8 | 0.748 0 | -0.060 6 | 0.317 2 | |
| 坡度 SLO | -0.417 8 | 0.215 3 | -0.050 0 | 0.072 0 | -0.339 0 | -0.012 0 | 0.131 3 | 0.821 9 | |
| 土壤厚度 ST | -0.410 0 | 0.242 1 | -0.541 0 | 0.198 7 | -0.313 0 | 0.609 6 | 0.068 1 | -0.436 6 | |
| 凋落物层厚度 LT | -0.097 0 | -0.612 4 | -0.687 0 | 0.352 4 | -0.083 0 | 0.103 8 | -0.896 9 | 0.120 2 | |
表2 环境因子与典范对应分析(CCA)、协惯量分析(COIA)前4排序轴的相关系数
Table 2 Correlation coefficients of canonical correspondence analysis (CCA) and co-inertia analysis (COIA) ordination axes with environmental variables
| CCA | PCA-CA COIA | ||||||||
|---|---|---|---|---|---|---|---|---|---|
| 排序轴 Ordination axis | 排序轴 Ordination axis | ||||||||
| 1 | 2 | 3 | 4 | 1 | 2 | 3 | 4 | ||
| 海拔 ELE | -0. 821 2 | -0.191 3 | -0.197 0 | -0.458 8 | -0.625 0 | -0.141 0 | -0.280 9 | -0.131 8 | |
| 坡向 ASP | 0.614 2 | -0.493 5 | 0.202 7 | -0.278 4 | 0.553 2 | -0.195 0 | -0.301 8 | -0.039 2 | |
| 坡位 POS | 0.492 6 | 0.264 6 | -0.786 0 | -0.243 0 | 0.287 8 | 0.748 0 | -0.060 6 | 0.317 2 | |
| 坡度 SLO | -0.417 8 | 0.215 3 | -0.050 0 | 0.072 0 | -0.339 0 | -0.012 0 | 0.131 3 | 0.821 9 | |
| 土壤厚度 ST | -0.410 0 | 0.242 1 | -0.541 0 | 0.198 7 | -0.313 0 | 0.609 6 | 0.068 1 | -0.436 6 | |
| 凋落物层厚度 LT | -0.097 0 | -0.612 4 | -0.687 0 | 0.352 4 | -0.083 0 | 0.103 8 | -0.896 9 | 0.120 2 | |
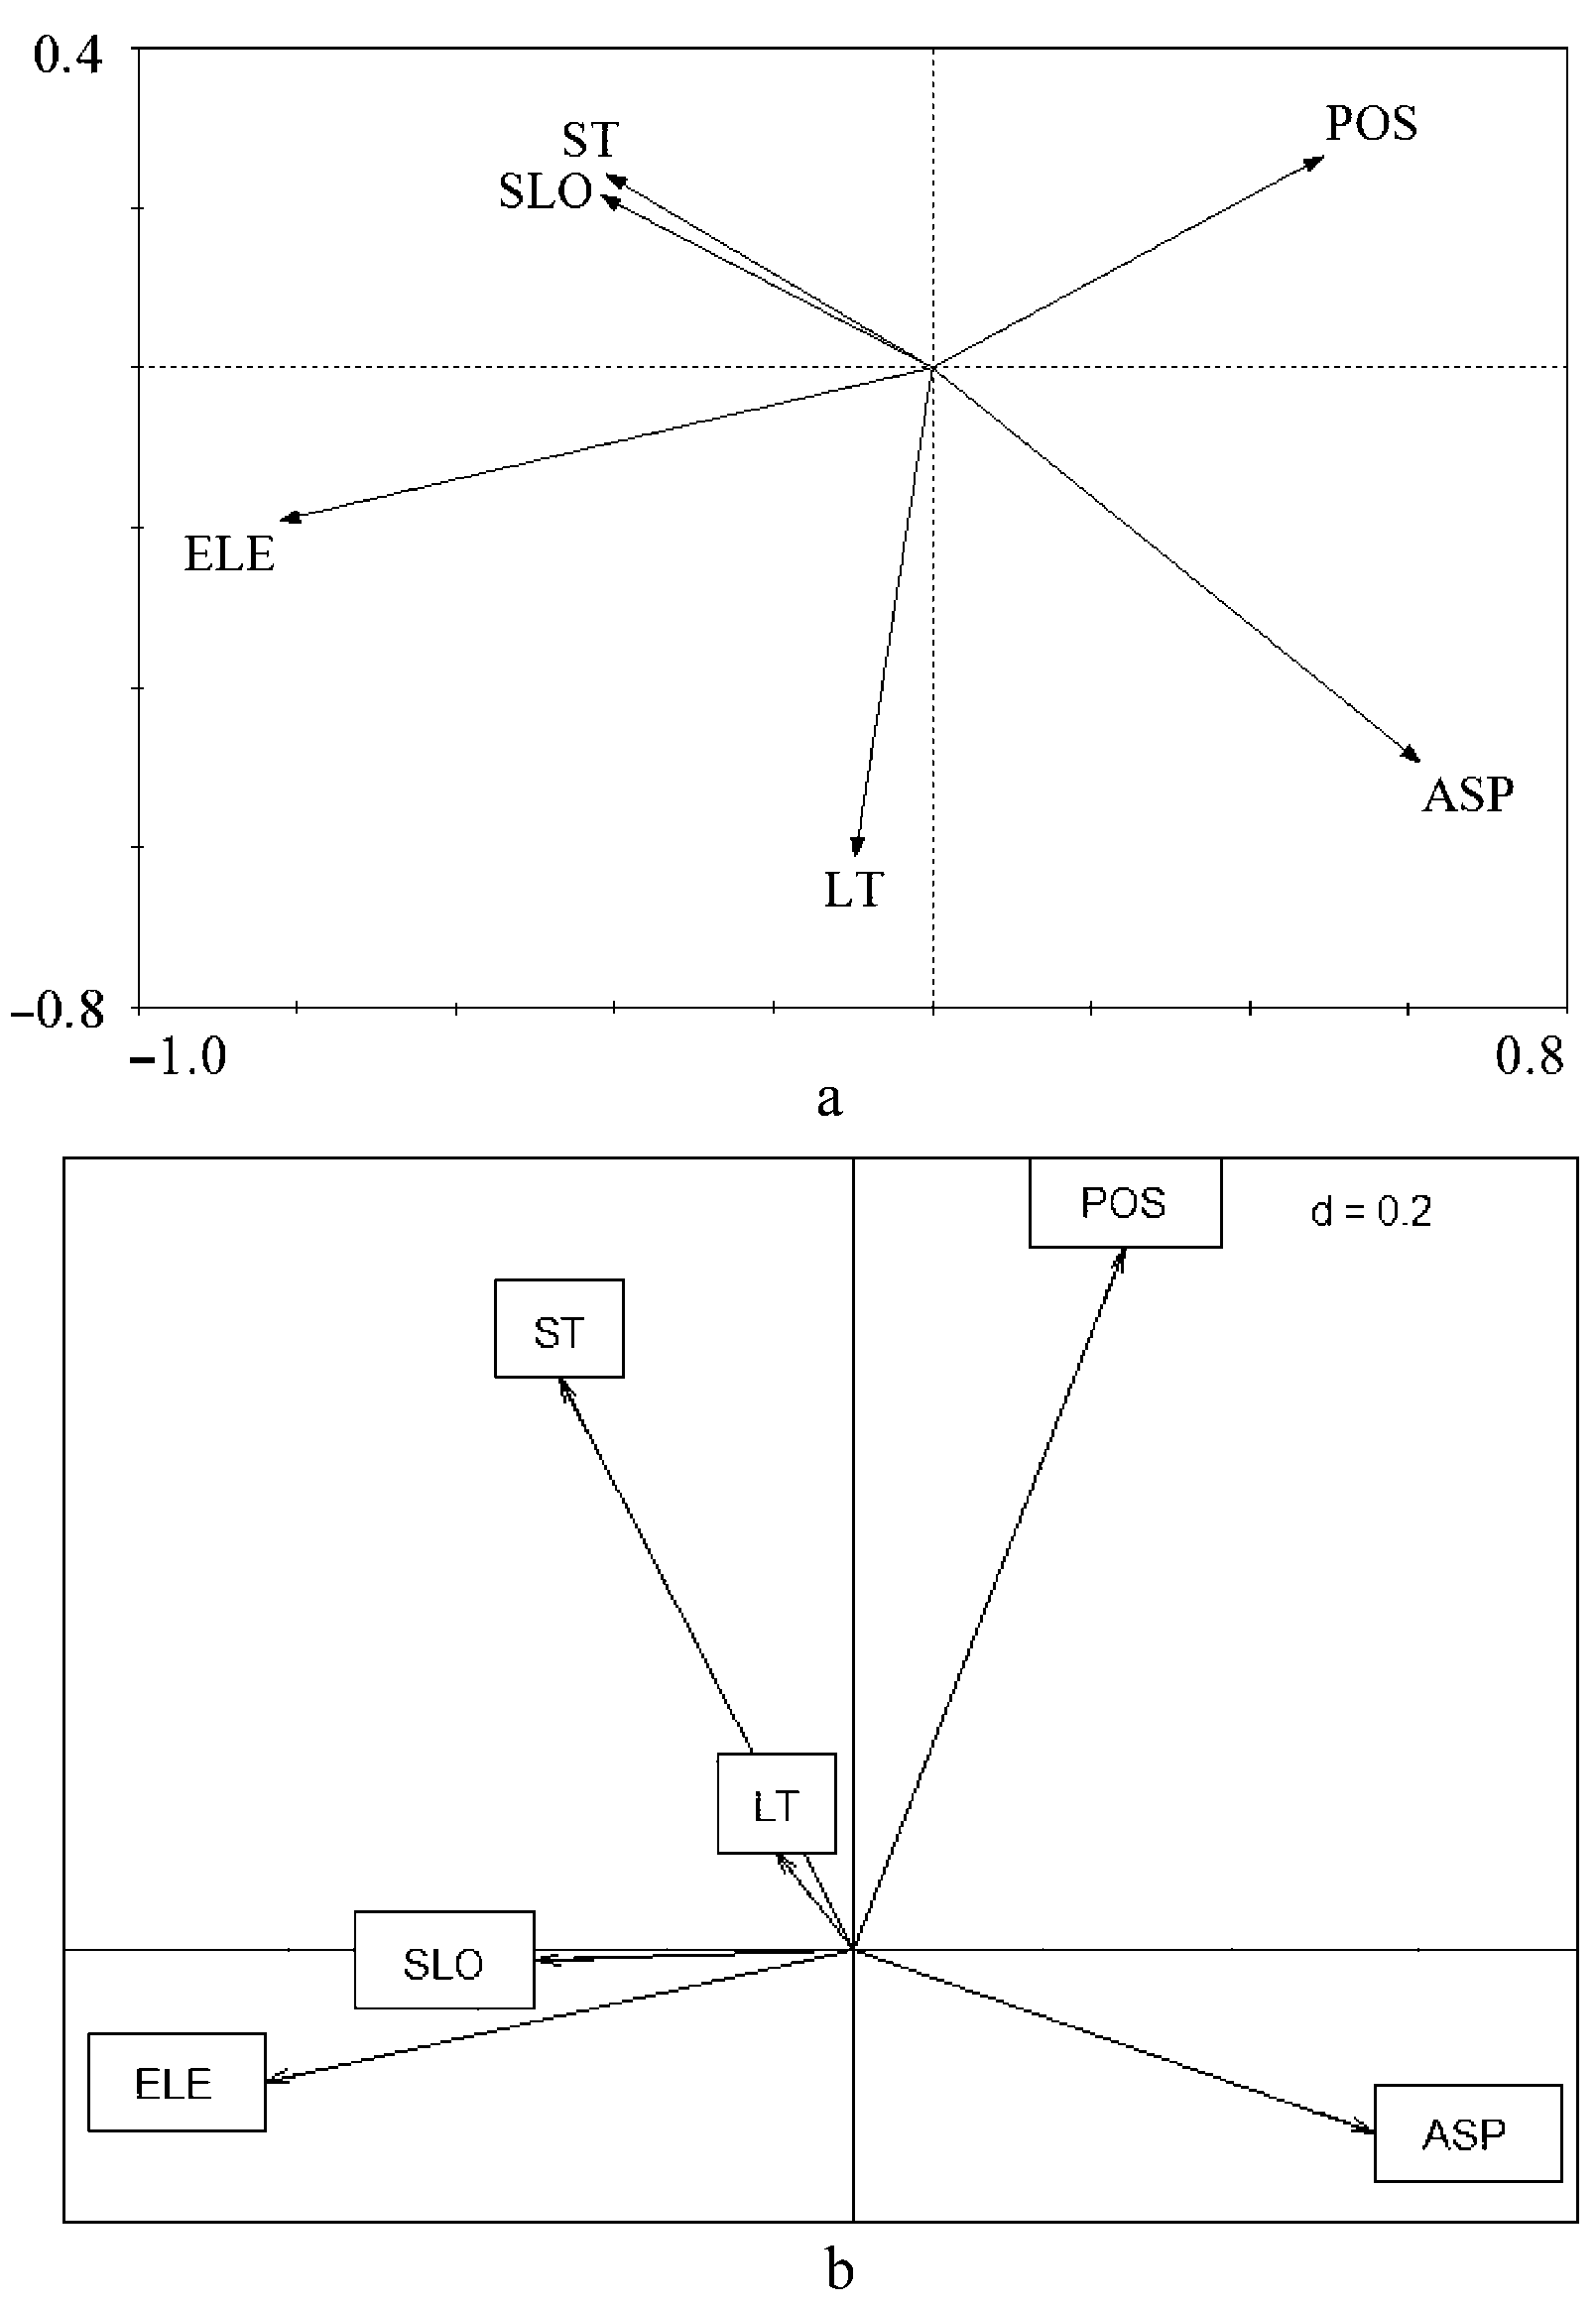
图1 两种排序方法得出的环境因子排序图(示第一和第二排序轴) a: CCA b: PCA-CA COIA ASP、ELE、LT、POS、SLO、ST: 同表2 See Table 2
Fig. 1 Ordination diagrams of environmental variables in CCA and COIA (for axes 1 and 2)
| CCA排序轴 Ordination axis of CCA | PCA-CA COIA排序轴 Ordination axis of PCA-CA COIA | |||||
|---|---|---|---|---|---|---|
| 1 | 2 | 3 | 4 | |||
| 基于环境变量坐标值 Based on the scores of environmental variables | 1 | 1.000** | 0.086 | -0.429 | 0.143 | |
| 2 | -0.086 | 0.657 | 0.771 | 0.086 | ||
| 3 | -0.086 | -0.886* | 0.086 | -0.086 | ||
| 4 | 0.086 | 0.543 | 0.029 | 0.143 | ||
| 基于物种数据得到的样方坐标值 Based on the sample scores from species data—a | 1 | 0.945** | 0.335 | 0.058 | 0.203 | |
| 2 | -0.049 | 0.378 | 0.884** | 0.032 | ||
| 3 | 0.005 | -0.808** | 0.441* | -0.253 | ||
| 4 | -0.044 | 0.031 | 0.044 | -0.208 | ||
| 基于环境数据得到的样方坐标值 Based on the sample scores from environment data—b | 1 | 0.874** | 0.236 | 0.008 | -0.195 | |
| 2 | 0.030 | 0.248 | 0.802** | 0.172 | ||
| 3 | 0.125 | -0.888** | 0.587** | -0.025 | ||
| 4 | -0.284 | 0.019 | -0.099 | -0.029 | ||
| 基于物种坐标值 Based on the species scores | 1 | 0.519** | 0.172 | 0.422** | -0.027 | |
| 2 | 0.034 | -0.150 | 0.650** | 0.053 | ||
| 3 | -0.125 | -0.407** | 0.149 | -0.087 | ||
| 4 | -0.201* | -0.031 | 0.038 | 0.046 | ||
表3 典范对应分析(CCA)和协惯量分析(COIA)前4排序轴的Spearman秩相关系数
Table 3 Spearman’s rho correlation of the first four ordination axes between canonical correspondence analysis (CCA) and co-inertia analysis (COIA)
| CCA排序轴 Ordination axis of CCA | PCA-CA COIA排序轴 Ordination axis of PCA-CA COIA | |||||
|---|---|---|---|---|---|---|
| 1 | 2 | 3 | 4 | |||
| 基于环境变量坐标值 Based on the scores of environmental variables | 1 | 1.000** | 0.086 | -0.429 | 0.143 | |
| 2 | -0.086 | 0.657 | 0.771 | 0.086 | ||
| 3 | -0.086 | -0.886* | 0.086 | -0.086 | ||
| 4 | 0.086 | 0.543 | 0.029 | 0.143 | ||
| 基于物种数据得到的样方坐标值 Based on the sample scores from species data—a | 1 | 0.945** | 0.335 | 0.058 | 0.203 | |
| 2 | -0.049 | 0.378 | 0.884** | 0.032 | ||
| 3 | 0.005 | -0.808** | 0.441* | -0.253 | ||
| 4 | -0.044 | 0.031 | 0.044 | -0.208 | ||
| 基于环境数据得到的样方坐标值 Based on the sample scores from environment data—b | 1 | 0.874** | 0.236 | 0.008 | -0.195 | |
| 2 | 0.030 | 0.248 | 0.802** | 0.172 | ||
| 3 | 0.125 | -0.888** | 0.587** | -0.025 | ||
| 4 | -0.284 | 0.019 | -0.099 | -0.029 | ||
| 基于物种坐标值 Based on the species scores | 1 | 0.519** | 0.172 | 0.422** | -0.027 | |
| 2 | 0.034 | -0.150 | 0.650** | 0.053 | ||
| 3 | -0.125 | -0.407** | 0.149 | -0.087 | ||
| 4 | -0.201* | -0.031 | 0.038 | 0.046 | ||
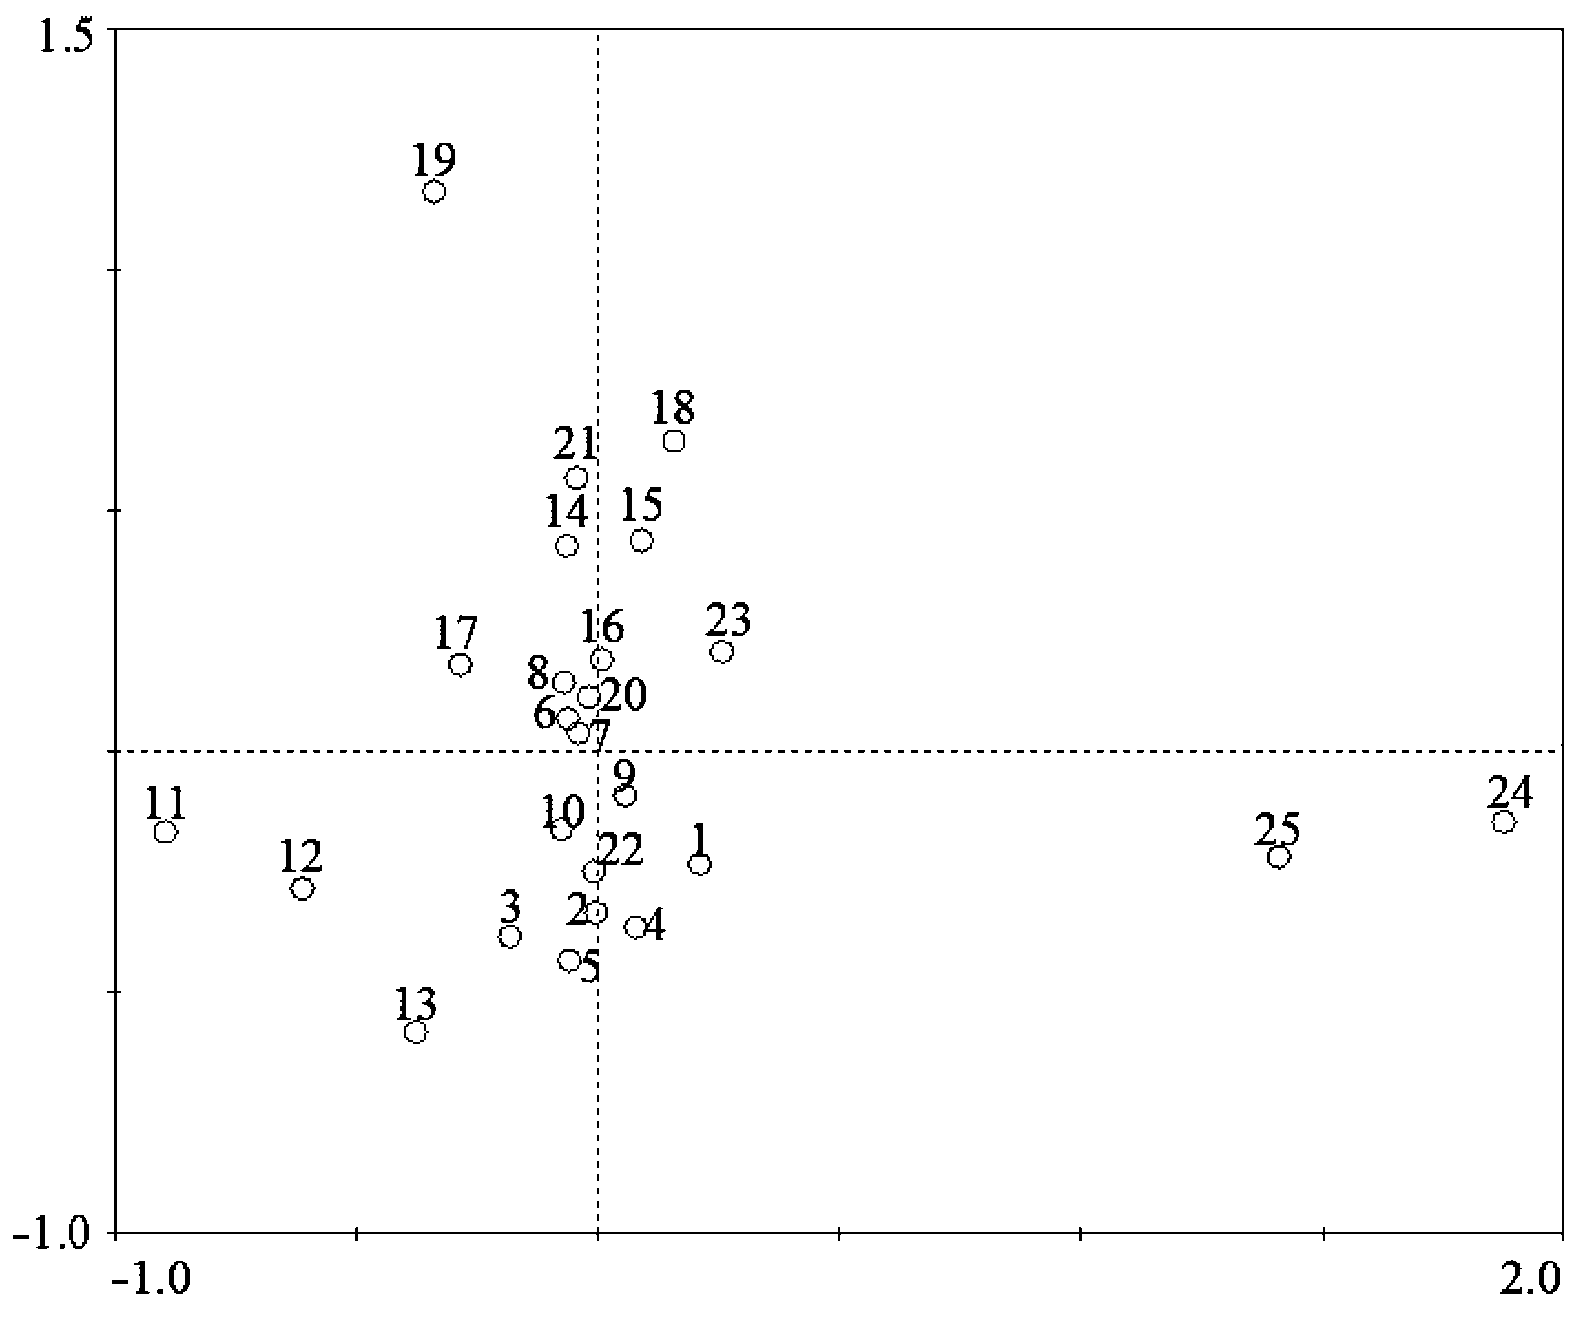
图2 CCA的样方排序图(示第一和第二排序轴)
Fig. 2 CCA ordination diagram of samples (for axes 1 and 2)
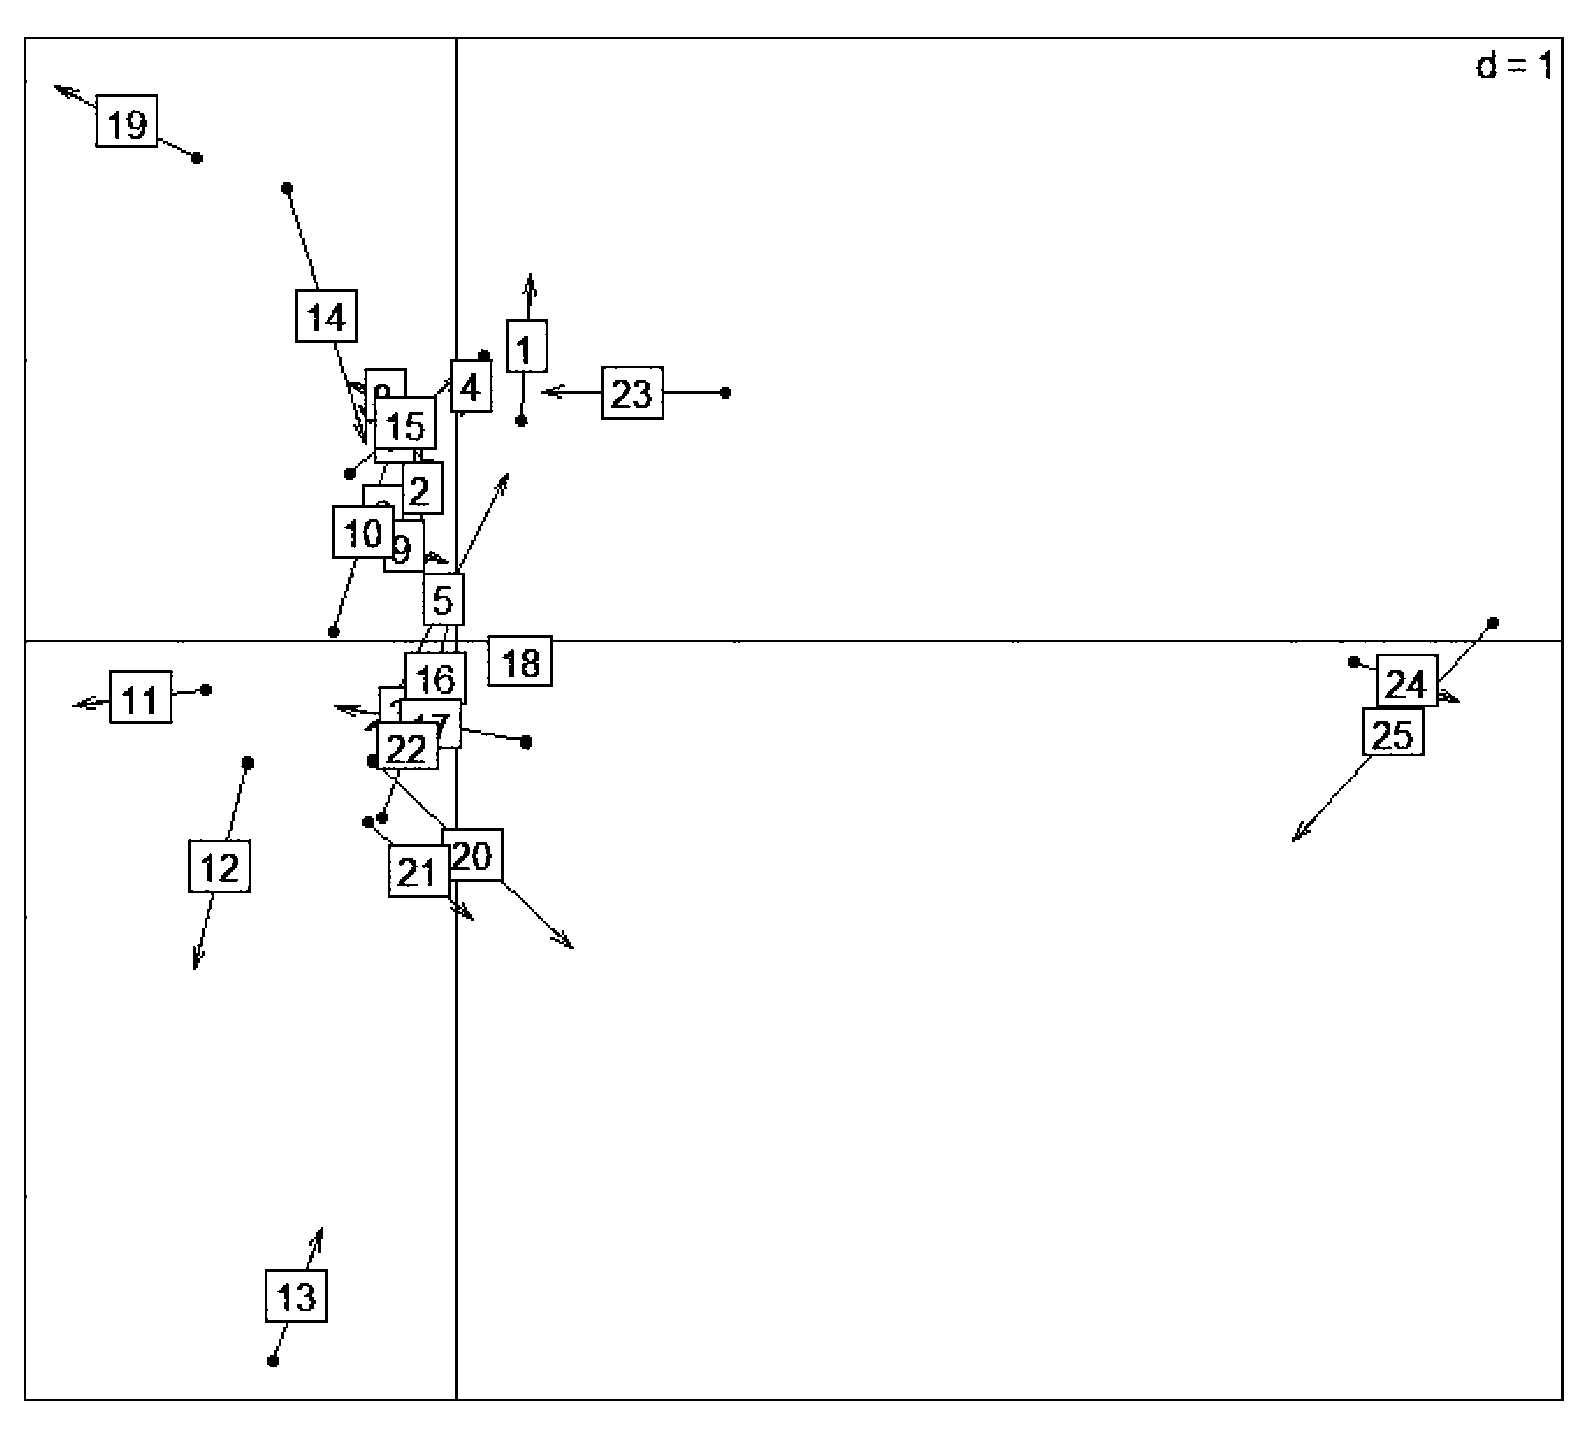
图3 依据物种变量和环境变量共同确定的样方在协惯量平面的位置(示第一和第二排序轴) 箭头头部表示由环境变量所确定的样方位置, 箭头尾部表示由物种变量所确定的样方位置 The arrow head mark the position of sample according to the environmental table ordination and the end of the arrow indicate its position according to vegetation ordination
Fig. 3 Sampling sites distribution in the co-inertia plane (for axes 1 and 2)
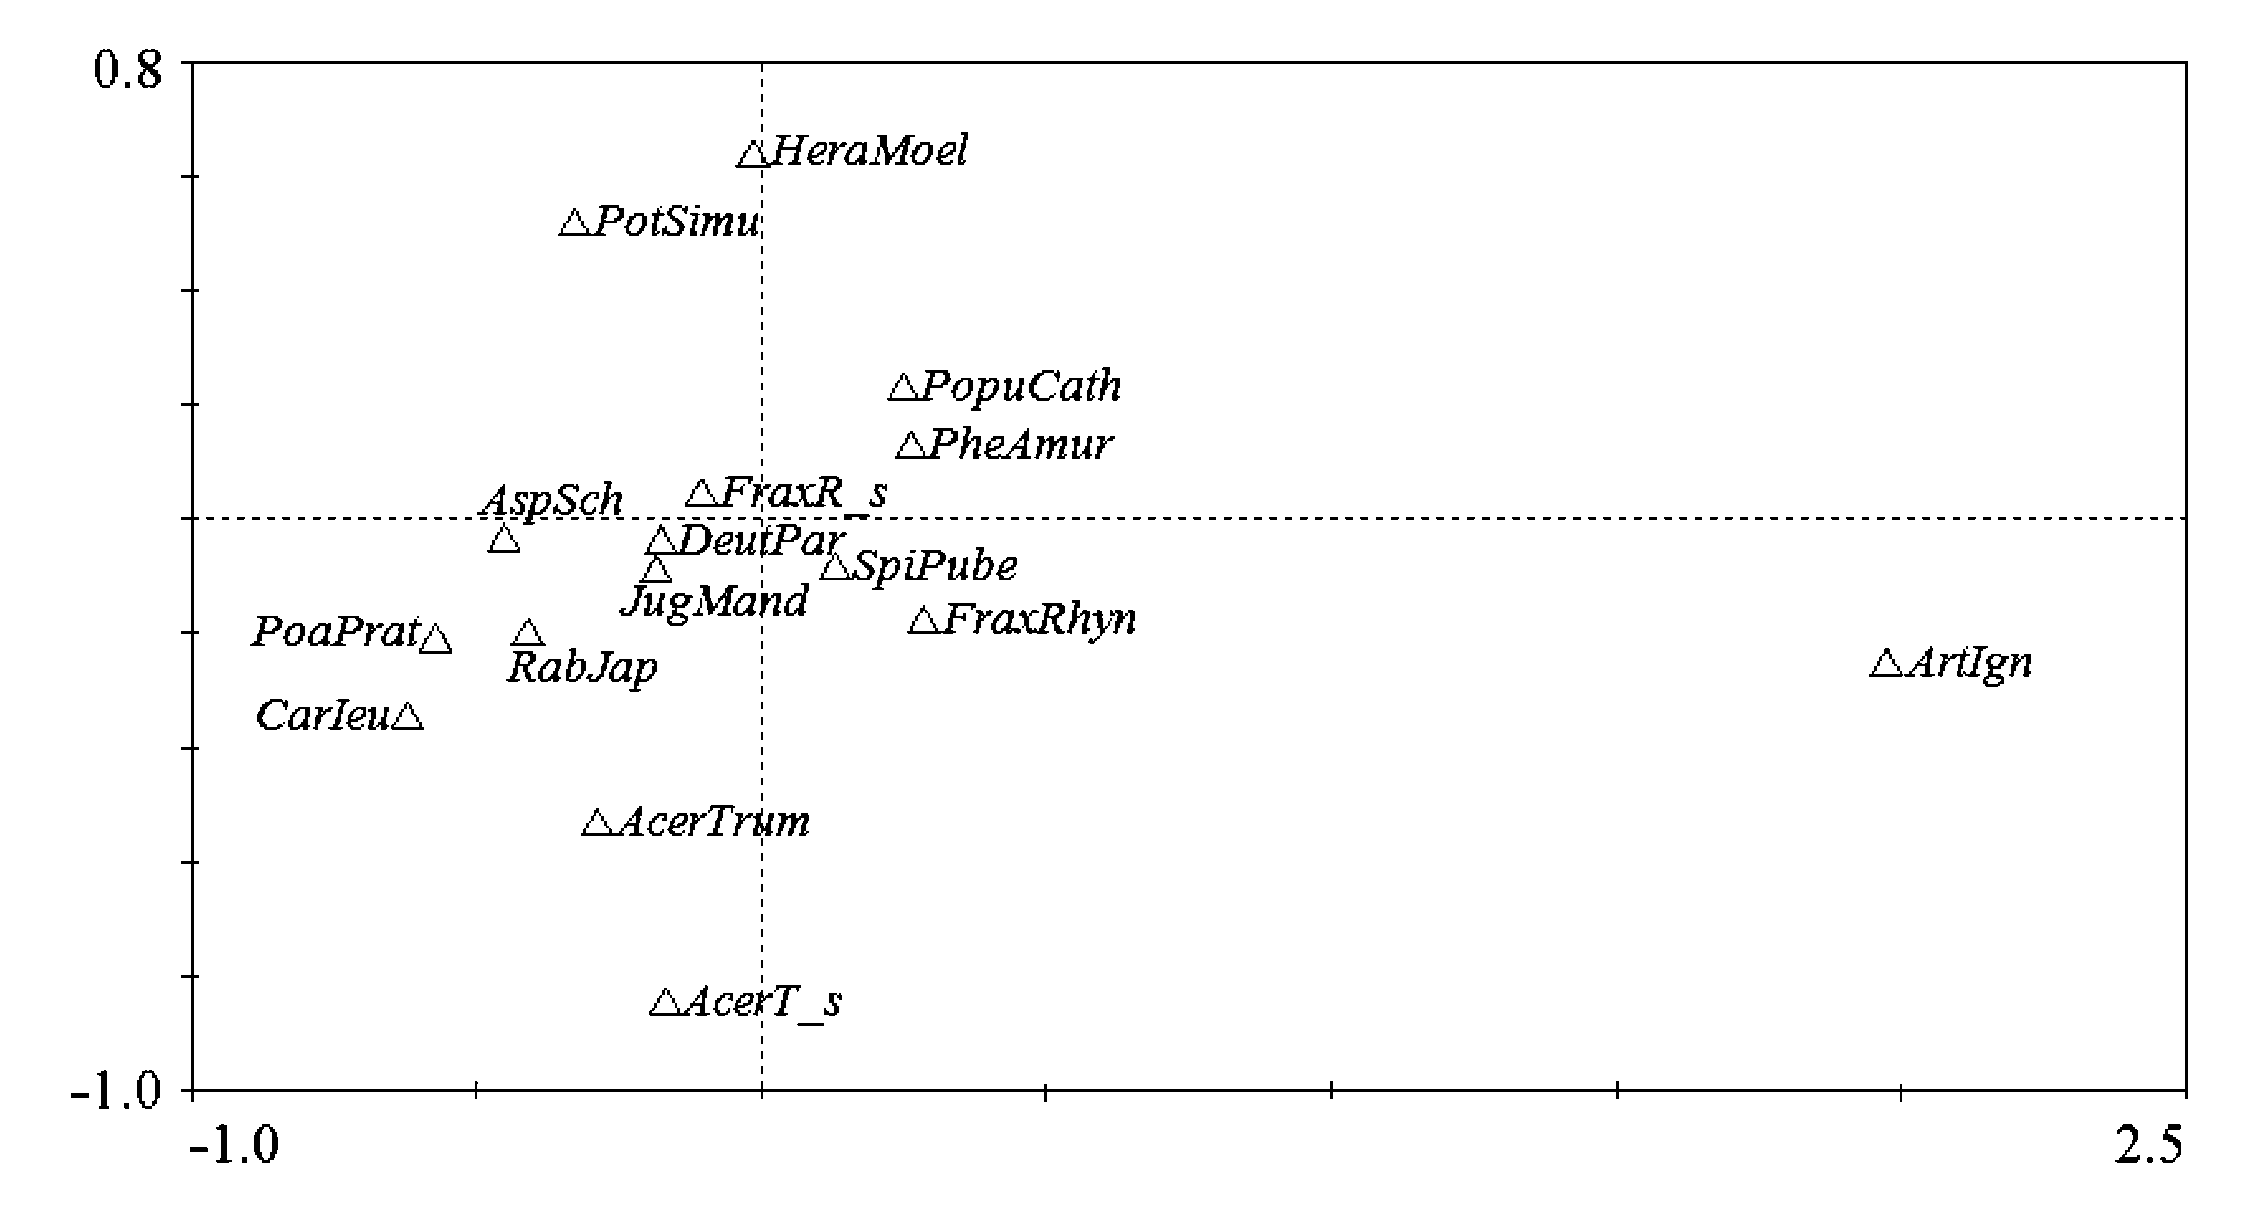
图4 典范对应分析(CCA)的物种排序图 图中只列出了物种加权值(Species weight)大于5%的物种 Only species with the weight over 5% are shown FraxRhyn: 大叶白蜡 Fraxinus rhynchophylla JugMand: 胡桃楸 Juglans mandshurica PheAmur: 黄檗 Phellodendron amurense PopuCath: 青杨 Populus cathayana AcerTrum: 元宝枫 Acer truncatum SpiPube: 土庄绣线菊 Spiraea pubescens DeutPar: 小花溲疏 Deutzia parviflora AcerT_s: 元宝枫(灌木) Acer truncatum (shrub) FraxR_s: 大叶白蜡(灌木) Fraxinus rhynchophylla (shrub) CarIeu: 白花碎米荠 Cardamine leucantha PotSimu: 等齿委陵菜 Potentilla simulatrix HeraMoel: 短毛独活 Heracleum moellendorffii ArtIgn: 歧茎蒿 Artemisia igniaria PoaPrat: 草地早熟禾 Poa pratensis RabJap: 蓝萼香茶菜 Rabdosia japonica AspSch: 龙须菜 Asparagus schoberioides
Fig. 4 Canonical correspondence analysis (CCA) ordination diagram of species
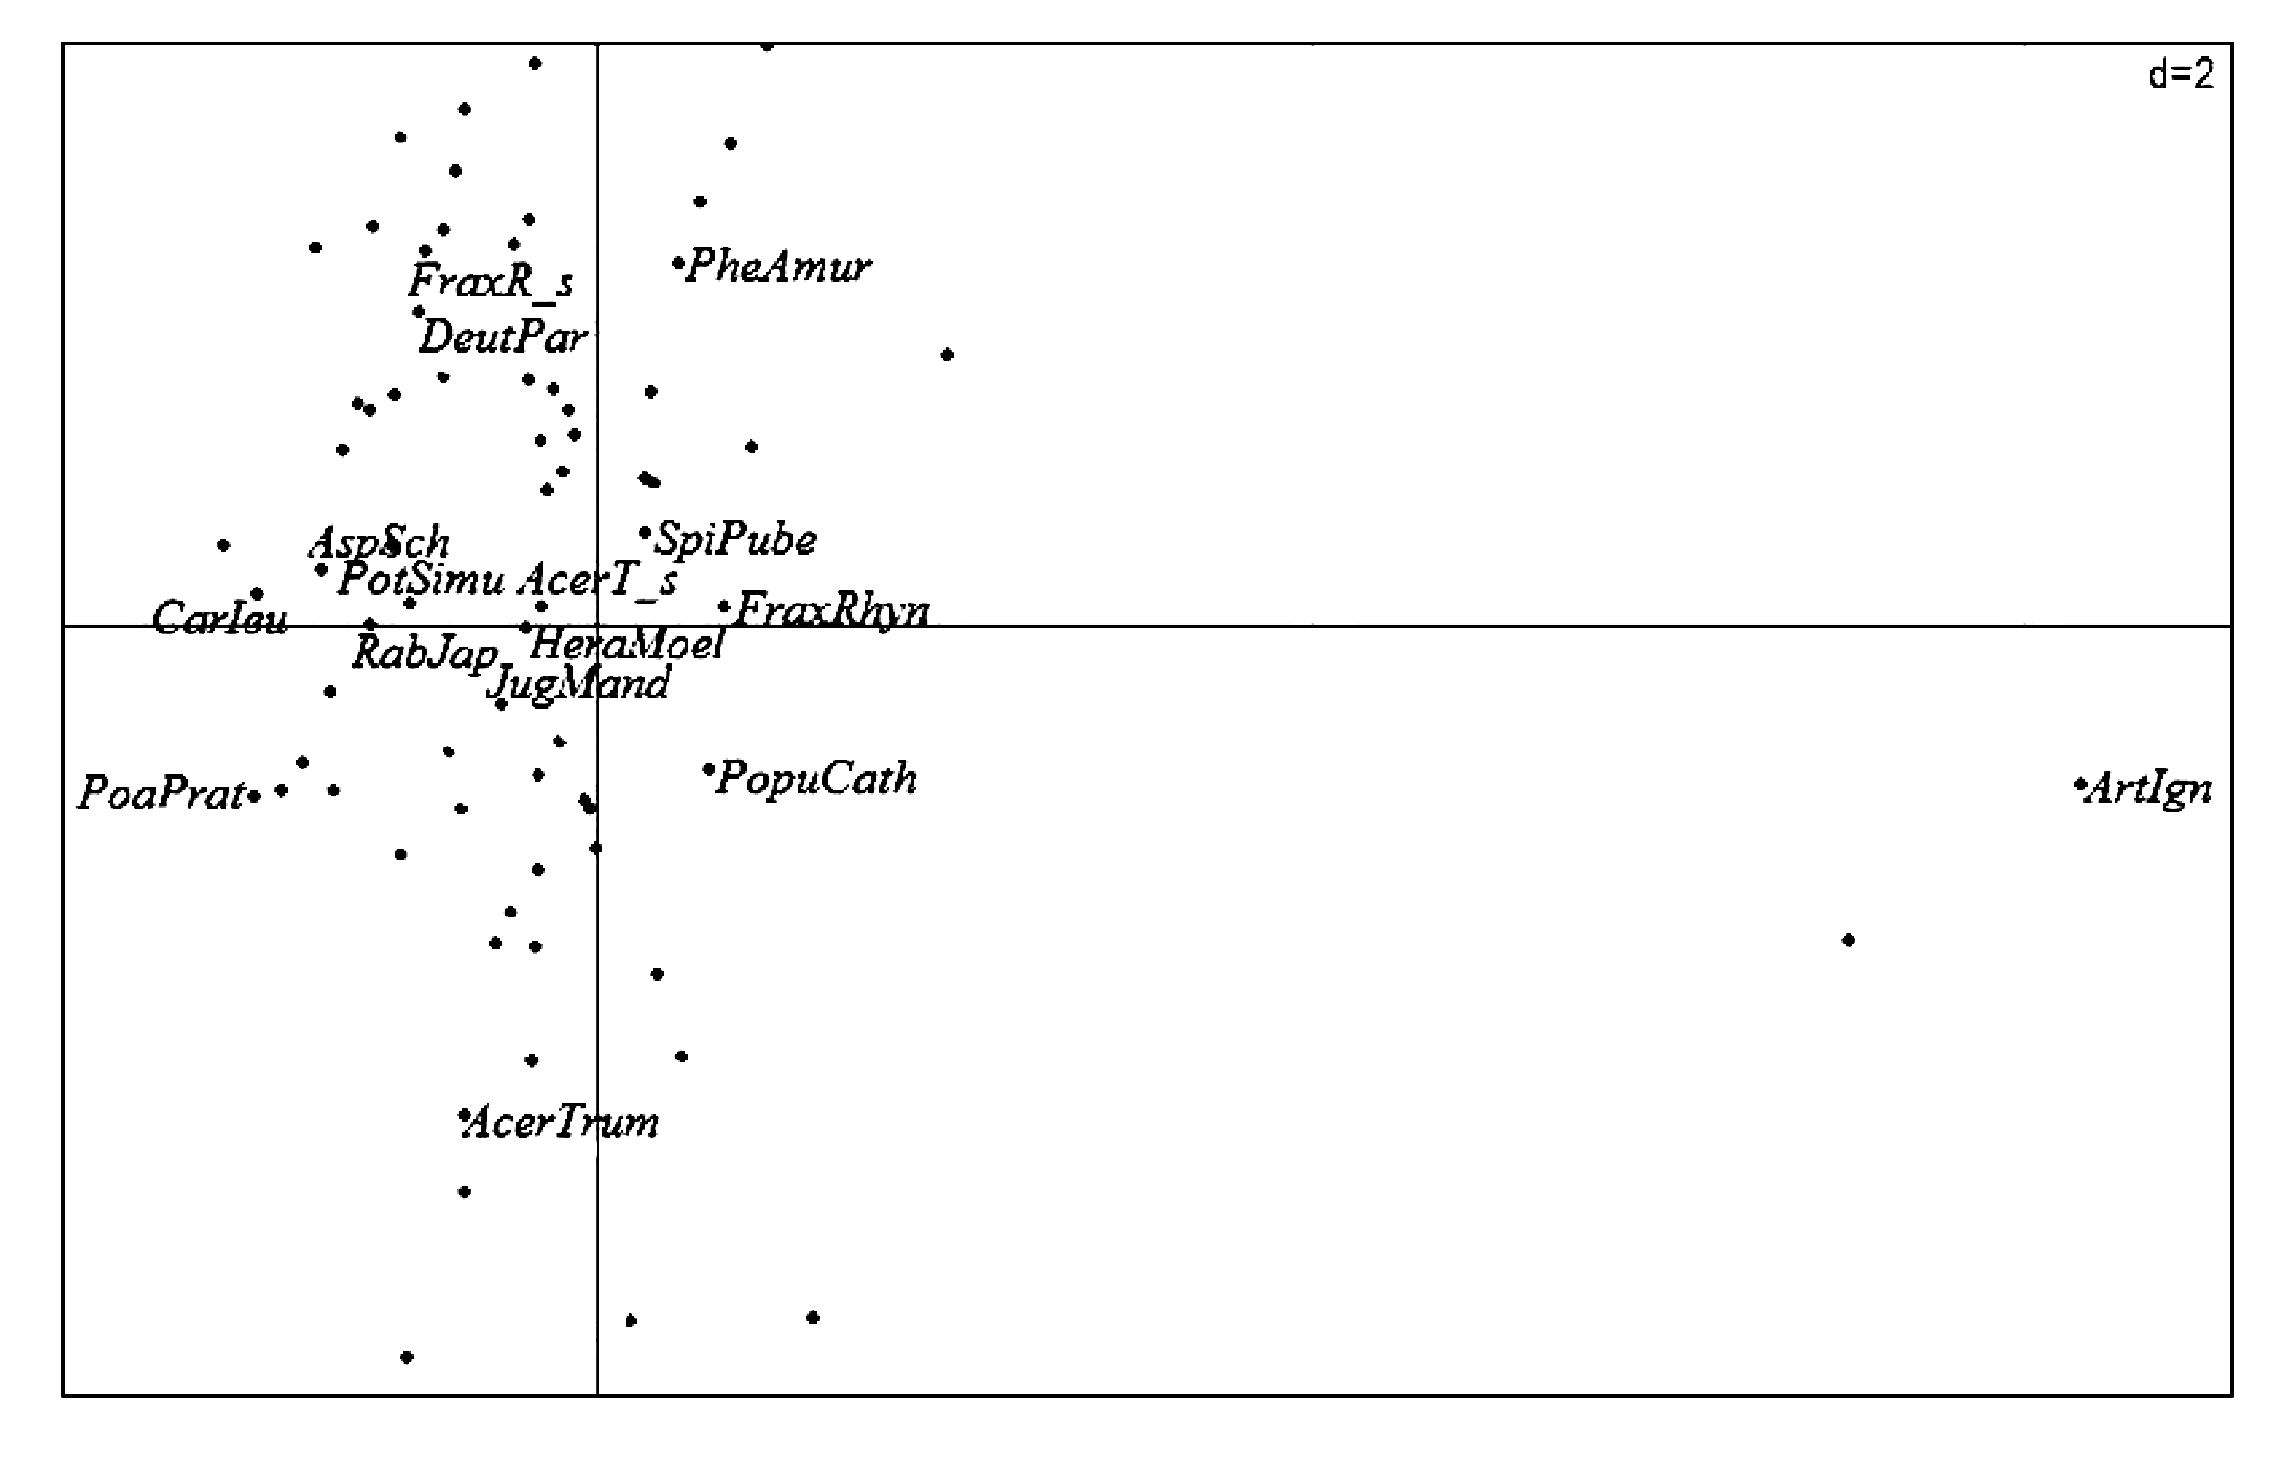
图5 物种在PCA-CA协惯量分析(PCA-CA COIA)协惯量平面的位置
Fig. 5 Position of species in the PCA-CA co-inertia analysis (PCA-CA COIA) co-inertia plane
| [1] |
Alard D, Chabrerie O, Dutoit T, Roche P, Langlois P (2005). Patterns of secondary succession in calcareous grasslands: Can we distinguish the influence of former land uses from present vegetation data? Basic and Applied Ecology, 6, 161-173.
DOI URL |
| [2] | Chessel D, Dufour AB, Thioulouse J (2004). The ade4 package-Ⅰ: one table methods. R News, 4, 5-10. |
| [3] |
Dolédec S, Chessel D (1994). Co-inertia analysis: an alternative method for studying species-environment relationships. Freshwater Biology, 31, 277-294.
DOI URL |
| [4] |
Dolédec S, Chessel D, ter Braak CJF, Champely S (1996). Matching species traits to environmental variables: a new three-table ordination method. Environmental and Ecological Statistics, 3, 143-166.
DOI URL |
| [5] |
Dray S, Chessel D, Thioulouse J (2003). Co-inertia analysis and the linking of ecological data tables. Ecology, 84, 3078-3089.
DOI URL |
| [6] |
Faith DP, Minchin PR, Belbin L (1987). Compositional dissimilarity as a robust measure of ecological distance. Vegetatio, 69, 57-68.
DOI URL |
| [7] |
Figueira R, Sérgio C, Sousa AJ (2002). Distribution of trace metals in moss biomonitors and assessment of contamination sources in Portugal. Environmental Pollution, 118, 153-163.
DOI URL PMID |
| [8] | Gauch HG (1982). Multivariate Analysis in Community Ecology. Cambridge University Press, Cambridge, UK. |
| [9] |
Kandji ST, Ogol CKPO, Albrecht A (2001). Diversity of plant-parasitic nematodes and their relationships with some soil physico-chemical characteristics in improved fallows in Western Kenya. Applied Soil Ecology, 18, 143-157.
DOI URL |
| [10] |
Legendre P, Gallagher ED (2001). Ecologically meaningful transformation for ordination of species data. Oecologia, 129, 271-280.
DOI URL PMID |
| [11] | Lepš J, Šmilauer P (2003). Multivariate Analysis of Ecological Data Using CANOCO. Cambridge University Press, Cambridge, UK. |
| [12] | Li JQ (李俊清) (2008). Ecological Restoration of Natural Forest in the Montane Area of Beijing (北京山地森林的生态恢复). Science Press, Beijing, 173-176. (in Chinese) |
| [13] |
Palmer MW (1993). Putting things in even better order: the advantages of canonical correspondence analysis. Ecology, 74, 2215-2230.
DOI URL |
| [14] |
Prato S, Morgana JG, La Valle P, Finoia MG, Lattanzi L, Nicoletti L, Ardizzone GD, Izzo G (2009). Application of biotic and taxonomic distinctness indices in assessing the ecological quality status of two coastal lakes: Caprolace and Fogliano lakes (Central Italy). Ecological Indicators, 9, 568-583.
DOI URL |
| [15] |
Wollenberg AL (1977). Redundancy analysis, an alternative for canonical analysis. Psychometrika, 42, 207-219.
DOI URL |
| [16] |
ter Braak CJF (1985). Correspondence analysis of incidence and abundance data: properties in terms of a unimodal response model. Biometrics, 41, 859-873.
DOI URL |
| [17] |
ter Braak CJF (1986). Canonical correspondence analysis: a new eigenvector technique for multivariate direct gradient analysis. Ecology, 67, 1167-1179.
DOI URL |
| [18] | ter Braak CJF, Šmilauer P (2002). CANOCO Reference Manual and CanoDraw for Windows User’s Guide-Software for Canonical Community Ordination (Version 4.5). Microcomputer Power, Ithaca, NY,USA. |
| [19] |
ter Braak CJF, Verdonschot PFM (1995). Canonical correspondence analysis and related multivariate methods in aquatic ecology. Aquatic Science, 57, 255-289.
DOI URL |
| [20] |
Thioulouse J, Chessel D (1992). A method for reciprocal scaling of species tolerance and sample diversity. Ecology, 73, 670-680.
DOI URL |
| [21] |
Thioulouse J, Simier M, Chessel D (2004). Simultaneous analysis of a sequence of paired ecological tables. Ecology, 85, 272-283.
DOI URL |
| [22] | Zhang JT (张金屯) (2004). Quantitative Ecology (数量生态学). Science Press, Beijing. (in Chinese) |
| [23] |
Zhang JT, Xi Y, Li J (2006). The relationships between environment and plant communities in the middle part of Taihang Mountain Range, North China. Community Ecology, 7, 155-163.
DOI URL |
| [24] | Zhou YL (周以良), Dong SL (董世林), Nie SQ (聂绍荃) (1986). Silva of Heilongjiang (黑龙江树木志). Heilongjiang Science and Technology Press, Harbin. (in Chinese) |
| [1] | 黄杰, 李晓玲, 王雪松, 杨进, 黄成名. 三峡库区不同消落带下中华蚊母树群落特征及其与土壤环境因子的关系[J]. 植物生态学报, 2021, 45(8): 844-859. |
| [2] | 李媛媛, 张芸, 孔昭宸, 杨振京. 新疆阿尔泰红山嘴地区的表土孢粉与现代植被[J]. 植物生态学报, 2021, 45(2): 174-186. |
| [3] | 李家湘, 熊高明, 徐文婷, 李跃林, 卢志军, 赵常明, 谢宗强. 中国亚热带灌丛植物生活型组成及其与水热因子的相关性[J]. 植物生态学报, 2017, 41(1): 147-156. |
| [4] | 曹静, 苗艳明, 冯飞, 许强, 张钦弟, 毕润成. 稀有种不同处理对典范对应分析排序结果影响的比较[J]. 植物生态学报, 2015, 39(2): 167-175. |
| [5] | 柴毅, 彭婷, 郭坤, 何勇凤, 杨德国, 罗静波. 2012年夏季长湖浮游植物群落特征及其与环境因子的关系[J]. 植物生态学报, 2014, 38(8): 857-867. |
| [6] | 余敏,周志勇,康峰峰,欧阳帅,米湘成,孙建新. 山西灵空山小蛇沟林下草本层植物群落梯度分析及环境解释[J]. 植物生态学报, 2013, 37(5): 373-383. |
| [7] | 朱军涛, 于静洁, 王平, 王志勇. 额济纳荒漠绿洲植物群落的数量分类及其与地下水环境的关系分析[J]. 植物生态学报, 2011, 35(5): 480-489. |
| [8] | 张忠华, 胡刚, 祝介东, 倪健. 喀斯特森林土壤养分的空间异质性及其对树种分布的影响[J]. 植物生态学报, 2011, 35(10): 1038-1049. |
| [9] | 宋同清, 彭晚霞, 曾馥平, 王克林, 覃文更, 谭卫宁, 刘璐, 杜虎, 鹿士杨. 木论喀斯特峰丛洼地森林群落空间格局及环境解释[J]. 植物生态学报, 2010, 34(3): 298-308. |
| [10] | 孙菊, 李秀珍, 王宪伟, 吕久俊, 李宗梅, 胡远满. 大兴安岭冻土湿地植物群落结构的环境梯度分析[J]. 植物生态学报, 2010, 34(10): 1165-1173. |
| [11] | 冯云, 马克明, 张育新, 祁建. 辽东栎林不同层植物沿海拔梯度分布的DCCA分析[J]. 植物生态学报, 2008, 32(3): 568-573. |
| [12] | 沈琪, 刘珂, 李世玉, 张骏, 蒋跃平, 葛滢, 常杰. 杭州西溪湿地植物组成及其与水位光照的关系[J]. 植物生态学报, 2008, 32(1): 114-122. |
| [13] | 黄晓霞, 江源, 刘全儒, 黄秋如. 小五台亚高山草甸与生境关系分析[J]. 植物生态学报, 2007, 31(3): 437-444. |
| [14] | 栾青杉, 孙军, 宋书群, 沈志良, 俞志明. 长江口夏季浮游植物群落与环境因子的典范对应分析[J]. 植物生态学报, 2007, 31(3): 445-450. |
| [15] | 宋创业, 郭柯. 浑善达克沙地中部丘间低地植物群落分布与土壤环境关系[J]. 植物生态学报, 2007, 31(1): 40-49. |
| 阅读次数 | ||||||
|
全文 |
|
|||||
|
摘要 |
|
|||||
Copyright © 2026 版权所有 《植物生态学报》编辑部
地址: 北京香山南辛村20号, 邮编: 100093
Tel.: 010-62836134, 62836138; Fax: 010-82599431; E-mail: apes@ibcas.ac.cn, cjpe@ibcas.ac.cn
备案号: 京ICP备16067583号-19
![]()