
植物生态学报 ›› 2021, Vol. 45 ›› Issue (5): 467-475.DOI: 10.17521/cjpe.2020.0288 cstr: 32100.14.cjpe.2020.0288
所属专题: 生态遥感及应用; 青藏高原植物生态学:遥感生态学
薛鹏飞1,2, 李文龙1,2,*( ), 朱高峰3, 周华坤4, 刘陈立1,2, 晏和飘1,2
收稿日期:2020-08-21
接受日期:2021-01-12
出版日期:2021-05-20
发布日期:2021-03-09
作者简介:*薛鹏飞:ORCID: 0000-0002-4617-3404(wllee@lzu.edu.cn)基金资助:
XUE Peng-Fei1,2, LI Wen-Long1,2,*(), ZHU Gao-Feng3, ZHOU Hua-Kun4, LIU Chen-Li1,2, YAN He-Piao1,2
Received:2020-08-21
Accepted:2021-01-12
Online:2021-05-20
Published:2021-03-09
Supported by:摘要:
高寒湿地是青藏高原地区最重要的生态水源涵养区之一, 也是局部气候的有效调节者, 其动态变化与成因亟待深入研究。该研究基于遥感图像分析、地理信息系统空间分析和景观生态指数分析结合的方法, 以黄河首曲玛曲县高寒湿地为研究对象, 对1995-2018年6期湿地的动态变化进行研究。结果表明, 研究区湿地在1995-2010年间不断退化, 1995-2010年湿地面积总共减少了18 680.31 hm2。在2010-2018年间黄河首曲高寒湿地面积有所增加, 但与20世纪90年代相比, 21世纪初开始湿地的面积普遍呈现下降趋势; 1995-2010年湿地斑块数不断增加, 斑块密度不断增大, 平均斑块面积下降, 景观的破碎度升高; 2010-2015年湿地斑块数和斑块密度减少, 2015-2018年湿地斑块数和斑块密度增加, 平均斑块面积先增大后减小, 景观的破碎度先降低后升高。1995-2010年研究区高寒湿地景观Shannon多样性指数和Shannon均匀度指数均呈现下降的趋势, 湿地的景观结构趋于简单, 景观类型分布更加集中。2010-2018年湿地景观Shannon多样性指数和Shannon均匀度指数均呈现上升趋势, 湿地的景观结构趋于复杂, 景观类型增加且分布更加分散。进一步的驱动力分析表明, 引起黄河首曲高寒湿地景观格局演变的主要因素是蒸发量和降水量, 其次是人口数量和大牲畜数量等人类活动影响。气候因子是影响黄河首曲高寒湿地面积变化的主要原因, 过度的人类经济活动在一定程度上加剧了湿地的变化。
薛鹏飞, 李文龙, 朱高峰, 周华坤, 刘陈立, 晏和飘. 黄河首曲玛曲县高寒湿地景观格局演变. 植物生态学报, 2021, 45(5): 467-475. DOI: 10.17521/cjpe.2020.0288
XUE Peng-Fei, LI Wen-Long, ZHU Gao-Feng, ZHOU Hua-Kun, LIU Chen-Li, YAN He-Piao. Changes in the pattern of an alpine wetland landscape in Maqu County in the first meander of the Yellow River. Chinese Journal of Plant Ecology, 2021, 45(5): 467-475. DOI: 10.17521/cjpe.2020.0288
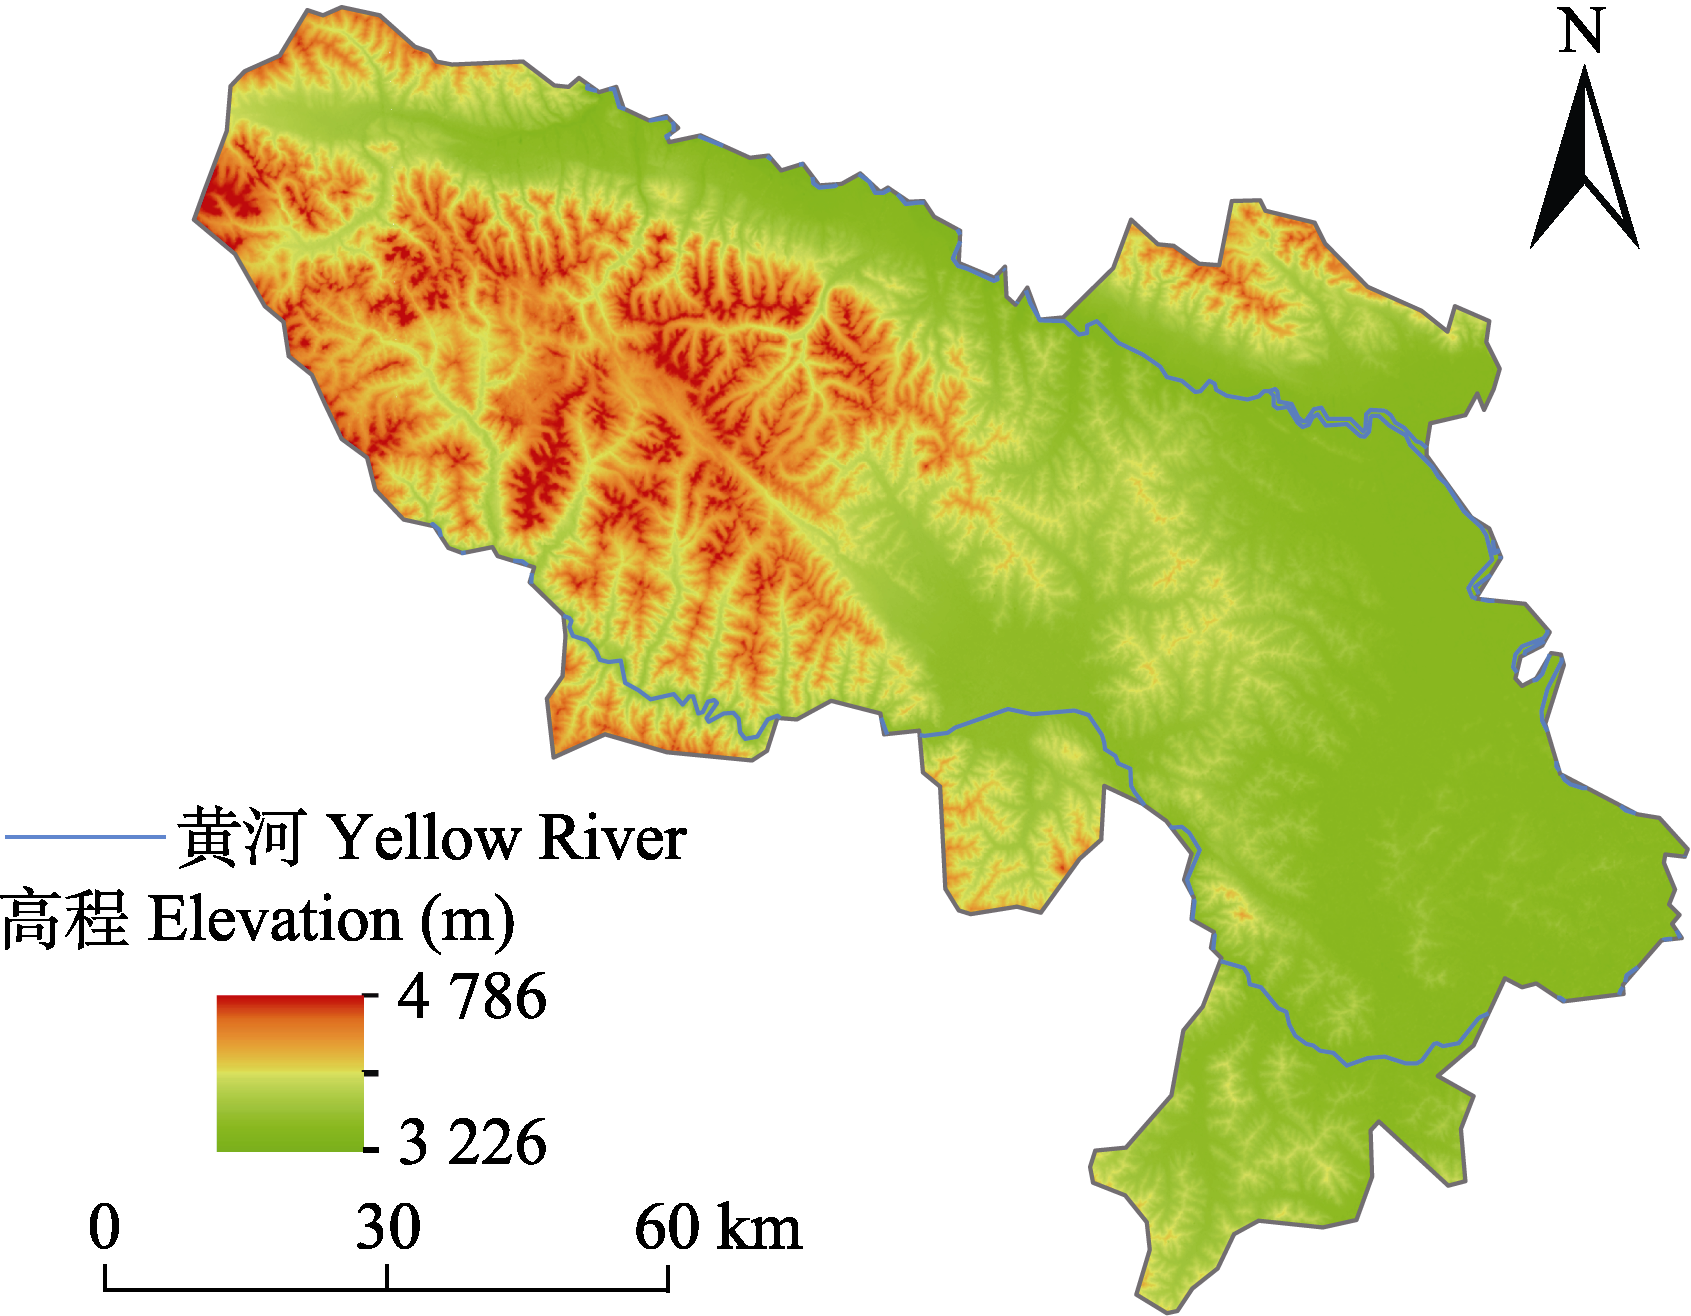
图1 玛曲县高寒湿地示意图。
Fig. 1 Sketch map of the alpine wetland in Maqu County.
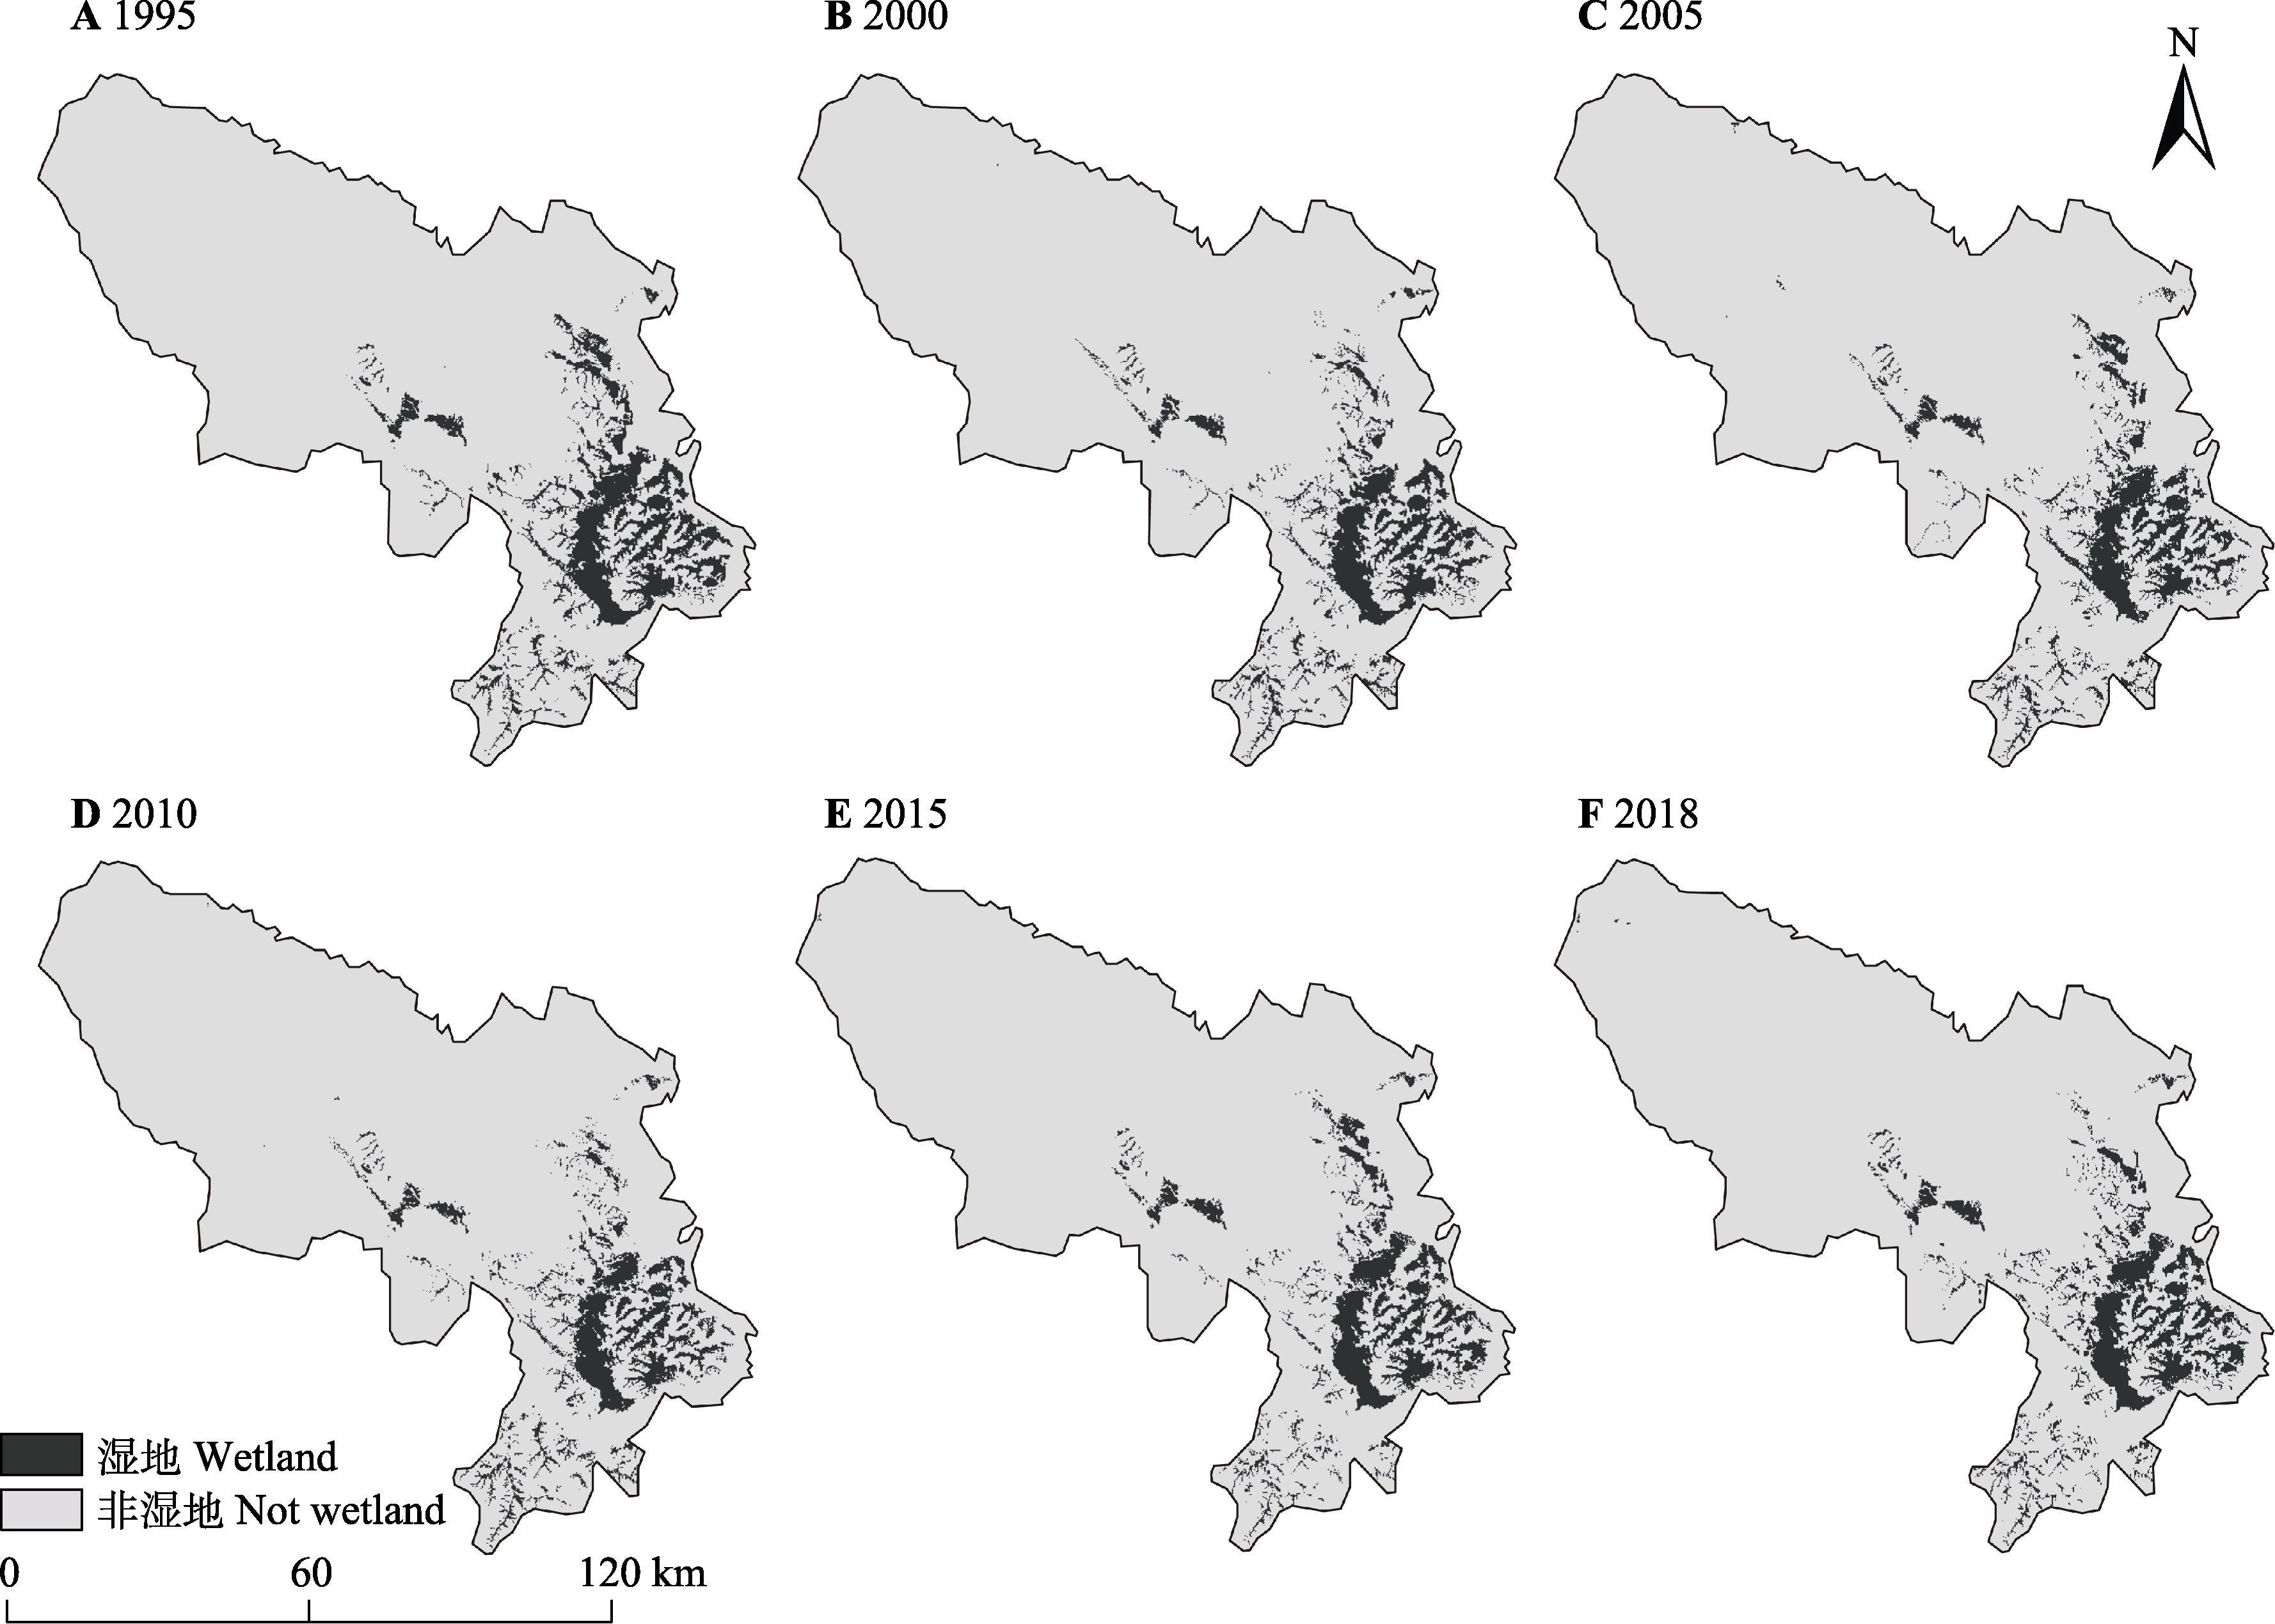
图2 玛曲县不同时期高寒湿地分布图。
Fig. 2 Distribution of alpine wetland in Maqu County at different times.
| 1995 | 2000 | 2005 | 2010 | 2015 | 2018 | |
|---|---|---|---|---|---|---|
| Kappa系数 Kappa coefficient (%) | 88.0 | 90.0 | 86.5 | 89.5 | 92.0 | 87.0 |
| 总体精度 Accuracy | 0.80 | 0.84 | 0.81 | 0.83 | 0.87 | 0.81 |
表1 遥感数据分类结果的Kappa系数与总体精度
Table 1 Kappa coefficient and overall accuracy of the classification results of remote sensing data
| 1995 | 2000 | 2005 | 2010 | 2015 | 2018 | |
|---|---|---|---|---|---|---|
| Kappa系数 Kappa coefficient (%) | 88.0 | 90.0 | 86.5 | 89.5 | 92.0 | 87.0 |
| 总体精度 Accuracy | 0.80 | 0.84 | 0.81 | 0.83 | 0.87 | 0.81 |
| 年 Year | 斑块数 Patch number | 面积 Area (hm2) | 景观比率 Landscape ratio (%) | 以1995年为基准期减少百分比 Percentage reduction by base period (1995) (%) |
|---|---|---|---|---|
| 1995 | 759 | 84 795.84 | 8.877 | - |
| 2000 | 860 | 73 574.91 | 7.702 | 13.24 |
| 2005 | 931 | 71 817.84 | 7.518 | 15.30 |
| 2010 | 1 142 | 66 115.53 | 6.922 | 22.03 |
| 2015 | 662 | 71 530.11 | 7.488 | 15.64 |
| 2018 | 786 | 74 498.13 | 7.792 | 12.14 |
表2 玛曲县高寒湿地不同时期景观动态变化
Table 2 Dynamics of changes in alpine wetland in Maqu County
| 年 Year | 斑块数 Patch number | 面积 Area (hm2) | 景观比率 Landscape ratio (%) | 以1995年为基准期减少百分比 Percentage reduction by base period (1995) (%) |
|---|---|---|---|---|
| 1995 | 759 | 84 795.84 | 8.877 | - |
| 2000 | 860 | 73 574.91 | 7.702 | 13.24 |
| 2005 | 931 | 71 817.84 | 7.518 | 15.30 |
| 2010 | 1 142 | 66 115.53 | 6.922 | 22.03 |
| 2015 | 662 | 71 530.11 | 7.488 | 15.64 |
| 2018 | 786 | 74 498.13 | 7.792 | 12.14 |
| 斑块大小 Patch size (hm2) | 1995 | 2000 | 2005 | 2010 | 2015 | 2018 |
|---|---|---|---|---|---|---|
| <50 | 3 734.37 | 5 078.52 (+36.0%) | 4 307.67 (-15.2%) | 5 796.99 (+34.6%) | 4 956.39 (-14.5%) | 6 114.60 (+23.4%) |
| 50-1 000 | 17 723.34 | 21 753.54 (+22.7%) | 17 647.92 (-18.9%) | 19 600.56 (+11.1%) | 14 940.45 (-23.8%) | 18 917.73 (+26.6%) |
| 1 000-10 000 | 22 844.25 | 8 843.40 (-61.3%) | 19 358.64 (+118.9%) | 18 758.34 (-3.1%) | 27 581.04 (+47.0%) | 26 336.97 (-4.5%) |
| >10 000 | 40 493.88 | 37 899.45 (-6.4%) | 30 503.61 (-19.5%) | 21 959.64 (-28.0%) | 23 013.00 (+4.8%) | 23 128.83 (+0.5%) |
| 合计 Total | 84 795.84 | 73 574.91 (-13.2%) | 71 817.84 (-2.4%) | 66 115.53 (-7.9%) | 70 490.88 (+6.6%) | 74 498.13 (+5.7%) |
表3 1995-2018年玛曲县高寒湿地面积组成(hm2)
Table 3 Area components of the alpine wetland in Maqu County during 1995-2018 (hm2)
| 斑块大小 Patch size (hm2) | 1995 | 2000 | 2005 | 2010 | 2015 | 2018 |
|---|---|---|---|---|---|---|
| <50 | 3 734.37 | 5 078.52 (+36.0%) | 4 307.67 (-15.2%) | 5 796.99 (+34.6%) | 4 956.39 (-14.5%) | 6 114.60 (+23.4%) |
| 50-1 000 | 17 723.34 | 21 753.54 (+22.7%) | 17 647.92 (-18.9%) | 19 600.56 (+11.1%) | 14 940.45 (-23.8%) | 18 917.73 (+26.6%) |
| 1 000-10 000 | 22 844.25 | 8 843.40 (-61.3%) | 19 358.64 (+118.9%) | 18 758.34 (-3.1%) | 27 581.04 (+47.0%) | 26 336.97 (-4.5%) |
| >10 000 | 40 493.88 | 37 899.45 (-6.4%) | 30 503.61 (-19.5%) | 21 959.64 (-28.0%) | 23 013.00 (+4.8%) | 23 128.83 (+0.5%) |
| 合计 Total | 84 795.84 | 73 574.91 (-13.2%) | 71 817.84 (-2.4%) | 66 115.53 (-7.9%) | 70 490.88 (+6.6%) | 74 498.13 (+5.7%) |
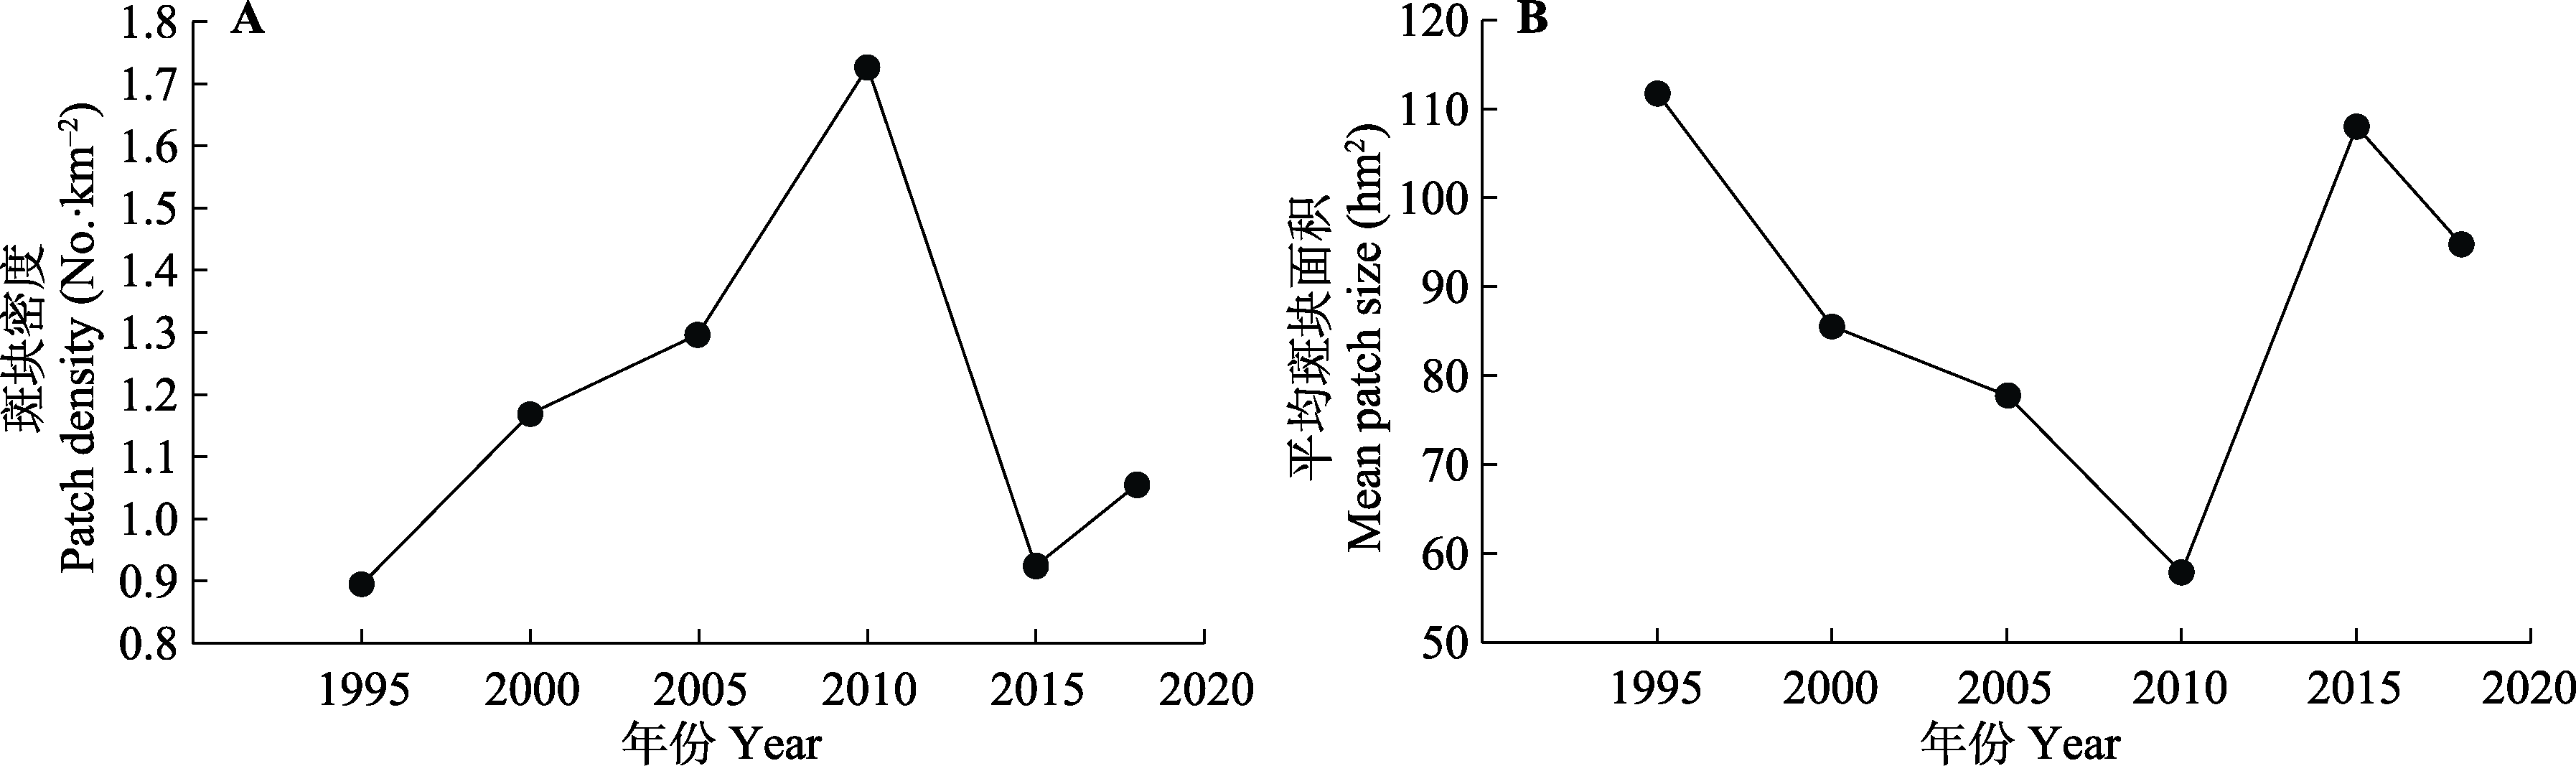
图3 玛曲县高寒湿地斑块密度(A)和平均斑块面积(B)。
Fig. 3 Patch density (A) and mean patch size (B) of the alpine wetland in Maqu County.
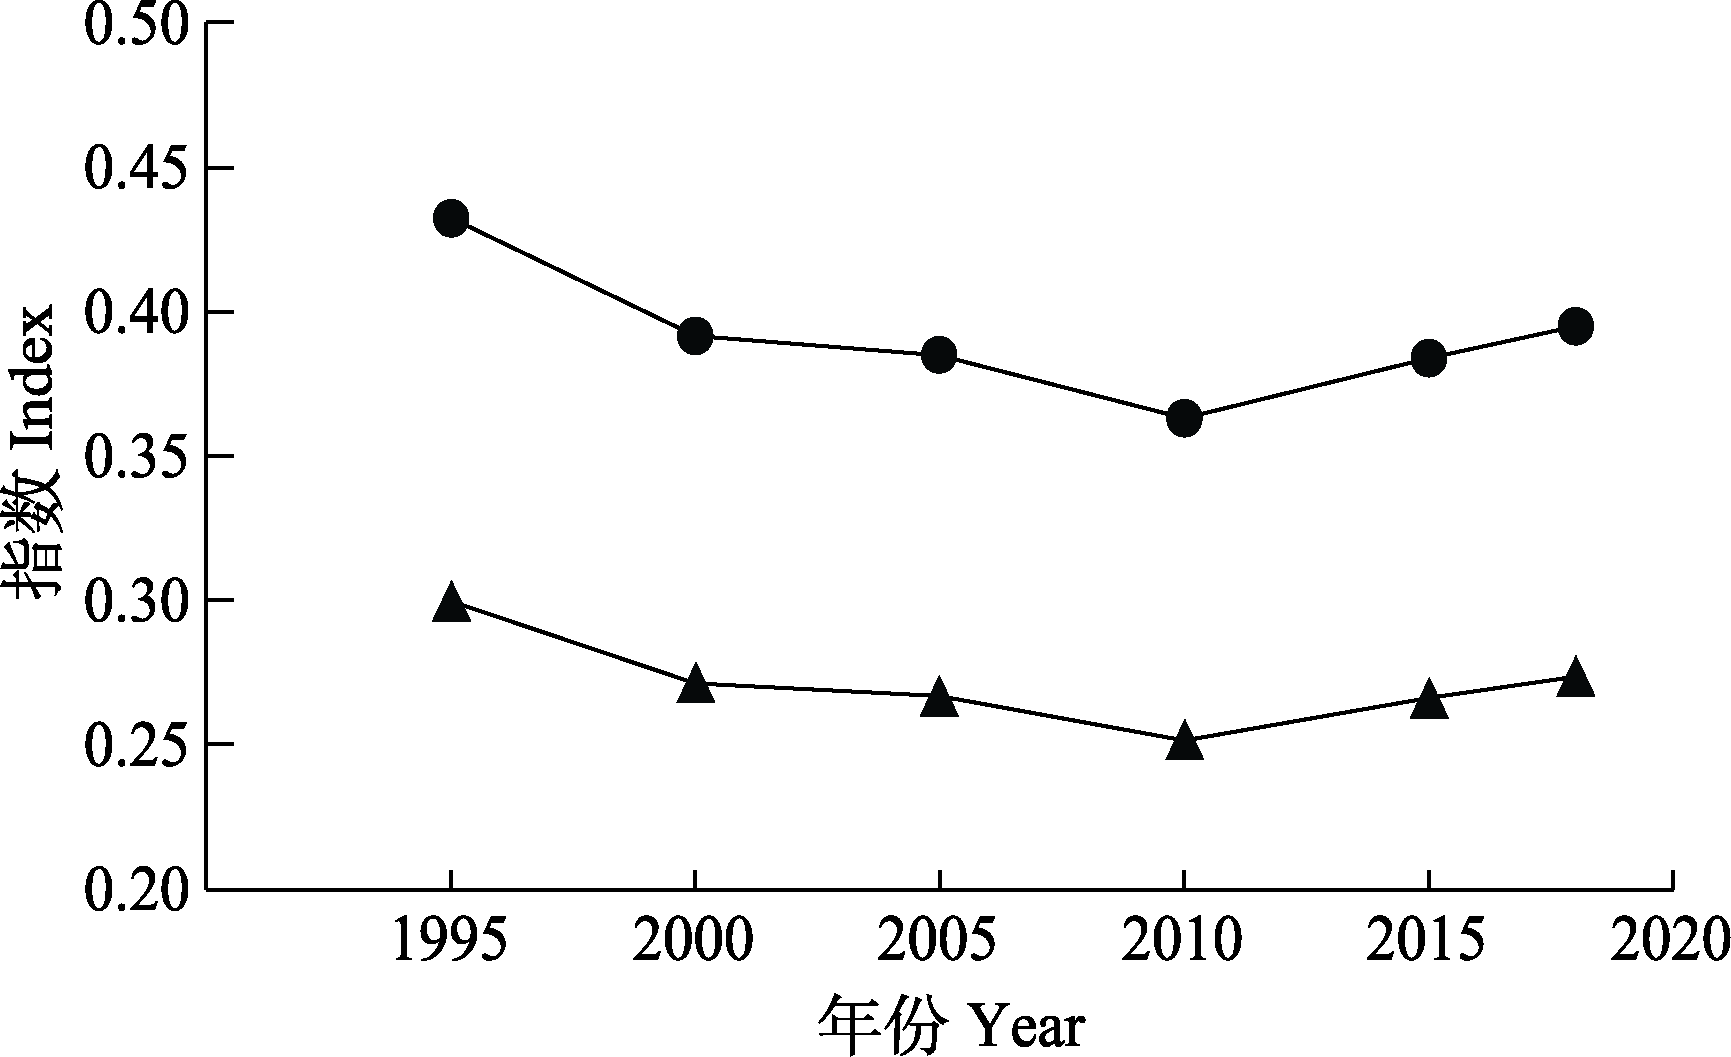
图4 玛曲县高寒湿地Shannon多样性指数(▲)和Shannon均匀度指数(●)。
Fig. 4 Shannon’s diversity (▲) and evenness indices (●) of the alpine wetland in Maqu County.
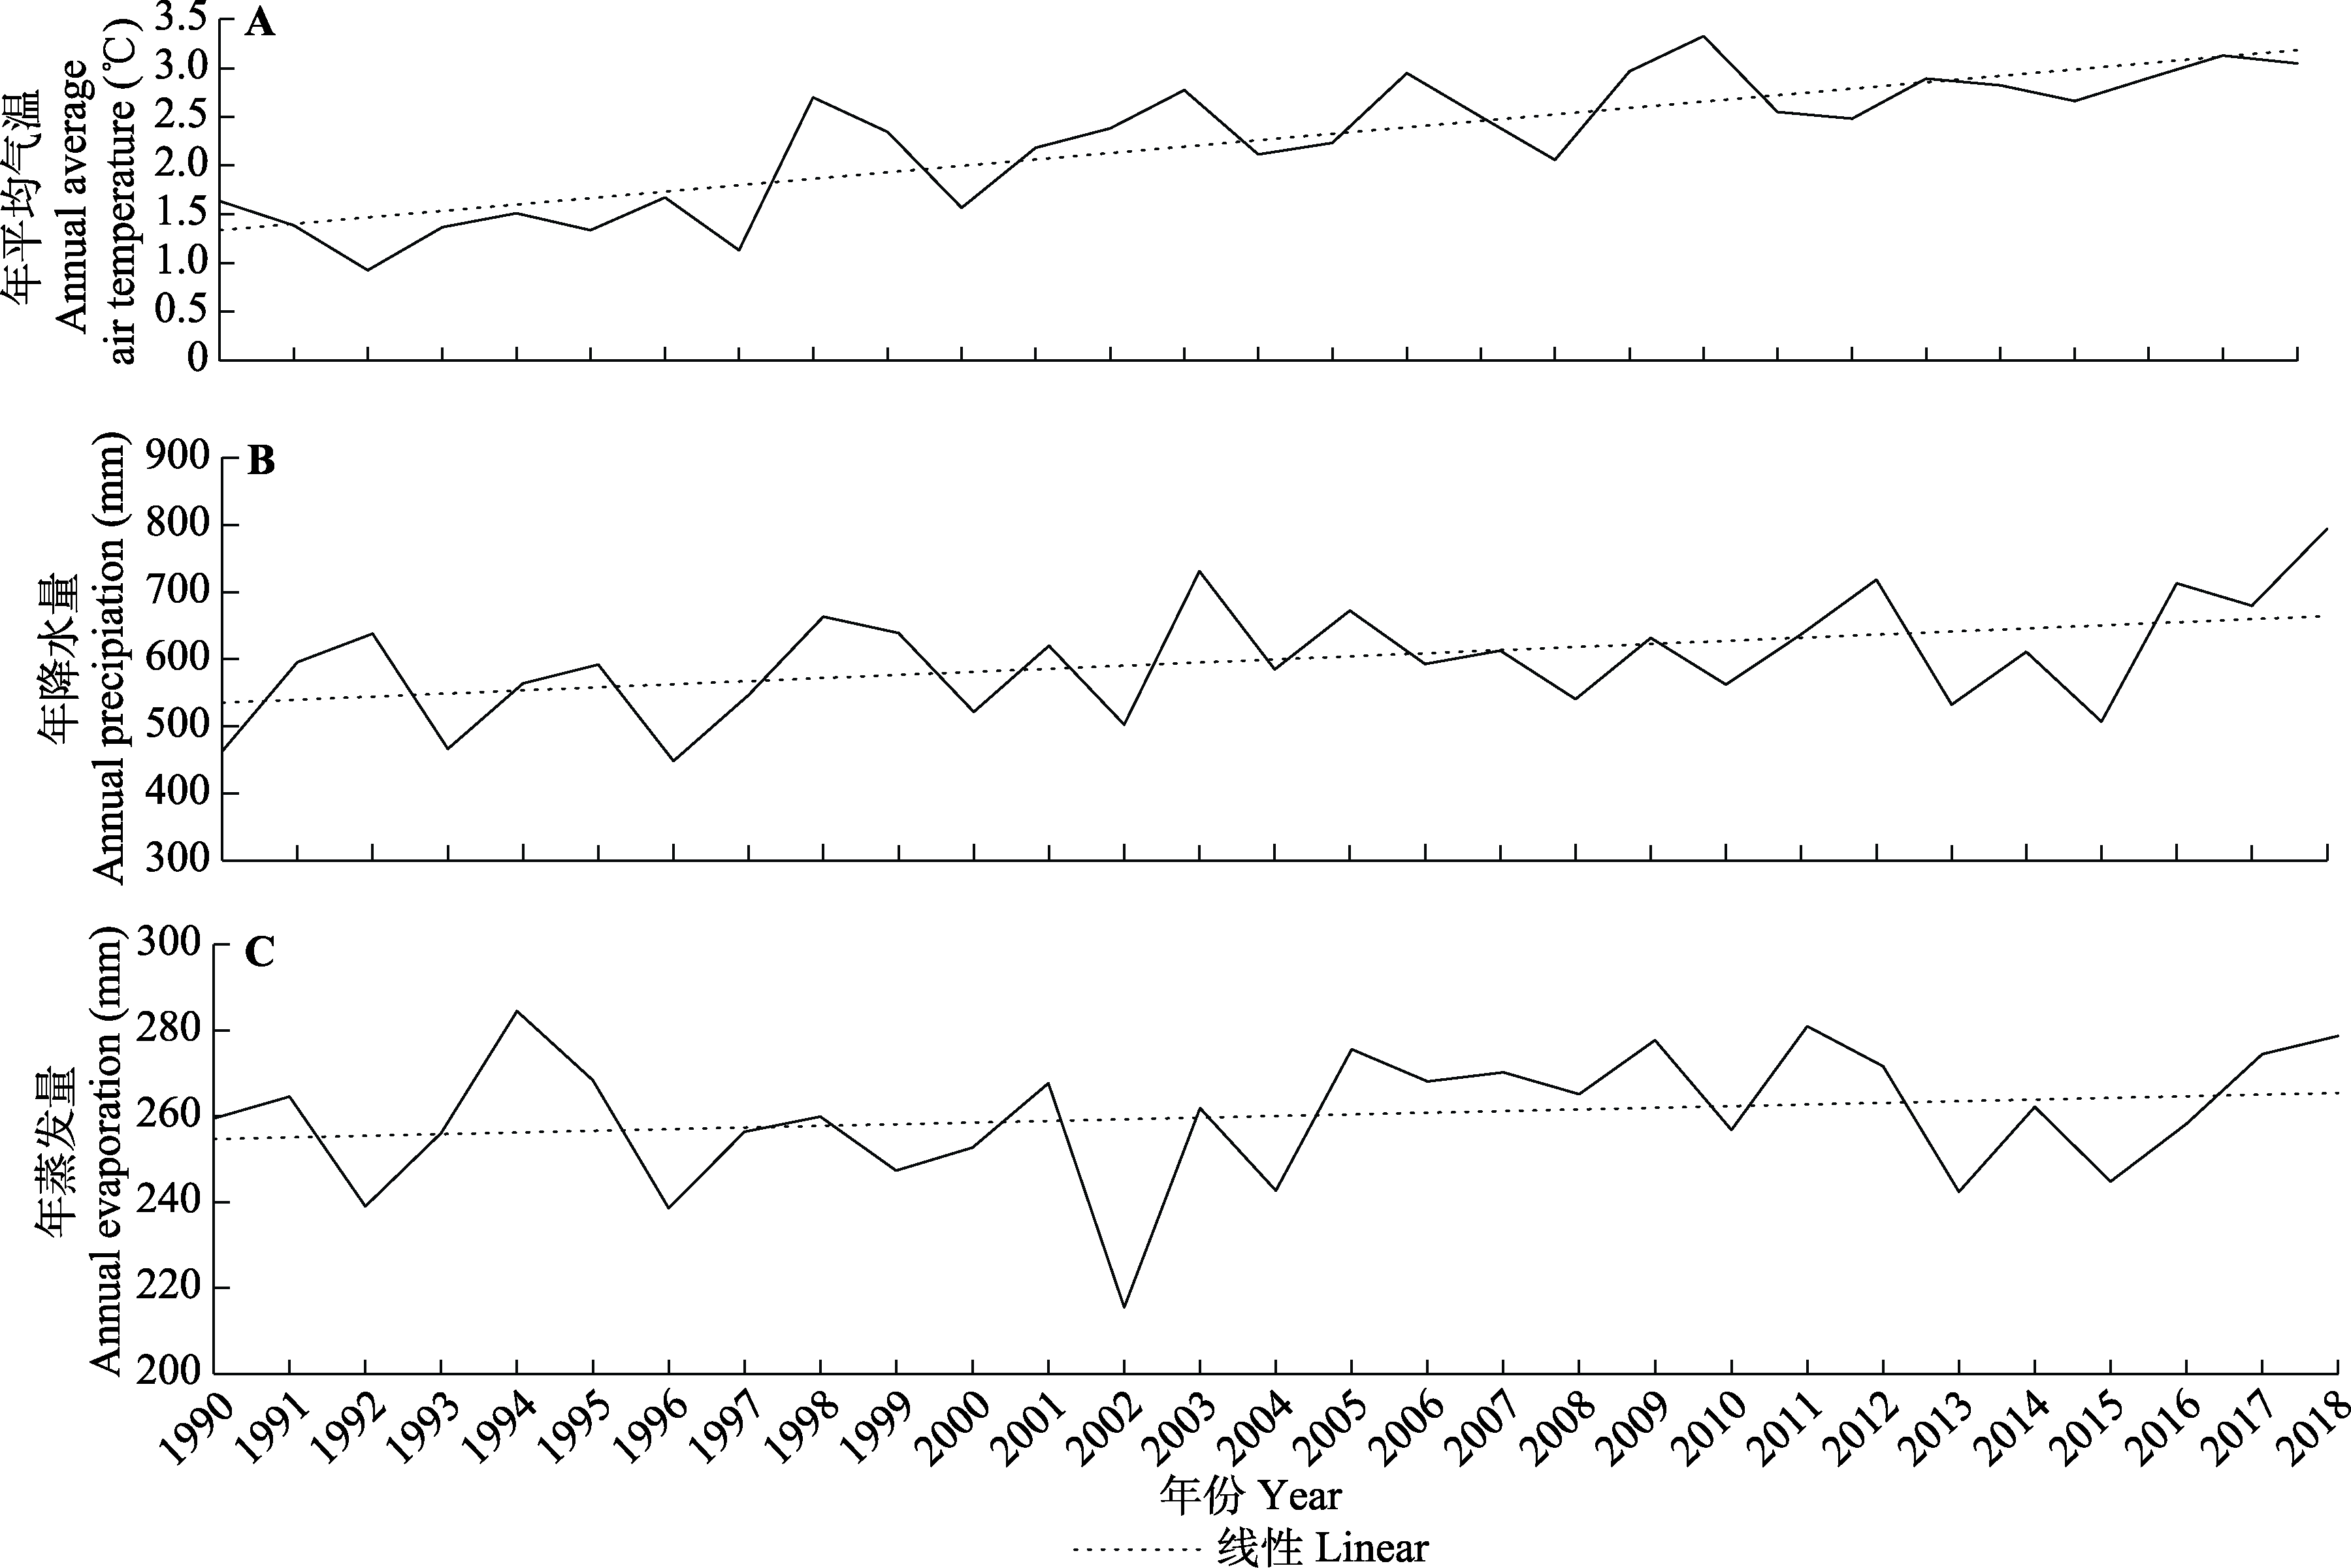
图5 玛曲县高寒湿地年平均气温(A)、年降水量(B)和年蒸发量(C)趋势。
Fig. 5 Trends of annual average air temperature (A), annual precipitation (B) and annual evaporation (C) of the alpine wetland in Maqu County.
| 年 Year | 国内生产总值 Gross domestic product (104 yuan) | 第一产业值 Primary industry (104 yuan) | 第二产业值 Secondary industry (104 yuan) | 第三产业值 Tertiary industry (104 yuan) | 产业结构 Industrial structure (%) | 人口数量Population | 牲畜数量 Number of livestock (104) | 人均生产总值 Per capita GDP (104 yuan) |
|---|---|---|---|---|---|---|---|---|
| 1995 | 13 961 | 8 541 | 3 563 | 1 857 | 61/26/13 | 31 745 | 60.71 | 0.422 7 |
| 2000 | 23 751 | 10 394 | 9 620 | 3 737 | 44/41/15 | 37 100 | 68.09 | 0.632 2 |
| 2005 | 42 750 | 12 433 | 20 470 | 9 847 | 29/48/23 | 45 100 | 78.17 | 0.954 2 |
| 2010 | 95 165 | 28 269 | 34 998 | 31 898 | 30/37/33 | 51 400 | 105.10 | 1.853 3 |
| 2015 | 134 546 | 46 826 | 23 610 | 64 128 | 35/18/49 | 52 040 | 100.10 | 2.364 9 |
| 2018 | 172 886 | 77 898 | 16 615 | 78 373 | 45/10/45 | 58 200 | 94.10 | 2.878 0 |
表4 玛曲县高寒湿地各产业总值及其产业结构
Table 4 Total values of economic production and the structure of industrial types in the alpine wetland in Maqu County
| 年 Year | 国内生产总值 Gross domestic product (104 yuan) | 第一产业值 Primary industry (104 yuan) | 第二产业值 Secondary industry (104 yuan) | 第三产业值 Tertiary industry (104 yuan) | 产业结构 Industrial structure (%) | 人口数量Population | 牲畜数量 Number of livestock (104) | 人均生产总值 Per capita GDP (104 yuan) |
|---|---|---|---|---|---|---|---|---|
| 1995 | 13 961 | 8 541 | 3 563 | 1 857 | 61/26/13 | 31 745 | 60.71 | 0.422 7 |
| 2000 | 23 751 | 10 394 | 9 620 | 3 737 | 44/41/15 | 37 100 | 68.09 | 0.632 2 |
| 2005 | 42 750 | 12 433 | 20 470 | 9 847 | 29/48/23 | 45 100 | 78.17 | 0.954 2 |
| 2010 | 95 165 | 28 269 | 34 998 | 31 898 | 30/37/33 | 51 400 | 105.10 | 1.853 3 |
| 2015 | 134 546 | 46 826 | 23 610 | 64 128 | 35/18/49 | 52 040 | 100.10 | 2.364 9 |
| 2018 | 172 886 | 77 898 | 16 615 | 78 373 | 45/10/45 | 58 200 | 94.10 | 2.878 0 |
| 年蒸发量 Annual evaporation | 年降水量 Annual precipitation | 总人口 Total population | 大型动物存栏数 Large livestock inventory | 年平均气温 Annual average air temperature | 第一产业 Primary industry | 第二产业 Secondary industry | 第三产业 Tertiary Industry | |
|---|---|---|---|---|---|---|---|---|
| 相关系数 Correlativeness | 0.929 | 0.849 | 0.802 | 0.795 | 0.738 | 0.658 | 0.582 | 0.512 |
| 排序 Sort | 1 | 2 | 3 | 4 | 5 | 6 | 7 | 8 |
表5 玛曲县高寒湿地面积与各影响因子的关联度和关联顺序
Table 5 Correlativeness and ranking of correlation between wetland area and various influencing factors in the alpine wetland in Maqu County
| 年蒸发量 Annual evaporation | 年降水量 Annual precipitation | 总人口 Total population | 大型动物存栏数 Large livestock inventory | 年平均气温 Annual average air temperature | 第一产业 Primary industry | 第二产业 Secondary industry | 第三产业 Tertiary Industry | |
|---|---|---|---|---|---|---|---|---|
| 相关系数 Correlativeness | 0.929 | 0.849 | 0.802 | 0.795 | 0.738 | 0.658 | 0.582 | 0.512 |
| 排序 Sort | 1 | 2 | 3 | 4 | 5 | 6 | 7 | 8 |
| [1] |
Bai JH,Ouyang H,Wang QG,Ding QY,Gao HF(2008).Application of Apack software on analyzing spatial pattern of wetland landscape on the Zoige Plateau.Chinese Journal of Eco-Agriculture,16, 1253-1256.
DOI URL |
| [白军红,欧阳华,王庆改,丁秋祎,高海峰(2008).基于Apack的若尔盖高原湿地景观空间格局分析.中国生态农业学报,16, 1253-1256.] | |
| [2] |
Brinson M,Malvárez AI(2002).Temperate freshwater wetlands: types, status and threats.Environmental Conservation,29, 115-133.
DOI URL |
| [3] | Chu L,Huang C,Liu GH,Liu QS(2014).Changes in ecological patterns of Maqu alpine wetland in Yellow River Source Area during 2000-2010.Progress in Geography,33, 326-335. |
| [褚琳,黄翀,刘高焕,刘庆生(2014).2000-2010年黄河源玛曲高寒湿地生态格局变化.地理科学进展,33, 326-335.] | |
| [4] | Fu YX,Zhao J,Li W(2014).Ecological sensitivity assessment of Maqu wetland in upper Yellow River.Yellow River,36(1), 65-66, 70. |
| [伏怡萱,赵军,李巍(2014).黄河上游玛曲湿地生态敏感性评估.人民黄河,36(1), 65-66, 70.] | |
| [5] | Gao YP(2019).Study on Degradation Evolution Process and Restoration Priority of Maqu Alpine Wetland in Gannan. Master degree dissertation,Beijing Forestry University, Beijing. |
| [高跃鹏(2019).甘南玛曲高寒湿地退化演化过程及恢复优先性研究. 硕士学位论文,北京林业大学, 北京.] | |
| [6] | Guo J,Li GP(2007).Climate change in Zoigê plateau marsh wetland and its impact on wetland degradation.Plateau Meteorology,26, 422-428. |
| [郭洁,李国平(2007).若尔盖气候变化及其对湿地退化的影响.高原气象,26, 422-428.] | |
| [7] | He JH(2016).Monitoring Wetland Change and Driving Factor Analysis from 2000 to 2014 in Zoigê. Master degree dissertation,Chengdu University of Technology, Chengdu. |
| [何菊红(2016).2000-2014年若尔盖湿地变化监测及驱动因子分析. 硕士学位论文,成都理工大学, 成都.] | |
| [8] | Hu XK,Wei HD,Chen F,Xu XY,Zhou JH,Tang JN(2012).Dynamic changes of alpine-cold wetland landscape in Maqu County in the Yellow River source region.Journal of Southwest Forestry University,32(6), 43-47. |
| [胡小柯,魏怀东,陈芳,徐先英,周坚华,唐进年(2012).黄河源区玛曲县高寒湿地景观动态变化.西南林业大学学报,32(6), 43-47.] | |
| [9] | Huang Q,Lan L,Yang WN,Deng DZ,Yan WX(2014).Analysis of landscape pattern changes of alpine wetland in Zoigê.Journal of Sichuan Forestry Science and Technology,35(6), 60-63. |
| [黄茜,蓝岚,杨武年,邓东周,鄢武先(2014).若尔盖高寒湿地景观格局变化分析.四川林业科技,35(6), 60-63.] | |
| [10] |
Junk WJ,An SQ,Finlayson CM,Gopal B,Květ J,Mitchell SA,Mitsch WJ,Robarts RD(2013).Current state of knowledge regarding the world’s wetlands and their future under global climate change: a synthesis.Aquatic Sciences,75, 151-167.
DOI URL |
| [11] | Li WL,Wang J,Guo SM,Wang Y(2009).Dynamic change of marsh landscape patterns and its driving forces in Maqu.Pratacultural Science,26(8), 57-62. |
| [李文龙,王晶,郭述茂,王莺(2009).玛曲沼泽湿地景观格局变化研究及驱动力分析.草业科学,26(8), 57-62.] | |
| [12] | Mitra S,Wassmann R,Vlek PLG(2005).An appraisal of global wetland area and its organic carbon stock.Current Science,88, 25-35. |
| [13] | Peng F(2012).Soff Moisture Quantitative Study of the Nanhui Tidal Flat in the Yangtze River Estuary. Master degree dissertation,Shanghai Ocean University, Shanghai. |
| [彭飞(2012).长江口南汇潮滩土壤湿度遥感研究. 硕士学位论文,上海海洋大学, 上海.] | |
| [14] | Qin DM,Feng J(2014).Study on natural grassland production potential and livestock capacity in Gannan.China Herbivore Science,34(5), 40-42. |
| [秦冬梅,冯今(2014).甘南天然草地生产潜力与载畜量研究.中国草食动物科学,34(5), 40-42.] | |
| [15] |
Verhoeven JTA,Arheimer B,Yin CQ,Hefting MM(2006).Regional and global concerns over wetlands and water quality.Trends in Ecology & Evolution,21, 96-103.
DOI URL |
| [16] | Wang YS,Xia ST(2018).A survey of random forests algorithms.Information and Communications Technologies,12, 49-55. |
| [王奕森,夏树涛(2018).集成学习之随机森林算法综述.信息通信技术,12, 49-55.] | |
| [17] | Wolfson L,Mokma D,Schultink G,Dersch E(2002).Development and use of a wetlands information system for assessing wetland functions.Lakes & Reservoirs: Research & Management,7, 207-216. |
| [18] | Wu JG(2007).Landscape Ecology. 2nd ed.Higher Education Press,Beijing. 106-107. |
| [邬建国(2007).景观生态学. 2版.高等教育出版社,北京. 106-107.] | |
| [19] | Xing Y(2015).Spatial responses of wetland change to climate in 32 years in Qinghai-Tibet Plateau.Remote Sensing for Land & Resources,27(3), 99-107. |
| [邢宇(2015).青藏高原32年湿地对气候变化的空间响应.国土资源遥感,27(3), 99-107.] | |
| [20] | Yu C(2017). Sustainable Development of the Tibetan Plateau Based on the Energy Ecological Footprint Model—Taking Qinghai and Tibet as an Example. Master degree dissertation,Lanzhou University, Lanzhou. |
| [余翠(2017).基于能值生态足迹模型的青藏高原地区可持续发展研究——以青海省、西藏自治区为例. 硕士学位论文,兰州大学, 兰州.] | |
| [21] | Zhang ZD(2012).Dynamic Monitoring of Maqu Wetland Based on 3S Technology. Master degree dissertation,Lanzhou University, Lanzhou. |
| [张志达(2012).基于3S的玛曲湿地动态监测研究. 硕士学位论文,兰州大学, 兰州.] | |
| [22] | Zhao ZL,Zhang YL,Liu LS,Liu FG,Zhang HF(2014).Advances in research on wetlands of the Tibetan Plateau.Progress in Geography,33, 1218-1230. |
| [赵志龙,张镱锂,刘林山,刘峰贵,张海峰(2014).青藏高原湿地研究进展.地理科学进展,33, 1218-1230.] | |
| [23] | Zhen S,Suolang D,Dong LQ,Yao PJ,Zheng RM(2016).Analysis on climate change characteristics of Zoige Plateau during 1967-2014.Journal of Southwest Forestry University,36(5), 138-143. |
| [甄硕,索朗夺尔基,董李勤,姚鹏举,郑茹敏(2016).若尔盖高原1967-2014年气候变化特征分析.西南林业大学学报,36(5), 138-143.] | |
| [24] | Zhou ZL,Sha JM,Fan YX,Shuai C,Gao S(2020).Remote sensing land usage classification and landscape pattern analysis based on random forest.Computer Systems & Applications,29(2), 40-48. |
| [周正龙,沙晋明,范跃新,帅晨,高尚(2020).基于随机森林的遥感土地利用分类及景观格局分析.计算机系统应用,29(2), 40-48.] | |
| [25] | Zuo XQ,LI XY,Liu HP(2020).Research on urban land cover classification based on random forest algorithm.Journal of the Hebei Academy of Sciences,37(1), 8-16. |
| [左晓庆,李潇雨,刘怀鹏(2020).基于随机森林算法的城区土地覆盖分类研究.河北省科学院学报,37(1), 8-16.] |
| [1] | 周春菡, 熊智诚, 杨明新, 史海兰, 周亚星, 唐玉, 张静, 纪宝明, 代心灵. 黄河源园区高寒湿地菌根真菌群落特征及其影响因素[J]. 植物生态学报, 2026, 50(3): 625-638. |
| [2] | 许梦真, 卢正宽, 谭星儒, 王彦兵, 苏天成, 窦山德, 潘庆民, 陈世苹. 呼伦贝尔草甸草原退化特征因子识别与快速诊断指标体系构建[J]. 植物生态学报, 2025, 49(1): 42-58. |
| [3] | 聂秀青, 王冬, 周国英, 熊丰, 杜岩功. 三江源地区高寒湿地土壤微生物生物量碳氮磷及其化学计量特征[J]. 植物生态学报, 2021, 45(9): 996-1005. |
| [4] | 汪浩,于凌飞,陈立同,王超,贺金生. 青藏高原海北高寒湿地土壤呼吸对水位降低和氮添加的响应[J]. 植物生态学报, 2014, 38(6): 619-625. |
| [5] | 李宏林, 徐当会, 杜国祯. 青藏高原高寒沼泽湿地在退化梯度上植物群落组成的改变对湿地水分状况的影响[J]. 植物生态学报, 2012, 36(5): 403-410. |
| [6] | 张志东, 臧润国. 海南岛霸王岭热带天然林景观格局与动态[J]. 植物生态学报, 2009, 33(6): 1034-1043. |
| [7] | 刘海江, 程维明, 龙恩. 受损沙地生态系统景观变化分析——以内蒙古浑善达克沙地为例[J]. 植物生态学报, 2007, 31(6): 1063-1072. |
| [8] | 王海珍, 张利权. 基于GIS、景观格局和网络分析法的厦门本岛生态网络规划[J]. 植物生态学报, 2005, 29(1): 144-152. |
| [9] | 张利权, 吴健平, 甄彧, 束炯. 基于GIS的上海市景观格局梯度分析[J]. 植物生态学报, 2004, 28(1): 78-85. |
| [10] | 马克明, 傅伯杰. 北京东灵山地区景观格局及破碎化评价[J]. 植物生态学报, 2000, 24(3): 320-326. |
| [11] | 郭晋平, 王俊田, 李世光. 关帝山林区景观要素沿环境梯度分布趋势的研究[J]. 植物生态学报, 2000, 24(2): 135-140. |
| 阅读次数 | ||||||
|
全文 |
|
|||||
|
摘要 |
|
|||||
Copyright © 2026 版权所有 《植物生态学报》编辑部
地址: 北京香山南辛村20号, 邮编: 100093
Tel.: 010-62836134, 62836138; Fax: 010-82599431; E-mail: apes@ibcas.ac.cn, cjpe@ibcas.ac.cn
备案号: 京ICP备16067583号-19
![]()