
Chin J Plant Ecol ›› 2021, Vol. 45 ›› Issue (6): 626-640.DOI: 10.17521/cjpe.2021.0042
• Research Articles • Previous Articles Next Articles
NI Ming, ZHANG Xi-Yue, JIANG Chao*( ), WANG He-Song
Received:2021-02-01
Accepted:2021-03-26
Online:2021-06-20
Published:2021-09-09
Contact:
JIANG Chao
Supported by:NI Ming, ZHANG Xi-Yue, JIANG Chao, WANG He-Song. Responses of vegetation to extreme climate events in southwestern China[J]. Chin J Plant Ecol, 2021, 45(6): 626-640.
Add to citation manager EndNote|Ris|BibTeX
URL: https://www.plant-ecology.com/EN/10.17521/cjpe.2021.0042
| 气候指数 Climate variables | 缩写(单位) Abbreviation (Units) | 定义 Definition |
|---|---|---|
| 年平均气温 Mean annual air temperature | TM (℃) | 日平均气温的年平均值 Yearly mean value of daily mean air temperature |
| 日最高气温的最大值 Maximum value of daily maximum air temperature | TXx (℃) | 日最高气温的年最大值 Yearly maximum value of daily maximum air temperature |
| 暖昼日数 Warm days | TX90 (d) | 日最高气温>90%分位值的日数 Number of days when daily maximum air temperature >90th percentile |
| 夏季日数 Summer days | SU (d) | 日最高气温大于25 ℃的全部天数 Annual count of days when daily maximum air temperature >25 °C |
| 日最高气温的最小值 Minimum value of daily maximum air temperature | TXn (℃) | 日最高气温的年最小值 Yearly minimum value of daily maximum air temperature |
| 冷昼日数 Cool days | TX10 (d) | 日最高气温<10%分位值的日数 Number of days when daily maximum air temperature <10th percentile |
| 冰冻日数 Icing days | ID (d) | 日最高气温<0 ℃的全部天数 Annual count of days when daily maximum air temperature <0 °C |
| 日最低气温的最大值 Maximum value of daily minimum air temperature | TNx (℃) | 日最低气温的年最大值 Yearly maximum value of daily minimum air temperature |
| 暖夜日数 Warm nights | TN90 (d) | 日最低气温>90%分位值的日数 Number of days when daily minimum air temperature >90th percentile |
| 热带夜数 Tropical nights | TR (d) | 日最低气温大于20 ℃的全部天数 Annual count of days when daily minimum air temperature >20 °C |
| 日最低气温的最小值 Minimum value of daily minimum air temperature | TNn (℃) | 日最低气温的年最小值 Yearly minimum value of daily minimum temperature |
| 冷夜日数 Cool nights | TN10 (d) | 日最低气温<10%分位值的日数 Number of days when daily minimum air temperature <10th percentile |
| 霜冻日数 Frost days | FD (d) | 日最低气温小于0 ℃的全部天数 Annual count of days when daily minimum air temperature <0 °C |
| 持续冷期指数 Cold spell duration index | CSDI (d) | 至少连续6天最低气温小于基准期内10%分位值的天数 Annual count of days with at least 6 consecutive days when daily minimum air temperature <10th percentile |
| 持续暖期指数 Warm spell duration index | WSDI (d) | 至少连续6天最高气温大于基准期内90%分位值的天数 Annual count of days with at least 6 consecutive days when daily maximum air temperature >90th percentile |
| 生长季长度 Growing season length | GSL (d) | 第一次连续6天以上日平均气温大于5 ℃至第一次(6月1日后)连续6天日平均气温小于5 ℃的天数 Annual count between first span of at least 6 days with daily mean air temperature >5 °C and first span after June 1st of 6 days with daily mean air temperature <5 °C |
| 气温日较差 Diel temperature range | DTR (℃) | 日最高气温与最低气温的差的平均值 Yearly mean difference between daily maximum air temperature and daily minimum air temperature |
| 年降水量 Annual precipitation | PRE (mm) | 年总降水量 Total annual precipitation |
| 湿日总降水量 Annual total precipitation on wet days | PRCPTOT (mm) | 大于等于1 mm的日降水量的总和 Annual total precipitation on wet days (daily precipitation ≥1 mm) |
| 强降水量 Precipitation amount on very wet days | R95 (mm) | 大于基准期内95%分位点的日降水量的总和 Annual total precipitation on days when daily precipitation >95th percentile |
| 极端强降水量 Precipitation amount on extremely wet days | R99 (mm) | 大于基准期内99%分位点的日降水量的总和 Annual total precipitation on days when daily precipitation >99th percentile |
| 降水强度 Simple daily intensity index for precipitation | SDII (mm·d-1) | 降水量与降水日数的比值 Annual total precipitation divided by the number of wet days (defined as daily precipitation ≥1.0 mm) in the year |
| 1日最大降水量 Maximum 1-day precipitation | Rx1day (mm) | 最大的日降水量 Yearly maximum value of daily precipitation |
| 5日最大降水量 Maximum 5-day consecutive precipitation | Rx5day (mm) | 最大的连续5天降水量 Yearly maximum 5-day consecutive precipitation |
| 连续湿日数 Consecutive wet days | CWD (d) | 最长连续降水日数 Yearly maximum number of consecutive days with a daily precipitation ≥1 mm |
| 连续干日数 Consecutive dry days | CDD (d) | 最长连续无降水日数 Yearly maximum number of consecutive days with daily precipitation <1 mm |
| 降水日数 Number of wet days | R1mm (d) | 日降水量≥1 mm的天数 Number of days when daily precipitation ≥1 mm |
| 中雨日数 Number of heavy precipitation days | R10mm (d) | 日降水量≥10 mm的天数 Annual count of days when daily precipitation ≥10 mm |
| 大雨日数 Number of very heavy precipitation days | R20mm (d) | 日降水量≥20 mm的天数 Annual count of days when daily precipitation ≥20 mm |
Table 1 Selection of and definitions on climate extreme variables
| 气候指数 Climate variables | 缩写(单位) Abbreviation (Units) | 定义 Definition |
|---|---|---|
| 年平均气温 Mean annual air temperature | TM (℃) | 日平均气温的年平均值 Yearly mean value of daily mean air temperature |
| 日最高气温的最大值 Maximum value of daily maximum air temperature | TXx (℃) | 日最高气温的年最大值 Yearly maximum value of daily maximum air temperature |
| 暖昼日数 Warm days | TX90 (d) | 日最高气温>90%分位值的日数 Number of days when daily maximum air temperature >90th percentile |
| 夏季日数 Summer days | SU (d) | 日最高气温大于25 ℃的全部天数 Annual count of days when daily maximum air temperature >25 °C |
| 日最高气温的最小值 Minimum value of daily maximum air temperature | TXn (℃) | 日最高气温的年最小值 Yearly minimum value of daily maximum air temperature |
| 冷昼日数 Cool days | TX10 (d) | 日最高气温<10%分位值的日数 Number of days when daily maximum air temperature <10th percentile |
| 冰冻日数 Icing days | ID (d) | 日最高气温<0 ℃的全部天数 Annual count of days when daily maximum air temperature <0 °C |
| 日最低气温的最大值 Maximum value of daily minimum air temperature | TNx (℃) | 日最低气温的年最大值 Yearly maximum value of daily minimum air temperature |
| 暖夜日数 Warm nights | TN90 (d) | 日最低气温>90%分位值的日数 Number of days when daily minimum air temperature >90th percentile |
| 热带夜数 Tropical nights | TR (d) | 日最低气温大于20 ℃的全部天数 Annual count of days when daily minimum air temperature >20 °C |
| 日最低气温的最小值 Minimum value of daily minimum air temperature | TNn (℃) | 日最低气温的年最小值 Yearly minimum value of daily minimum temperature |
| 冷夜日数 Cool nights | TN10 (d) | 日最低气温<10%分位值的日数 Number of days when daily minimum air temperature <10th percentile |
| 霜冻日数 Frost days | FD (d) | 日最低气温小于0 ℃的全部天数 Annual count of days when daily minimum air temperature <0 °C |
| 持续冷期指数 Cold spell duration index | CSDI (d) | 至少连续6天最低气温小于基准期内10%分位值的天数 Annual count of days with at least 6 consecutive days when daily minimum air temperature <10th percentile |
| 持续暖期指数 Warm spell duration index | WSDI (d) | 至少连续6天最高气温大于基准期内90%分位值的天数 Annual count of days with at least 6 consecutive days when daily maximum air temperature >90th percentile |
| 生长季长度 Growing season length | GSL (d) | 第一次连续6天以上日平均气温大于5 ℃至第一次(6月1日后)连续6天日平均气温小于5 ℃的天数 Annual count between first span of at least 6 days with daily mean air temperature >5 °C and first span after June 1st of 6 days with daily mean air temperature <5 °C |
| 气温日较差 Diel temperature range | DTR (℃) | 日最高气温与最低气温的差的平均值 Yearly mean difference between daily maximum air temperature and daily minimum air temperature |
| 年降水量 Annual precipitation | PRE (mm) | 年总降水量 Total annual precipitation |
| 湿日总降水量 Annual total precipitation on wet days | PRCPTOT (mm) | 大于等于1 mm的日降水量的总和 Annual total precipitation on wet days (daily precipitation ≥1 mm) |
| 强降水量 Precipitation amount on very wet days | R95 (mm) | 大于基准期内95%分位点的日降水量的总和 Annual total precipitation on days when daily precipitation >95th percentile |
| 极端强降水量 Precipitation amount on extremely wet days | R99 (mm) | 大于基准期内99%分位点的日降水量的总和 Annual total precipitation on days when daily precipitation >99th percentile |
| 降水强度 Simple daily intensity index for precipitation | SDII (mm·d-1) | 降水量与降水日数的比值 Annual total precipitation divided by the number of wet days (defined as daily precipitation ≥1.0 mm) in the year |
| 1日最大降水量 Maximum 1-day precipitation | Rx1day (mm) | 最大的日降水量 Yearly maximum value of daily precipitation |
| 5日最大降水量 Maximum 5-day consecutive precipitation | Rx5day (mm) | 最大的连续5天降水量 Yearly maximum 5-day consecutive precipitation |
| 连续湿日数 Consecutive wet days | CWD (d) | 最长连续降水日数 Yearly maximum number of consecutive days with a daily precipitation ≥1 mm |
| 连续干日数 Consecutive dry days | CDD (d) | 最长连续无降水日数 Yearly maximum number of consecutive days with daily precipitation <1 mm |
| 降水日数 Number of wet days | R1mm (d) | 日降水量≥1 mm的天数 Number of days when daily precipitation ≥1 mm |
| 中雨日数 Number of heavy precipitation days | R10mm (d) | 日降水量≥10 mm的天数 Annual count of days when daily precipitation ≥10 mm |
| 大雨日数 Number of very heavy precipitation days | R20mm (d) | 日降水量≥20 mm的天数 Annual count of days when daily precipitation ≥20 mm |
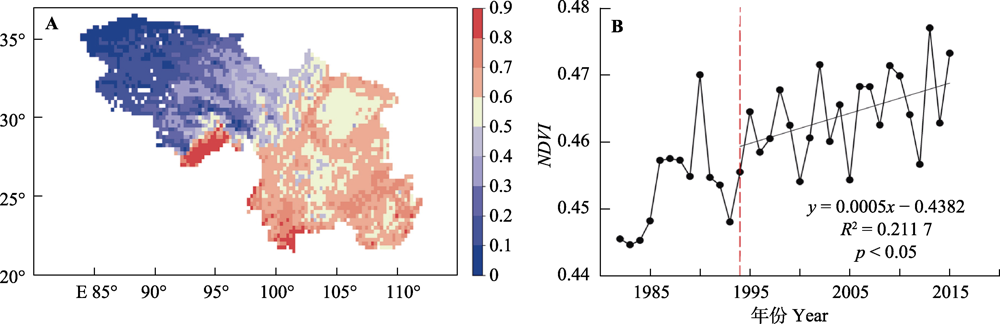
Fig. 1 Spatial pattern of mean annual normalized differential vegetation index (NDVI)(A) and inter-annual variations in regional average NDVI (B) in southwestern China from 1982 to 2015.
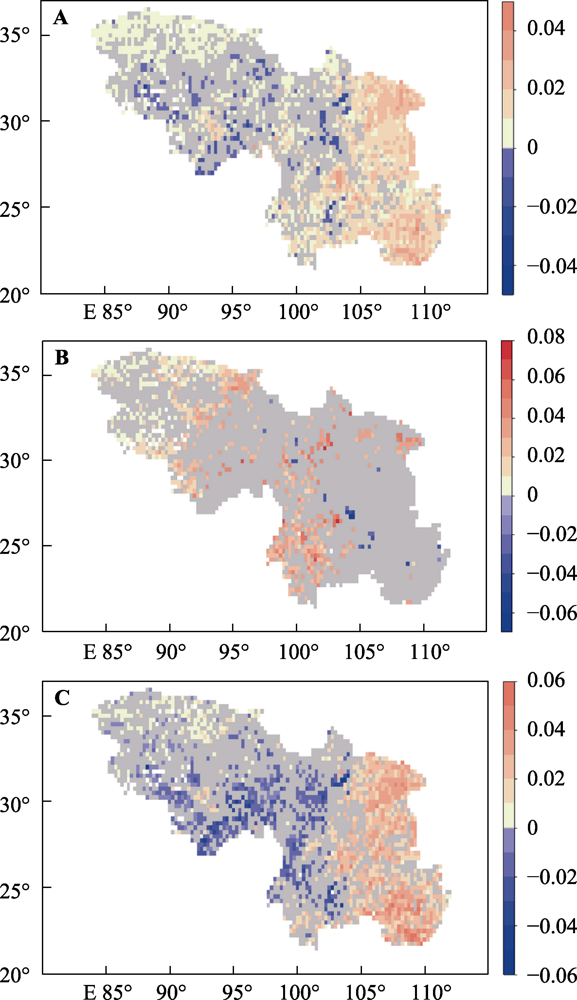
Fig. 2 Spatial patterns of changes in normalized differential vegetation index (NDVI) in southwestern China during periods 1982-2015 (A), 1982-1993 (B) and 1994-2015 (C). Gray-coded areas are where no significant changes in NDVI were detected (p > 0.05).
| 气候指数 Climate variables | 气候指数变化趋势(每10年) Trends of climate indicators (per 10 a) | ||
|---|---|---|---|
| 1982-2015 | 1982-1993 | 1994-2015 | |
| TM (℃) | 0.375** | 0.221 | 0.368** |
| TXx (℃) | 0.305** | -0.243 | 0.248 |
| TX90 (d) | 6.840** | -1.209 | 8.914** |
| SU (d) | 3.387** | 0.671 | 4.129** |
| TXn (℃) | 0.262 | 0.391 | -0.099 |
| TX10 (d) | -6.077** | -4.626 | -5.243 |
| ID (d) | -3.338** | -3.583 | -3.795** |
| TNx (℃) | 0.359** | 0.356 | 0.486** |
| TN90 (d) | 9.127** | 6.265 | 10.896** |
| TR (d) | 1.753** | -1.061 | 2.159** |
| TNn (℃) | 0.462** | 0.660 | 0.287 |
| TN10 (d) | -6.239** | -5.590 | -4.777* |
| FD (d) | -5.374** | -4.716 | -4.468** |
| CSDI (d) | -0.807* | -1.164 | -1.058 |
| WSDI (d) | 0.950** | -0.620 | 1.012 |
| GSL (d) | 4.316** | 0.273 | 3.482** |
| DTR (℃) | -0.005 | -0.085 | 0.012 |
| PRE (mm) | 0.699 | -21.112 | -11.668 |
| PRCPTOT (mm) | 2.825 | -20.346 | -6.832 |
| R95 (mm) | 2.461 | -17.008 | -3.946 |
| R99 (mm) | 1.567 | -13.383 | 5.835 |
| SDII (mm·d-1) | 0.014 | -0.068 | -0.041 |
| Rx1day (mm) | 0.623 | -1.490 | 1.752* |
| Rx5day (mm) | 0.652 | -3.921 | 1.102 |
| CWD (d) | 0.141 | 0.745 | -0.042 |
| CDD (d) | -0.603 | -5.610 | 3.480* |
| R1mm (d) | -0.002 | 0.454 | -1.947 |
| R10mm (d) | -0.215 | -1.307 | -0.702 |
| R20mm (d) | 0.092 | -0.724 | -0.088 |
Table 2 Trends of regional average climate extreme variables in southwestern China during periods 1982-2015, 1982-1993 and 1994-2015
| 气候指数 Climate variables | 气候指数变化趋势(每10年) Trends of climate indicators (per 10 a) | ||
|---|---|---|---|
| 1982-2015 | 1982-1993 | 1994-2015 | |
| TM (℃) | 0.375** | 0.221 | 0.368** |
| TXx (℃) | 0.305** | -0.243 | 0.248 |
| TX90 (d) | 6.840** | -1.209 | 8.914** |
| SU (d) | 3.387** | 0.671 | 4.129** |
| TXn (℃) | 0.262 | 0.391 | -0.099 |
| TX10 (d) | -6.077** | -4.626 | -5.243 |
| ID (d) | -3.338** | -3.583 | -3.795** |
| TNx (℃) | 0.359** | 0.356 | 0.486** |
| TN90 (d) | 9.127** | 6.265 | 10.896** |
| TR (d) | 1.753** | -1.061 | 2.159** |
| TNn (℃) | 0.462** | 0.660 | 0.287 |
| TN10 (d) | -6.239** | -5.590 | -4.777* |
| FD (d) | -5.374** | -4.716 | -4.468** |
| CSDI (d) | -0.807* | -1.164 | -1.058 |
| WSDI (d) | 0.950** | -0.620 | 1.012 |
| GSL (d) | 4.316** | 0.273 | 3.482** |
| DTR (℃) | -0.005 | -0.085 | 0.012 |
| PRE (mm) | 0.699 | -21.112 | -11.668 |
| PRCPTOT (mm) | 2.825 | -20.346 | -6.832 |
| R95 (mm) | 2.461 | -17.008 | -3.946 |
| R99 (mm) | 1.567 | -13.383 | 5.835 |
| SDII (mm·d-1) | 0.014 | -0.068 | -0.041 |
| Rx1day (mm) | 0.623 | -1.490 | 1.752* |
| Rx5day (mm) | 0.652 | -3.921 | 1.102 |
| CWD (d) | 0.141 | 0.745 | -0.042 |
| CDD (d) | -0.603 | -5.610 | 3.480* |
| R1mm (d) | -0.002 | 0.454 | -1.947 |
| R10mm (d) | -0.215 | -1.307 | -0.702 |
| R20mm (d) | 0.092 | -0.724 | -0.088 |
| 气候指数 Climate variables | 1982-2015 | 1982-1993 | 1994-2015 | |||
|---|---|---|---|---|---|---|
| 去趋势前 Before data detrending | 去趋势后 After data detrending | 去趋势前 Before data detrending | 去趋势后 After data detrending | 去趋势前 Before data detrending | 去趋势后 After data detrending | |
| TM (℃) | 0.743** | 0.348* | 0.536 | 0.154 | 0.589** | 0.408 |
| TXx (℃) | 0.547** | 0.357* | 0.193 | 0.213 | 0.400 | 0.449* |
| TX90 (d) | 0.638** | 0.504** | 0.291 | 0.382 | 0.533* | 0.552** |
| SU (d) | 0.692** | 0.437* | 0.056 | 0.003 | 0.648** | 0.546* |
| TXn (℃) | 0.395* | 0.255 | 0.482 | 0.566 | 0.131 | 0.119 |
| TX10 (d) | -0.670** | -0.346* | -0.586 | 0.475 | -0.460* | -0.288 |
| ID (d) | -0.616** | -0.241 | -0.299 | -0.040 | -0.522* | -0.348 |
| TNx (℃) | 0.662** | 0.022 | 0.382 | -0.388 | 0.524* | 0.222 |
| TN90 (d) | 0.551** | -0.100 | 0.098 | -0.459 | 0.364 | 0.037 |
| TR (d) | 0.496** | -0.087 | -0.063 | -0.046 | 0.318 | -0.106 |
| TNn (℃) | 0.544** | 0.298 | 0.600* | 0.634* | 0.164 | 0.114 |
| TN10 (d) | -0.688** | -0.329 | -0.606* | -0.414 | -0.448* | -0.312 |
| FD (d) | -0.710** | -0.075 | -0.487 | 0.253 | -0.470* | -0.219 |
| CSDI (d) | -0.342* | -0.038 | -0.531 | -0.320 | -0.106 | 0.062 |
| WSDI (d) | 0.481** | 0.229 | 0.230 | 0.260 | 0.287 | 0.234 |
| GSL (d) | 0.695** | 0.242 | 0.522 | 0.176 | 0.482* | 0.273 |
| DTR (℃) | 0.283 | 0.670** | 0.015 | 0.494 | 0.617** | 0.749** |
| PRE (mm) | 0.033 | -0.028 | -0.128 | 0.043 | -0.024 | -0.063 |
| PRCPTOT (mm) | 0.071 | -0.011 | -0.118 | 0.043 | 0.024 | -0.035 |
| R95 (mm) | 0.132 | 0.049 | -0.219 | -0.041 | 0.156 | 0.081 |
| R99 (mm) | 0.209 | 0.154 | -0.038 | 0.029 | 0.355 | 0.191 |
| SDII (mm·d-1) | 0.164 | 0.044 | -0.026 | 0.016 | 0.133 | 0.053 |
| Rx1day (mm) | 0.366* | 0.281 | -0.038 | 0.117 | 0.522* | 0.320 |
| Rx5day (mm) | 0.144 | 0.046 | -0.437 | -0.265 | 0.294 | 0.147 |
| CWD (d) | -0.009 | -0.267 | 0.029 | -0.321 | -0.125 | -0.252 |
| CDD (d) | -0.122 | -0.022 | -0.355 | -0.307 | 0.342 | 0.113 |
| R1mm (d) | -0.103 | -0.243 | 0.022 | -0.087 | -0.455* | -0.354 |
| R10mm (d) | -0.016 | 0.100 | -0.213 | 0.158 | 0.037 | 0.077 |
| R20mm (d) | 0.156 | 0.161 | -0.368 | 0.195 | 0.192 | 0.150 |
Table 3 Correlations between regional average normalized differential vegetation index (NDVI) and climate extreme variables in southwestern China during periods 1982-2015, 1982-1993 and 1994-2015 before and after data detrending.
| 气候指数 Climate variables | 1982-2015 | 1982-1993 | 1994-2015 | |||
|---|---|---|---|---|---|---|
| 去趋势前 Before data detrending | 去趋势后 After data detrending | 去趋势前 Before data detrending | 去趋势后 After data detrending | 去趋势前 Before data detrending | 去趋势后 After data detrending | |
| TM (℃) | 0.743** | 0.348* | 0.536 | 0.154 | 0.589** | 0.408 |
| TXx (℃) | 0.547** | 0.357* | 0.193 | 0.213 | 0.400 | 0.449* |
| TX90 (d) | 0.638** | 0.504** | 0.291 | 0.382 | 0.533* | 0.552** |
| SU (d) | 0.692** | 0.437* | 0.056 | 0.003 | 0.648** | 0.546* |
| TXn (℃) | 0.395* | 0.255 | 0.482 | 0.566 | 0.131 | 0.119 |
| TX10 (d) | -0.670** | -0.346* | -0.586 | 0.475 | -0.460* | -0.288 |
| ID (d) | -0.616** | -0.241 | -0.299 | -0.040 | -0.522* | -0.348 |
| TNx (℃) | 0.662** | 0.022 | 0.382 | -0.388 | 0.524* | 0.222 |
| TN90 (d) | 0.551** | -0.100 | 0.098 | -0.459 | 0.364 | 0.037 |
| TR (d) | 0.496** | -0.087 | -0.063 | -0.046 | 0.318 | -0.106 |
| TNn (℃) | 0.544** | 0.298 | 0.600* | 0.634* | 0.164 | 0.114 |
| TN10 (d) | -0.688** | -0.329 | -0.606* | -0.414 | -0.448* | -0.312 |
| FD (d) | -0.710** | -0.075 | -0.487 | 0.253 | -0.470* | -0.219 |
| CSDI (d) | -0.342* | -0.038 | -0.531 | -0.320 | -0.106 | 0.062 |
| WSDI (d) | 0.481** | 0.229 | 0.230 | 0.260 | 0.287 | 0.234 |
| GSL (d) | 0.695** | 0.242 | 0.522 | 0.176 | 0.482* | 0.273 |
| DTR (℃) | 0.283 | 0.670** | 0.015 | 0.494 | 0.617** | 0.749** |
| PRE (mm) | 0.033 | -0.028 | -0.128 | 0.043 | -0.024 | -0.063 |
| PRCPTOT (mm) | 0.071 | -0.011 | -0.118 | 0.043 | 0.024 | -0.035 |
| R95 (mm) | 0.132 | 0.049 | -0.219 | -0.041 | 0.156 | 0.081 |
| R99 (mm) | 0.209 | 0.154 | -0.038 | 0.029 | 0.355 | 0.191 |
| SDII (mm·d-1) | 0.164 | 0.044 | -0.026 | 0.016 | 0.133 | 0.053 |
| Rx1day (mm) | 0.366* | 0.281 | -0.038 | 0.117 | 0.522* | 0.320 |
| Rx5day (mm) | 0.144 | 0.046 | -0.437 | -0.265 | 0.294 | 0.147 |
| CWD (d) | -0.009 | -0.267 | 0.029 | -0.321 | -0.125 | -0.252 |
| CDD (d) | -0.122 | -0.022 | -0.355 | -0.307 | 0.342 | 0.113 |
| R1mm (d) | -0.103 | -0.243 | 0.022 | -0.087 | -0.455* | -0.354 |
| R10mm (d) | -0.016 | 0.100 | -0.213 | 0.158 | 0.037 | 0.077 |
| R20mm (d) | 0.156 | 0.161 | -0.368 | 0.195 | 0.192 | 0.150 |

Fig. 3 Spatial patterns of correlation between normalized differential vegetation index (NDVI) and temperature-extreme variables after data detrending in southwestern China from 1982 to 2015. A, Mean annual air temperature. B, Maximum value of daily maximum air temperature. C, Warm days. D, Summer days. E, Cool days. F, Diel temperature range. Gray-coded areas are where no significant correlation was detected between NDVI and temperature-extreme variables (p > 0.05). The warm tone indicates positive significance (r > 0, p < 0.05), and the cold tone indicates negative significance (r < 0, p < 0.05).
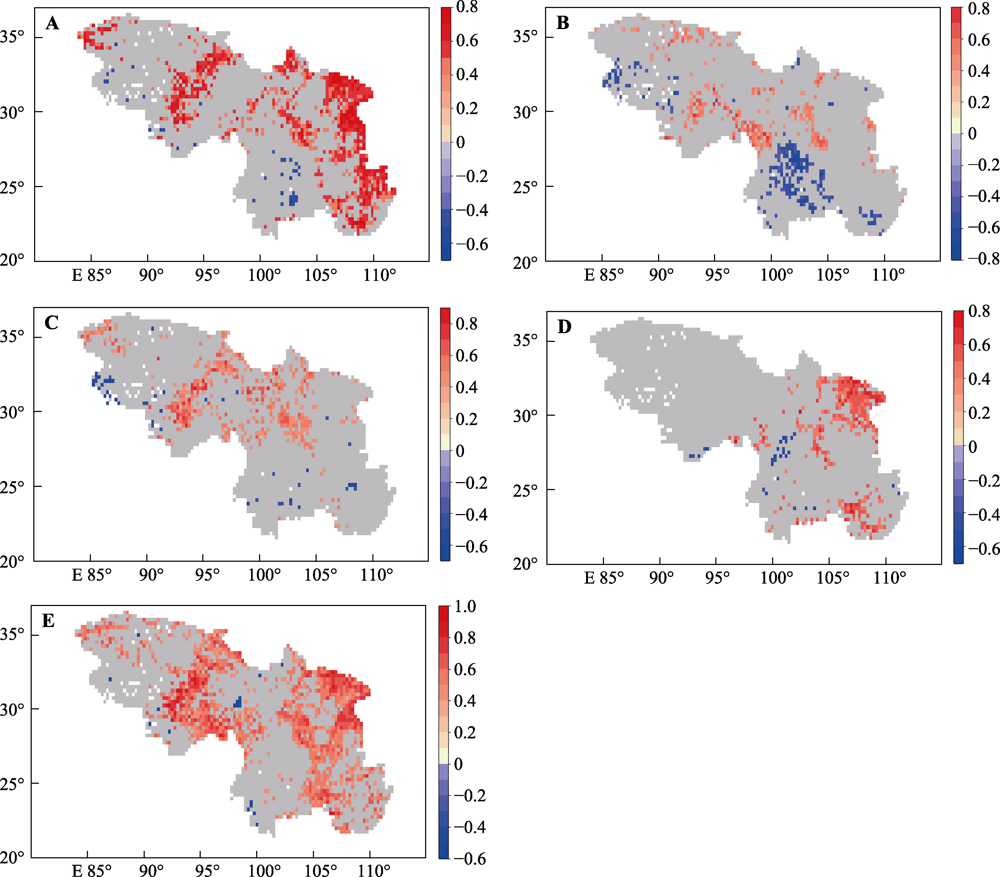
Fig. 4 Spatial patterns of correlation between normalized differential vegetation index (NDVI) and temperature-variables after data detrending in southwestern China from 1994 to 2015. A, Mean annual air temperature. B, Maximum value of daily maximum air temperature. C, Warm days. D, Summer days. E, Diel temperature range. Gray-coded areas are where no significant correlation was detected between NDVI and temperature-extreme variables (p > 0.05). The warm tone indicates positive significance (r > 0, p < 0.05), and the cold tone indicates negative significance (r < 0, p < 0.05).
| [1] |
Alexander LV, Zhang X, Peterson TC, Caesar J, Gleason B, Klein Tank AMG, Haylock M, Collins D, Trewin B, Rahimzadeh F, Tagipour A, Rupa Kumar K, Revadekar J, Griffiths G, Vincent L, et al. (2006). Global observed changes in daily climate extremes of temperature and precipitation. Journal of Geophysical Research, 111, D05109. DOI: 10.1029/2005JD006290.
DOI |
| [2] |
Ali H, Mishra V (2018). Contributions of dynamic and thermodynamic scaling in subdaily precipitation extremes in India. Geophysical Research Letters, 45, 2352-2361.
DOI URL |
| [3] | Anderson JT, Inouye DW, Mckinney AM, Colautti RI, Mitchell-Olds T (2012). Phenotypic plasticity and adaptive evolution contribute to advancing flowering phenology in response to climate change. Proceedings of the Royal Society B, 279, 3843-3852. |
| [4] | Bai SY, Wu Q, Shi JQ, Lu Y(2015). Analysis on vegetation coverage change in Shannan, Tibet, China based on remotely sensed data. Journal of Desert Research, 35, 1396-1402. |
| [ 白淑英, 吴奇, 史建桥, 陆源(2015). 基于时间序列遥感数据的西藏山南地区植被覆盖变化特征分析. 中国沙漠, 35, 1396-1402.] | |
| [5] |
Boccolari M, Malmusi S (2013). Changes in temperature and precipitation extremes observed in Modena, Italy. Atmospheric Research, 122, 16-31.
DOI URL |
| [6] |
Chen T, Ao TQ, Zhang X, Li XD, Yang KB (2019). Climate change characteristics of extreme temperature in the Minjiang River Basin. Advances in Meteorology, 2019, 1935719. DOI: 10.1155/2019/1935719.
DOI |
| [7] |
Chen WZ, Huang CJ, Wang LC, Li DM (2018). Climate extremes and their impacts on interannual vegetation variabilities: a case study in Hubei Province of central China. Remote Sensing, 10, 477. DOI: 10.3390/rs10030477.
DOI URL |
| [8] |
Ciais P, Reichstein M, Viovy N, Granier A, Ogée J, Allard V, Aubinet M, Buchmann N, Bernhofer C, Carrara A, Chevallier F, de Noblet N, Friend AD, Friedlingstein P, Grünwald T, et al. (2005). Europe-wide reduction in primary productivity caused by the heat and drought in 2003. Nature, 437, 529-533.
DOI URL |
| [9] |
Cook BI, Smerdon JE, Seager R, Coats S (2014). Global warming and 21st century drying. Climate Dynamics, 43, 2607-2627.
DOI URL |
| [10] |
Deng HJ, Chen YN, Shi X, Li WH, Wang HJ, Zhang SH, Fang GH (2014). Dynamics of temperature and precipitation extremes and their spatial variation in the arid region of northwest China. Atmospheric Research, 138, 346-355.
DOI URL |
| [11] | Donat MG, Alexander LV, Yang H, Durre I, Vose R, Dunn RJH, Willett KM, Aguilar E, Brunet M, Caesar J, Hewitson B, Jack C, Klein Tank AMG, Kruger AC, Marengo J, et al. (2013). Updated analyses of temperature and precipitation extreme indices since the beginning of the twentieth century: the HadEX2 dataset. Journal of Geophysical Research, 118, 2098-2118. |
| [12] |
Fallah-Ghalhari G, Shakeri F, Dadashi-Roudbari A (2019). Impacts of climate changes on the maximum and minimum temperature in Iran. Theoretical and Applied Climatology, 138, 1539-1562.
DOI URL |
| [13] | Feng L(2020). Study on the Characteristics of Extreme Climate Change in Sichuan-Chongqing Region and Its Impact on NDVI. Master degree dissertation, Northwest Normal University,Lanzhou. |
| [ 冯磊(2020). 川渝地区极端气候变化特征及其对NDVI的影响研究. 硕士学位论文, 西北师范大学, 兰州.] | |
| [14] | Feng L, Yang D, Huang YY(2020). Vegetation NDVI characteristics and response to extreme climate in Sichuan and Chongqing from 2000 to 2017. Chinese Journal of Ecology, 39, 2316-2326. |
| [ 冯磊, 杨东, 黄悦悦(2020). 2000-2017年川渝地区植被NDVI特征及其对极端气候的响应. 生态学杂志, 39, 2316-2326.] | |
| [15] | Fischer EM, Knutti R (2015). Anthropogenic contribution to global occurrence of heavy-precipitation and high-temperature extremes. Nature Climate Change, 5, 560-564. |
| [16] |
Hatfield JL, Prueger JH (2015). Temperature extremes: effect on plant growth and development. Weather and Climate Extremes, 10, 4-10.
DOI URL |
| [17] | He JH, Cai YL, Qin P(2020). Spatial and temporal variations of carbon dioxide and its influencing factors. Chinese Science Bulletin, 65, 194-202. |
| [ 何江浩, 蔡玉林, 秦鹏(2020). 二氧化碳的时空变化规律与影响因素分析. 科学通报, 65, 194-202.] | |
| [18] | He M, Wang HS, Sun JX(2019). Characters of ecosystem vulnerability in southwestern China based on vegetation productivity. Chinese Journal of Applied Ecology, 30, 429-438. |
| [ 何敏, 王鹤松, 孙建新(2019). 基于植被生产力的西南地区生态系统脆弱性特征. 应用生态学报, 30, 429-438.] | |
| [19] | He YL, Xiong QL, Yu L, Qu XX, Yan WB(2019). Adaptability of vegetation ecosystem to climate change based on the NDVI in Yunnan Province, China. Ecological Science, 38, 165-172. |
| [ 何云玲, 熊巧利, 余岚, 屈新星, 闫文波(2019). 基于NDVI云南地区植被生态系统对气候变化的适应性分析. 生态科学, 38, 165-172.] | |
| [20] | He ZB, Du J, Chen LF, Zhu X, Lin PF, Zhao MM, Fang S (2018). Impacts of recent climate extremes on spring phenology in arid-mountain ecosystems in China. Agricultural and Forest Meteorology, 260-261, 31-40. |
| [21] |
Hikosaka K, Ishikawa K, Borjigidai A, Muller O, Onoda Y (2006). Temperature acclimation of photosynthesis: mechanisms involved in the changes in temperature dependence of photosynthetic rate. Journal of Experimental Botany, 57, 291-302.
PMID |
| [22] |
Hou WJ, Gao JB, Wu SH, Dai EF (2015). Interannual variations in growing-season NDVI and its correlation with climate variables in the southwestern Karst region of China. Remote Sensing, 7, 11105-11124.
DOI URL |
| [23] |
Iler AM, Inouye DW, Schmidt NM, Høye TT (2017). Detrending phenological time series improves climate-phenology analyses and reveals evidence of plasticity. Ecology, 98, 647-655.
DOI PMID |
| [24] |
Inouye DW (2008). Effects of climate change on phenology, frost damage, and floral abundance of montane wildflowers. Ecology, 89, 353-362.
PMID |
| [25] | Jiang AL, Chen SB, Gong SX(1990). Characteristics of diurnal temperature range in Xishuangbanna and its significance in Agriculture. Chinese Journal of Agrometeorology, 11, 44-46. |
| [ 江爱良, 陈沈斌, 宫世贤(1990). 西双版纳气温日较差的特点及其在农业上的意义. 中国农业气象, 11, 44-46.] | |
| [26] |
Jiang SS, Chen X, Smettem K, Wang TJ (2021). Climate and land use influences on changing spatiotemporal patterns of mountain vegetation cover in southwest China. Ecological Indicators, 121, 107193. DOI: 10.1016/j.ecolind.2020.107193.
DOI URL |
| [27] | Jiang YC, Li DL, Zheng R(2020). Variation characteristics of snow cover and frozen soil and their relationships with vegetation in the Tibetan Plateau from 1971 to 2016. Transactions Atmospheric Sciences, 43, 481-494. |
| [ 蒋元春, 李栋梁, 郑然(2020). 1971-2016年青藏高原积雪冻土变化特征及其与植被的关系. 大气科学学报, 43, 481-494.] | |
| [28] |
John R, Chen JQ, Ouyang ZT, Xiao JF, Becker R, Samanta A, Ganguly S, Yuan WP, Batkhishig O (2013). Vegetation response to extreme climate events on the Mongolian Plateau from 2000 to 2010. Environmental Research Letters, 8, 035033. DOI: 10.1088/1748-9326/8/3/035033.
DOI URL |
| [29] |
Keggenhoff I, Elizbarashvili M, Amiri-Farahani A, King L (2014). Trends in daily temperature and precipitation extremes over Georgia, 1971-2010. Weather and Climate Extremes, 4, 75-85.
DOI URL |
| [30] |
Lesk C, Rowhani P, Ramankutty N (2016). Influence of extreme weather disasters on global crop production. Nature, 529, 84-87.
DOI URL |
| [31] |
Li CL, Filho WL, Wang J, Yin J, Fedoruk M, Bao G, Bao YH, Yin S, Yu S, Hu RC (2018a). An assessment of the impacts of climate extremes on the vegetation in Mongolian Plateau: using a scenarios-based analysis to support regional adaptation and mitigation options. Ecological Indicators, 95, 805-814.
DOI URL |
| [32] |
Li CL, Wang J, Hu RC, Yin S, Bao YH, Ayal DY (2018b). Relationship between vegetation change and extreme climate indices on the Inner Mongolia Plateau, China, from 1982 to 2013. Ecological Indicators, 89, 101-109.
DOI URL |
| [33] | Li HM, Li L(2015). Mean and extreme climate change on the Qinghai-Tibetan Plateau with a 2 °C global warming. Progressus Inquisitiones DE Mutatione Climatis, 11, 157-164. |
| [ 李红梅, 李林(2015). 2 ℃全球变暖背景下青藏高原平均气候和极端气候事件变化. 气候变化研究进展, 11, 157-164.] | |
| [34] |
Lian Y, You GJY, Lin K, Jiang Z, Zhang C, Qin X (2015). Characteristics of climate change in southwest China karst region and their potential environmental impacts. Environmental Earth Sciences, 74, 937-944.
DOI URL |
| [35] |
Liu D, Wang T, Yang T, Yan ZJ, Liu YW, Zhao YT, Piao SL (2019). Deciphering impacts of climate extremes on Tibetan grasslands in the last fifteen years. Science Bulletin, 64, 446-454.
DOI URL |
| [36] | Liu D, Yu CL(2017). Effects of climate change on the distribution of main vegetation types in Northeast China. Acta Ecologica Sinica, 37, 6511-6522. |
| [ 刘丹, 于成龙(2017). 气候变化对东北主要地带性植被类型分布的影响. 生态学报, 37, 6511-6522.] | |
| [37] | Liu JG, Wan JH, Tan XM, Ma JM, Zhang NQ(2011). Drought in southwest China from autumn 2009 to spring 2010 and its comparative analysis with historical drought events. Journal of Disaster Prevention and Mitigation Engineering, 31, 196-200. |
| [ 刘建刚, 万金红, 谭徐明, 马建明, 张念强(2011). 2009年秋至2010年春我国西南地区干旱及与历史场次干旱对比分析. 防灾减灾工程学报, 31, 196-200.] | |
| [38] | Liu L, Xu ZX(2014). Spatiotemporal distribution of the extreme climate indices in the five southwestern provinces of China. Resources and Environment in the Yangtze Basin, 23, 294-301. |
| [ 刘琳, 徐宗学(2014). 西南5省市极端气候指数时空分布规律研究. 长江流域资源与环境, 23, 294-301.] | |
| [39] | Lu JY, Carbone GJ, Gao P (2017). Detrending crop yield data for spatial visualization of drought impacts in the United States, 1895-2014. Agricultural and Forest Meteorology, 237-238, 196-208. |
| [40] |
Luo M, Sa CL, Meng FH, Duan YC, Liu T, Bao YH (2020). Assessing extreme climatic changes on a monthly scale and their implications for vegetation in Central Asia. Journal of Cleaner Production, 271, 122396. DOI: 10.1016/j.jclepro.2020.122396.
DOI URL |
| [41] | Ma L, Yan HW, He Y, Zhang Q, Liu B(2017). Vegetation changes in south Himalayas areas based on remote sensing monitoring during 2001-2015. Arid Land Geography, 40, 405-414. |
| [ 马磊, 闫浩文, 何毅, 张乾, 刘波(2017). 2001-2015年喜马拉雅南麓地区植被变化遥感监测. 干旱区地理, 40, 405-414.] | |
| [42] | Ming QZ, Shi ZT(2007). New discussion on dry valley formation in the Three Parallel Rivers Region. Journal of Desert Research, 27, 99-104. |
| [ 明庆忠, 史正涛(2007). 三江并流区干热河谷成因新探析. 中国沙漠, 27, 99-104.] | |
| [43] |
Na L, Na RS, Zhang JQ, Tong SQ, Shan Y, Ying H, Li XQ, Bao YL (2018). Vegetation dynamics and diverse responses to extreme climate events in different vegetation types of Inner Mongolia. Atmosphere, 9, 394. DOI: 10.3390/atmos9100394.
DOI URL |
| [44] |
Nicholls N (1997). Increased Australian wheat yield due to recent climate trends. Nature, 387, 484-485.
DOI URL |
| [45] | Peng WF, Zhang DM, Luo YM, Tao S, Xu XL(2019). Influence of natural factors on vegetation NDVI using geographical detection in Sichuan Province. Acta Geographica Sinica, 74, 1758-1776. |
| [ 彭文甫, 张冬梅, 罗艳玫, 陶帅, 徐新良(2019). 自然因子对四川植被NDVI变化的地理探测. 地理学报, 74, 1758-1776.] | |
| [46] | Pettitt AN (1979). A non-parametric approach to the change-point problem. Journal of the Royal Statistical Society: Series C (Applied Statistics), 28, 126-135. |
| [47] |
Piao S, Tan J, Chen A, Fu YH, Ciais P, Liu Q, Janssens IA, Vicca S, Zeng Z, Jeong SJ, Li Y, Myneni RB, Peng S, Shen M, Peñuelas J (2015). Leaf onset in the northern hemisphere triggered by daytime temperature. Nature Communications, 6, 6911. DOI: 10.1038/ncomms7911.
DOI URL |
| [48] |
Qin NX, Wang JN, Yang GS, Chen X, Liang HY, Zhang JB (2015). Spatial and temporal variations of extreme precipitation and temperature events for the Southwest China in 1960-2009. Geoenvironmental Disasters, 2, 4. DOI: 10.1186/s40677-015-0014-9.
DOI URL |
| [49] |
Rahimi M, Fatemi SS (2019). Mean versus extreme precipitation trends in Iran over the period 1960-2017. Pure and Applied Geophysics, 176, 3717-3735.
DOI URL |
| [50] | Ren QM(1984). Crop “Climate Yield” algorithm: discussion on difference method. Chinese Journal of Agrometeorology, 5, 59-62. |
| [ 任庆民(1984). 作物“气候产量”算法: 差值法的探讨. 中国农业气象, 5, 59-62.] | |
| [51] |
Shi PJ, Sun S, Gong DY, Zhou T (2016). World regionalization of climate change (1961-2010). International Journal of Disaster Risk Science, 7, 216-226.
DOI URL |
| [52] | Shi WJ, Tao FL, Zhang Z(2012). Identifying contributions of climate change to crop yields based on statistical models: a review. Acta Geographica Sinica, 67, 1213-1222. |
| [ 史文娇, 陶福禄, 张朝(2012). 基于统计模型识别气候变化对农业产量贡献的研究进展. 地理学报, 67, 1213-1222.] | |
| [53] |
Sun XB, Ren GY, Shrestha AB, Ren YY, You QL, Zhan YJ, Xu Y, Rajbhandari R (2017). Changes in extreme temperature events over the Hindu Kush Himalaya during 1961-2015. Advances in Climate Change Research, 8, 157-165.
DOI URL |
| [54] |
Tan ZQ, Tao H, Jiang JH, Zhang Q (2015). Influences of climate extremes on NDVI (normalized difference vegetation index) in the Poyang Lake Basin, China. Wetlands, 35, 1033-1042.
DOI URL |
| [55] |
Tao F, Yokozawa M, Liu J, Zhang Z (2008). Climate-crop yield relationships at provincial scales in China and the impacts of recent climate trends. Climate Research, 38, 83-94.
DOI URL |
| [56] |
Tong SQ, Li XQ, Zhang JQ, Bao YH, Bao YB, Na L, Si A (2019). Spatial and temporal variability in extreme temperature and precipitation events in Inner Mongolia (China) during 1960-2017. Science of the Total Environment, 649, 75-89.
DOI URL |
| [57] | Wang H(2019). Temporal and Spatial Variation of Extreme Climate Indices and Its Impact on NDVI in Southwestern China. Master degree dissertation, Beijing Forestry Universityc, Beijing. |
| [ 王昊(2019). 西南地区极端气候指数时空变化及其对NDVI的影响特征研究. 硕士学位论文, 北京林业大学, 北京.] | |
| [58] | Wang L, Xiong W, Wen XL, Feng LZ(2014). Effect of climatic factors such as temperature, precipitation on maize production in China. Transactions of the Chinese Society of Agricultural Engineering, 30, 138-146. |
| [ 王柳, 熊伟, 温小乐, 冯灵芝(2014). 温度降水等气候因子变化对中国玉米产量的影响. 农业工程学报, 30, 138-146.] | |
| [59] | Wang XL, Hou XY(2019). Variation of normalized difference vegetation index and its response to extreme climate in coastal China during 1982-2014. Geographical Research, 38, 807-821. |
| [ 王晓利, 侯西勇(2019). 1982-2014年中国沿海地区归一化植被指数(NDVI)变化及其对极端气候的响应. 地理研究, 38, 807-821.] | |
| [60] | Wei MY(2018). Study on Forest Vegetation Distribution and Forest Resources Change Monitoring in Linzhi Area. Master degree dissertation, Chang’an University,Xi’an. |
| [ 魏梦莹(2018). 林芝地区森林植被分布及动态变化监测研究. 硕士学位论文, 长安大学, 西安.] | |
| [61] |
Wei XC, Zhou QW, Cai MY, Wang YJ (2021). Effects of vegetation restoration on regional soil moisture content in the humid Karst areas—A case study of southwest China. Water, 13, 321. DOI: 10.3390/w13030321.
DOI URL |
| [62] | Wu J, Gao XJ(2013). A gridded daily observation dataset over China region and comparison with the other datasets. Chinese Journal of Geophysics, 56, 1102-1111. |
| [ 吴佳, 高学杰(2013). 一套格点化的中国区域逐日观测资料及与其它资料的对比. 地球物理学报, 56, 1102-1111.] | |
| [63] | Wu S, Zhang SY, Shen YG(1998). The effect of day and night temperature difference on photosynthetic characteristics in wheat. Acta Botanica Boreali-Occidentalia Sinica, 18, 103-109. |
| [ 吴姝, 张树源, 沈允钢(1998). 昼夜温差对小麦光合特性的影响. 西北植物学报, 18, 103-109.] | |
| [64] | Wu WB, You QL, Wang D(2016). Characteristics of extreme precipitation in China based on homogenized precipitation data. Journal of Natural Resources, 31, 1015-1026. |
| [ 武文博, 游庆龙, 王岱(2016). 基于均一化降水资料的中国极端降水特征分析. 自然资源学报, 31, 1015-1026.] | |
| [65] | Xu HJ, Yang TB(2014). Spatial-temporal variations of vegetation activities and its responses to climatic factors in the Qaidam Basin. Journal of Natural Resources, 29, 398-409. |
| [ 徐浩杰, 杨太保(2014). 柴达木盆地植被生长时空变化特征及其对气候要素的响应. 自然资源学报, 29, 398-409.] | |
| [66] |
Xu JP, Sun M, Wang H, Zhang Y, Zhang XT, Tian K (2018). Photosynthetic response of Scirpus validus and Typha orientalis to elevated temperatures in Dianchi Lake, Southwestern China. Journal of Mountain Science, 15, 2666-2675.
DOI URL |
| [67] | Xu XY(2019). Prediction and Analysis of Wheat Yield Changes Based on an Integrated Climatic Assessment Indicator for Wheat Production in Jiangsu Province . PhD dissertation, Yangzhou University, Yangzhou, Jiangsu. |
| [ 徐向英(2019). 江苏小麦综合气象指数构建与产量变化预测和分析. 博士学位论文, 扬州大学, 江苏扬州.] | |
| [68] |
Yao JQ, Chen YN, Zhao Y, Mao WY, Xu XB, Liu Y, Yang Q (2018). Response of vegetation NDVI to climatic extremes in the arid region of Central Asia: a case study in Xinjiang, China. Theoretical and Applied Climatology, 131, 1503-1515.
DOI URL |
| [69] |
Ying H, Zhang HY, Zhao JJ, Shan Y, Zhang ZX, Guo XY, Wu RH, Deng GR (2020). Effects of spring and summer extreme climate events on the autumn phenology of different vegetation types of Inner Mongolia, China, from 1982 to 2015. Ecological Indicators, 111, 105974. DOI: 10.1016/j.ecolind.2019.105974.
DOI URL |
| [70] | Yuan WD, Zheng JK, Dong K(2014). Spatial and temporal variation in extreme precipitation events in southwestern China during 1962-2012. Resources Science, 36, 766-772. |
| [ 袁文德, 郑江坤, 董奎(2014). 1962-2012年西南地区极端降水事件的时空变化特征. 资源科学, 36, 766-772.] | |
| [71] | Zhang D, He GX, Long HY(2020). Characteristics of grassland plants and protection and utilization of grassland resources in the dry-hot valley river of Yunnan. Chinese Journal of Tropical Agriculture, 40, 38-46. |
| [ 张德, 何光熊, 龙会英(2020). 云南干热河谷草地植物特征及草地资源保护和利用. 热带农业科学, 40, 38-46.] | |
| [72] | Zhang YY, Guo Y, Liu HH, Liu YX, Liu XL, Li J(2018). Content and impact factors of soil organic carbon and total nitrogen on the Qinghai-Tibet Plateau. Ecology and Environmental Sciences, 27, 866-872. |
| [ 张亚亚, 郭颖, 刘海红, 刘胤序, 刘小龙, 李军(2018). 青藏高原表土有机碳、全氮含量分布及其影响因素. 生态环境学报, 27, 866-872.] | |
| [73] |
Zhao AZ, Zhang AB, Liu XF, Cao S (2018). Spatiotemporal changes of normalized difference vegetation index (NDVI) and response to climate extremes and ecological restoration in the Loess Plateau, China. Theoretical and Applied Climatology, 132, 555-567.
DOI URL |
| [74] |
Zhou Y, Pei FS, Xia Y, Wu CJ, Zhong R, Wang K, Wang HL, Cao Y (2019). Assessing the impacts of extreme climate events on vegetation activity in the north south transect of eastern China (NSTEC). Water, 11, 2291. DOI: 10.3390/w11112291.
DOI URL |
| [75] | Zhu K(2014). Effects of Difference Between Day and Night Temperature on Photosynthetic Characteristics and Antioxidant Enzyme Activity of Greenhouse Tomatoes . Master degree dissertation, Nanjing University of Information Science & Technology, Nanjing. |
| [ 朱凯(2014). 昼夜温差对设施番茄光合特性及抗氧化酶活性的影响. 硕士学位论文, 南京信息工程大学, 南京.] |
| [1] | LI Bo-Xin, JIANG Chao, SUN Osbert Jianxin. Comprehensive assessment of vegetation carbon use efficiency in southwestern China simulated by CMIP6 models [J]. Chin J Plant Ecol, 2023, 47(9): 1211-1224. |
| [2] | GAO De-Cai, BAI E. Influencing factors of soil nitrous oxide emission during freeze-thaw cycles [J]. Chin J Plant Ecol, 2021, 45(9): 1006-1023. |
| [3] | ZHOU Xiong, SUN Peng-Sen, ZHANG Ming-Fang, LIU Shi-Rong. Spatio-temporal characteristics of vegetation water use efficiency and their relationships with climatic factors in alpine and subalpine area of southwestern China [J]. Chin J Plant Ecol, 2020, 44(6): 628-641. |
| [4] | XUE Jing-Yue, WANG Li-Hua, XIE Yu, GAO Jing, HE Jun-Dong, WU Yan. Effect of shrub coverage on grassland ecosystem carbon pool in southwestern China [J]. Chin J Plant Ecol, 2019, 43(4): 365-373. |
| [5] | ZHANG Bin,ZHU Jian-Jun,LIU Hua-Min,PAN Qing-Min. Effects of extreme rainfall and drought events on grassland ecosystems [J]. Chin J Plant Ecol, 2014, 38(9): 1008-1018. |
| [6] | XU Zhen-Feng, YIN Hua-Jun, ZHAO Chun-Zhang, CAO Gang, WAN Ming-Li, LIU Qing. A REVIEW OF RESPONSES OF LITTER DECOMPOSITION IN TERRESTRIAL ECOSYSTEMS TO GLOBAL WARMING [J]. Chin J Plant Ecol, 2009, 33(6): 1208-1219. |
| [7] | WANG Xiao-Chun, JI Ying. REVIEW OF ADVANCES IN DENDROPYROCHRONOLOGY [J]. Chin J Plant Ecol, 2009, 33(3): 587-597. |
| [8] | BAI Li-Ping, TONG Cheng-Feng, LIN Er-Da, LU Zhi-Guang, RAO Min-Jie. QUALITY CHARACTERISTICS OF BREAD WHEAT GROWN UNDER ELEVATED CO<sub>2</sub> AND TEMPERATURE [J]. Chin J Plant Ecol, 2005, 29(5): 814-818. |
| [9] | JIANG Yan-Ling, ZHOU Guang-Sheng, ZHAO Min, WANG Xu, CAO Ming-Chang. SOIL RESPIRATION IN BROAD-LEAVED AND KOREAN PINE FOREST ECOSYSTEMS, CHANGBAI MOUNTAIN, CHINA [J]. Chin J Plant Ecol, 2005, 29(3): 411-414. |
| [10] | XU Zhen-Zhu, ZHOU Guang-Sheng, XIAO Chun-Wang, WANG Yu-Hui. INTERACIVE EFFECTS OF DOUBLED ATMOSPHERIC CO2 CONCENTRATIONS AND SOIL DROUGHT ON WHOLE PLANT CARBON ALLOCATION IN TWO DOMINANT DESERT SHRUBS [J]. Chin J Plant Ecol, 2005, 29(2): 281-288. |
| [11] | JIANG Gao-Ming. Review on Some Hot Topics Towards the Researches in the Field of Plant Physioecology [J]. Chin J Plan Ecolo, 2001, 25(5): 514-519. |
| [12] | Zhou Guang-sheng, Zhang Xin-shi. Study on NPP of Natural Vegetation in China Under Global Climate Change [J]. Chin J Plan Ecolo, 1996, 20(1): 11-19. |
| Viewed | ||||||
|
Full text |
|
|||||
|
Abstract |
|
|||||
Copyright © 2026 Chinese Journal of Plant Ecology
Tel: 010-62836134, 62836138, E-mail: apes@ibcas.ac.cn, cjpe@ibcas.ac.cn
![]()