
植物生态学报 ›› 2006, Vol. 30 ›› Issue (2): 239-251.DOI: 10.17521/cjpe.2006.0033 cstr: 32100.14.cjpe.2006.0033
吴晓莆( ), 唐志尧, 崔海亭, 方精云
接受日期:2005-06-17
发布日期:2006-03-30
作者简介:E-mail: wuxiaopu@pku.edu.cn
基金资助:
WU Xiao_Pu(), TANG Zhi_Yao, CUI Hai_Ting, FANG Jing_Yun
Accepted:2005-06-17
Published:2006-03-30
摘要:
利用MSS/TM影像和1∶250 000 高程数据分析了1978~2001年北京地区土地覆盖的变化。为研究人类活动对土地覆盖类型及植被变化的影响,根据植被的分布规律和人类活动影响,利用数字高程模型(DEM)将研究区遥感影像分为不同海拔段,分别建立标志进行解译。通过转移概率矩阵计算、不同地形因子影响下的土地覆盖类型分布的GIS分析,得到如下结果:1) 1978~2001年间北京市土地覆盖变化主要发生在平原和低海拔、小坡度的平缓地区,表现为农业用地向城镇用地的转变;高海拔地区主要为天然植被所覆盖,土地覆盖变化相对较小,主要是灌丛向林地的转变。2) 地形因子显著影响土地覆盖类型的分布及变化。随着海拔的升高和坡度的增大,农业用地和城镇用地减少,林地和灌丛逐渐增加。坡向对植被的分布也有较大影响。
吴晓莆, 唐志尧, 崔海亭, 方精云. 北京地区不同地形条件下的土地覆盖动态. 植物生态学报, 2006, 30(2): 239-251. DOI: 10.17521/cjpe.2006.0033
WU Xiao_Pu, TANG Zhi_Yao, CUI Hai_Ting, FANG Jing_Yun. LAND COVER DYNAMICS OF DIFFERENT TOPOGRAPHIC CONDITIONS IN BEIJING. Chinese Journal of Plant Ecology, 2006, 30(2): 239-251. DOI: 10.17521/cjpe.2006.0033
| 时段 Time | 轨道号 Path code | |||||||||
|---|---|---|---|---|---|---|---|---|---|---|
| 1978_6_12 | MSS132_32, MSS131_32 | |||||||||
| 1984_10_2 | TM123_32 | |||||||||
| 1992_5_18 | TM123_32 | |||||||||
| 1996_5_29 | TM123_32, TM124_32 | |||||||||
| 2001_5_19 | ETM123_32 | |||||||||
表1 本研究中所使用的遥感影像资料
Table 1 Remote sensing data used in this study
| 时段 Time | 轨道号 Path code | |||||||||
|---|---|---|---|---|---|---|---|---|---|---|
| 1978_6_12 | MSS132_32, MSS131_32 | |||||||||
| 1984_10_2 | TM123_32 | |||||||||
| 1992_5_18 | TM123_32 | |||||||||
| 1996_5_29 | TM123_32, TM124_32 | |||||||||
| 2001_5_19 | ETM123_32 | |||||||||
| 土地覆盖类型 Land cover types | 定义和主要组成 Definition& main components |
|---|---|
| 针叶林 Conifer forest | 包括暖温性针叶林(油松林、侧柏林)和寒温性针叶林(华北落叶松林) It includes warm_temperate conifer forests, such as Pinus tabulaeformis and Platycladus orientalis, and cold_temperate conifer forests, such as Larix principis_rupprechtii |
| 阔叶林 Broadleaf forest | 包括栎林、沟谷杂木林、椴树林、杨桦林和低海拔地区的人工经济林等 It includes oak forests, valley shaws, Tilia forests, Populus and Betula forests and plantations in low elevation area |
| 混交林 Mixed forest | 指针叶阔叶混交林。主要包括松栎混交林等 It indicates broadleaf and conifer mixed forest, most of which consists of Pinus and Quercus |
| 灌丛 Shrub | 各类森林在人类干扰下退化形成的次生植被类型,组成复杂。北京地区的主要类型有:荆条灌丛、绣线菊灌丛、平榛灌丛、山杏灌丛、二色胡枝子灌丛等 Secondary vegetation types with complex components, formed as human disturbance to primary forests. The main shrub types in Beijing include Vitex negundo var. heterophylla, Spiraea, Corylus heterophylla, Prunus armeniaca var. ansu and Lespedeza |
| 灌草丛 Grassland | 原生植被遭严重破坏后形成的不稳定植被类型,以旱中生草本植物为主,散生着灌木的植物群落。主要组成成分为白羊草、黄草等 An unstable vegetation type as primary vegetation was destroyed, mostly consisted with xerophilous herbages such as Bothriochloa ischaemum and Themeda japonica, some shrubs distribute in it occasionally |
| 亚高山草甸 Subalpine meadow | 分布在海拔1 800 m以上的坡顶,主要种类有苔草、黄花菜、地榆、拳参、金莲花等 Distribute at top of slopes above 1 800 m, mostly includes Carex, Hemerocallis minor, Sanguisorba officinalis, Polygonum bistorta and Trollius chinensis |
| 农业用地 Farmland | 包括平原地区大面积耕地、郊区果粮间作地等 Including large area cropland in plain area and intercrop land in suburb |
| 城镇用地 Built_up | 包括城市建成区、农村居民点和机场等大型建筑用地 Including built_up territory, rural residential area and large buildings such as airports |
| 水体 Water body | 包括水库、河流、湖泊和湿地 Including reservoirs, rivers, lakes and wetlands |
| 裸地 Bare land | 包括高反射率的无植被覆盖地和废弃建筑用地等 Including light reflectivity area such as no vegetation covered region and wasteland |
表2 本研究中所使用的10种土地覆盖类型的定义与组成(基于实地调查及植被图资料)
Table 2 Definitions and components of the ten land cover types used in the present study (Based on field investigation and vegetation map)
| 土地覆盖类型 Land cover types | 定义和主要组成 Definition& main components |
|---|---|
| 针叶林 Conifer forest | 包括暖温性针叶林(油松林、侧柏林)和寒温性针叶林(华北落叶松林) It includes warm_temperate conifer forests, such as Pinus tabulaeformis and Platycladus orientalis, and cold_temperate conifer forests, such as Larix principis_rupprechtii |
| 阔叶林 Broadleaf forest | 包括栎林、沟谷杂木林、椴树林、杨桦林和低海拔地区的人工经济林等 It includes oak forests, valley shaws, Tilia forests, Populus and Betula forests and plantations in low elevation area |
| 混交林 Mixed forest | 指针叶阔叶混交林。主要包括松栎混交林等 It indicates broadleaf and conifer mixed forest, most of which consists of Pinus and Quercus |
| 灌丛 Shrub | 各类森林在人类干扰下退化形成的次生植被类型,组成复杂。北京地区的主要类型有:荆条灌丛、绣线菊灌丛、平榛灌丛、山杏灌丛、二色胡枝子灌丛等 Secondary vegetation types with complex components, formed as human disturbance to primary forests. The main shrub types in Beijing include Vitex negundo var. heterophylla, Spiraea, Corylus heterophylla, Prunus armeniaca var. ansu and Lespedeza |
| 灌草丛 Grassland | 原生植被遭严重破坏后形成的不稳定植被类型,以旱中生草本植物为主,散生着灌木的植物群落。主要组成成分为白羊草、黄草等 An unstable vegetation type as primary vegetation was destroyed, mostly consisted with xerophilous herbages such as Bothriochloa ischaemum and Themeda japonica, some shrubs distribute in it occasionally |
| 亚高山草甸 Subalpine meadow | 分布在海拔1 800 m以上的坡顶,主要种类有苔草、黄花菜、地榆、拳参、金莲花等 Distribute at top of slopes above 1 800 m, mostly includes Carex, Hemerocallis minor, Sanguisorba officinalis, Polygonum bistorta and Trollius chinensis |
| 农业用地 Farmland | 包括平原地区大面积耕地、郊区果粮间作地等 Including large area cropland in plain area and intercrop land in suburb |
| 城镇用地 Built_up | 包括城市建成区、农村居民点和机场等大型建筑用地 Including built_up territory, rural residential area and large buildings such as airports |
| 水体 Water body | 包括水库、河流、湖泊和湿地 Including reservoirs, rivers, lakes and wetlands |
| 裸地 Bare land | 包括高反射率的无植被覆盖地和废弃建筑用地等 Including light reflectivity area such as no vegetation covered region and wasteland |
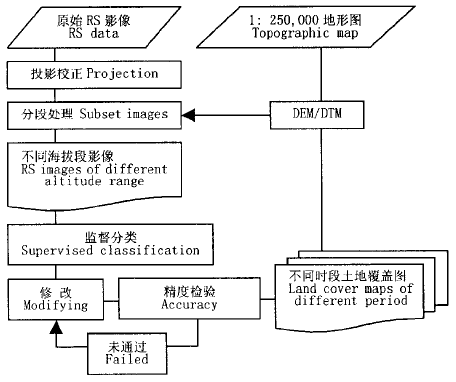
图1 数据处理流程图
Fig.1 Flow chart of data analysis
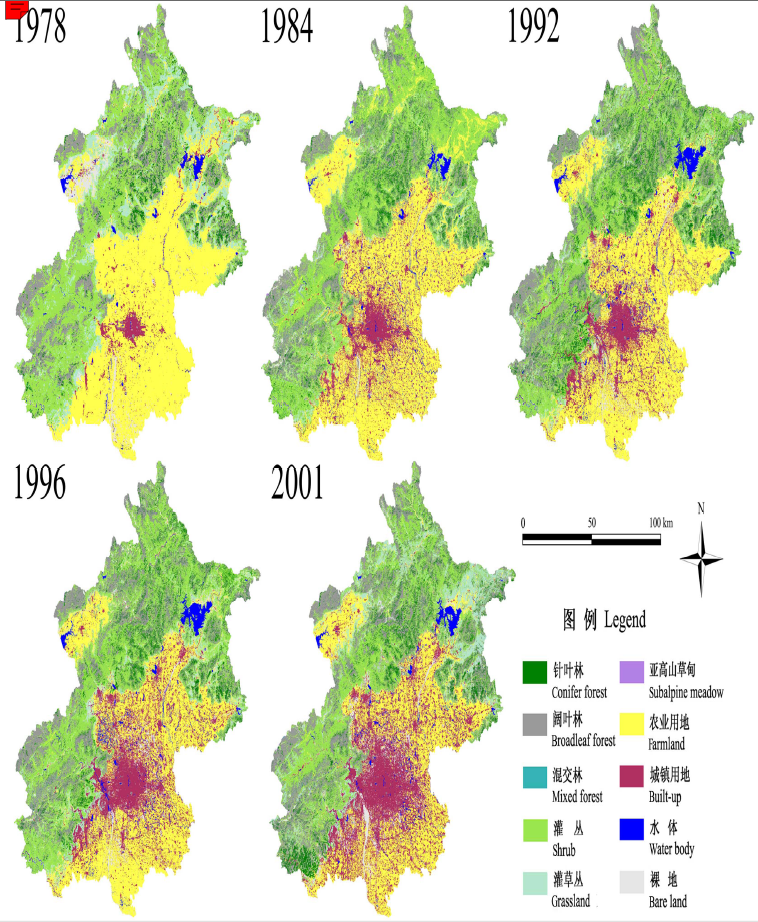
图2 1978~2001北京地区基于遥感影像的土地覆盖类型的分布
Fig.2 Distribution of land cover types in Beijing from 1978 to 2001, interpreted from RS images
| 土地覆盖类型 Land cover types | 1978 | 1984 | 1992 | 1996 | 2001 | 年平均改变速率 Transformation rate (hm2·a-1) |
|---|---|---|---|---|---|---|
| 面积 Area (hm2) | ||||||
| 林地Forest | 283 117 | 328 771 | 389 395 | 369 518 | 403 680 | 5 023 |
| 灌丛Shrub | 445 336 | 479 746 | 422 590 | 434 210 | 353 817 | -3 813 |
| 灌草丛Grassland | 173 607 | 70 088 | 80 926 | 86 676 | 132 938 | -1 695 |
| 亚高山草甸Subalpine meadow | 280 | 481 | 453 | 425 | 538 | 11 |
| 农业用地Farmland | 635 433 | 564 999 | 509 021 | 449 898 | 381 271 | -10 590 |
| 城镇用地Built_up | 42 116 | 136 483 | 147 100 | 199 549 | 264 229 | 9 255 |
| 水体Water body | 16 272 | 27 522 | 40 337 | 44 571 | 33 688 | 726 |
| 裸地Bare_land | 45 173 | 28 841 | 39 581 | 51 779 | 65 045 | 828 |
表3 1978~2001年北京地区的土地覆盖类型变化
Table 3 Land cover change in Beijing Area from 1978 to 2001
| 土地覆盖类型 Land cover types | 1978 | 1984 | 1992 | 1996 | 2001 | 年平均改变速率 Transformation rate (hm2·a-1) |
|---|---|---|---|---|---|---|
| 面积 Area (hm2) | ||||||
| 林地Forest | 283 117 | 328 771 | 389 395 | 369 518 | 403 680 | 5 023 |
| 灌丛Shrub | 445 336 | 479 746 | 422 590 | 434 210 | 353 817 | -3 813 |
| 灌草丛Grassland | 173 607 | 70 088 | 80 926 | 86 676 | 132 938 | -1 695 |
| 亚高山草甸Subalpine meadow | 280 | 481 | 453 | 425 | 538 | 11 |
| 农业用地Farmland | 635 433 | 564 999 | 509 021 | 449 898 | 381 271 | -10 590 |
| 城镇用地Built_up | 42 116 | 136 483 | 147 100 | 199 549 | 264 229 | 9 255 |
| 水体Water body | 16 272 | 27 522 | 40 337 | 44 571 | 33 688 | 726 |
| 裸地Bare_land | 45 173 | 28 841 | 39 581 | 51 779 | 65 045 | 828 |
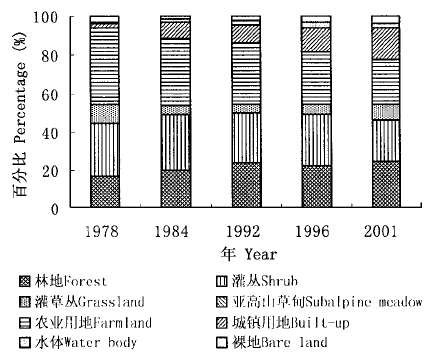
图3 1978~2001年北京地区的土地覆盖变化百分比
Fig.3 Land cover changes in Beijing Area from 1978 to 2001
| 土地覆盖类型 Land cover types | 林地 Forest | 灌丛 Shrub | 灌草丛 Grassland | 亚高山草甸 Subalpine meadow | 农业用地 Farmland | 城镇用地 Built_up | 水体 Water body | 裸地 Bare land |
|---|---|---|---|---|---|---|---|---|
| 1978 | 1984 | |||||||
| 林地Forest | 78.3 | 18.3 | 1.0 | 0.0 | 1.0 | 0.5 | 0.1 | 0.7 |
| 灌丛Shrub | 25.5 | 61.7 | 6.1 | 0.1 | 4.2 | 0.9 | 0.3 | 1.3 |
| 灌草丛Grassland | 7.4 | 47.4 | 15.6 | 0.0 | 24.9 | 2.7 | 0.9 | 1.1 |
| 亚高山草甸Subalpine meadow | 5.8 | 17.4 | 0.0 | 66.2 | 0.0 | 0.0 | 0.0 | 10.6 |
| 农业用地Farmland | 3.4 | 3.8 | 1.5 | 0.0 | 70.8 | 15.8 | 2.4 | 2.4 |
| 城镇用地Built_up | 1.2 | 6.1 | 1.7 | 0.0 | 31.7 | 51.3 | 5.5 | 2.4 |
| 水体Water body | 3.1 | 9.7 | 6.3 | 0.0 | 26.7 | 8.5 | 41.6 | 4.0 |
| 裸地Bare land | 1.4 | 3.3 | 5.2 | 0.4 | 75.3 | 8.0 | 1.0 | 5.4 |
| 1984 | 1992 | |||||||
| 林地Forest | 83.8 | 8.4 | 1.0 | 0.0 | 5.2 | 0.9 | 0.4 | 0.3 |
| 灌丛Shrub | 18.5 | 70.4 | 7.2 | 0.0 | 1.7 | 0.9 | 0.7 | 0.6 |
| 灌草丛Grassland | 7.2 | 37.8 | 36.1 | 0.0 | 11.8 | 2.4 | 2.5 | 2.1 |
| 亚高山草甸Subalpine meadow | 8.3 | 16.2 | 0.0 | 57.7 | 0.0 | 0.0 | 0.0 | 17.7 |
| 农业用地Farmland | 2.4 | 4.9 | 2.6 | 0.0 | 73.6 | 9.3 | 2.7 | 4.5 |
| 城镇用地Built_up | 3.2 | 1.7 | 1.4 | 0.0 | 31.4 | 56.6 | 3.0 | 2.8 |
| 水体Water body | 1.9 | 3.5 | 0.9 | 0.0 | 26.6 | 15.3 | 50.3 | 1.5 |
| 裸地Bare land | 13.0 | 10.2 | 5.7 | 0.0 | 34.2 | 13.5 | 2.4 | 21.1 |
| 1992 | 1996 | |||||||
| 林地Forest | 81.8 | 12.7 | 1.7 | 0.0 | 1.8 | 1.3 | 0.2 | 0.5 |
| 灌丛Shrub | 8.3 | 80.4 | 7.6 | 0.0 | 2.2 | 0.5 | 0.2 | 0.8 |
| 灌草丛Grassland | 3.7 | 39.5 | 40.6 | 0.0 | 6.7 | 4.0 | 0.4 | 4.9 |
| 亚高山草甸Subalpine Meadow | 6.3 | 10.8 | 0.0 | 76.3 | 0.0 | 0.0 | 0.0 | 6.7 |
| 农业用地Farmland | 1.5 | 1.0 | 1.4 | 0.0 | 77.1 | 13.2 | 2.1 | 3.7 |
| 城镇用地Built_up | 1.0 | 1.4 | 3.7 | 0.0 | 13.1 | 75.0 | 2.6 | 3.3 |
| 水体Water body | 1.2 | 1.6 | 1.7 | 0.0 | 13.2 | 12.7 | 67.7 | 1.8 |
| 裸地Bare land | 1.1 | 5.0 | 4.0 | 0.1 | 27.3 | 15.6 | 2.1 | 44.8 |
| 1996 | 2001 | |||||||
| 林地Forest | 82.8 | 10.9 | 2.2 | 0.0 | 2.1 | 1.4 | 0.2 | 0.5 |
| 灌丛Shrub | 16.3 | 66.6 | 14.1 | 0.0 | 1.7 | 0.3 | 0.1 | 1.0 |
| 灌草丛Grassland | 10.8 | 17.0 | 49.6 | 0.0 | 12.5 | 3.5 | 0.5 | 5.9 |
| 亚高山草甸Subalpine Meadow | 9.9 | 6.2 | 0.0 | 71.5 | 0.0 | 0.0 | 0.0 | 12.4 |
| 农业用地Farmland | 2.4 | 1.4 | 2.6 | 0.0 | 66.5 | 20.1 | 1.6 | 5.4 |
| 城镇用地Built_up | 1.8 | 0.6 | 1.1 | 0.0 | 15.5 | 71.9 | 2.2 | 6.8 |
| 水体Water body | 2.1 | 2.6 | 3.5 | 0.0 | 19.7 | 20.6 | 44.6 | 6.9 |
| 裸地Bare land | 4.7 | 2.9 | 10.6 | 0.8 | 31.5 | 23.1 | 1.3 | 25.0 |
表4 1978~2001年北京地区年土地覆盖变化的转移概率(%)
Table 4 Percentage of land cover transformation in Beijing Area from1978 to 2001 (%)
| 土地覆盖类型 Land cover types | 林地 Forest | 灌丛 Shrub | 灌草丛 Grassland | 亚高山草甸 Subalpine meadow | 农业用地 Farmland | 城镇用地 Built_up | 水体 Water body | 裸地 Bare land |
|---|---|---|---|---|---|---|---|---|
| 1978 | 1984 | |||||||
| 林地Forest | 78.3 | 18.3 | 1.0 | 0.0 | 1.0 | 0.5 | 0.1 | 0.7 |
| 灌丛Shrub | 25.5 | 61.7 | 6.1 | 0.1 | 4.2 | 0.9 | 0.3 | 1.3 |
| 灌草丛Grassland | 7.4 | 47.4 | 15.6 | 0.0 | 24.9 | 2.7 | 0.9 | 1.1 |
| 亚高山草甸Subalpine meadow | 5.8 | 17.4 | 0.0 | 66.2 | 0.0 | 0.0 | 0.0 | 10.6 |
| 农业用地Farmland | 3.4 | 3.8 | 1.5 | 0.0 | 70.8 | 15.8 | 2.4 | 2.4 |
| 城镇用地Built_up | 1.2 | 6.1 | 1.7 | 0.0 | 31.7 | 51.3 | 5.5 | 2.4 |
| 水体Water body | 3.1 | 9.7 | 6.3 | 0.0 | 26.7 | 8.5 | 41.6 | 4.0 |
| 裸地Bare land | 1.4 | 3.3 | 5.2 | 0.4 | 75.3 | 8.0 | 1.0 | 5.4 |
| 1984 | 1992 | |||||||
| 林地Forest | 83.8 | 8.4 | 1.0 | 0.0 | 5.2 | 0.9 | 0.4 | 0.3 |
| 灌丛Shrub | 18.5 | 70.4 | 7.2 | 0.0 | 1.7 | 0.9 | 0.7 | 0.6 |
| 灌草丛Grassland | 7.2 | 37.8 | 36.1 | 0.0 | 11.8 | 2.4 | 2.5 | 2.1 |
| 亚高山草甸Subalpine meadow | 8.3 | 16.2 | 0.0 | 57.7 | 0.0 | 0.0 | 0.0 | 17.7 |
| 农业用地Farmland | 2.4 | 4.9 | 2.6 | 0.0 | 73.6 | 9.3 | 2.7 | 4.5 |
| 城镇用地Built_up | 3.2 | 1.7 | 1.4 | 0.0 | 31.4 | 56.6 | 3.0 | 2.8 |
| 水体Water body | 1.9 | 3.5 | 0.9 | 0.0 | 26.6 | 15.3 | 50.3 | 1.5 |
| 裸地Bare land | 13.0 | 10.2 | 5.7 | 0.0 | 34.2 | 13.5 | 2.4 | 21.1 |
| 1992 | 1996 | |||||||
| 林地Forest | 81.8 | 12.7 | 1.7 | 0.0 | 1.8 | 1.3 | 0.2 | 0.5 |
| 灌丛Shrub | 8.3 | 80.4 | 7.6 | 0.0 | 2.2 | 0.5 | 0.2 | 0.8 |
| 灌草丛Grassland | 3.7 | 39.5 | 40.6 | 0.0 | 6.7 | 4.0 | 0.4 | 4.9 |
| 亚高山草甸Subalpine Meadow | 6.3 | 10.8 | 0.0 | 76.3 | 0.0 | 0.0 | 0.0 | 6.7 |
| 农业用地Farmland | 1.5 | 1.0 | 1.4 | 0.0 | 77.1 | 13.2 | 2.1 | 3.7 |
| 城镇用地Built_up | 1.0 | 1.4 | 3.7 | 0.0 | 13.1 | 75.0 | 2.6 | 3.3 |
| 水体Water body | 1.2 | 1.6 | 1.7 | 0.0 | 13.2 | 12.7 | 67.7 | 1.8 |
| 裸地Bare land | 1.1 | 5.0 | 4.0 | 0.1 | 27.3 | 15.6 | 2.1 | 44.8 |
| 1996 | 2001 | |||||||
| 林地Forest | 82.8 | 10.9 | 2.2 | 0.0 | 2.1 | 1.4 | 0.2 | 0.5 |
| 灌丛Shrub | 16.3 | 66.6 | 14.1 | 0.0 | 1.7 | 0.3 | 0.1 | 1.0 |
| 灌草丛Grassland | 10.8 | 17.0 | 49.6 | 0.0 | 12.5 | 3.5 | 0.5 | 5.9 |
| 亚高山草甸Subalpine Meadow | 9.9 | 6.2 | 0.0 | 71.5 | 0.0 | 0.0 | 0.0 | 12.4 |
| 农业用地Farmland | 2.4 | 1.4 | 2.6 | 0.0 | 66.5 | 20.1 | 1.6 | 5.4 |
| 城镇用地Built_up | 1.8 | 0.6 | 1.1 | 0.0 | 15.5 | 71.9 | 2.2 | 6.8 |
| 水体Water body | 2.1 | 2.6 | 3.5 | 0.0 | 19.7 | 20.6 | 44.6 | 6.9 |
| 裸地Bare land | 4.7 | 2.9 | 10.6 | 0.8 | 31.5 | 23.1 | 1.3 | 25.0 |
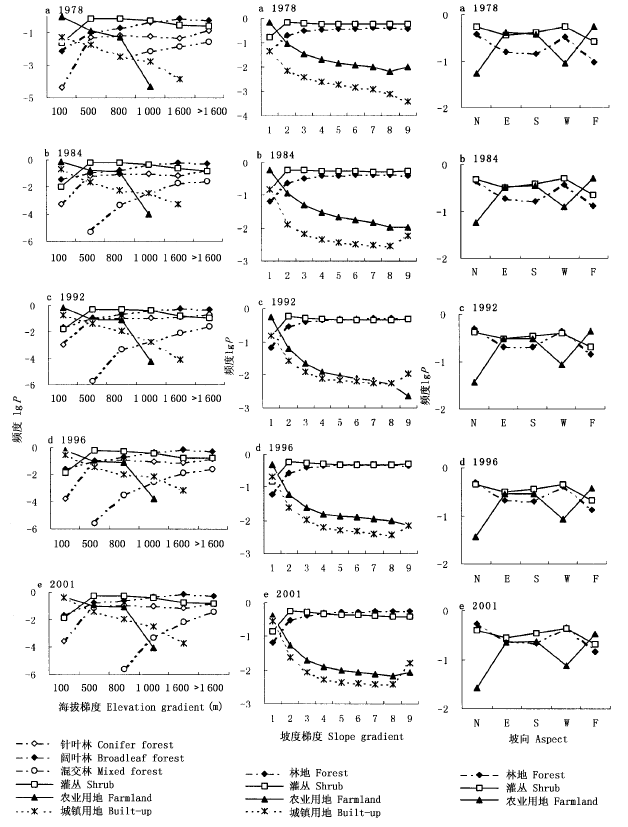
图4 不同地形条件下土地覆盖类型的面积_频度分布 N:北 North E:东 East S:南 South W:西 West F:平地 Flat
Fig.4 The frequency_area distributions of land cover in different topographic conditions 1:0~5° 2:5°~10° 3:10°~15° 4:15°~20° 5:20°~25° 6:25°~30° 7:30°~40° 8:40°~50° 9:>50°
| 海拔段 Altitude (m) | 总面积 Total area(hm2) | 土地覆盖改变类型 Change types | 变化率 Transformation percentage (%) | |||
|---|---|---|---|---|---|---|
| 1978~1984 | 1984~1992 | 1992~1996 | 1996~2001 | |||
| <100 | 637 131 | 林地Forest | 0.3 | 0.4 | 1.0 | 0.5 |
| 灌丛Shrub | 0.5 | 0.5 | 0.8 | 0.6 | ||
| 农业用地Farmland | 65.0 | 57.1 | 53.5 | 40.4 | ||
| 城镇用地Built_up | 3.2 | 11.2 | 15.3 | 20.5 | ||
| 农业用地转城镇用地Farmland to built_up | 15.5 | 6.6 | 10.3 | 13.5 | ||
| 城镇用地转农业用地Built_up to farmland | 1.5 | 6.5 | 2.6 | 4.3 | ||
| 100~500 | 440 168 | 林地Forest | 10.1 | 16.0 | 18.6 | 17.3 |
| 灌丛Shrub | 47.0 | 46.8 | 50.6 | 46.5 | ||
| 农业用地Farmland | 5.3 | 6.0 | 6.0 | 5.1 | ||
| 城镇用地Built_up | 0.6 | 0.6 | 1.3 | 1.4 | ||
| 灌丛转林地Shrub to forest | 7.4 | 7.7 | 1.9 | 8.3 | ||
| 灌丛转农业用地Shrub to farmland | 8.7 | 2.2 | 2.4 | 2.6 | ||
| 农业用地转灌丛Farmland to shrub | 5.9 | 6.5 | 1.6 | 2.5 | ||
| 500~1 000 | 463 940 | 林地Forest | 20.7 | 29.8 | 34.5 | 34.2 |
| 灌丛Shrub | 45.0 | 42.8 | 42.6 | 40.4 | ||
| 农业用地Farmland | 2.3 | 5.4 | 5.4 | 4.2 | ||
| 灌丛转林地Shrub to forest | 13.3 | 10.5 | 5.2 | 8.2 | ||
| >1 000 | 96 136 | 林地Forest | 63.1 | 65.0 | 72.6 | 74.4 |
| 灌丛Shrub | 10.8 | 12.5 | 10.9 | 11.8 | ||
| 林地转灌丛Forest to shrub | 7.6 | 2.9 | 5.7 | 5.1 | ||
| 灌丛转林地Shrub to forest | 11.6 | 11.1 | 5.8 | 5.4 |
表5 1978~2001年北京地区不同高程土地覆盖类型的变化率
Table 5 Land cover transformation in different elevation ranges in Beijing Area from 1978 to 2001
| 海拔段 Altitude (m) | 总面积 Total area(hm2) | 土地覆盖改变类型 Change types | 变化率 Transformation percentage (%) | |||
|---|---|---|---|---|---|---|
| 1978~1984 | 1984~1992 | 1992~1996 | 1996~2001 | |||
| <100 | 637 131 | 林地Forest | 0.3 | 0.4 | 1.0 | 0.5 |
| 灌丛Shrub | 0.5 | 0.5 | 0.8 | 0.6 | ||
| 农业用地Farmland | 65.0 | 57.1 | 53.5 | 40.4 | ||
| 城镇用地Built_up | 3.2 | 11.2 | 15.3 | 20.5 | ||
| 农业用地转城镇用地Farmland to built_up | 15.5 | 6.6 | 10.3 | 13.5 | ||
| 城镇用地转农业用地Built_up to farmland | 1.5 | 6.5 | 2.6 | 4.3 | ||
| 100~500 | 440 168 | 林地Forest | 10.1 | 16.0 | 18.6 | 17.3 |
| 灌丛Shrub | 47.0 | 46.8 | 50.6 | 46.5 | ||
| 农业用地Farmland | 5.3 | 6.0 | 6.0 | 5.1 | ||
| 城镇用地Built_up | 0.6 | 0.6 | 1.3 | 1.4 | ||
| 灌丛转林地Shrub to forest | 7.4 | 7.7 | 1.9 | 8.3 | ||
| 灌丛转农业用地Shrub to farmland | 8.7 | 2.2 | 2.4 | 2.6 | ||
| 农业用地转灌丛Farmland to shrub | 5.9 | 6.5 | 1.6 | 2.5 | ||
| 500~1 000 | 463 940 | 林地Forest | 20.7 | 29.8 | 34.5 | 34.2 |
| 灌丛Shrub | 45.0 | 42.8 | 42.6 | 40.4 | ||
| 农业用地Farmland | 2.3 | 5.4 | 5.4 | 4.2 | ||
| 灌丛转林地Shrub to forest | 13.3 | 10.5 | 5.2 | 8.2 | ||
| >1 000 | 96 136 | 林地Forest | 63.1 | 65.0 | 72.6 | 74.4 |
| 灌丛Shrub | 10.8 | 12.5 | 10.9 | 11.8 | ||
| 林地转灌丛Forest to shrub | 7.6 | 2.9 | 5.7 | 5.1 | ||
| 灌丛转林地Shrub to forest | 11.6 | 11.1 | 5.8 | 5.4 |
| 坡度 Slope | 总面积 Total area (hm2) | 土地覆盖改变类型 Change types | 变化率 Transformation percentage (%) | |||
|---|---|---|---|---|---|---|
| 1978~1984 | 1984~1992 | 1992~1996 | 1996~2001 | |||
| 0~5° | 897 107 | 林地Forest | 2.3 | 3.4 | 4.4 | 3.6 |
| 灌丛Shrub | 10.4 | 10.6 | 11.9 | 11.0 | ||
| 农业用地Farmland | 49.2 | 45.4 | 42.8 | 32.7 | ||
| 城镇用地Built_up | 2.3 | 8.4 | 11.9 | 15.5 | ||
| 其它Others | 9.8 | 10.2 | 12.2 | 14.8 | ||
| 灌丛转林地Shrub to forest | 1.6 | 1.5 | 0.6 | 1.4 | ||
| 农业用地转城镇用地Farmland to built_up | 11.1 | 5.5 | 7.4 | 10.0 | ||
| 城镇用地转农业用地Built_up to farmland | 1.4 | 4.7 | 2.1 | 3.4 | ||
| 5°~10° | 115 164 | 林地Forest | 14.7 | 20.4 | 24.2 | 22.9 |
| 灌丛Shrub | 49.7 | 48.9 | 51.2 | 49.7 | ||
| 农业用地Farmland | 3.4 | 3.6 | 3.8 | 2.6 | ||
| 林地转灌丛Forest to shrub | 5.1 | 3.0 | 4.9 | 4.8 | ||
| 灌丛转林地Shrub to forest | 9.6 | 8.5 | 4.0 | 7.2 | ||
| 灌丛转农业用地Shrub to farmland | 7.1 | 1.9 | 1.6 | 1.7 | ||
| 10°~20° | 330 572 | 林地Forest | 23.8 | 32.6 | 37.4 | 36.7 |
| 灌丛Shrub | 46.5 | 44.8 | 45.1 | 43.1 | ||
| 农业用地Farmland | 0.8 | 0.8 | 1.0 | 0.6 | ||
| 林地转灌丛Forest to shrub | 9.0 | 3.3 | 5.2 | 5.1 | ||
| 灌丛转林地Shrub to forest | 12.3 | 10.7 | 5.6 | 8.8 | ||
| >20° | 294 534 | 林地Forest | 28.9 | 37.9 | 43.3 | 42.5 |
| 灌丛Shrub | 43.4 | 41.0 | 41.1 | 36.9 | ||
| 农业用地Farmland | 0.2 | 0.3 | 0.5 | 0.3 | ||
| 林地转灌丛Forest to shrub | 9.8 | 3.7 | 6.5 | 5.5 | ||
| 灌丛转林地Shrub to forest | 12.9 | 11.8 | 4.4 | 10.6 |
表6 1978~2001年北京地区不同坡度土地覆盖类型的变化率
Table 6 Land cover transformation along slope gradient in Beijing Area from 1978 to 2001
| 坡度 Slope | 总面积 Total area (hm2) | 土地覆盖改变类型 Change types | 变化率 Transformation percentage (%) | |||
|---|---|---|---|---|---|---|
| 1978~1984 | 1984~1992 | 1992~1996 | 1996~2001 | |||
| 0~5° | 897 107 | 林地Forest | 2.3 | 3.4 | 4.4 | 3.6 |
| 灌丛Shrub | 10.4 | 10.6 | 11.9 | 11.0 | ||
| 农业用地Farmland | 49.2 | 45.4 | 42.8 | 32.7 | ||
| 城镇用地Built_up | 2.3 | 8.4 | 11.9 | 15.5 | ||
| 其它Others | 9.8 | 10.2 | 12.2 | 14.8 | ||
| 灌丛转林地Shrub to forest | 1.6 | 1.5 | 0.6 | 1.4 | ||
| 农业用地转城镇用地Farmland to built_up | 11.1 | 5.5 | 7.4 | 10.0 | ||
| 城镇用地转农业用地Built_up to farmland | 1.4 | 4.7 | 2.1 | 3.4 | ||
| 5°~10° | 115 164 | 林地Forest | 14.7 | 20.4 | 24.2 | 22.9 |
| 灌丛Shrub | 49.7 | 48.9 | 51.2 | 49.7 | ||
| 农业用地Farmland | 3.4 | 3.6 | 3.8 | 2.6 | ||
| 林地转灌丛Forest to shrub | 5.1 | 3.0 | 4.9 | 4.8 | ||
| 灌丛转林地Shrub to forest | 9.6 | 8.5 | 4.0 | 7.2 | ||
| 灌丛转农业用地Shrub to farmland | 7.1 | 1.9 | 1.6 | 1.7 | ||
| 10°~20° | 330 572 | 林地Forest | 23.8 | 32.6 | 37.4 | 36.7 |
| 灌丛Shrub | 46.5 | 44.8 | 45.1 | 43.1 | ||
| 农业用地Farmland | 0.8 | 0.8 | 1.0 | 0.6 | ||
| 林地转灌丛Forest to shrub | 9.0 | 3.3 | 5.2 | 5.1 | ||
| 灌丛转林地Shrub to forest | 12.3 | 10.7 | 5.6 | 8.8 | ||
| >20° | 294 534 | 林地Forest | 28.9 | 37.9 | 43.3 | 42.5 |
| 灌丛Shrub | 43.4 | 41.0 | 41.1 | 36.9 | ||
| 农业用地Farmland | 0.2 | 0.3 | 0.5 | 0.3 | ||
| 林地转灌丛Forest to shrub | 9.8 | 3.7 | 6.5 | 5.5 | ||
| 灌丛转林地Shrub to forest | 12.9 | 11.8 | 4.4 | 10.6 |
| 坡向 Aspect | 总面积 Total area (hm2) | 土地覆盖改变类型 Change types | 变化率 Transformation percentage (%) | |||
|---|---|---|---|---|---|---|
| 1978~1984 | 1984~1992 | 1992~1996 | 1996~2001 | |||
| 北坡North | 108 398 | 林地Forest | 29.0 | 38.9 | 43.8 | 43.5 |
| 灌丛Shrub | 37.1 | 35.6 | 36.7 | 34.0 | ||
| 农业用地Farmland | 2.3 | 2.5 | 2.4 | 1.5 | ||
| 城镇用地Built_up | 0.1 | 0.3 | 0.3 | 0.2 | ||
| 其它Others | 1.7 | 2.4 | 2.2 | 2.1 | ||
| 林地转灌丛Forest to shrub | 8.8 | 3.9 | 6.4 | 4.9 | ||
| 灌丛转林地Shrub to forest | 13.8 | 11.2 | 4.1 | 8.9 | ||
| 东坡East | 410 363 | 林地Forest | 11.2 | 15.2 | 17.1 | 17.2 |
| 灌丛Shrub | 26.6 | 26.7 | 27.3 | 24.5 | ||
| 农业用地Farmland | 28.6 | 25.6 | 25.2 | 18.3 | ||
| 城镇用地Built_up | 0.9 | 3.4 | 1.3 | 1.5 | ||
| 其它Others | 5.3 | 6.6 | 6.7 | 7.8 | ||
| 林地转灌丛Forest to shrub | 4.0 | 2.1 | 2.9 | 2.6 | ||
| 灌丛转林地Shrub to forest | 6.1 | 4.3 | 2.7 | 5.3 | ||
| 南坡South | 366 444 | 林地Forest | 9.8 | 13.7 | 16.5 | 15.5 |
| 灌丛Shrub | 31.8 | 30.7 | 31.3 | 29.4 | ||
| 农业用地Farmland | 27.5 | 25.6 | 25.7 | 19.5 | ||
| 城镇用地Built_up | 1.2 | 2.4 | 0.9 | 1.7 | ||
| 其它Others | 5.1 | 6.7 | 6.4 | 7.4 | ||
| 林地转灌丛Forest to shrub | 4.4 | 1.7 | 3.3 | 3.4 | ||
| 灌丛转林地Shrub to forest | 5.5 | 5.5 | 2.7 | 4.9 | ||
| 西坡West | 208 626 | 林地Forest | 23.9 | 32.5 | 38.1 | 36.1 |
| 灌丛Shrub | 37.8 | 35.1 | 34.0 | 35.2 | ||
| 农业用地Farmland | 6.0 | 6.8 | 6.3 | 5.1 | ||
| 城镇用地Built_up | 0.1 | 0.3 | 0.3 | 0.5 | ||
| 其它Others | 2.2 | 2.9 | 3.5 | 3.6 | ||
| 林地转灌丛Forest to shrub | 9.5 | 2.7 | 6.4 | 5.3 | ||
| 灌丛转林地Shrub to forest | 11.5 | 11.9 | 3.3 | 7.6 | ||
| 平地Flat | 543 546 | 林地Forest | 6.8 | 9.4 | 11.1 | 10.3 |
| 灌丛Shrub | 16.1 | 15.8 | 17.3 | 16.3 | ||
| 农业用地Farmland | 39.6 | 36.7 | 33.0 | 25.8 | ||
| 城镇用地Built_up | 1.2 | 5.7 | 8.5 | 11.8 | ||
| 其它Others | 8.9 | 9.5 | 12.2 | 14.6 | ||
| 灌丛转林地Shrub to forest | 3.7 | 3.5 | 1.2 | 2.7 | ||
| 灌丛转农业用地Shrub to farmland | 5.0 | 1.3 | 1.1 | 1.4 | ||
| 农业用地转城镇用地Farmland to built_up | 8.4 | 4.7 | 6.8 | 7.1 | ||
| 城镇用地转农业用地Built_up to farmland | 1.2 | 3.6 | 1.8 | 3.2 |
表7 1978~2001年北京地区不同坡向土地类型的变化率
Table 7 Land cover transformation in different aspects in Beijing Area from 1978 to 2001
| 坡向 Aspect | 总面积 Total area (hm2) | 土地覆盖改变类型 Change types | 变化率 Transformation percentage (%) | |||
|---|---|---|---|---|---|---|
| 1978~1984 | 1984~1992 | 1992~1996 | 1996~2001 | |||
| 北坡North | 108 398 | 林地Forest | 29.0 | 38.9 | 43.8 | 43.5 |
| 灌丛Shrub | 37.1 | 35.6 | 36.7 | 34.0 | ||
| 农业用地Farmland | 2.3 | 2.5 | 2.4 | 1.5 | ||
| 城镇用地Built_up | 0.1 | 0.3 | 0.3 | 0.2 | ||
| 其它Others | 1.7 | 2.4 | 2.2 | 2.1 | ||
| 林地转灌丛Forest to shrub | 8.8 | 3.9 | 6.4 | 4.9 | ||
| 灌丛转林地Shrub to forest | 13.8 | 11.2 | 4.1 | 8.9 | ||
| 东坡East | 410 363 | 林地Forest | 11.2 | 15.2 | 17.1 | 17.2 |
| 灌丛Shrub | 26.6 | 26.7 | 27.3 | 24.5 | ||
| 农业用地Farmland | 28.6 | 25.6 | 25.2 | 18.3 | ||
| 城镇用地Built_up | 0.9 | 3.4 | 1.3 | 1.5 | ||
| 其它Others | 5.3 | 6.6 | 6.7 | 7.8 | ||
| 林地转灌丛Forest to shrub | 4.0 | 2.1 | 2.9 | 2.6 | ||
| 灌丛转林地Shrub to forest | 6.1 | 4.3 | 2.7 | 5.3 | ||
| 南坡South | 366 444 | 林地Forest | 9.8 | 13.7 | 16.5 | 15.5 |
| 灌丛Shrub | 31.8 | 30.7 | 31.3 | 29.4 | ||
| 农业用地Farmland | 27.5 | 25.6 | 25.7 | 19.5 | ||
| 城镇用地Built_up | 1.2 | 2.4 | 0.9 | 1.7 | ||
| 其它Others | 5.1 | 6.7 | 6.4 | 7.4 | ||
| 林地转灌丛Forest to shrub | 4.4 | 1.7 | 3.3 | 3.4 | ||
| 灌丛转林地Shrub to forest | 5.5 | 5.5 | 2.7 | 4.9 | ||
| 西坡West | 208 626 | 林地Forest | 23.9 | 32.5 | 38.1 | 36.1 |
| 灌丛Shrub | 37.8 | 35.1 | 34.0 | 35.2 | ||
| 农业用地Farmland | 6.0 | 6.8 | 6.3 | 5.1 | ||
| 城镇用地Built_up | 0.1 | 0.3 | 0.3 | 0.5 | ||
| 其它Others | 2.2 | 2.9 | 3.5 | 3.6 | ||
| 林地转灌丛Forest to shrub | 9.5 | 2.7 | 6.4 | 5.3 | ||
| 灌丛转林地Shrub to forest | 11.5 | 11.9 | 3.3 | 7.6 | ||
| 平地Flat | 543 546 | 林地Forest | 6.8 | 9.4 | 11.1 | 10.3 |
| 灌丛Shrub | 16.1 | 15.8 | 17.3 | 16.3 | ||
| 农业用地Farmland | 39.6 | 36.7 | 33.0 | 25.8 | ||
| 城镇用地Built_up | 1.2 | 5.7 | 8.5 | 11.8 | ||
| 其它Others | 8.9 | 9.5 | 12.2 | 14.6 | ||
| 灌丛转林地Shrub to forest | 3.7 | 3.5 | 1.2 | 2.7 | ||
| 灌丛转农业用地Shrub to farmland | 5.0 | 1.3 | 1.1 | 1.4 | ||
| 农业用地转城镇用地Farmland to built_up | 8.4 | 4.7 | 6.8 | 7.1 | ||
| 城镇用地转农业用地Built_up to farmland | 1.2 | 3.6 | 1.8 | 3.2 |
| [1] | Beijing Municipal Agricultural Regionalization Committee Office (北京市农业区划委员会办公室)(1988). Beijing Agricultural Resources and Regionalization Atlas (北京农业资源与区划图集). Surveying and Mapping Press, Beijing,57-68. (in Chinese) |
| [2] | Chen LZ (陈灵芝), Bao XC (鲍显诚), Chen QL (陈清朗), Hu YH (胡肄慧), Kong FZ (孔繁志), Miao YG (缪有贵) (1990). Study on vegetation ecology in Tianjin and Beijing region. In: Institute of Botany and Institute of Zoology, Chinese Academy of Sciences (中国科学院植物研究所和动物研究所)eds. Study on the Biology and Ecology in Tianjin and Beijing Region (京津地区生物生态学研究), Surveying and Mapping Press, Beijing.1-14. (in Chinese) |
| [3] | Chen LZ (陈灵芝), Bao XC (鲍显诚), Li CG (李才贵) (1963). Characteristics of vegetation and their relations with forestry and side_production in mountain areas in Huairou, Beijing. Acta Phytoecologica et Geobotanica Sinica (植物生态学与地植物学丛刊), 3,75-96. (in Chinese with English abstract) |
| [4] | (Department of Biology, Beijing Normal University 北京师范大学生物系) (1958). Vegetation of Shangfangshan and its Utilization (上方山植被调查及其应用). Beijing Normal University Press, Beijing. (in Chinese) |
| [5] | Gu ZL (顾朝林) (1999). Study on phenomena and mechanism of land use/cover change in Beijing. Journal of Natural Resources (自然资源学报), 14,307-312. (in Chinese with English abstract) |
| [6] | He CY (何春阳), Shi PJ (史培军), Chen J (陈晋), Zhou YY (周宇宇) (2001). A study on land use/cover change in Beijing area. Geographical Research (地理研究), 20,679-687. (in Chinese with English abstract) |
| [7] | He CY (何春阳), Shi PJ (史培军), Chen J (陈晋), Xu XL (徐小黎) (2002). Process and mechanism of urbanization in Beijing area. Acta Geographica Sinica (地理学报), 57,363-371. (in Chinese with English abstract) |
| [8] | Huo YZ (霍亚贞), Yang ZM (杨作民), Meng DZ (孟德政) (1989). Physical Geography in Beijing (北京自然地理). The Publishing House of Beijing Normal College, Beijing. (in Chinese) |
| [9] | Imbernon J (1999). Pattern and development of land use changes in the Kenyan highlands since the 1950s. Agriculture, Ecosystems and Environment, 76,67-73. |
| [10] | Ispikoudis I, Lyrintzis G, Kyriakakis S (1993). Impact of human activities on Mediterranean landscape in Western Crete. Landscape and Urban Planning, 24,259-271. |
| [11] | Land Environmental Protection Department of Beijing Municipal Planning Committee (北京市计划委员会国土环保处) (1988). Land and Resources of Beijing (北京国土资源). Beijing Science and Technology Press, Beijing. (in Chinese) |
| [12] | Li JD (李继侗), Li B (李博), Yang C (杨澄) (1959). Vegetation of Beijing. Journal of Peking University (北京大学学报), 5,397-406. (in Chinese with English abstract) |
| [13] | Li XB (李秀彬) (1996). A review of the international researches on land use/land cover change. Acta Geographica Sinica (地理学报), 51,553-558. (in Chinese with English abstract) |
| [14] | National Bureau of Statistics of China (中华人民共和国国家统计局) (2001). 2001 (中国统计年鉴2001). Statistics Press, Beijing. |
| [15] | Qi Y, Henderson M, Xu M, Chen J, Shi PJ, He CY, William SG (2004). Evolving core_periphery interactions in a rapidly expanding urban landscape: the case of Beijing. Landscape Ecology, 19,375-388. |
| [16] | Ramankutty N, Foley JA (1999). Estimating historical changes in land_cover: North American croplands from 1850 to 1992. Global Ecology and Biogeography, 8,381-396. |
| [17] | Reid RS, Kruska RL, Muthui N, Taye A, Wotton S, Wilson CJ, Mulatu W (2000). Land_use and land_cover dynamics in response to changes in climatic, biological and socio_political forces: the case of southwestern Ethiopia. Landscape Ecology, 15,339-355. |
| [18] | Shi PJ (史培军), Gong P (宫鹏), Li XB (李晓兵) (2000). Methods and Practice of Land Use/Cover Change (土地利用/覆盖变化研究的方法与实践). Science Press, Beijing. (in Chinese) |
| [19] | Sun L (孙丽), Chen HW (陈焕伟), Pan JW (潘家文) (2004). Analysis of the land use spatiotemporal variation based on DEM, Beijing Yanqing Country as an example. Journal of Mountain Science (山地学报), 22,762-766. (in Chinese with English abstract) |
| [20] | Tian GJ (田光进), Zhang ZX (张增祥), Zhou QB (周全斌), Zhao XL (赵晓丽), Wang CY (王长有), Liu B (刘斌), Tan WB (谭文彬) (2003). Research on dynamic land_use pattern of Beijing by remote sensing and GIS. Remote Sense Information (遥感信息), 1,7-10. (in Chinese with English abstract) |
| [21] | Turner BL, Meyer WB (1991). Land use and land cover in global environmental change: considerations for study. International Social Science Journal, 130,669-680. |
| [22] | Turner BL, Moss RH, Skole D (1993). Relating land use and global land cover change: a proposal for an IGBP_IHDP core project. IGBP Report No.24, Stockholm. |
| [23] | Turner BL, Skole D, Sanderson S, Fisher G, Fresco L, Leemans R (1995). Land_use and land_cover change (LUCC): science/research plan. IGBP Report, No.35, HDP Report, No. 7, Stockholm. |
| [24] | Wang JA (王静爱), He CY (何春阳), Dong YC (董艳春), Gao L (高玲), Xu W (徐伟) (2002). Analysis of land use/cover driving forces in the urban fringe of Beijing city. Advance in Sciences (地球科学进展), 17,201-208. (in Chinese with English abstract) |
| [25] | Wu CJ (吴传钧), Guo HC (郭焕成) (1994). Chinese Land Use (中国土地利用). Science Press, Beijing. |
| [1] | 吴光进, 郭垚鑫, 任成杰, 王俊, 岳明, 赵发珠. 秦岭北麓不同植被类型土壤有机碳含量分布及其影响因素[J]. 植物生态学报, 2026, 50(预发表): 1-. |
| [2] | 张静, 陈洁, 李艳朋, 盘李军, 许涵, 李意德, 何海生. 南亚热带针阔混交人工林植物生物量比较及其影响因子分析[J]. 植物生态学报, 2026, 50(2): 400-416. |
| [3] | 徐恩相, 周蕾, 章晓炜, 张国萍, 仲杜伟, 黄智, 刘派, 迟永刚. 基于不同生育阶段冠层光谱和碳通量的水稻产量估算[J]. 植物生态学报, 2026, 50(1): 82-93. |
| [4] | 张健, 孙慕梵, 宋坤, 赖丽茗, 宋永昌. 基于生态外貌-植物区系分类系统的中国常绿阔叶林分类修订[J]. 植物生态学报, 2026, 50(1): 107-122. |
| [5] | 张琳, 袁伟影, 宋创业, 吴冬秀. 1998-2010年中国典型生态系统长期监测样地环境要素、物种丰富度和生物量动态数据集[J]. 植物生态学报, 2025, 49(8): 1182-1190. |
| [6] | 严文秀, 赵诗晗, 郑春燕, 张萍, 沈海花, 常锦峰, 徐亢. 基于多物候指标的人工饲草长势监测及产量估测[J]. 植物生态学报, 2025, 49(7): 1096-1109. |
| [7] | 李家湘, 刘文倩, 蒋国平, 赵丽娟, 徐永福, 吴磊, 喻勋林. 植被科学画符号系统设计和标准化绘图范式——以森林群落剖面图为例[J]. 植物生态学报, 2025, 49(6): 897-910. |
| [8] | 熊高明, 申国珍, 徐文婷, 谢宗强, 李跃林, 徐耀粘, 陈芳清, 李家湘. 中国低山丘陵热性常绿阔叶灌丛主要类型及群落特征[J]. 植物生态学报, 2025, 49(6): 865-874. |
| [9] | 曹毅, 张松林, 王旭峰, 杨安昌, 任敏慧, 杨浩, 韩超. 兰州市南北两山植物群落数据集[J]. 植物生态学报, 2025, 49(6): 975-989. |
| [10] | 惠城阳, 章巧依, 刘腾腾, 刘维勇, 周丽娜, 金鑫杰, 张永华, 刘金亮. 温州大罗山主要植被类型及物种组成特征[J]. 植物生态学报, 2025, 49(6): 990-998. |
| [11] | 熊高明, 申国珍, 赵常明, 徐文婷, 王杨, 谢宗强, 李家湘, 徐耀粘, 李跃林, 陈芳清. 中国檵木灌丛植被类型及群落特征[J]. 植物生态学报, 2025, 49(6): 875-887. |
| [12] | 段俊丞, 王志勇, 高维聪, 张成凯, 高长宏, 刘晓彤, 李振今. 黄河三角洲湿地入侵物种互花米草时空演化与景观格局分析[J]. 植物生态学报, 2025, 49(6): 922-938. |
| [13] | 杜燕, 刘鑫, 张瀚曰, 马少伟, 包维楷. 中国高山松群系的群落特征[J]. 植物生态学报, 2025, 49(6): 816-824. |
| [14] | 李博文, 周阳, 吕静雅, 阿旺, 陈兰英, 刘世章, 伍晶, 吕汪汪, 孙建平, 贾跃凤, 赵矿, 汪诗平. 山脚基带调查低估了青藏高原山地物种丰富度: 以珠峰绒布河流域山体垂直带为例[J]. 植物生态学报, 2025, 49(3): 404-414. |
| [15] | 刘柯言, 韩璐, 宋午椰, 张初蕊, 胡旭, 许行, 陈立欣. 基于日光诱导叶绿素荧光探测干旱对黄土高原植被光合稳定性的影响[J]. 植物生态学报, 2025, 49(3): 415-431. |
| 阅读次数 | ||||||
|
全文 |
|
|||||
|
摘要 |
|
|||||
Copyright © 2026 版权所有 《植物生态学报》编辑部
地址: 北京香山南辛村20号, 邮编: 100093
Tel.: 010-62836134, 62836138; Fax: 010-82599431; E-mail: apes@ibcas.ac.cn, cjpe@ibcas.ac.cn
备案号: 京ICP备16067583号-19
![]()