
植物生态学报 ›› 2025, Vol. 49 ›› Issue (7): 1096-1109.DOI: 10.17521/cjpe.2024.0174 cstr: 32100.14.cjpe.2024.0174
严文秀1, 赵诗晗1, 郑春燕3, 张萍1, 沈海花4, 常锦峰1, 徐亢2,*( )(
)( )
)
收稿日期:2024-05-24
接受日期:2024-09-01
出版日期:2025-07-20
发布日期:2024-09-01
通讯作者:
*徐亢, E-mail: xukang@cwxu.edu.cn作者简介:ORCID:徐亢: 0000-0002-0840-9332
基金资助:
YAN Wen-Xiu1, ZHAO Shi-Han1, ZHENG Chun-Yan3, ZHANG Ping1, SHEN Hai-Hua4, CHANG Jin-Feng1, XU Kang2,*()()
Received:2024-05-24
Accepted:2024-09-01
Online:2025-07-20
Published:2024-09-01
Supported by:摘要:
为了促进人工饲草生产专业化和智能化, 实时监测饲草的生长状况和准确评估产量变得至关重要。该研究以不同肥度处理下青贮玉米(Zea mays)及燕麦(Avena sativa)两种主要饲草为研究对象, 基于物候相机照片提取的植被绿度指数(GCC)及无人机影像提取的归一化植被指数(NDVI)、叶片叶绿素指数(LCI), 在站点尺度上探讨了可见光物候相机在追踪饲草生长高度与定量估算产量方面的应用潜力。主要结果: (1)施氮量影响人工饲草的物候指标和收获指标, 高肥处理下的青贮玉米和中肥处理下的燕麦生长期长度最长(分别是(68 ± 5)和(59 ± 1)天), 相应的产量最高(分别是(28 548.30 ± 4 269.30)和(5 180.70 ± 1 939.05) kg·hm-2); (2) GCC、LCI与人工饲草株高的相关性最好, 尤其是在GCC达到绿度峰值(POP)前(R2分别是0.86和0.49), 且GCC对青贮玉米的株高动态捕捉偏差最小; (3)人工饲草物候指标能有效预测最终产量(青贮玉米R2为0.829, 燕麦R2为0.935)。该研究证实了物候相机能有效捕捉饲草的生长动态变化并实现产量预测, 所发展的基于物候指标的日尺度实时监测技术将为优化田间管理, 实现精准农业并促进人工饲草规模化生产提供有效手段。
严文秀, 赵诗晗, 郑春燕, 张萍, 沈海花, 常锦峰, 徐亢. 基于多物候指标的人工饲草长势监测及产量估测. 植物生态学报, 2025, 49(7): 1096-1109. DOI: 10.17521/cjpe.2024.0174
YAN Wen-Xiu, ZHAO Shi-Han, ZHENG Chun-Yan, ZHANG Ping, SHEN Hai-Hua, CHANG Jin-Feng, XU Kang. Growth monitoring and yield estimation of forage based on multiple phenological indicators. Chinese Journal of Plant Ecology, 2025, 49(7): 1096-1109. DOI: 10.17521/cjpe.2024.0174
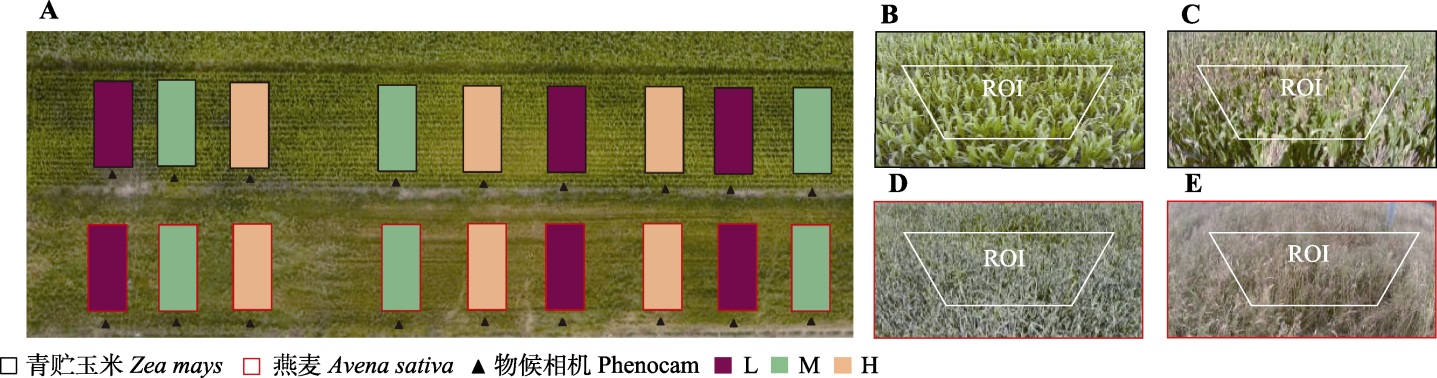
图1 无人机拍摄实景和物候相机感兴趣区(ROI)。A, 无人机照片下的田间试验。B-E, 变绿期(B、D)和枯黄期(C、E)的物候相机照片及ROI绘制。L、M、H分别表示低肥、中肥、高肥。
Fig. 1 Unmanned aerial vehicle (UAV) image of the experimental field with plots of treatments and locations of the phenocams, and the illustration of the region of interesting (ROI) from the phenocams. A, UAV image on field trials. B-E, Phenocam images and ROI mapping of green up phase (B, D) and brown down phase (C, E). L, M and H represent low, medium and high fertilizer level, respectively.
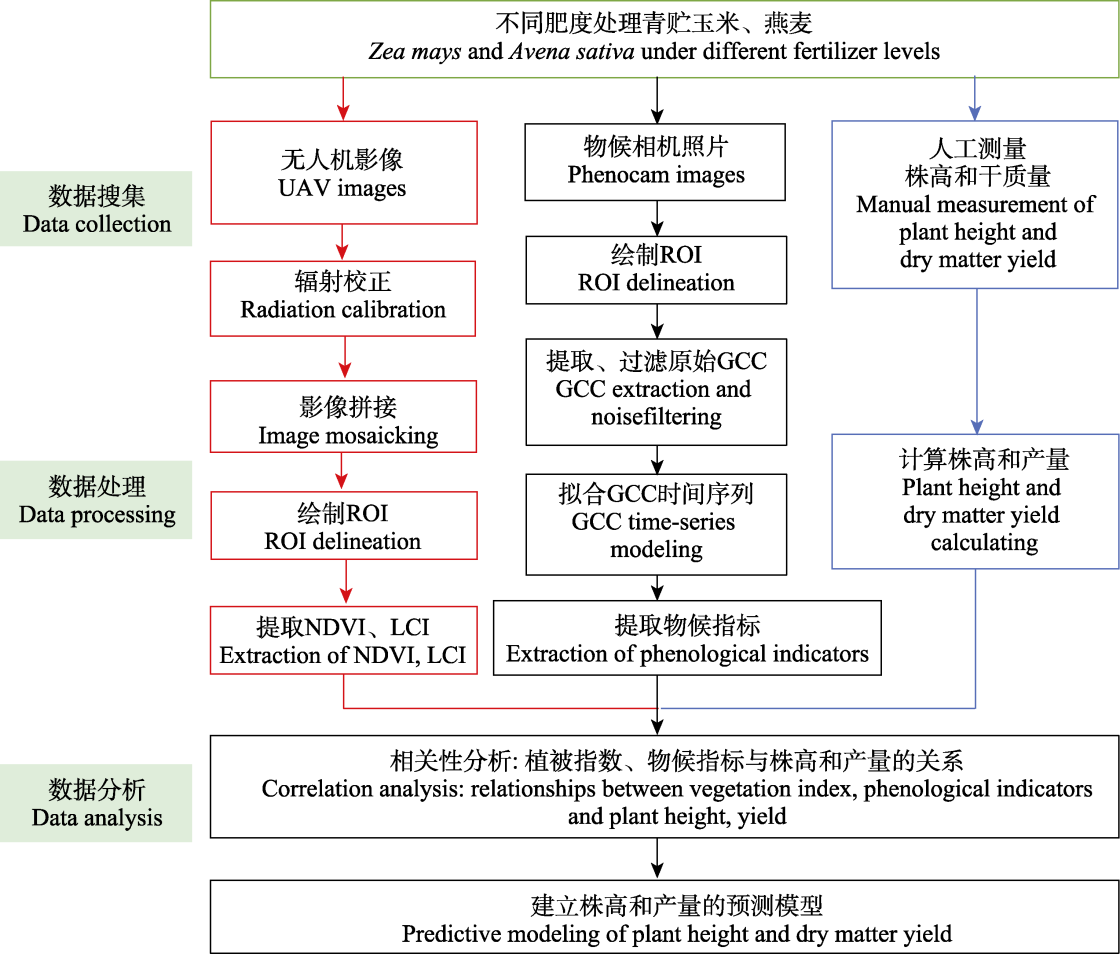
图2 无人机(UAV)影像及物候相机照片处理流程。GCC, 植被绿度指数; LCI, 叶片叶绿素指数; NDVI, 归一化植被指数; ROI, 感兴趣区。
Fig. 2 Processing flow of unmanned aerial vehicle (UAV) images and phenocam images. GCC, the green chromatic ccoordinate; LCI, the leaf chlorophyll index; NDVI, the normalized difference vegetation index; ROI, the region of interesting.
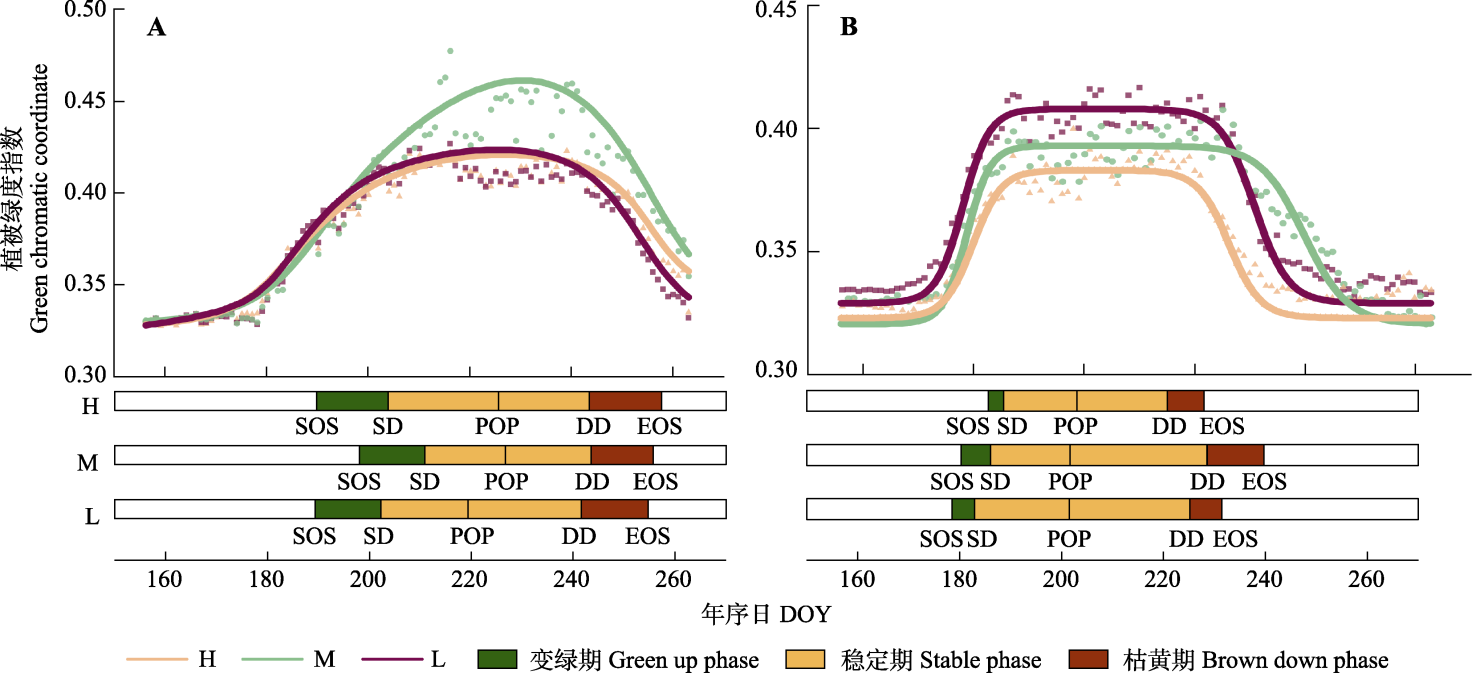
图3 不同氮肥处理下全生育期植被绿度指数(GCC)变化及对应物候期和物候阶段。A, 青贮玉米。B, 燕麦。H, 高肥; L, 低肥; M, 中肥。DD, 生长衰退日; EOS, 生长期结束; POP, 绿度峰值; SD, 稳定生长日; SOS, 生长期开始。
Fig. 3 Seasonal dynamics of the Green chromatic coordinate (GCC) and the retrieved events of phenology and phases of phenology during the whole growing period under different nitrogen fertilizer levels. A, Zea mays. B, Avena sativa. H, high fertilizer; L, low fertilizer; M, medium fertilizer. DD, downturn date; EOS, end of season; POP, position of peak greenness; SD, stabilization date; SOS, start of growing season. DOY, day of year.
| 青贮玉米 Zea mays | 燕麦 Avena sativa | |||||||
|---|---|---|---|---|---|---|---|---|
| L | M | H | p | L | M | H | p | |
| 物候期 Events of phenology (DOY) | ||||||||
| UD | 173 ± 7 | 180 ± 2 | 174 ± 2 | 0.271 | 173 ± 3 | 174 ± 1 | 175 ± 2 | 0.584 |
| SOS | 189 ± 4 | 198 ± 8 | 190 ± 5 | 0.314 | 179 ± 3 | 180 ± 3 | 186 ± 10 | 0.587 |
| SD | 202 ± 11 | 211 ± 10 | 204 ± 10 | 0.683 | 183 ± 4 | 186 ± 7 | 189 ± 10 | 0.753 |
| POP | 219 ± 9 | 227 ± 4 | 225 ± 2 | 0.480 | 202 ± 1 | 202 ± 8 | 203 ± 6 | 0.970 |
| DD | 242 ± 2 | 244 ± 3 | 243 ± 5 | 0.835 | 225 ± 1ab | 229 ± 3a | 221 ± 2b | 0.025* |
| EOS | 255 ± 2 | 256 ± 2 | 257 ± 3 | 0.501 | 232 ± 1b | 240 ± 2a | 228 ± 4b | 0.017* |
| RD | 266 ± 3 | 269 ± 3 | 282 ± 26 | 0.579 | 237 ± 0ab | 250 ± 6a | 234 ± 7b | 0.049* |
| 物候阶段 Phases of phenology (d) | ||||||||
| 变绿期 Green up phase | 13 ± 7 | 13 ± 2 | 14 ± 5 | 0.971 | 4 ± 0 | 6 ± 3 | 3 ± 2 | 0.489 |
| 稳定期 Stable phase | 39 ± 12 | 33 ± 13 | 40 ± 14 | 0.837 | 42 ± 5 | 43 ± 7 | 32 ± 10 | 0.309 |
| 枯黄期 Brown down phase | 13 ± 4 | 12 ± 1 | 14 ± 7 | 0.907 | 6 ± 0 | 11 ± 3 | 7 ± 2 | 0.229 |
| LOS | 65 ± 3 | 58 ± 9 | 68 ± 5 | 0.326 | 53 ± 3 | 59 ± 1 | 42 ± 10 | 0.127 |
| 物候斜率 Slope of GCC during the phases of phenology (× 103 GCC·d-1) | ||||||||
| PRR | 48.06 ± 22.15 | 35.58 ± 9.97 | 38.99 ± 14.40 | 0.742 | 94.28 ± 0.87 | 57.29 ± 63.87 | 80.60 ± 42.65 | 0.704 |
| PSR | -43.39 ± 11.13 | -39.19 ± 6.51 | -44.32 ± 25.10 | 0.946 | -75.50 ± 4.27b | -21.54 ± 18.75a | -69.01 ± 24.19b | 0.043* |
| 收获特征 Harvest index | ||||||||
| 产量 Yield (kg·hm-2) | 15 985.20 ± 4 605.30 | 19 737.15 ± 5 929.20 | 28 548.30 ± 4 269.30 | 0.106 | 4 293.30 ± 274.20 | 5 180.70 ± 1 939.05 | 5 036.60 ± 787.95 | 0.830 |
表1 不同氮肥施用下的物候指标及收获指标(平均值±标准差)
Table 1 Phenological indicators and harvest index under different nitrogen fertilizer application levels (mean ± SD)
| 青贮玉米 Zea mays | 燕麦 Avena sativa | |||||||
|---|---|---|---|---|---|---|---|---|
| L | M | H | p | L | M | H | p | |
| 物候期 Events of phenology (DOY) | ||||||||
| UD | 173 ± 7 | 180 ± 2 | 174 ± 2 | 0.271 | 173 ± 3 | 174 ± 1 | 175 ± 2 | 0.584 |
| SOS | 189 ± 4 | 198 ± 8 | 190 ± 5 | 0.314 | 179 ± 3 | 180 ± 3 | 186 ± 10 | 0.587 |
| SD | 202 ± 11 | 211 ± 10 | 204 ± 10 | 0.683 | 183 ± 4 | 186 ± 7 | 189 ± 10 | 0.753 |
| POP | 219 ± 9 | 227 ± 4 | 225 ± 2 | 0.480 | 202 ± 1 | 202 ± 8 | 203 ± 6 | 0.970 |
| DD | 242 ± 2 | 244 ± 3 | 243 ± 5 | 0.835 | 225 ± 1ab | 229 ± 3a | 221 ± 2b | 0.025* |
| EOS | 255 ± 2 | 256 ± 2 | 257 ± 3 | 0.501 | 232 ± 1b | 240 ± 2a | 228 ± 4b | 0.017* |
| RD | 266 ± 3 | 269 ± 3 | 282 ± 26 | 0.579 | 237 ± 0ab | 250 ± 6a | 234 ± 7b | 0.049* |
| 物候阶段 Phases of phenology (d) | ||||||||
| 变绿期 Green up phase | 13 ± 7 | 13 ± 2 | 14 ± 5 | 0.971 | 4 ± 0 | 6 ± 3 | 3 ± 2 | 0.489 |
| 稳定期 Stable phase | 39 ± 12 | 33 ± 13 | 40 ± 14 | 0.837 | 42 ± 5 | 43 ± 7 | 32 ± 10 | 0.309 |
| 枯黄期 Brown down phase | 13 ± 4 | 12 ± 1 | 14 ± 7 | 0.907 | 6 ± 0 | 11 ± 3 | 7 ± 2 | 0.229 |
| LOS | 65 ± 3 | 58 ± 9 | 68 ± 5 | 0.326 | 53 ± 3 | 59 ± 1 | 42 ± 10 | 0.127 |
| 物候斜率 Slope of GCC during the phases of phenology (× 103 GCC·d-1) | ||||||||
| PRR | 48.06 ± 22.15 | 35.58 ± 9.97 | 38.99 ± 14.40 | 0.742 | 94.28 ± 0.87 | 57.29 ± 63.87 | 80.60 ± 42.65 | 0.704 |
| PSR | -43.39 ± 11.13 | -39.19 ± 6.51 | -44.32 ± 25.10 | 0.946 | -75.50 ± 4.27b | -21.54 ± 18.75a | -69.01 ± 24.19b | 0.043* |
| 收获特征 Harvest index | ||||||||
| 产量 Yield (kg·hm-2) | 15 985.20 ± 4 605.30 | 19 737.15 ± 5 929.20 | 28 548.30 ± 4 269.30 | 0.106 | 4 293.30 ± 274.20 | 5 180.70 ± 1 939.05 | 5 036.60 ± 787.95 | 0.830 |
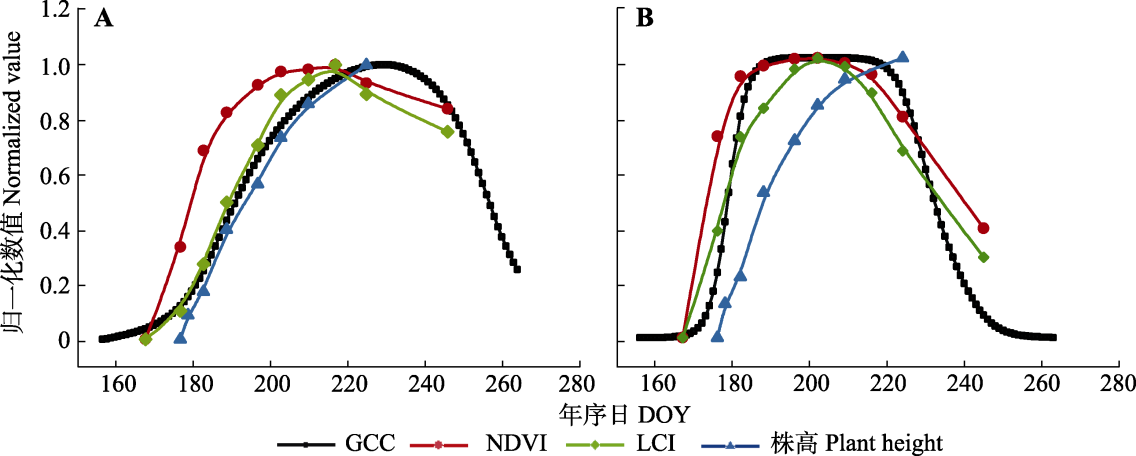
图4 全生育期归一化后的植被绿度指数(GCC)、归一化植被指数(NDVI)、叶片叶绿素指数(LCI)和人工饲草株高的变化。A, 青贮玉米。B, 燕麦。
Fig. 4 Plant height of forage during the growing season and the normalized vegetation index: green chromatic coordinate (GCC), normalized difference vegetation index (NDVI), leaf chlorophyll index (LCI). A, Zea mays. B, Avena sativa. DOY, day of year.
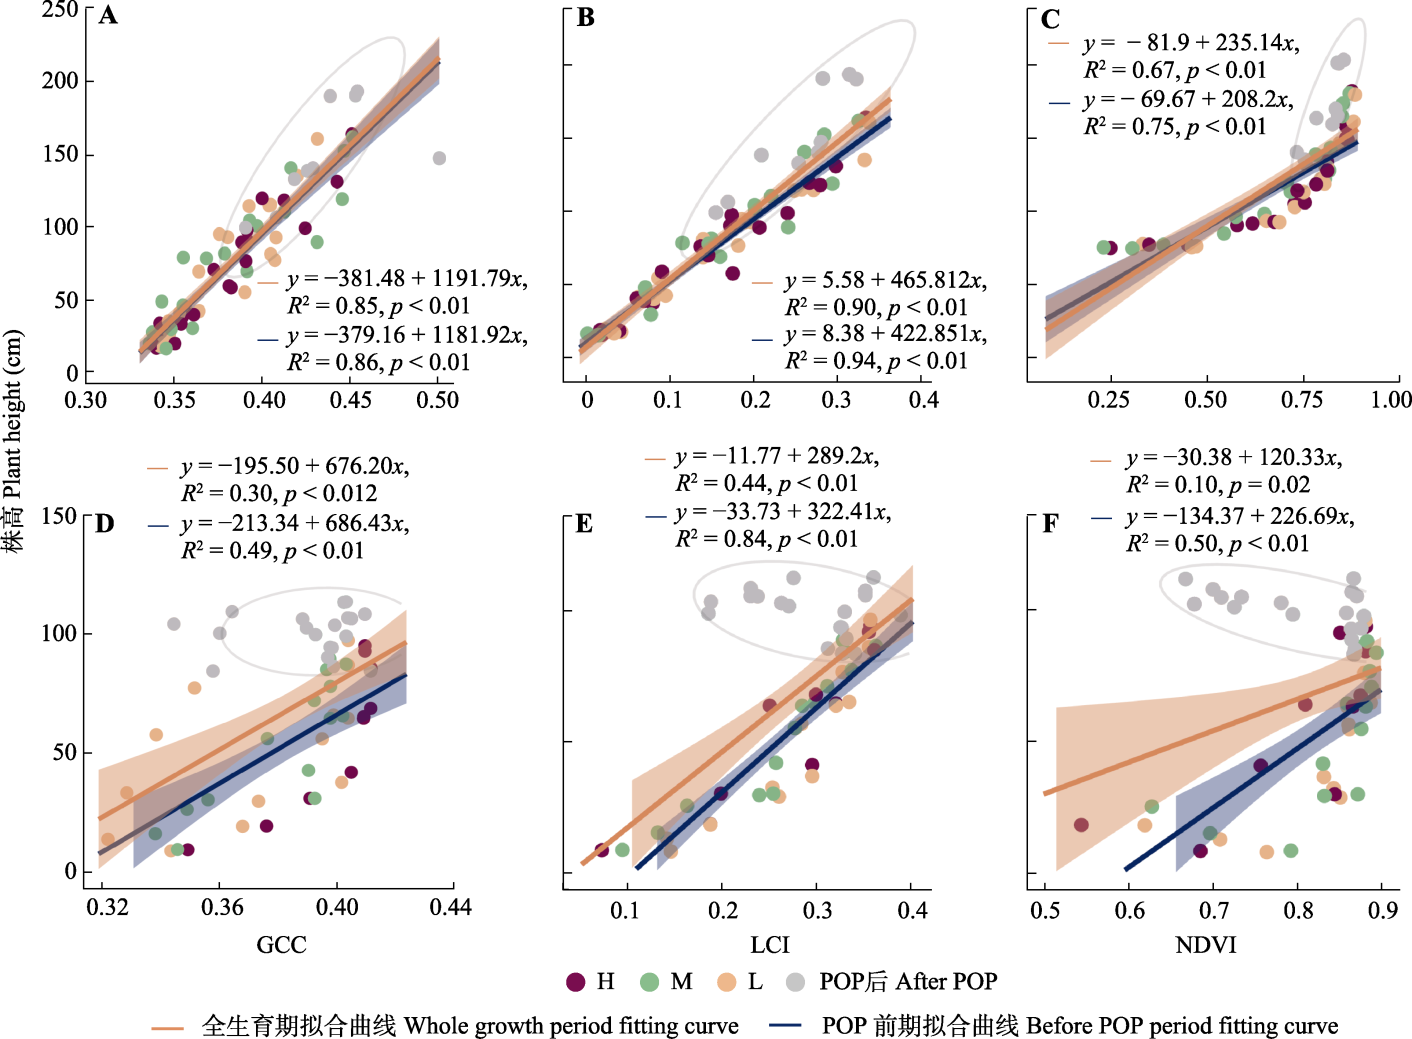
图5 两种人工饲草株高与植被绿度指数(GCC)、归一化植被指数(NDVI)、叶片叶绿素指数(LCI)的线性关系, 灰色椭圆为95%置信区间。A-C, 青贮玉米。D-F, 燕麦。H, 高肥; L, 低肥; M, 中肥。POP, 绿度峰值。
Fig. 5 Linear relationship between plant height and vegetation index: green chromatic coordinate (GCC), normalized difference vegetation index (NDVI), leaf chlorophyll index (LCI) for two forage species, the gray ellipses indicate the 95% confidence intervals. A-C, Zea mays. D-F, Avena sativa. H, high fertilizer; L, low fertilizer; M, medium fertilizer. POP, position of peak greenness.
| 植被指数 Vegetation index | 青贮玉米产量R2 R2 of Zea mays yield | 青贮玉米产量adj.R2 adj.R2 of Zea mays yield | 燕麦产量R2 R2 of Avena sativa yield | 燕麦产量adj.R2 adj.R2 of Avena sativa yield |
|---|---|---|---|---|
| GCC | 0.032 | -0.106 | 0.031 | -0.131 |
| NDVI | 0.008 | -0.134 | 0.059 | -0.098 |
| LCI | 0.001 | -0.141 | 0.031 | -0.130 |
| GCC × NDVI | 0.034 | -0.288 | 0.091 | -0.272 |
| NDVI × LCI | 0.008 | -0.322 | 0.247 | -0.054 |
| GCC × LCI | 0.062 | -0.251 | 0.096 | -0.265 |
| GCC × NDVI × LCI | 0.062 | -0.501 | 0.447 | 0.033 |
表2 青贮玉米和燕麦的产量与植被指数拟合模型的R2及调整后R2 (adj.R2)
Table 2 R2 and adjusted R2 (adj.R2) of the fitted models between yield and vegetation index for Zea mays and Avena sativa
| 植被指数 Vegetation index | 青贮玉米产量R2 R2 of Zea mays yield | 青贮玉米产量adj.R2 adj.R2 of Zea mays yield | 燕麦产量R2 R2 of Avena sativa yield | 燕麦产量adj.R2 adj.R2 of Avena sativa yield |
|---|---|---|---|---|
| GCC | 0.032 | -0.106 | 0.031 | -0.131 |
| NDVI | 0.008 | -0.134 | 0.059 | -0.098 |
| LCI | 0.001 | -0.141 | 0.031 | -0.130 |
| GCC × NDVI | 0.034 | -0.288 | 0.091 | -0.272 |
| NDVI × LCI | 0.008 | -0.322 | 0.247 | -0.054 |
| GCC × LCI | 0.062 | -0.251 | 0.096 | -0.265 |
| GCC × NDVI × LCI | 0.062 | -0.501 | 0.447 | 0.033 |

图6 两种人工饲草物候指标与收获指标的皮尔逊相关系数。皮尔逊相关系数以饼状图的形式呈现, 红色为正相关, 蓝色为负相关。株高为8月12日的测量数值。Browndownphase, 枯黄期时间; DD, 生长衰退日; EOS, 生长期结束; Greenupphase, 变绿期; LOS, 生长期长度; POP, 绿度峰值; PRR, 生长速率; PSR, 衰退速率; RD, 死亡日; SD, 稳定生长日; SOS, 生长期开始; Stablephase, 稳定期时间; UD, 生长起始日。
Fig. 6 Pearson correlation coefficients between phenological indicators and harvest index of two forage species. Plant height was measured at August 12. Browndownphase, days of brown down phase; DD, downturn date; EOS, end of season; Greenupphase, days of green up phase; LOS, length of growing season; POP, position of peak greenness; PRR, peak recovery rate; PSR, peak senescence rate; RD, recession date; SD, stabilization date; SOS, start of growing season; Stablephase, days of stable phase; UD, upturn date.
| 收获指标 Harvest index | 拟合方程 Fitting equation | 调整后R2 adj. R2 | 赤池信息量准则 AIC |
|---|---|---|---|
| 青贮玉米株高 Plant height of Zea mays | y = 2610.663 - 9.479SD - 0.0492PRR - 4.934LOS | 0.328 | 91.03 |
| 青贮玉米产量 Yield of Zea mays | y = -36427.42 + 224.29Greenupphase + 155.50UD + 119.23LOS | 0.829 | 126.66 |
| 燕麦株高 Plant height of Avena sativa | y = 464 - 1.692DD + 0.8107Stablephase - 0.0014PRR | 0.975 | 20.65 |
| 燕麦产量 Yield of Avena sativa | y = 8463.209 - 37.717SOS - 26.772Stablephase - 0.0325PRR | 0.935 | 78.19 |
表3 多重物候指标解释收获指标的最佳拟合模型及对应的调整后R2、赤池信息量准则
Table 3 The best fitting models between multiple phenological metrics and harvest index, and the corresponding adjusted R2 (adj.R2) and akaike information criterion (AIC)
| 收获指标 Harvest index | 拟合方程 Fitting equation | 调整后R2 adj. R2 | 赤池信息量准则 AIC |
|---|---|---|---|
| 青贮玉米株高 Plant height of Zea mays | y = 2610.663 - 9.479SD - 0.0492PRR - 4.934LOS | 0.328 | 91.03 |
| 青贮玉米产量 Yield of Zea mays | y = -36427.42 + 224.29Greenupphase + 155.50UD + 119.23LOS | 0.829 | 126.66 |
| 燕麦株高 Plant height of Avena sativa | y = 464 - 1.692DD + 0.8107Stablephase - 0.0014PRR | 0.975 | 20.65 |
| 燕麦产量 Yield of Avena sativa | y = 8463.209 - 37.717SOS - 26.772Stablephase - 0.0325PRR | 0.935 | 78.19 |
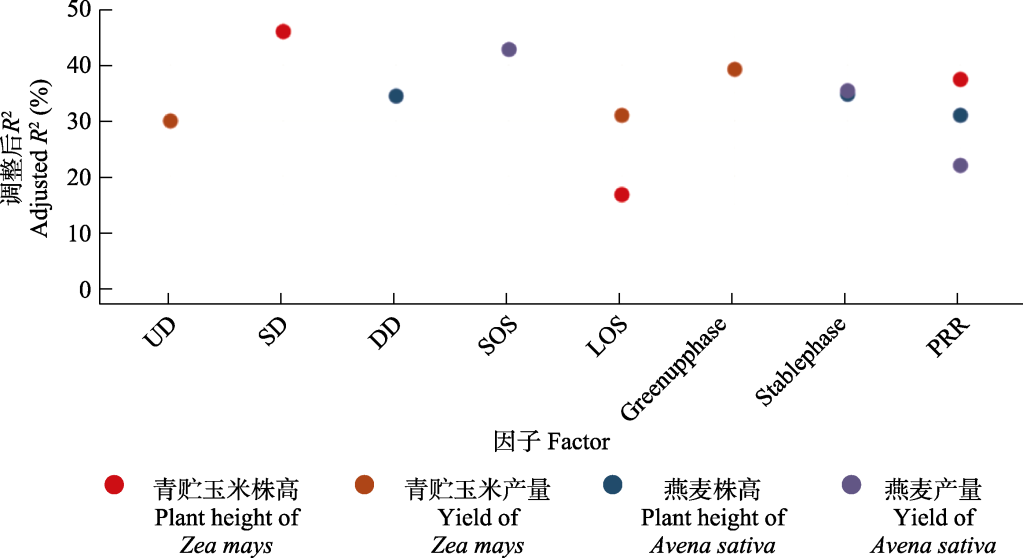
图7 最佳拟合模型中根据各因子R2的贡献度得到的相对解释度。DD, 生长衰退日; Greenupphase, 变绿期; LOS, 生长期长度; PRR, 生长速率; SD, 稳定生长日; SOS, 生长期开始; Stablephase, 稳定期时间; UD, 生长起始日。
Fig. 7 Explanatory contribution of each factor in the best-fitting models derived from the contribution of each factor to the total R2. DD, downturn date; Greenupphase, days of green up phase; LOS, length of growing season; PRR, peak recovery rate; SD, stabilization date; SOS, start of growing season; Stablephase, days of stable phase; UD, upturn date.
| [1] | A LY (2024). Research on seasonal climate change and its impact on agriculture, animal husbandry and forestry in Hulunbuir City in 2022. Inner Mongolia Science and Technology and Economy, (3), 82-85. |
| [阿丽雅 (2024). 2022年呼伦贝尔市季节气候变化及对农牧林业影响的研究. 内蒙古科技与经济, (3), 82-85.] | |
| [2] | Ao TG, Xiao YZ, Sun L, Xu LJ, Wu QX, Qi L, Li G, Feng R, Su D (2024). Present situation, problems and sustainable development measures of Hulunbuir forage industry. Acta Agrestia Sinica, 32, 661-666. |
|
[敖特根, 肖燕子, 孙林, 徐丽君, 吴清秀, 其力格尔, 李光, 风润, 苏都 (2024). 呼伦贝尔饲草产业发展现状、问题与可持续发展对策. 草地学报, 32, 661-666.]
DOI |
|
| [3] |
Arshad MS, Farooq M, Asch F, Krishna JSV, Vara Prasad PV, Siddique KHM (2017). Thermal stress impacts reproductive development and grain yield in rice. Plant Physiology and Biochemistry, 115, 57-72.
DOI PMID |
| [4] | Beck PSA, Atzberger C, Høgda KA, Johansen B, Skidmore AK (2006). Improved monitoring of vegetation dynamics at very high latitudes: a new method using MODIS NDVI. Remote Sensing of Environment, 100, 321-334. |
| [5] | Bendig J, Yu K, Aasen H, Bolten A, Bennertz S, Broscheit J, Gnyp ML, Bareth G (2015). Combining UAV-based plant height from crop surface models, visible, and near infrared vegetation indices for biomass monitoring in barley. International Journal of Applied Earth Observation and Geoinformation, 39, 79-87. |
| [6] | Chen Z, Wang H, Wang JZ, Shi HJ, Liu HY, He JS (2021). Estimation on seasonal dynamics of alpine grassland aboveground biomass using phenology camera-derived NDVI. Chinese Journal of Plant Ecology, 45, 487-495. |
| [陈哲, 汪浩, 王金洲, 石慧瑾, 刘慧颖, 贺金生 (2021). 基于物候相机归一化植被指数估算高寒草地植物地上生物量的季节动态. 植物生态学报, 45, 487-495.] | |
| [7] | Colovic M, Yu K, Todorovic M, Cantore V, Hamze M, Albrizio R, Stellacci AM (2022). Hyperspectral vegetation indices to assess water and nitrogen status of sweet maize crop. Agronomy, 12, 2181. DOI: 10.3390/agronomy12092181. |
| [8] |
Cui LL, Shi J, Du HQ (2021). Advances in remote sensing extraction of vegetation phenology and its driving factors. Advances in Earth Science, 36(1), 9-16.
DOI |
|
[崔林丽, 史军, 杜华强 (2021). 植被物候的遥感提取及其影响因素研究进展. 地球科学进展, 36(1), 9-16.]
DOI |
|
| [9] | Feng YP, Shi Y, Zhao MY, Shen HH, Xu LC, Luo YK, Liu YZ, Xing AJ, Kang J, Jing HC, Fang JY (2022). Yield and quality properties of alfalfa (Medicago sativa L.) and their influencing factors in China. European Journal of Agronomy, 141, 126637. DOI: 10.1016/j.eja.2022.126637. |
| [10] | Filippa G, Cremonese E, Migliavacca M, Galvagno M, Forkel M, Wingate L, Tomelleri E, Morra di Cella U, Richardson AD (2016). Phenopix: a R package for image-based vegetation phenology. Agricultural and Forest Meteorology, 220, 141-150. |
| [11] | Gao F, Wang TM, Lu XS (2022). Analysis of China’s commercial forage production situation in 2021 and its trend prospect in 2022. Animal Agriculture, (3), 32-37. |
| [高菲, 王铁梅, 卢欣石 (2022). 2021年我国商品饲草生产形势分析与2022年趋势展望. 畜牧产业, (3), 32-37.] | |
| [12] | Gao JL, Liu J, Yin JP, Ge J, Hou MJ, Feng QS, Liang TG (2020). Hyperspectral remote sensing progress for forage nutritional quality and quantity in natural grassland. Acta Prataculturae Sinica, 29(2), 172-185. |
|
[高金龙, 刘洁, 殷建鹏, 葛静, 侯蒙京, 冯琦胜, 梁天刚 (2020). 天然草地牧草营养品质的高光谱遥感研究进展. 草业学报, 29(2), 172-185.]
DOI |
|
| [13] | Gu LH, Post WM, Baldocchi DD, Black TA, Suyker AE, Verma SB, Vesala T, Wofsy SC (2009). Characterizing the seasonal dynamics of plant community photosynthesis across a range of vegetation types//Noormets A. Phenology of Ecosystem Processes: Applications in Global Change Research. Springer, New York. 35-58. |
| [14] | Iqbal B, Kong FX, Ullah I, Ali S, Li HJ, Wang JW, Ali Khattak W, Zhou ZG (2020). Phosphorus application improves the cotton yield by enhancing reproductive organ biomass and nutrient accumulation in two cotton cultivars with different phosphorus sensitivity. Agronomy, 10, 153. DOI: 10.3390/agronomy10020153. |
| [15] | Ji ZL, Pan YZ, Zhu XF, Wang JY, Li QN (2021). Prediction of crop yield using phenological information extracted from remote sensing vegetation index. Sensors, 21, 1406. DOI: 10.3390/s21041406. |
| [16] | Jiang ZW, Liu GY, An HY, Shi W, Chang SH, Zhang C, Jia QM, Hou FJ (2022). Effects of planting density and nitrogen application on forage yield, quality and nitrogen use efficiency in a maize/forage soybean intercropping system. Acta Prataculturae Sinica, 31(7), 157-171. |
| [蒋紫薇, 刘桂宇, 安昊云, 石薇, 常生华, 张程, 贾倩民, 侯扶江 (2022). 种植密度与施氮对玉米/秣食豆间作系统饲草产量、品质和氮肥利用的影响. 草业科学, 31(7), 157-171.] | |
| [17] |
Jimenez-Berni JA, Deery DM, Rozas-Larraondo P, Condon ATG, Rebetzke GJ, James RA, Bovill WD, Furbank RT, Sirault XRR (2018). High throughput determination of plant height, ground cover, and above-ground biomass in wheat with LiDAR. Frontiers in Plant Science, 9, 237. DOI: 10.3389/fpls.2018.00237.
PMID |
| [18] | Klosterman ST, Hufkens K, Gray JM, Melaas E, Sonnentag O, Lavine I, Mitchell L, Norman R, Friedl MA, Richardson AD (2014). Evaluating remote sensing of deciduous forest phenology at multiple spatial scales using PhenoCam imagery. Biogeosciences, 11, 4305-4320. |
| [19] | Kong DD, Zhang Q, Huang WL, Gu XH (2017). Vegetation phenology change in Tibetan Plateau from 1982 to 2013 and its related meteorological factors. Acta Geographica Sinica, 72, 39-52. |
|
[孔冬冬, 张强, 黄文琳, 顾西辉 (2017). 1982-2013年青藏高原植被物候变化及气象因素影响. 地理学报, 72, 39-52.]
DOI |
|
| [20] | Lai DL, Fan Y, Zhu HL, He F, Liang Y, Xu XR, Wen J, Wang JZ, Yan J, Cheng JP (2020). Network analysis of physiological and biochemical indexes of oat salt tolerance. Journal of Crops, 36(2), 147-155. |
| [赖弟利, 范昱, 朱红林, 何凤, 梁勇, 徐欣然, 文杰, 王俊珍, 严俊, 程剑平 (2020). 燕麦耐盐性的生理生化指标网络分析. 作物杂志, 36(2), 147-155.] | |
| [21] | Li H, Huang G, Meng Q, Ma L, Yuan L, Wang F, Zhang W, Cui Z, Shen J, Chen X, Jiang R, Zhang F (2011). Integrated soil and plant phosphorus management for crop and environment in China. A review. Plant and Soil, 349, 157-167. |
| [22] | Liu YJ, Bachofen C, Wittwer R, Silva Duarte G, Sun Q, Klaus VH, Buchmann N (2022). Using PhenoCams to track crop phenology and explain the effects of different cropping systems on yield. Agricultural Systems, 195, 103306. DOI: 10.1016/j.agsy.2021.103306. |
| [23] | Liu YJ, Chen QM, Ge QS, Dai JH, Qin Y, Dai L, Zou XT, Chen J (2018). Modelling the impacts of climate change and crop management on phenological trends of spring and winter wheat in China. Agricultural and Forest Meteorology, 248, 518-526. |
| [24] | Lu PL, Yu Q, He QT (2006). Responses of plant phenology to climatic change. Acta Ecologica Sinica, 26, 923-929. |
| [陆佩玲, 于强, 贺庆棠 (2006). 植物物候对气候变化的响应. 生态学报, 26, 923-929.] | |
| [25] | Martiny N, Richard Y, Camberlin P (2005). Interannual persistence effects in vegetation dynamics of semi-arid Africa. Geophysical Research Letters, 32, 2005GL024634. DOI: 10.1029/2005GL024634. |
| [26] | Mueller B, Hauser M, Iles C, Rimi RH, Zwiers FW, Wan H (2015). Lengthening of the growing season in wheat and maize producing regions. Weather and Climate Extremes, 9, 47-56. |
| [27] |
Naqvi SA, Tahir MN, Shah GA, Sattar RS, Awais M (2019). Remote estimation of wheat yield based on vegetation indices derived from time series data of landsat 8 imagery. Applied Ecology and Environmental Research, 17, 3909-3925.
DOI |
| [28] | Noureldin NA, Aboelghar MA, Saudy HS, Ali AM (2013). Rice yield forecasting models using satellite imagery in Egypt. The Egyptian Journal of Remote Sensing and Space Science, 16, 125-131. |
| [29] | Nuarsa IW, Nishio F, Hongo C (2011). Rice yield estimation using landsat ETM+ data and field observation. Journal of Agricultural Science, 4, 45-56. |
| [30] | Piao SL, Friedlingstein P, Ciais P, Viovy N, Demarty J (2007). Growing season extension and its impact on terrestrial carbon cycle in the Northern Hemisphere over the past 2 decades. Global Biogeochemical Cycles, 21, 2006GB002888. DOI: 10.1029/2006GB002888. |
| [31] |
Prasad NR, Patel NR, Danodia A (2021). Cotton yield estimation using phenological metrics derived from long-term MODIS data. Journal of the Indian Society of Remote Sensing, 49, 2597-2610.
DOI |
| [32] | Qu XB, Wang YP, Wang H, Gao SX, Zou XH, Dou HS (2023). Changes of leaf area index and its response to climate in Hulun Buir. Meteorological and Environmental Sciences, 46(1), 32-38. |
| [曲学斌, 王彦平, 王涵, 高绍鑫, 邹晓华, 窦华山 (2023). 呼伦贝尔叶面积指数变化及其对气候的响应. 气象与环境科学, 46(1), 32-38.] | |
| [33] |
Richardson AD, Braswell BH, Hollinger DY, Jenkins JP, Ollinger SV (2009). Near-surface remote sensing of spatial and temporal variation in canopy phenology. Ecological Applications, 19, 1417-1428.
DOI PMID |
| [34] | Rosolem CA, Oosterhuis DM, de Souza FS (2013). Cotton response to mepiquat chloride and temperature. Scientia Agricola, 70, 82-87. |
| [35] | Shen MG, Wang SP, Jiang N, Sun JP, Cao RY, Ling XF, Fang B, Zhang L, Zhang LH, Xu XY, Lv WW, Li BL, Sun QL, Meng FD, Jiang YH, et al. (2022). Plant phenology changes and drivers on the Qinghai-Tibetan Plateau. Nature Reviews Earth & Environment, 3, 633-651. |
| [36] |
Sloat LL, Gerber JS, Samberg LH, Smith WK, Herrero M, Ferreira LG, Godde CM, West PC (2018). Increasing importance of precipitation variability on global livestock grazing lands. Nature Climate Change, 8, 214-218.
DOI |
| [37] | Tarbell KA, Reid JF (1991). A computer vision system for characterizing corn growth and development. Transactions of the ASAE, 34, 2245-2255. |
| [38] |
Wang C, Tang YJ (2019). Responses of plant phenology to nitrogen addition: a meta-analysis. Oikos, 128, 1243-1253.
DOI |
| [39] | Wang HL, Zuo YC, Yan X, Zhou XK, Kou J, Yang XZ, Guo JY, Pu J, Zhang HR, Du ZH (2021). Effect of cutting height and nitrogen fertilizer rate on yield and nutritive value of whole-plant mulberry (Morus alba). Acta Prataculturae Sinica, 30(11), 203-211. |
|
[王红林, 左艳春, 严旭, 周晓康, 寇晶, 杨希智, 郭俊英, 蒲军, 张浩仁, 杜周和 (2021). 刈割高度与施氮量对饲料桑全株产量及营养品质的影响. 草业学报, 30(11), 203-211.]
DOI |
|
| [40] | Wang L, Jiang YJ, Wang W, Wang LW (2020). Nutrient status and change characteristics of main soil types in cultivated land in Hulunbeier city. China Agricultural Technology Extension, 36(4), 52-58. |
| [王璐, 姜英君, 王炜, 王立伟 (2020). 呼伦贝尔市耕地主要土壤类型养分状况及变化特征. 中国农技推广, 36(4), 52-58.] | |
| [41] | Wang LG, Tian YC, Yao X, Zhu Y, Cao WX (2014). Predicting grain yield and protein content in wheat by fusing multi-sensor and multi-temporal remote-sensing images. Field Crops Research, 164, 178-188. |
| [42] | Wang MY, Luo Y, Zhang ZY, Xie QY, Wu XD, Ma XL (2022). Recent advances in remote sensing of vegetation phenology: retrieval algorithm and validation strategy. National Remote Sensing Bulletin, 26, 431-455. |
| [王敏钰, 罗毅, 张正阳, 谢巧云, 吴小丹, 马轩龙 (2022). 植被物候参数遥感提取与验证方法研究进展. 遥感学报, 26, 431-455.] | |
| [43] | Wang XQ, Wang MM, Wang SQ, Wu YD (2015). Extraction of vegetation information from visible unmanned aerial vehicle images. Transactions of the Chinese Society of Agricultural Engineering, 31(5), 152-159. |
| [汪小钦, 王苗苗, 王绍强, 吴云东 (2015). 基于可见光波段无人机遥感的植被信息提取. 农业工程学报, 31(5), 152-159.] | |
| [44] | Wang ZW, Zhang CM, Gao LX, Fan CZ, Xu XX, Zhang FZ, Zhou YM, Niu FP, Li ZH (2024). Time phase selection and accuracy analysis for predicting winter wheat yield based on time series vegetation index. Remote Sensing, 16, 1995. DOI: 10.3390/rs16111995. |
| [45] | Weiss M, Jacob F, Duveiller G (2020). Remote sensing for agricultural applications: a meta-review. Remote Sensing of Environment, 236, 111402. DOI: 10.1016/j.rse.2019.111402. |
| [46] |
White MA, Running SW, Thornton PE (1999). The impact of growing-season length variability on carbon assimilation and evapotranspiration over 88 years in the eastern US deciduous forest. International Journal of Biometeorology, 42, 139-145.
PMID |
| [47] | Xu LN, Qu YH, Sun CX, Wan HW, Asiya M, Liu SM (2024). Comparison of vertical and inclined camera observations on the validation results of remote sensing phenological parameters. National Remote Sensing Bulletin, 28, 2565-2581. |
| [许丽娜, 屈永华, 孙晨曦, 万华伟, 阿斯娅·曼力克, 刘绍民 (2024). 垂直与倾斜相机观测对遥感物候参数验证影响的对比研究. 遥感学报, 28, 2565-2581.] | |
| [59] |
[周玉科 (2018). 基于数码照片的植被物候提取多方法比较研究. 地理科学进展, 37, 1031-1044.]
DOI |
| [60] | Zhou YK (2019). Greenness index from phenocams performs well in linking climatic factors and monitoring grass phenology in a temperate prairie ecosystem. Journal of Resources and Ecology, 10, 481. DOI: 10.5814/j.issn.1674-764x.2019.05.003. |
| [59] |
Zhou YK (2018). Comparative study of vegetation phenology extraction methods based on digital images. Progress in Geography, 37, 1031-1044.
DOI |
| [58] |
[赵彦茜, 肖登攀, 柏会子, 陶福禄 (2019). 中国作物物候对气候变化的响应与适应研究进展. 地理科学进展, 38, 224-235.]
DOI |
|
Zhao YX, Xiao DP, Bai HZ, Tao FL (2019). Research progress on the response and adaptation of crop phenology to climate change in China. Progress in Geography, 38, 224-235.
DOI |
|
| [57] | Zhao C, Liu GM, Chen Y, Jiang Y, Shi Y, Zhao LT, Liao PQ, Wang WL, Xu K, Dai QG, Huo ZY (2022). Excessive nitrogen application leads to lower rice yield and grain quality by inhibiting the grain filling of inferior grains. Agriculture, 12, 962. DOI: 10.3390/agriculture12070962. |
| [56] | Zhang RQ, Yang DN, Li SE, Chen JL, Hu D, Guo H, Wang CY, Wang YH, Cong X (2024). Coupling of environmental factors and growth stages in simulation of maize biomass allocation. Plant and Soil, 499, 329-347. |
| [55] | [袁沫汐, 文佐时, 何利杰, 李鑫鑫, 赵林 (2024). 中国温带草地物候对气候变化的响应及其对总初级生产力的贡献. 生态学报, 44, 354-376.] |
| Yuan MX, Wen ZS, He LJ, Li XX, Zhao L (2024). Response of temperate grassland phenology to climate change and its contribution to gross primary productivity in China. Acta Ecologica Sinica, 44, 354-376. | |
| [54] | [于海达, 杨秀春, 徐斌, 金云翔, 高添, 李金亚 (2012). 草原植被长势遥感监测研究进展. 地理科学进展, 31, 885-894.] |
|
Yu HD, Yang XC, Xu B, Jin YX, Gao T, Li JY (2012). The progress of remote sensing monitoring for grassland vegetation growth. Progress in Geography, 31, 885-894.
DOI |
|
| [53] | Yang XR, Chen YY, Zhang TW, Zhang PH, Guo ZP, Hu GR, Zhang H, Sun YG, Huang L, Ma MJ (2023b). Different responses of functional groups to N addition increased synchrony and shortened community reproductive duration in an alpine meadow. Journal of Ecology, 111, 2231-2244. |
| [52] | Yang T, Dong JW, Huang L, Li YZ, Yan HM, Zhai J, Wang J, Jin ZN, Zhang GL (2023a). A large forage gap in forage availability in traditional pastoral regions in China. Fundamental Research, 3, 188-200. |
| [51] | Yang CT, Millner JP, Sun Y, Yuan H, Liu Y, Zhang Y, Wang ZF, Chang SH, Hou FJ (2021). Supplementary feeding yak with oat hay improves nitrogen cycling in an alpine meadow on the Qinghai-Tibet Plateau, China. Agricultural Systems, 193, 103216. DOI: 10.1016/j.agsy.2021.103216. |
| [50] | Yang B, Zhu WX, Rezaei EE, Li J, Sun ZG, Zhang JQ (2022). The optimal phenological phase of maize for yield prediction with high-frequency UAV remote sensing. Remote Sensing, 14, 1559. DOI: 10.3390/rs14071559. |
| [49] |
Yan D, Scott RL, Moore DJP, Biederman JA, Smith WK (2019). Understanding the relationship between vegetation greenness and productivity across dryland ecosystems through the integration of PhenoCam, satellite, and eddy covariance data. Remote Sensing of Environment, 223, 50-62.
DOI |
| [48] | Xue YY, Bai XY, Zhao CW, Tan Q, Li YB, Luo GJ, Wu LH, Chen F, Li CJ, Ran C, Zhang SR, Liu M, Gong SH, Xiong L, Song FJ, et al. (2023). Spring photosynthetic phenology of Chinese vegetation in response to climate change and its impact on net primary productivity. Agricultural and Forest Meteorology, 342, 109734. DOI: 10.1016/j.agrformet.2023.109734. |
| [1] | 陈哲, 汪浩, 王金洲, 石慧瑾, 刘慧颖, 贺金生. 基于物候相机归一化植被指数估算高寒草地植物地上生物量的季节动态[J]. 植物生态学报, 2021, 45(5): 487-495. |
| 阅读次数 | ||||||
|
全文 |
|
|||||
|
摘要 |
|
|||||
Copyright © 2026 版权所有 《植物生态学报》编辑部
地址: 北京香山南辛村20号, 邮编: 100093
Tel.: 010-62836134, 62836138; Fax: 010-82599431; E-mail: apes@ibcas.ac.cn, cjpe@ibcas.ac.cn
备案号: 京ICP备16067583号-19
![]()