
Chin J Plant Ecol ›› 2019, Vol. 43 ›› Issue (9): 774-782.DOI: 10.17521/cjpe.2018.0249
• Research Articles • Previous Articles Next Articles
ZHANG Xue-Jiao1, GAO Xian-Ming2, JI Cheng-Jun1, KANG Mu-Yi3,4, WANG Ren-Qing5, YUE Ming6, ZHANG Feng7, TANG Zhi-Yao1,*( )
)
Received:2018-10-11
Accepted:2019-01-30
Online:2019-09-20
Published:2020-01-03
Contact:
TANG Zhi-Yao
About author: zytang@urban.pku.edu.cnSupported by:ZHANG Xue-Jiao, GAO Xian-Ming, JI Cheng-Jun, KANG Mu-Yi, WANG Ren-Qing, YUE Ming, ZHANG Feng, TANG Zhi-Yao. Response of abundance distribution of five species of Quercus to climate change in northern China[J]. Chin J Plant Ecol, 2019, 43(9): 774-782.
Add to citation manager EndNote|Ris|BibTeX
URL: https://www.plant-ecology.com/EN/10.17521/cjpe.2018.0249
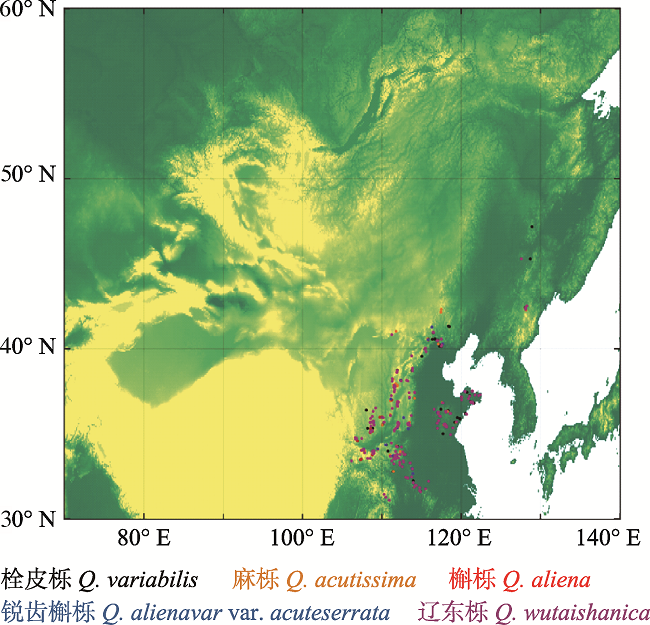
Fig. 1 Plots distribution of five species of Quercus in northern China.
| 物种 Species | 样方数 Plot number | 平均密度 Mean density (Ind.·1000 m-2) | 样方的气温范围 Air temperature range of plots (℃) | 样方的降水范围 Precipitation range of plots (mm) |
|---|---|---|---|---|
| 栓皮栎 Q. variabilis | 304 | 89 ± 101 | 6.8-15.9 | 529-1 431 |
| 麻栎 Q. acutissima | 195 | 39 ± 55 | 4.1-15.8 | 451-1 614 |
| 槲栎 Q. aliena | 188 | 22 ± 43 | 3.6-16.0 | 335-1 775 |
| 锐齿槲栎 Q. aliena | 147 | 37 ± 34 | 1.4-11.6 | 337-1 502 |
| 蒙古栎 Q. mongolica | 492 | 55 ± 68 | 0.1-14.4 | 335-1 006 |
Table 1 Survey statistics of plots of five species in Quercus in the northern China
| 物种 Species | 样方数 Plot number | 平均密度 Mean density (Ind.·1000 m-2) | 样方的气温范围 Air temperature range of plots (℃) | 样方的降水范围 Precipitation range of plots (mm) |
|---|---|---|---|---|
| 栓皮栎 Q. variabilis | 304 | 89 ± 101 | 6.8-15.9 | 529-1 431 |
| 麻栎 Q. acutissima | 195 | 39 ± 55 | 4.1-15.8 | 451-1 614 |
| 槲栎 Q. aliena | 188 | 22 ± 43 | 3.6-16.0 | 335-1 775 |
| 锐齿槲栎 Q. aliena | 147 | 37 ± 34 | 1.4-11.6 | 337-1 502 |
| 蒙古栎 Q. mongolica | 492 | 55 ± 68 | 0.1-14.4 | 335-1 006 |
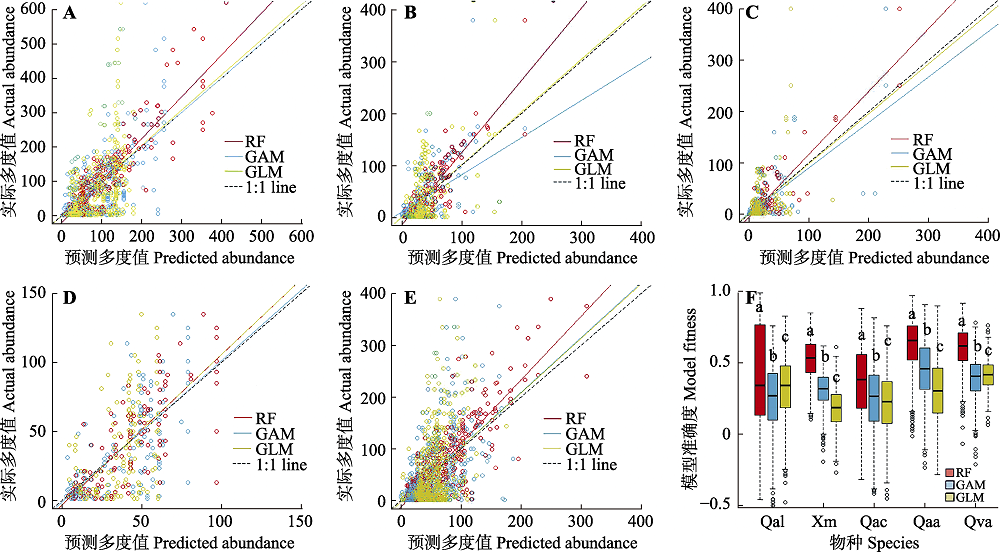
Fig. 2 Relationship between observed and predicted species abundances for five species in Quercus with random forest model (RF), generalized additive model (GAM), generalized linear model (GLM) and comparison of the accuracy of five species based on general linear model and random forest. A, Q. variabilis (Qva). B, Q. acutissima (Qac). C, Q. aliena (Qal). D, Q. aliena var. acuteserrata (Qaa). E, Q. mongolica (Qm). F, Model fitness of the three models, differed lowercase letters indicated significant differences between the models (p < 0.05).
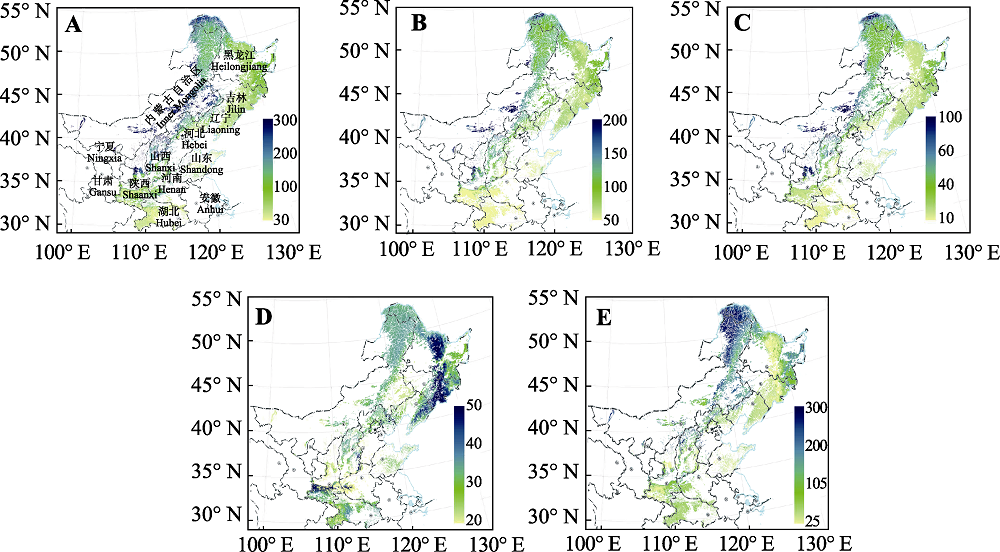
Fig. 3 Species abundance (number·1 000 m-2) distribution maps of the North China for five species produced by random forest model, based on bioclimatic variables at year 1960-1990. A, Quercus variabilis. B, Q. acutissima. C, Q. aliena. D, Q. aliena var. acuteserrata. E, Q. mongolica.
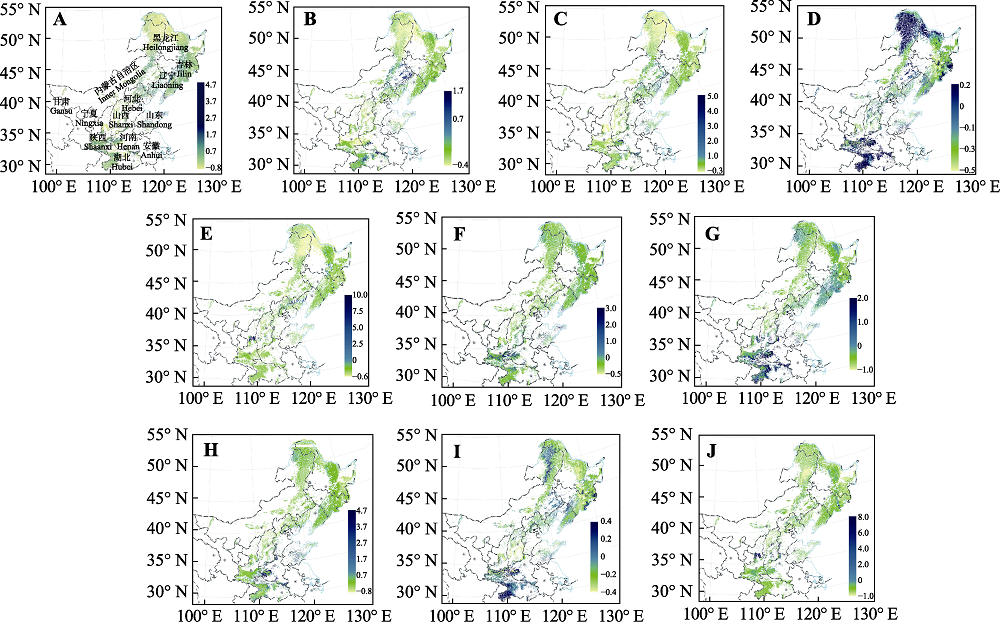
Fig. 4 Future distribution maps of rate of abundance change in the North China for five species produced by random forest model, based on bioclimatic variables under RCP 2.6 dispersal scenario (A-E) and RCP 8.5 dispersal scenario (F-J) in year 2050. A, F, Quercus variabilis. B, G, Q. acutissima. C, H, Q. aliena. D, I, Q. aliena var. acuteserrata. E, J, Q. mongolica.
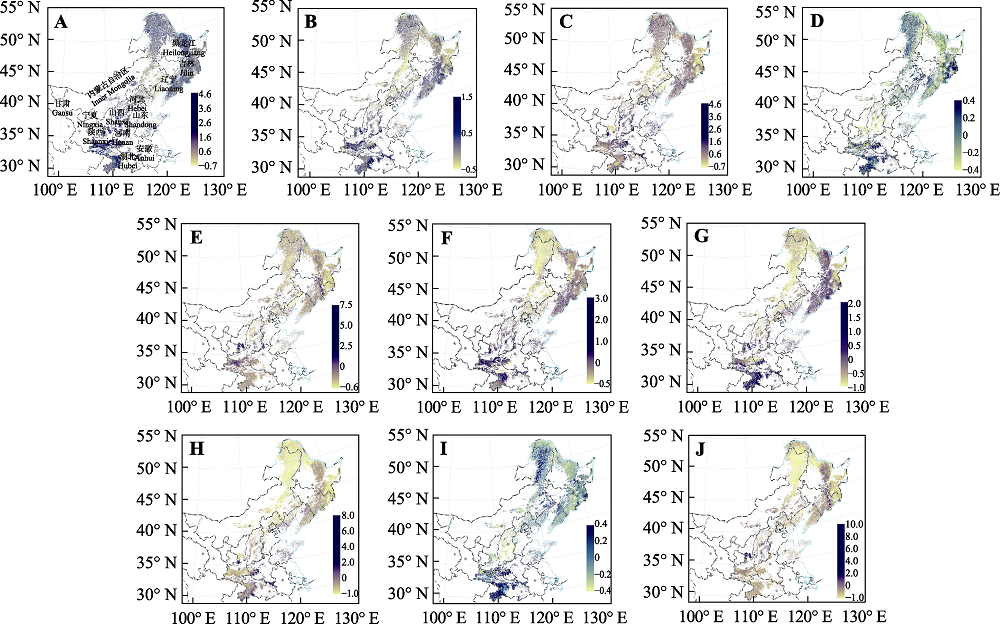
Fig. 5 Future distribution maps of rate of abundance change in the North China for five species produced by Random Forest models, based on bioclimatic variables under RCP 2.6 dispersal scenario (A-E) and RCP 8.5 dispersal scenario (F-J) in year 2070. A, F, Quercus variabilis. B, G, Q. acutissima. C, H, Q. aliena. D, I, Q. aliena var. acuteserrata. E, J, Q. mongolica.
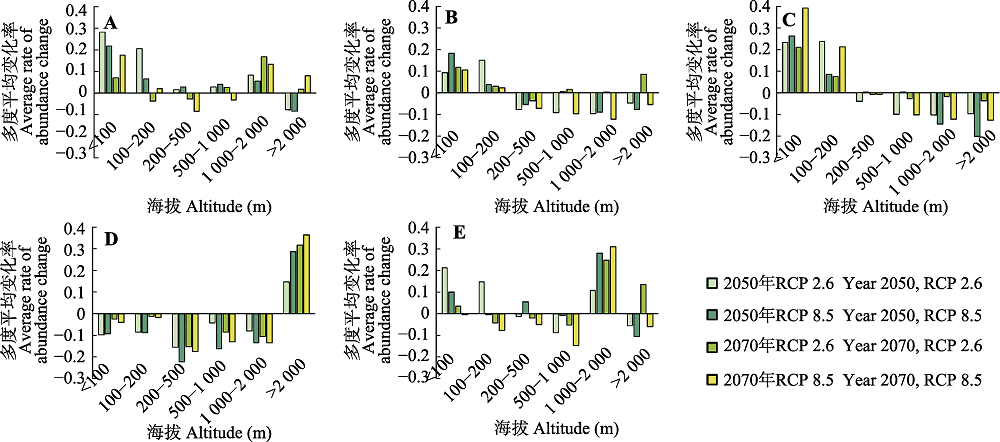
Fig. 6 Elevation distribution of abundance change ratio of different periods under different scenario in North China. A, Quercus variabilis. B, Q. acutissima. C, Q. aliena. D, Q. aliena var. acuteserrata. E, Q. mongolica.
| [1] | Austin MP, Meyers JA ( 1996). Current approaches to modelling the environmental niche of eucalypts: Implication for management of forest biodiversity. Forest Ecology and Management, 85, 95-106. |
| [2] | Bellard C, Bertelsmeier C, Leadley P, Thuiller W, Courchamp F ( 2012). Impacts of climate change on the future of biodiversity. Ecology Letters, 15, 365-377. |
| [3] | Brito C, Crespo EG, Paulo OS ( 1999). Modelling wildlife distributions: Logistic multiple regression vs overlap analysis. Ecography, 22, 251-260. |
| [4] | Cao MC, Zhou GS, Weng ES ( 2005). Application and comparison of generalized models and classification and regression tree in simulating tree species distribution. Acta Ecologica Sinica, 25, 2031-2040. |
| [ 曹铭昌, 周广胜, 翁恩生 ( 2005). 广义模型及分类回归树在物种分布模拟中的应用与比较. 生态学报, 25, 2031-2040.] | |
| [5] | Editorial Board of the Chinese Vegetation Map, Chinese Academy of Sciences ( 2007). Vegetation Map of the People’s Republic of China (1: 1 000 000). Geological Publishing House, Beijing. |
| [ 中国科学院中国植被图编辑委员会 ( 2007). 中华人民共和国植被图(1: 100万). 地质出版社, 北京.] | |
| [6] | Chen IC, Hill JK, Ohlemuller R, Roy DB, Thomas CD ( 2011). Rapid range shifts of species associated with high levels of climate warming. Science, 333, 1024-1026. |
| [7] | Cutler DR, Edwards Jr TC, Beard KH, Cutler A, Hess KT, Gibson J, Lawler JJ ( 2007). Random forests for classification in ecology. Ecology, 88, 2783-2792. |
| [8] | Cutler K, Breiman L ( 2004). Random Forests. Machine Learning, 45, 157-176. |
| [9] | Domonkos P ( 2001). Temporal accumulations of extreme daily mean temperature anomalies. Theoretical and Applied Climatology, 68, 17-32. |
| [10] | Dubuis A, Pottier J, Rion V, Pellissier L, Theurillat JP, Guisan A ( 2011). Predicting spatial patterns of plant species richness: A comparison of direct macroecological and species stacking modelling approaches. Diversity and Distributions, 17, 1122-1131. |
| [11] | Ehrlén J, Morris WF ( 2015). Predicting changes in the distribution and abundance of species under environmental change. Ecology Letters, 18, 303-314. |
| [12] | Franklin J, Franklin JF, Franklin JD ( 2009). Mapping species distributions: Spatial inference and prediction. Quarterly Review of Biology, 36, 818. |
| [13] | Hao ZQ, Dai LM, He HS, Malandnoff DJ, Shao GF ( 2001). Potential response of major tree species to climate warming in Changbai Mountain, Northeast China. Chinese Journal of Applied Ecology, 12, 653-658. |
| [ 郝占庆, 代力民, 贺红士, Malandnoff DJ, 邵国凡 ( 2001). 气候变暖对长白山主要树种的潜在影响. 应用生态学报, 12, 653-658.] | |
| [14] | Hastie T, Tibshirani R ( 1986). Generalized additive models. Statistical Science, 1, 297-310. |
| [15] | Hijmans RJ, Cameron SE, Parra JL, Jones PG, Jarvis A ( 2005). Very high resolution interpolated climate surfaces for global land areas. International Journal of Climatology, 25, 1965-1978. |
| [16] | Iverson LR, Prasad AM, Matthews SN, Peters M ( 2008). Estimating potential habitat for 134 eastern US tree species under six climate scenarios. Forest Ecology and Management, 254, 390-406. |
| [17] | Kaspari M ( 2001). Taxonomic level, trophic biology and the regulation of local abundance. Global Ecology and Biogeography, 10, 229-244. |
| [18] | Kearney M, Porter WP ( 2004). Mapping the fundamental niche: Physiology, climate, and the distribution of a nocturnal lizard. Ecology, 85, 3119-3131. |
| [19] | Kharin VV, Zwiers FW, Zhang X, Wehner M ( 2013). Changes in temperature and precipitation extremes in the CMIP5 ensemble. Climatic Change, 119, 345-357. |
| [20] | Li GQ, Liu CC, Liu YG, Yang J, Zhang XS, Guo K ( 2013). Advances in theoretical issues of species distribution models. Acta Ecologica Sinica, 33, 4827-4835. |
| [ 李国庆, 刘长成, 刘玉国, 杨军, 张新时, 郭柯 ( 2013). 物种分布模型的理论进展. 生态学报, 33, 4827-4835.] | |
| [21] | Loehle C, LeBlanc D ( 1996). Model-based assessments of climate change effects on forests—A critical review. Ecological Modelling, 90, 1-31. |
| [22] | Nelder JA, Wedderburn RWM ( 1972). Generalized linear models. Journal of the Royal Statistical Society A, 135, 370-384. |
| [23] | Parmesan C ( 2006). Ecological and evolutionary responses to recent climate change. Annual Review of Ecology, Evolution, and Systematics, 37, 637-669. |
| [24] | Peng YS, Chen L, Li JQ ( 2007). Study on numerical taxonomy of Quercus L.( Fagaceae) in China. Journal of Wuhan Botanical Research, 25, 149-157. |
| [ 彭焱松, 陈丽, 李建强 ( 2007). 中国栎属植物的数量分类研究. 武汉植物学研究, 25, 149-157.] | |
| [25] | Picard R, Cook RD ( 1984). Cross-validation of regression models. Journal of the American Statistical Association, 79, 575-583. |
| [26] | Riahi K, Rao S, Krey V, Cho C, Chirkov V, Fischer G, Kindermann G, Nakicenovic N, Rafaj P ( 2011). RCP 8.5—A scenario of comparatively high greenhouse gas emissions. Climatic Change, 109, 33-57. |
| [27] | Rong YS, Tu QP ( 2001). Characteristics of evolution of potential evaporation in Tianjin region of China. Journal of Hydrodynamics, 16(3), 16-21. |
| [28] | Sainani KL ( 2013). Multivariate regression: The pitfalls of automated variable selection. PM&R, 5, 791-794. |
| [29] | Spano D, Cesaraccio C, Duce P, Snyder RL ( 1999). Phenological stages of natural species and their use as climate indicators. International Journal of Biometeorology, 42, 124-133. |
| [30] | Stockwell D, Peters D ( 1999). The GARP modelling system: Problems and solutions to automated spatial prediction. International Journal of Geographical Information Science, 13, 143-158. |
| [31] | Sturm M, Racine C, Tape K ( 2001). Increasing shrub abundance in the Arctic. Nature, 411, 546-547. |
| [32] | Syphard AD, Franklin J ( 2009). Differences in spatial predictions among species distribution modeling methods vary with species traits and environmental predictors. Ecography, 32, 907-918. |
| [33] | Tessarolo G, Rangel TF, Araújo MB, Hortal J ( 2014). Uncertainty associated with survey design in species distribution models. Diversity and Distributions, 20, 1258-1269. |
| [34] | Thuiller W ( 2003). Biomod—Optimizing predictions of species distributions and projecting potential future shifts under global change. Global Change Biology, 9, 1353-1362. |
| [35] | Thuiller W, Araújo MB, Lavorel S ( 2003). Generalized models vs. classification tree analysis: Predicting spatial distributions of plant species at different scales. Journal of Vegetation Science, 14, 669-680. |
| [36] | van Vuuren DP, Stehfest E, den Elzen MGJ, Kram T, van Vliet J, Deetman S, Isaac M, Klein Goldewijk K, Hof A, Mendoza Beltran A, Oostenrijk R, van Ruijven B ( 2011). RCP2.6: Exploring the possibility to keep global mean temperature increase below 2 °C. Climatic Change, 109, 95-116. |
| [37] | Wang A, Goslee SC, Miller DA, Sanderson MA, Gonet JM ( 2017). Topographic variables improve climatic models of forage species abundance in the northeastern United States. Applied Vegetation Science, 20, 84-93. |
| [38] | Wang ZW, Ye JL, Yao TD ( 1998). Construction of mean annual temperature series for the last one hundred years in China. Quarterly Journal of Applied Meteorology, 9, 392-401. |
| [ 王昭武, 叶瑾琳, 姚檀栋 ( 1998). 近百年中国年气温序列的建立. 应用气象学报, 9, 392-401.] | |
| [39] | Xu CH, Xu Y ( 2012). The projection of temperature and precipitation over China under RCP scenarios using a CMIP5 Multi-Model ensemble. Atmospheric & Oceanic Science Letters, 5, 527-533. |
| [40] | Yan YJ, Li Y, Wang WJ, He JS, Yang RH, Wu HJ, Wang XL, Jiao L, Tang ZY, Yao YJ ( 2017). Range shifts in response to climate change of Ophiocordyceps sinensis, a fungus endemic to the Tibetan Plateau. Biological Conservation, 206, 143-150. |
| [41] | Young M, Carr MH ( 2015). Application of species distribution models to explain and predict the distribution, abundance and assemblage structure of nearshore temperate reef fishes. Diversity and Distributions, 21, 1428-1440. |
| [42] | Zhou GS, Zhang XS ( 1996). Study on Chinese climate-vegetation relationship. Acta Phytoecologica Sinica, 20, 113-119. |
| [ 周广胜, 张新时 ( 1996). 中国气候-植被关系初探. 植物生态学报, 20, 113-119.] | |
| [43] | Zhou ZK ( 1992). Origin, phylogeny and dispersal of Quercus from China. Acta Botanica Yunnanica, 14, 227-236. |
| [ 周浙昆 ( 1992). 中国栎属的起源演化及其扩散. 云南植物研究, 14, 227-236.] |
| [1] | WU Ru-Ru, LIU Mei-Zhen, GU Xian, CHANG Xin-Yue, GUO Li-Yue, JIANG Gao-Ming, QI Ru-Yi. Prediction of suitable habitat distribution and potential impact of climate change on distribution patterns of Cupressus gigantea [J]. Chin J Plant Ecol, 2024, 48(4): 445-458. |
| [2] | LIU Chao, LI Ping, WU Yun-Tao, PAN Sheng-Nan, JIA Zhou, LIU Ling-Li. Estimation of grassland aboveground biomass using digital photograph and canopy structure measurements [J]. Chin J Plant Ecol, 2022, 46(10): 1280-1288. |
| [3] | ZHANG Wen-Qiang, LUO Ge-Ping, ZHENG Hong-Wei, WANG Hao, HAMDI Rafiq, HE Hui-Li, CAI Peng, CHEN Chun-Bo. Analysis of vegetation index changes and driving forces in inland arid areas based on random forest model: a case study of the middle part of northern slope of the north Tianshan Mountains [J]. Chin J Plant Ecol, 2020, 44(11): 1113-1126. |
| [4] | LIU Xiao-Tong, YUAN Quan, NI Jian. Research advances in modelling plant species distribution in China [J]. Chin J Plant Ecol, 2019, 43(4): 273-283. |
| [5] | JIN Jia-Xin,JIANG Hong,PENG Wei,ZHANG Lin-Jing,LU Xue-He,XU Jian-Hui,ZHANG Xiu-Ying,WANG Ying. Evaluating the impact of soil factors on the potential distribution of Phyllostachys edulis (bamboo) in China based on the species distribution model [J]. Chin J Plant Ecol, 2013, 37(7): 631-640. |
| [6] | ZHU Yuan, KANG Mu-Yi, JIANG Yuan, LIU Quan-Ru. ALTITUDINAL PATTERN OF SPECIES DIVERSITY IN WOODY PLANT COMMUNITIES OF MOUNTAIN HELAN, NORTHWESTERN CHINA [J]. Chin J Plant Ecol, 2008, 32(3): 574-581. |
| Viewed | ||||||
|
Full text |
|
|||||
|
Abstract |
|
|||||
Copyright © 2026 Chinese Journal of Plant Ecology
Tel: 010-62836134, 62836138, E-mail: apes@ibcas.ac.cn, cjpe@ibcas.ac.cn
![]()