
Chin J Plant Ecol ›› 2008, Vol. 32 ›› Issue (6): 1312-1322.DOI: 10.3773/j.issn.1005-264x.2008.06.012 cstr: 32100.14.j.issn.1005-264x.2008.06.012
• Original article • Previous Articles Next Articles
ZHANG Feng, ZHOU Guang-Sheng( ), WANG Yu-Hui
Received:2008-03-10
Accepted:2008-04-24
Online:2008-03-10
Published:2008-11-30
Contact:
ZHOU Guang-Sheng
ZHANG Feng, ZHOU Guang-Sheng, WANG Yu-Hui. PHENOLOGICAL CALENDAR OF STIPA KRYLOVII STEPPE IN INNER MONGOLIA, CHINA AND ITS CORRELATION WITH CLIMATIC VARIABLES[J]. Chin J Plant Ecol, 2008, 32(6): 1312-1322.
| 平均气温 Mean air temperature | 平均最高气温 Mean maximum air temperature | 平均最低气温 Mean minimum air temperature | 降水量 Precipitation | |||||
|---|---|---|---|---|---|---|---|---|
| 斜率 Intercept | R2 | 斜率 Intercept | R2 | 斜率 Intercept | R2 | 斜率 Intercept | R2 | |
| 年际水平 Annual | 0.115 | 0.466** | 0.117 | 0.411** | 0.113 | 0.472** | -3.988 | 0.071 |
| 生长季 Seasonal | 0.120 | 0.504*** | 0.117 | 0.416** | 0.122 | 0.555*** | -3.414 | 0.055 |
| 非生长季 Non-seasonal | 0.114 | 0.174 | 0.121 | 0.157 | 0.106 | 0.178 | -0.575 | 0.081 |
| 春Spring | 0.160 | 0.434** | 0.156 | 0.366** | 0.164 | 0.468** | 0.621 | 0.019 |
| 夏Summer | 0.118 | 0.279* | 0.117 | 0.187 | 0.119 | 0.395** | -2.393 | 0.031 |
| 秋Autumm | 0.042 | 0.026 | 0.046 | 0.030 | 0.038 | 0.019 | -2.104 | 0.290* |
| 冬Winter | 0.146 | 0.178 | 0.158 | 0.164 | 0.135 | 0.178 | -0.036 | 0.035 |
Table 1 The trends of mean air temperature, mean maximum air temperature, mean minimum air temperature and precipitation from 1985 to 2002 in Inner Mongolian Stipa krylovii steppe
| 平均气温 Mean air temperature | 平均最高气温 Mean maximum air temperature | 平均最低气温 Mean minimum air temperature | 降水量 Precipitation | |||||
|---|---|---|---|---|---|---|---|---|
| 斜率 Intercept | R2 | 斜率 Intercept | R2 | 斜率 Intercept | R2 | 斜率 Intercept | R2 | |
| 年际水平 Annual | 0.115 | 0.466** | 0.117 | 0.411** | 0.113 | 0.472** | -3.988 | 0.071 |
| 生长季 Seasonal | 0.120 | 0.504*** | 0.117 | 0.416** | 0.122 | 0.555*** | -3.414 | 0.055 |
| 非生长季 Non-seasonal | 0.114 | 0.174 | 0.121 | 0.157 | 0.106 | 0.178 | -0.575 | 0.081 |
| 春Spring | 0.160 | 0.434** | 0.156 | 0.366** | 0.164 | 0.468** | 0.621 | 0.019 |
| 夏Summer | 0.118 | 0.279* | 0.117 | 0.187 | 0.119 | 0.395** | -2.393 | 0.031 |
| 秋Autumm | 0.042 | 0.026 | 0.046 | 0.030 | 0.038 | 0.019 | -2.104 | 0.290* |
| 冬Winter | 0.146 | 0.178 | 0.158 | 0.164 | 0.135 | 0.178 | -0.036 | 0.035 |
| 1月 | 2月 | 3月 | 4月 | 5月 | 6月 | 7月 | 8月 | 9月 | 10月 | 11月 | 12月 | |
|---|---|---|---|---|---|---|---|---|---|---|---|---|
| Jan. | Feb. | Mar. | Apr. | May | Jun. | Jul. | Aug. | Sept. | Oct. | Nov. | Dec. | |
| 月均温 Monthly mean temperature (℃) | ||||||||||||
| 平均值Mean | -17.6 | -13.0 | -4.7 | 5.9 | 13.5 | 19.1 | 21.7 | 20.1 | 13.5 | 4.6 | -6.3 | -14.6 |
| 标准误差SD | 2.5 | 3.1 | 2.8 | 1.8 | 1.1 | 1.4 | 1.6 | 1.3 | 1.4 | 1.8 | 2.7 | 2.3 |
| 变化趋势Trend | +0.9 | +2.8 | +2.9 | +1.1 | +0.7 | +1.0 | +1.8 | +0.8 | +1.8 | -0.9 | +0.4 | +0.6 |
| p | - | <0.05 | <0.05 | - | - | - | <0.01 | - | <0.01 | - | - | - |
| 月均最低温 Monthly mean minimum air temperature (℃) | ||||||||||||
| 平均值Mean | -23.2 | -19.5 | -11.4 | -1.4 | 6.1 | 12.3 | 15.9 | 13.9 | 6.6 | -2.1 | -12.3 | -20.0 |
| 标准误差SD | 2.2 | 2.9 | 2.7 | 1.6 | 1.2 | 1.4 | 1.3 | 1.1 | 1.6 | 1.6 | 2.5 | 2.2 |
| 变化趋势Trend | +0.1 | +0.3 | +0.3 | +0.1 | +0.1 | +0.1 | +0.2 | 0.0 | +0.1 | -0.1 | 0.0 | 0.0 |
| p | - | <.05 | <.05 | - | <.05 | <.05 | <.001 | - | <.05 | - | - | - |
| 月均最高温 Monthly mean maximum air temperature (℃) | ||||||||||||
| 平均值Mean | -12.1 | -6.6 | 2.0 | 13.3 | 20.9 | 25.8 | 27.5 | 26.4 | 20.5 | 11.4 | -0.3 | -9.2 |
| 标准误差SD | 2.8 | 3.5 | 2.9 | 2.1 | 1.2 | 1.5 | 2.0 | 1.9 | 1.5 | 2.1 | 3.0 | 2.5 |
| 变化趋势Trend | +0.1 | +0.3 | +0.3 | +0.1 | 0.0 | +0.1 | +0.2 | +0.1 | +0.2 | -0.1 | 0.0 | +0.1 |
| p | - | <.05 | <.05 | - | - | - | <.05 | - | <.001 | - | - | - |
| 月降水量 Monthly precipitation (mm) | ||||||||||||
| 平均值Mean | 2.4 | 2.4 | 5.8 | 5.9 | 24.5 | 46.8 | 88.0 | 59.3 | 21.3 | 9.9 | 6.4 | 3.3 |
| 标准误差SD | 1.8 | 2.1 | 5.2 | 5.0 | 22.1 | 23.5 | 43.5 | 41.1 | 17.9 | 10.2 | 6.5 | 2.0 |
| 变化趋势Trend | 0.0 | -0.2 | -0.2 | 0.05 | 0.8 | 0.9 | -1.3 | -2.0 | -1.8 | -0.1 | -0.2 | 0.05 |
| p | - | - | - | - | - | - | - | - | <0.05 | - | - | - |
Table 2 Monthly mean air temperature, monthly mean minimum air temperature, monthly mean maximum air temperature and monthly precipitation in Inner Mongolian Stipa krylovii steppe, as well as trends per decade during 1995 to 2002
| 1月 | 2月 | 3月 | 4月 | 5月 | 6月 | 7月 | 8月 | 9月 | 10月 | 11月 | 12月 | |
|---|---|---|---|---|---|---|---|---|---|---|---|---|
| Jan. | Feb. | Mar. | Apr. | May | Jun. | Jul. | Aug. | Sept. | Oct. | Nov. | Dec. | |
| 月均温 Monthly mean temperature (℃) | ||||||||||||
| 平均值Mean | -17.6 | -13.0 | -4.7 | 5.9 | 13.5 | 19.1 | 21.7 | 20.1 | 13.5 | 4.6 | -6.3 | -14.6 |
| 标准误差SD | 2.5 | 3.1 | 2.8 | 1.8 | 1.1 | 1.4 | 1.6 | 1.3 | 1.4 | 1.8 | 2.7 | 2.3 |
| 变化趋势Trend | +0.9 | +2.8 | +2.9 | +1.1 | +0.7 | +1.0 | +1.8 | +0.8 | +1.8 | -0.9 | +0.4 | +0.6 |
| p | - | <0.05 | <0.05 | - | - | - | <0.01 | - | <0.01 | - | - | - |
| 月均最低温 Monthly mean minimum air temperature (℃) | ||||||||||||
| 平均值Mean | -23.2 | -19.5 | -11.4 | -1.4 | 6.1 | 12.3 | 15.9 | 13.9 | 6.6 | -2.1 | -12.3 | -20.0 |
| 标准误差SD | 2.2 | 2.9 | 2.7 | 1.6 | 1.2 | 1.4 | 1.3 | 1.1 | 1.6 | 1.6 | 2.5 | 2.2 |
| 变化趋势Trend | +0.1 | +0.3 | +0.3 | +0.1 | +0.1 | +0.1 | +0.2 | 0.0 | +0.1 | -0.1 | 0.0 | 0.0 |
| p | - | <.05 | <.05 | - | <.05 | <.05 | <.001 | - | <.05 | - | - | - |
| 月均最高温 Monthly mean maximum air temperature (℃) | ||||||||||||
| 平均值Mean | -12.1 | -6.6 | 2.0 | 13.3 | 20.9 | 25.8 | 27.5 | 26.4 | 20.5 | 11.4 | -0.3 | -9.2 |
| 标准误差SD | 2.8 | 3.5 | 2.9 | 2.1 | 1.2 | 1.5 | 2.0 | 1.9 | 1.5 | 2.1 | 3.0 | 2.5 |
| 变化趋势Trend | +0.1 | +0.3 | +0.3 | +0.1 | 0.0 | +0.1 | +0.2 | +0.1 | +0.2 | -0.1 | 0.0 | +0.1 |
| p | - | <.05 | <.05 | - | - | - | <.05 | - | <.001 | - | - | - |
| 月降水量 Monthly precipitation (mm) | ||||||||||||
| 平均值Mean | 2.4 | 2.4 | 5.8 | 5.9 | 24.5 | 46.8 | 88.0 | 59.3 | 21.3 | 9.9 | 6.4 | 3.3 |
| 标准误差SD | 1.8 | 2.1 | 5.2 | 5.0 | 22.1 | 23.5 | 43.5 | 41.1 | 17.9 | 10.2 | 6.5 | 2.0 |
| 变化趋势Trend | 0.0 | -0.2 | -0.2 | 0.05 | 0.8 | 0.9 | -1.3 | -2.0 | -1.8 | -0.1 | -0.2 | 0.05 |
| p | - | - | - | - | - | - | - | - | <0.05 | - | - | - |
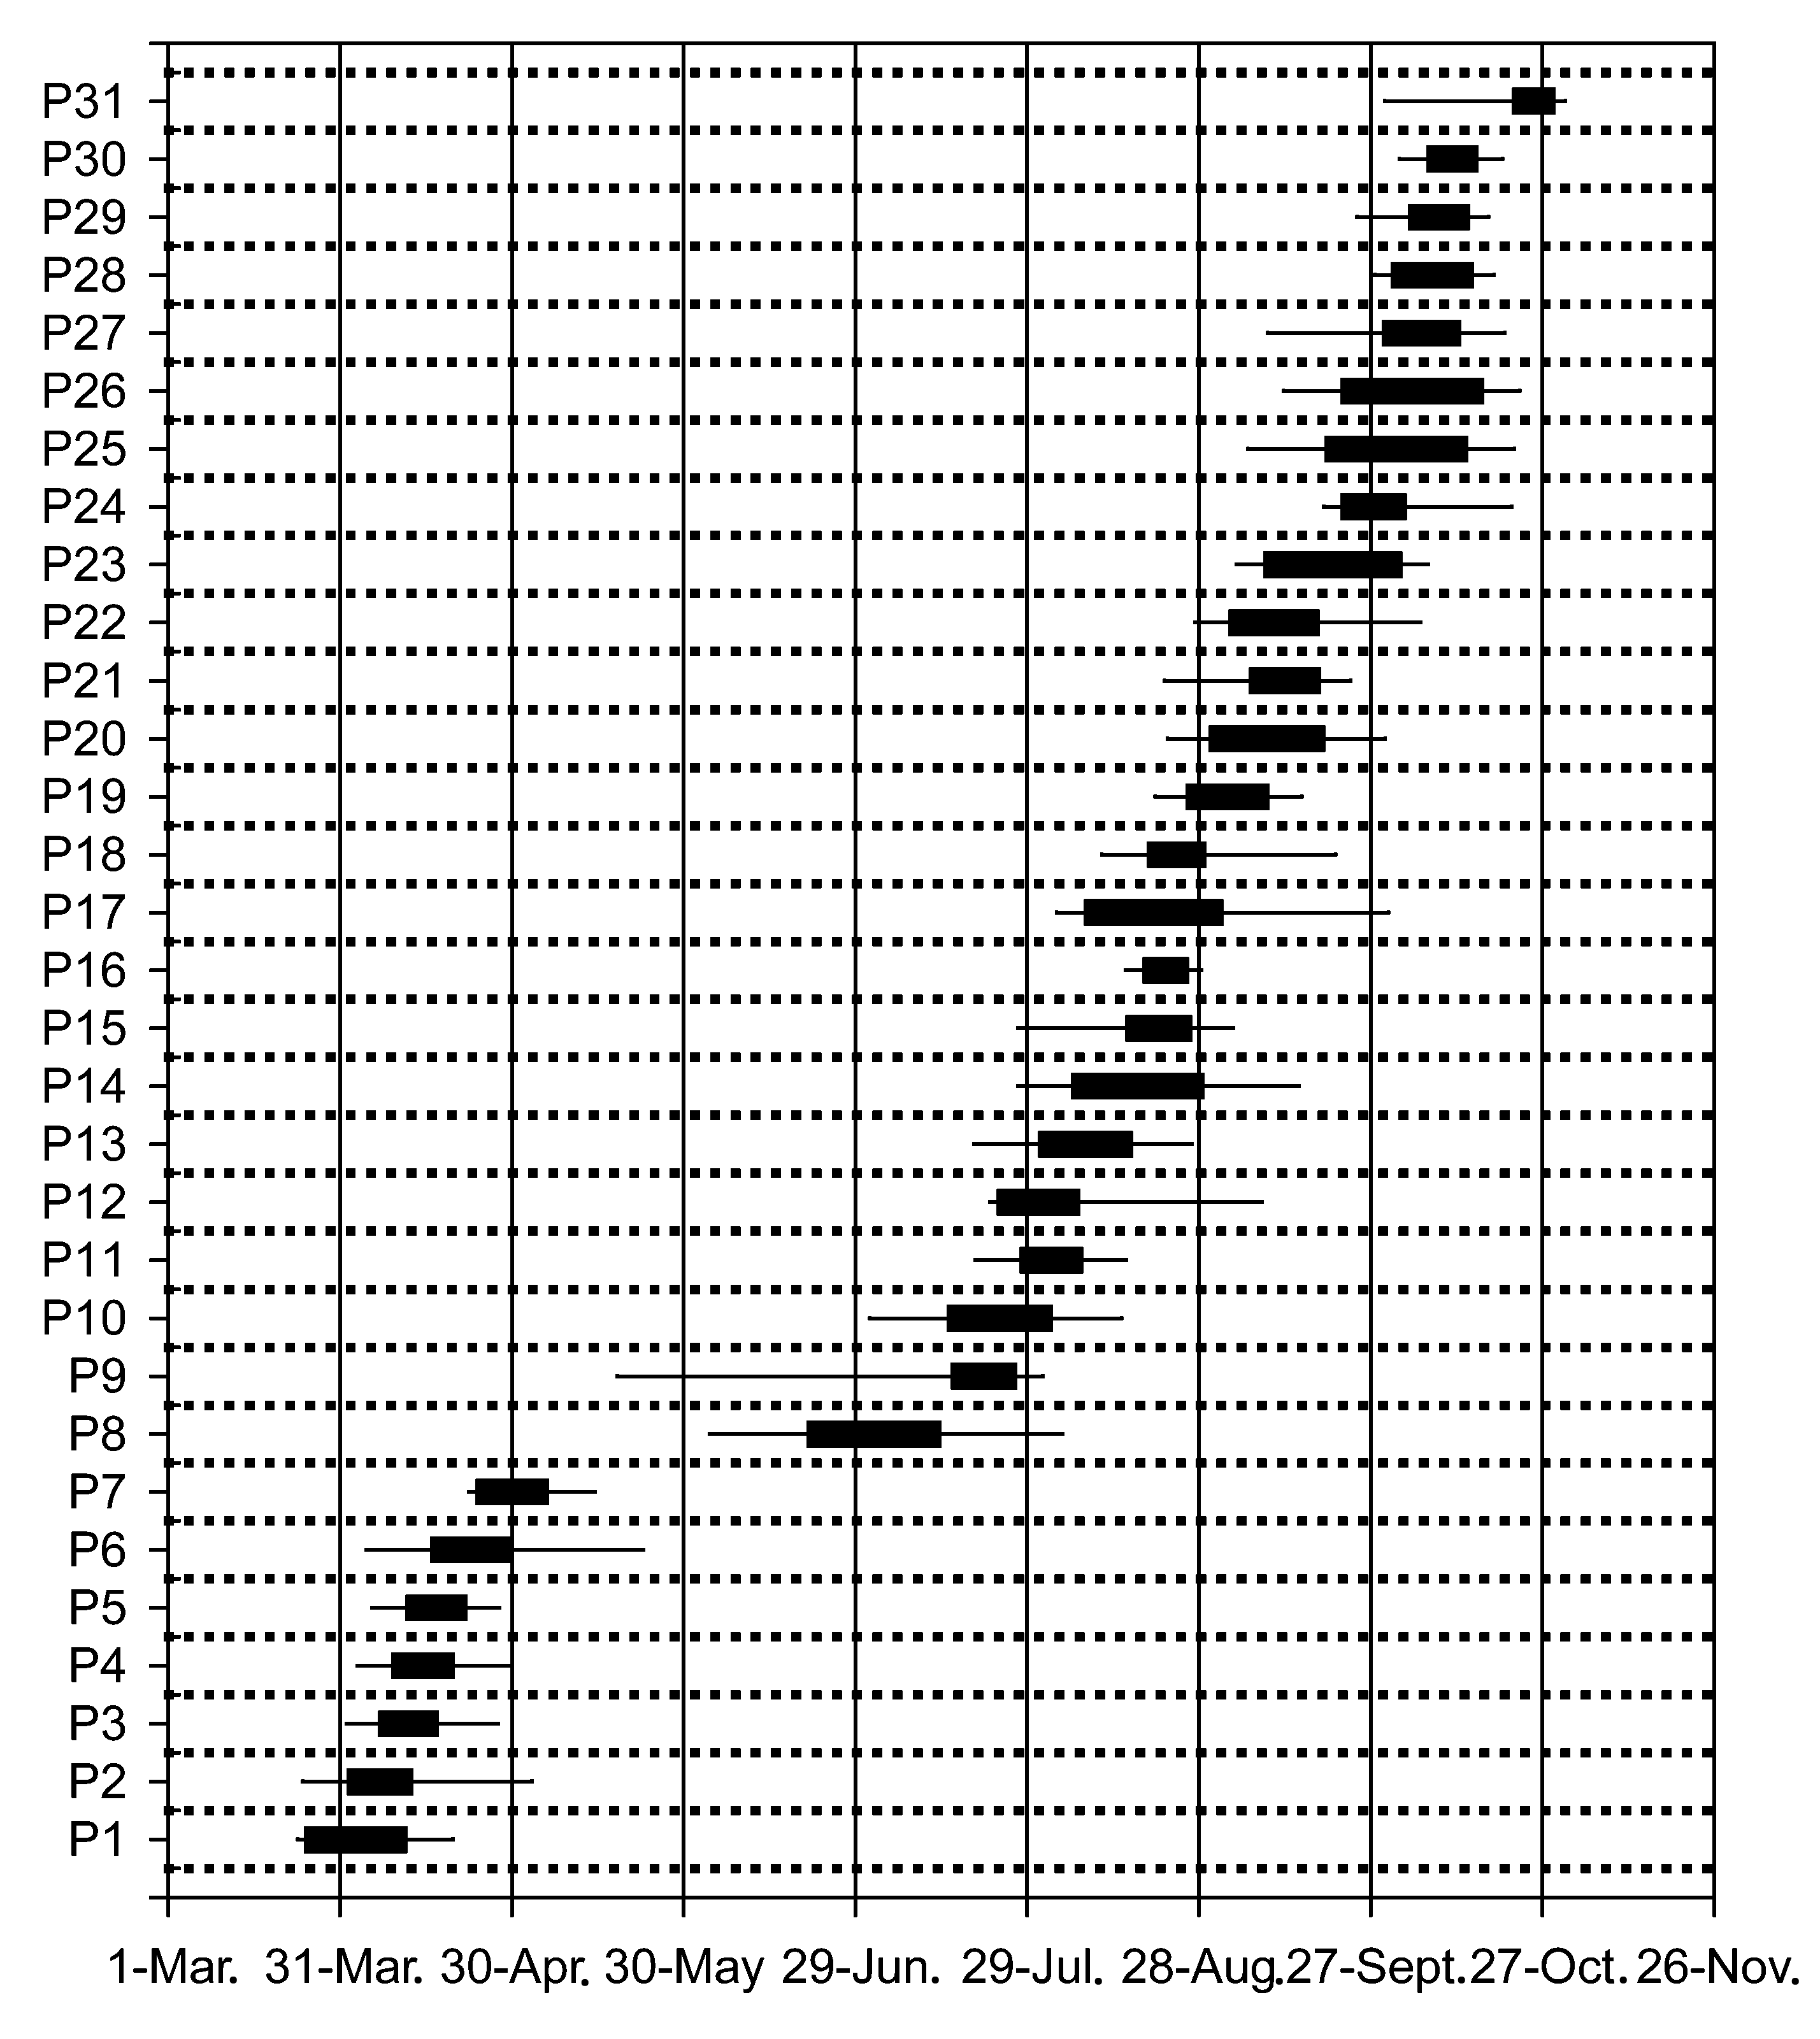
Fig. 1 Phenological time series and variability of data in quartiles for 1985-2002 in Inner Mongolian Stipa krylovii steppe
| 物候期 Phenophase | 平均日期Average date (Julian day) | 温度 T(℃) | 最早日期 Min. date | 最晚日期 Max. date | 变幅 Extent | 标准偏差 SD |
|---|---|---|---|---|---|---|
| P1 | 2-Apr. (93) | 2.8 | 1990-21-Mar. (81) | 2001-26-Apr. (117) | 36 | 10.4 |
| P2 | 7-Apr. (99) | 3.3 | 1997-23-Mar. (83) | 2000-12-May (133) | 50 | 12.6 |
| P3 | 12-Apr. (103) | 4.8 | 1990-28-Mar. (88) | 2002-3-May (124) | 36 | 8.6 |
| P4 | 14-Apr. (106) | 7.3 | 1990-24-Mar. (84) | 2002-11-May (132) | 48 | 10.2 |
| P5 | 16-Apr. (108) | 7.7 | 1990-1-Apr. (92) | 2002-5-May (126) | 34 | 7.9 |
| P6 | 24-Apr. (115) | 6.6 | 1990-3-Apr. (94) | 1989-21-Jun. (173) | 79 | 18.3 |
| P7 | 29-Apr. (121) | 10.5 | 1990-17-Apr. (108) | 1989-28-May. (149) | 41 | 9.7 |
| P8 | 1-Jul. (183) | 20.6 | 2001-2-Jun. (154) | 1994-5-Aug. (218) | 64 | 18.8 |
| P9 | 12-Jul. (194) | 21.4 | 1996-15-Apr. (106) | 1997-1-Aug. (214) | 108 | 27.5 |
| P10 | 23-Jul. (205) | 21.9 | 1993-30-Jun. (182) | 1995-15-Aug. (228) | 46 | 13.6 |
| P11 | 2-Aug. (215) | 21.7 | 1986-19-Jul. (201) | 2000-28-Aug. (241) | 40 | 9.7 |
| P12 | 3-Aug. (216) | 23.0 | 1993-21-Jul. (203) | 1985-15-Sept. (259) | 56 | 16.2 |
| P13 | 6-Aug. (220) | 20.2 | 2002-9-Jul. (191) | 1985-6-Sept. (250) | 59 | 13.5 |
| P14 | 16-Aug. (229) | 19.7 | 2002-21-Jul. (203) | 1987-14-Sept. (258) | 55 | 15.8 |
| P15 | 18-Aug. (231) | 18.8 | 1993-23-Jul. (205) | 1995/1996-2-Sept. (246) | 41 | 12.1 |
| P16 | 20-Aug. (234) | 19.4 | 1992-13-Aug. (226) | 1987-29-Aug. (242) | 16 | 4.4 |
| P17 | 23-Aug. (236) | 19.0 | 1990-1-Aug. (214) | 1987-30-Sept. (274) | 60 | 19.4 |
| P18 | 24-Aug. (237) | 19.1 | 2002-1-Aug. (214) | 1989-29-Sept. (273) | 59 | 13.3 |
| P19 | 31-Aug. (244) | 18.9 | 1992-19-Aug. (232) | 1985-15-Sept. (259) | 27 | 9.0 |
| P20 | 6-Sept. (250) | 16.6 | 2002-15-Aug. (228) | 1987-29-Sept. (273) | 45 | 13.2 |
| P21 | 9-Sept. (253) | 14.3 | 1986-17-Aug. (230) | 1996-26-Sept. (270) | 40 | 10.2 |
| P22 | 11-Sept. (255) | 14.5 | 1998-26-Aug. (239) | 1989-5-Oct. (279) | 40 | 13.0 |
| P23 | 19-Sept. (263) | 10.8 | 2002-30-Aug. (243) | 2000-24-Oct. (298) | 55 | 13.9 |
| P24 | 28-Sept. (273) | 10.8 | 1998-17-Sept. (261) | 1993-29-Oct. (303) | 42 | 10.9 |
| P25 | 29-Sept. (274) | 9.2 | 2002-4-Sept. (248) | 2000-22-Oct. (296) | 48 | 15.9 |
| P26 | 3-Oct. (277) | 8.9 | 2001-6-Sept. (250) | 2000-22-Oct. (296) | 46 | 14.7 |
| P27 | 4-Oct. (278) | 7.9 | 1991-8-Sept. (252) | 2000-23-Oct. (297) | 45 | 12.5 |
| P28 | 6-Oct. (280) | 8.0 | 1992-26-Sept. (270) | 1996-21-Oct. (295) | 25 | 7.5 |
| P29 | 7-Oct. (281) | 7.6 | 1994-23-Sept. (267) | 1998-17-Oct. (291) | 24 | 7.4 |
| P30 | 11-Oct. (285) | 7.1 | 1994-1-Oct. (275) | 1987-19-Oct. (293) | 18 | 5.8 |
| P31 | 22-Oct. (296) | 3.3 | 2001-24-Sept. (268) | 1997/1998-30-Oct. (304) | 36 | 10.2 |
Table 3 Phenological time series: average event dates, daily temperature, extreme phenophases, event data, variable amplitude and standard deviation in Inner Mongolian Stipa krylovii steppe from 1985 to 2002
| 物候期 Phenophase | 平均日期Average date (Julian day) | 温度 T(℃) | 最早日期 Min. date | 最晚日期 Max. date | 变幅 Extent | 标准偏差 SD |
|---|---|---|---|---|---|---|
| P1 | 2-Apr. (93) | 2.8 | 1990-21-Mar. (81) | 2001-26-Apr. (117) | 36 | 10.4 |
| P2 | 7-Apr. (99) | 3.3 | 1997-23-Mar. (83) | 2000-12-May (133) | 50 | 12.6 |
| P3 | 12-Apr. (103) | 4.8 | 1990-28-Mar. (88) | 2002-3-May (124) | 36 | 8.6 |
| P4 | 14-Apr. (106) | 7.3 | 1990-24-Mar. (84) | 2002-11-May (132) | 48 | 10.2 |
| P5 | 16-Apr. (108) | 7.7 | 1990-1-Apr. (92) | 2002-5-May (126) | 34 | 7.9 |
| P6 | 24-Apr. (115) | 6.6 | 1990-3-Apr. (94) | 1989-21-Jun. (173) | 79 | 18.3 |
| P7 | 29-Apr. (121) | 10.5 | 1990-17-Apr. (108) | 1989-28-May. (149) | 41 | 9.7 |
| P8 | 1-Jul. (183) | 20.6 | 2001-2-Jun. (154) | 1994-5-Aug. (218) | 64 | 18.8 |
| P9 | 12-Jul. (194) | 21.4 | 1996-15-Apr. (106) | 1997-1-Aug. (214) | 108 | 27.5 |
| P10 | 23-Jul. (205) | 21.9 | 1993-30-Jun. (182) | 1995-15-Aug. (228) | 46 | 13.6 |
| P11 | 2-Aug. (215) | 21.7 | 1986-19-Jul. (201) | 2000-28-Aug. (241) | 40 | 9.7 |
| P12 | 3-Aug. (216) | 23.0 | 1993-21-Jul. (203) | 1985-15-Sept. (259) | 56 | 16.2 |
| P13 | 6-Aug. (220) | 20.2 | 2002-9-Jul. (191) | 1985-6-Sept. (250) | 59 | 13.5 |
| P14 | 16-Aug. (229) | 19.7 | 2002-21-Jul. (203) | 1987-14-Sept. (258) | 55 | 15.8 |
| P15 | 18-Aug. (231) | 18.8 | 1993-23-Jul. (205) | 1995/1996-2-Sept. (246) | 41 | 12.1 |
| P16 | 20-Aug. (234) | 19.4 | 1992-13-Aug. (226) | 1987-29-Aug. (242) | 16 | 4.4 |
| P17 | 23-Aug. (236) | 19.0 | 1990-1-Aug. (214) | 1987-30-Sept. (274) | 60 | 19.4 |
| P18 | 24-Aug. (237) | 19.1 | 2002-1-Aug. (214) | 1989-29-Sept. (273) | 59 | 13.3 |
| P19 | 31-Aug. (244) | 18.9 | 1992-19-Aug. (232) | 1985-15-Sept. (259) | 27 | 9.0 |
| P20 | 6-Sept. (250) | 16.6 | 2002-15-Aug. (228) | 1987-29-Sept. (273) | 45 | 13.2 |
| P21 | 9-Sept. (253) | 14.3 | 1986-17-Aug. (230) | 1996-26-Sept. (270) | 40 | 10.2 |
| P22 | 11-Sept. (255) | 14.5 | 1998-26-Aug. (239) | 1989-5-Oct. (279) | 40 | 13.0 |
| P23 | 19-Sept. (263) | 10.8 | 2002-30-Aug. (243) | 2000-24-Oct. (298) | 55 | 13.9 |
| P24 | 28-Sept. (273) | 10.8 | 1998-17-Sept. (261) | 1993-29-Oct. (303) | 42 | 10.9 |
| P25 | 29-Sept. (274) | 9.2 | 2002-4-Sept. (248) | 2000-22-Oct. (296) | 48 | 15.9 |
| P26 | 3-Oct. (277) | 8.9 | 2001-6-Sept. (250) | 2000-22-Oct. (296) | 46 | 14.7 |
| P27 | 4-Oct. (278) | 7.9 | 1991-8-Sept. (252) | 2000-23-Oct. (297) | 45 | 12.5 |
| P28 | 6-Oct. (280) | 8.0 | 1992-26-Sept. (270) | 1996-21-Oct. (295) | 25 | 7.5 |
| P29 | 7-Oct. (281) | 7.6 | 1994-23-Sept. (267) | 1998-17-Oct. (291) | 24 | 7.4 |
| P30 | 11-Oct. (285) | 7.1 | 1994-1-Oct. (275) | 1987-19-Oct. (293) | 18 | 5.8 |
| P31 | 22-Oct. (296) | 3.3 | 2001-24-Sept. (268) | 1997/1998-30-Oct. (304) | 36 | 10.2 |
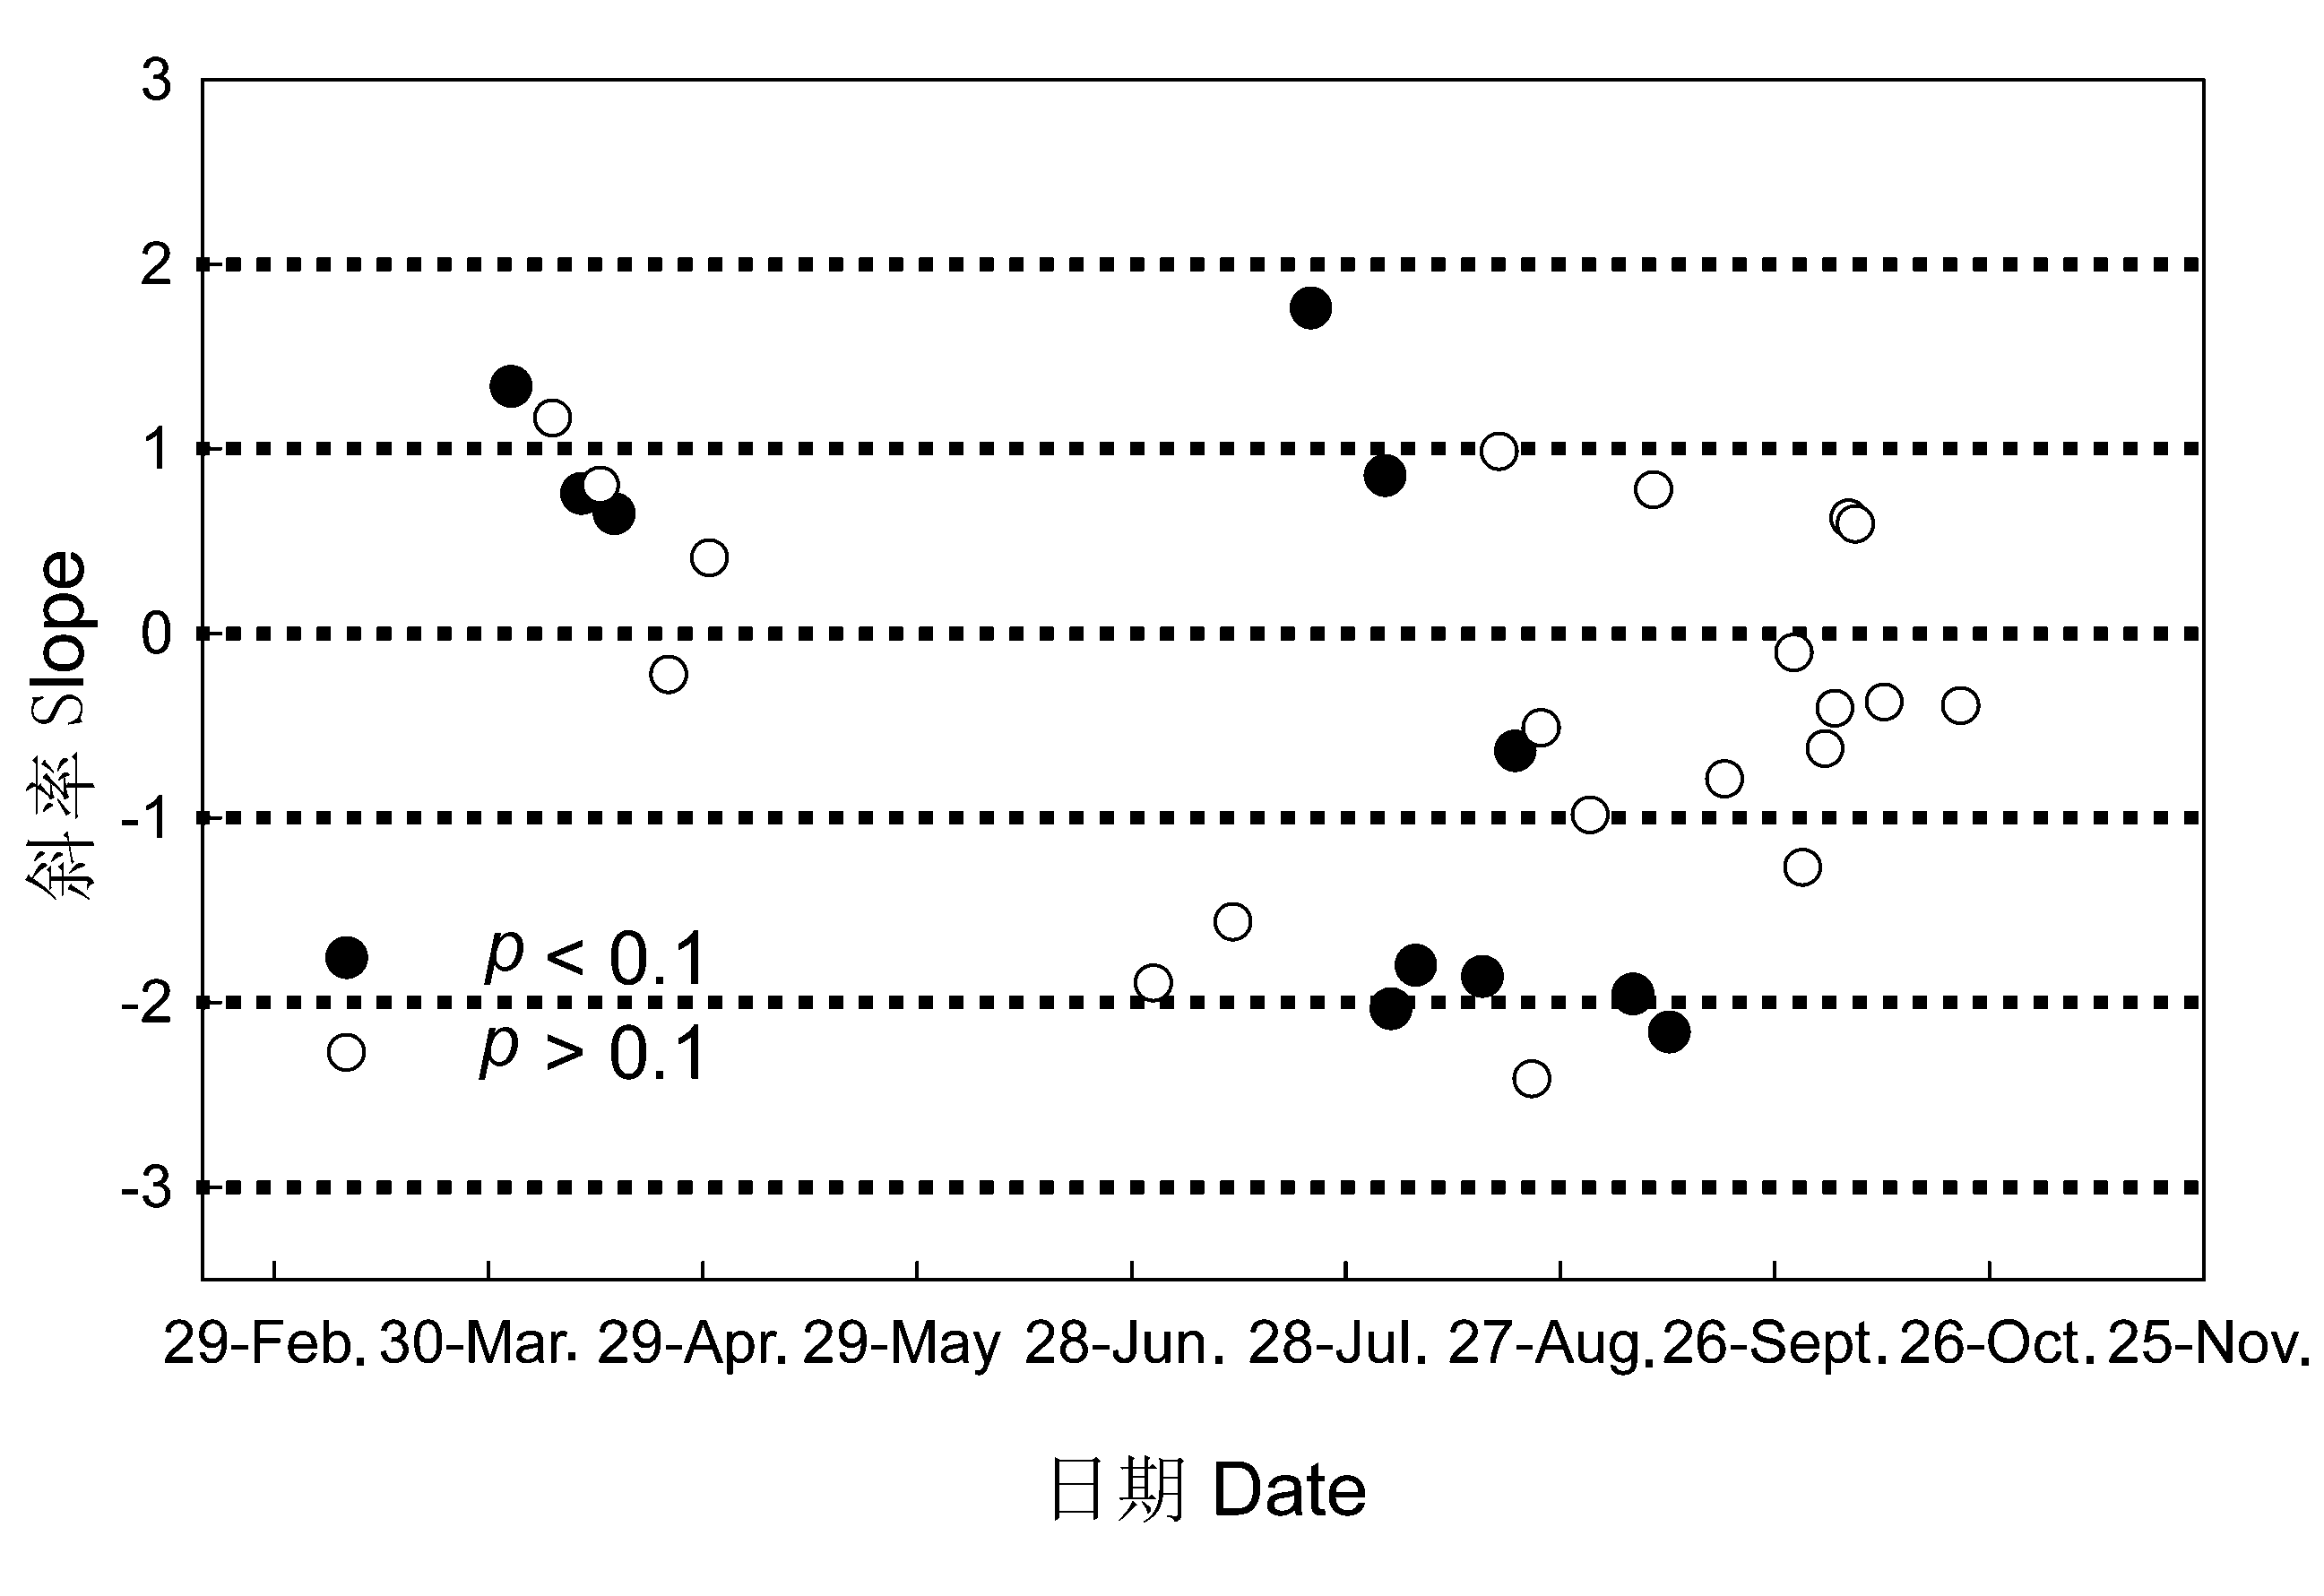
Fig. 2 Slope of linear trend for 31 phenological phases in Inner Mongolian Stipa krylovii steppe during 1985 to 2002
| 物候期 Phenophase | 日期 Date | 相关系数(r) Correlation coefficient | 月份 Month |
|---|---|---|---|
| P1 | 2-Apr. | 0.594*/0.644** | Mar.15b/Apr.15a |
| P3 | 12-Apr. | 0.548*/0.637**/0.608**/0.602*/0.532* | Jan.15b//Feb.15a/Feb15b/Mar.15a/Mar.15b |
| P4 | 14-Apr. | 0.508*/0.675** | Mar.15a/Mar.15b |
| P5 | 16-Apr. | 0.585*/0.554*/0.564*/0.495* | Feb.15a/Feb.15b/Mar.15a/Mar.15b |
| P7 | 29-Apr. | 0.512* | Mar.15b |
| P12 | 3-Aug. | -0.617* | Jul.15b |
| P13 | 6-Aug. | -0.514*/-0.711*/-0.604* | Jul.15a/Jul.15b/Aug.15a |
| P14 | 16-Aug. | -0.745**/-0.771**/-0.660* | Jul.15b/Aug.15a/Aug.15b |
| P17 | 23-Aug. | -0.853**/-0.834**/-0.685* | Jul.15b/Aug.15a/Aug.15b |
| P18 | 24-Aug. | -0.531*/-0.576*/-0.672**/-0.574* | Jul.15a/Jul.15b/Aug.15a/Aug.15b |
| P19 | 31-Aug. | -0.665*/-0.75** | Jul.15a/Jul.15b |
| P20 | 6-Sept. | -0.544*/-0.64*/-0.578* | Jul.15a/Jul.15b/Aug.15a |
| P22 | 11-Sept. | -0.894**/-0.891**/-0.788**/-0.613* | Jul.15b/Aug.15a/Aug.15b/Sept.15a |
| P23 | 19-Sept. | -0.668**/-0.69**/-0.621**/-0.486* | Jul.15a/Jul.15b/Aug.15a/Aug.15b |
| P25 | 29-Sept. | -0.672*/-0.703*/-0.612* | Jul.15a/Jul.15b/Aug.15a |
| P26 | 3-Oct. | -0.642** | Jul.15a |
| P27 | 4-Oct. | -0.71**/-0.546* | Jul.15a/Jul.15b |
Table 4 Correlation between phenological phases and light
| 物候期 Phenophase | 日期 Date | 相关系数(r) Correlation coefficient | 月份 Month |
|---|---|---|---|
| P1 | 2-Apr. | 0.594*/0.644** | Mar.15b/Apr.15a |
| P3 | 12-Apr. | 0.548*/0.637**/0.608**/0.602*/0.532* | Jan.15b//Feb.15a/Feb15b/Mar.15a/Mar.15b |
| P4 | 14-Apr. | 0.508*/0.675** | Mar.15a/Mar.15b |
| P5 | 16-Apr. | 0.585*/0.554*/0.564*/0.495* | Feb.15a/Feb.15b/Mar.15a/Mar.15b |
| P7 | 29-Apr. | 0.512* | Mar.15b |
| P12 | 3-Aug. | -0.617* | Jul.15b |
| P13 | 6-Aug. | -0.514*/-0.711*/-0.604* | Jul.15a/Jul.15b/Aug.15a |
| P14 | 16-Aug. | -0.745**/-0.771**/-0.660* | Jul.15b/Aug.15a/Aug.15b |
| P17 | 23-Aug. | -0.853**/-0.834**/-0.685* | Jul.15b/Aug.15a/Aug.15b |
| P18 | 24-Aug. | -0.531*/-0.576*/-0.672**/-0.574* | Jul.15a/Jul.15b/Aug.15a/Aug.15b |
| P19 | 31-Aug. | -0.665*/-0.75** | Jul.15a/Jul.15b |
| P20 | 6-Sept. | -0.544*/-0.64*/-0.578* | Jul.15a/Jul.15b/Aug.15a |
| P22 | 11-Sept. | -0.894**/-0.891**/-0.788**/-0.613* | Jul.15b/Aug.15a/Aug.15b/Sept.15a |
| P23 | 19-Sept. | -0.668**/-0.69**/-0.621**/-0.486* | Jul.15a/Jul.15b/Aug.15a/Aug.15b |
| P25 | 29-Sept. | -0.672*/-0.703*/-0.612* | Jul.15a/Jul.15b/Aug.15a |
| P26 | 3-Oct. | -0.642** | Jul.15a |
| P27 | 4-Oct. | -0.71**/-0.546* | Jul.15a/Jul.15b |
| 物候期Phenophase | 日期 Date | 相关系数(r) Correlation coefficient | 月份 Month |
|---|---|---|---|
| P3 | 12-Apr. | 0.602* | 1 |
| P4 | 14-Apr. | 0.710** | 1 |
| P5 | 16-Apr. | 0.580* | 1 |
| P7 | 29-Apr. | 0.477* | 1 |
| P10 | 23-Jul. | 0.616* | 7 |
| P11 | 2-Aug. | 0.596*/0.777 7** | 6/7 |
| P27 | 4-Oct. | -0.479* | 8 |
Table 5 Correlation between phenological phases and mean air temperatures
| 物候期Phenophase | 日期 Date | 相关系数(r) Correlation coefficient | 月份 Month |
|---|---|---|---|
| P3 | 12-Apr. | 0.602* | 1 |
| P4 | 14-Apr. | 0.710** | 1 |
| P5 | 16-Apr. | 0.580* | 1 |
| P7 | 29-Apr. | 0.477* | 1 |
| P10 | 23-Jul. | 0.616* | 7 |
| P11 | 2-Aug. | 0.596*/0.777 7** | 6/7 |
| P27 | 4-Oct. | -0.479* | 8 |
| 物候期Phenophase | 日期 Date | 相关系数(r) Correlation coefficient | 月份 Month |
|---|---|---|---|
| P2 | 7-Apr. | 0.57*/0.567* | Pre-12、1 |
| P11 | 2-Aug. | -0.484* | 7 |
| P12 | 3-Aug. | -0.675** | 6 |
| P13 | 6-Aug. | -0.571* | 6 |
| P16 | 20-Aug. | -0.638* | 6 |
| P17 | 23-Aug. | -0.619* | 7 |
| P19 | 31-Aug. | -0.706* | 6 |
| P20 | 6-Sept. | 0.744** | 9 |
| P22 | 11-Sept. | 0.581* | 9 |
| P23 | 19-Sept. | -0.591*/-0.469* | 6/7 |
| P25 | 29-Sept. | 0.604* | 9 |
| P26 | 3-Oct. | 0.588* | 8 |
| P27 | 4-Oct. | 0.552* | 8 |
Table 6 Correlation between phenological phases and monthly mean precipitation (mm)
| 物候期Phenophase | 日期 Date | 相关系数(r) Correlation coefficient | 月份 Month |
|---|---|---|---|
| P2 | 7-Apr. | 0.57*/0.567* | Pre-12、1 |
| P11 | 2-Aug. | -0.484* | 7 |
| P12 | 3-Aug. | -0.675** | 6 |
| P13 | 6-Aug. | -0.571* | 6 |
| P16 | 20-Aug. | -0.638* | 6 |
| P17 | 23-Aug. | -0.619* | 7 |
| P19 | 31-Aug. | -0.706* | 6 |
| P20 | 6-Sept. | 0.744** | 9 |
| P22 | 11-Sept. | 0.581* | 9 |
| P23 | 19-Sept. | -0.591*/-0.469* | 6/7 |
| P25 | 29-Sept. | 0.604* | 9 |
| P26 | 3-Oct. | 0.588* | 8 |
| P27 | 4-Oct. | 0.552* | 8 |
| [1] |
Ahas R, Jaagus J, Aasa A (2000). The phenological calendar of Estonia and its correlation with mean air temperature. International Journal of Biometeorology, 44,159-166.
DOI URL PMID |
| [2] | Badeck W, Bondeau A, Böttcher K, Doktor D, Lucht W, Schaber J, Sitch S (2004). Responses of spring phenology to climate change. New Phytologist, 162,295-309. |
| [3] | Bradley NL, Leopold AC, Ross J, Huffaker W (1999). Phenological changes reflect climate change in Wisconsin. Proceedings of the National Academy of Sciences of the United States of America, 96,9701-9704. |
| [4] | Chen X, Hu B, Yu R (2005). Spatial and temporal variation of phenological growing season and climate change impacts in temperate eastern China. Global Change Biology, 11,1118-1130. |
| [5] |
Chmielewski FM, Müller A, Küchler W (2005). Possible impacts of climate change on natural vegetation in Saxony (Germany). International Journal of Biometeorology, 50,96-104.
DOI URL PMID |
| [6] |
Cleland EE, Chiariello NR, Loarie SR, Mooney HA, Field CB (2006). Diverse responses of phenology to global changes in a steppe ecosystem. Proceedings of the National Academy of Sciences of the United States of America, 103,13740-13744.
DOI URL PMID |
| [7] | Dunne JA, Harte J, Taylor KJ (2003). Subalpine meadow flowering phenology responses to climate change: integrating experimental and gradient methods. Ecological Monographs, 73,69-86. |
| [8] | Fang XQ (方修琦), Yu WH (余卫红) (2002). Progress in the studies on the phenological responding to global warming. Advance in Earth Sciences (地球科学进展), 10,714-719. (in Chinese with English abstract) |
| [9] | Golluscio RA, Oesterheld M, Aguiar MR (2005). Relationship between phenology and life form: a test with 25 Patagonian species. Ecography, 28,273-282. |
| [10] | Keeling CD, Chin JFS, Whorf TP (1996). Increased activity of northern vegetation inferred from atmospheric CO 2 measurements. Nature, 382,146-149. |
| [11] | Lieth H (1974). Purposes of a phenology book. In: Lieth H ed. Phenology and Seasonal Modeling. Springer-Verlag, New York, 3-19. |
| [12] | Linderholm HW (2006). Growing season changes in the last century. Agricultural and Forest Meteorology, 137,1-14. |
| [13] | Lucht W, Prentice IC, Myneni RB, Sitch S, Friedlingstein P, Cramer W, Bousquet P, Buermann W, Smith B (2002). Climatic control of the high-latitude vegetation greening trend and pinatubo effect. Science, 296,1687-1689. |
| [14] | Menzel A (2002). Phenology, its importance to the global change community editorial comment. Climatic Change, 54,379-385. |
| [15] | Menzel A (2003). Plant phenological “Fingerprints”, petection of climate change impacts. In: Schwartz MD ed. Phenology: An Integrative Environmental Science. Kluwer Academic Publishers, Dordrecht, Boston, London, 319-329. |
| [16] | Myneni RB, Keeling CD, Tucker CJ, Asrar G, Nemani RR (1997). Increased plant growth in the northern high latitudes from 1981 to 1991. Nature, 386,698-702. |
| [17] | Piao SL, Fang JY, Zhou LM, Ciais P, Zhu B (2006). Variations in satellite-derived phenology in China’s temperate vegetation. Global Change Biology, 12,672-685. |
| [18] | Piao SL, Friedlingstein P, Ciais P, Viovy N, Demarty J (2007). Growing season extension and its impact on terrestrial carbon cycle in the Northern Hemisphere over the past 2 decades. Global Biogeochemical Cycles, 21. doi: 10.1029/2006GB002888. |
| [19] |
Piao SL, Ciais P, Friedlingstein P, Peylin P, Reichstein M, Luyssaert S, Margolis H, Fang J, Barr A, Chen A, Grelle A, Hollinger DY, Laurila T, Lindroth A, Richardson AD, Vesala T (2008). Net carbon dioxide losses of northern ecosystems in response to autumn warming. Nature, 451. doi: 10.1038/nature06444.
DOI URL PMID |
| [20] | Price MV, Waser NM (1998). Effects of experimental warming on plant reproductive phenology in a subalpine meadow. Ecology, 79,1261-1271. |
| [21] | Schwartz MD, Ahas R, Aasa A (2006). Onset of spring starting earlier across the Northern Hemisphere. Global Change Biology, 12,343-351. |
| [22] |
Sherry RA, Zhou X, Gu S, Arnone III JA, Schimel DS, Verburg PS, Wallace LL, Luo Y (2007). Divergence of reproductive phenology under climate warming. Proceedings of the National Academy of Sciences of the United States of America, 104,198-202.
DOI URL PMID |
| [23] | Spano D, Cesaraccio C, Duce P, Snyder RL (1999). Phenological stages of natural species and their use as climate indicators. International Journal of Biometeo- rology, 42,124-133. |
| [24] | Sparks TH, Smithers RJ (2002). Is spring getting earlier? Weather, 57,157-166. |
| [25] | Tucker CJ, Pinzon JE, Brown ME (2004). Global inventory modeling and mapping studies (GIMMS) satellite drift corrected and NOAA-16 incorporated normalized difference vegetation index (NDVI), monthly 1981. |
| [26] | United Scientific Exploration Team of Inner Monglian and Ningxia, Chinese Academy of Sciences (中国科学院内蒙古宁夏综合考察队) (1985). Vegetation of Inner Monglian(内蒙古植被). Science Press, Beijing, 516-527. (in Chinese) |
| [27] |
Walther GR, Post E, Convey P, Menzel A, Parmesan C, Beebee TJC, Fromentin JM, Hoegh-Guldberg O, Bairlein F (2002). Ecological responses to recent climate change. Nature, 416,389-395.
DOI URL PMID |
| [28] | Wan MW (宛敏渭), Liu XZ (刘秀珍) (1979). Phenological Observation Method in China(中国物候观测方法). Science Press, Beijing, 42-58. (in Chinese) |
| [29] | Yuan WP (袁文平) (2007). Character and the Impact of Phenophase on Ecosystem Functions in Typical Grassland Ecosystem (典型草原物候特征及其对生态系统功能的影响研究). PhD dissertation, Institute of Botany, Chinese Academy of Sciences, Beijing, 16-17. (in Chinese) |
| [30] | Yuan W, Zhou G, Wang Y, Han X, Wang Y (2007). Simulating phenological characteristics of two dominant grass species in a semi-arid steppe ecosystem. Ecological Research, 22,784-791. |
| [31] | Zhang X, Tarpley D, Sullivan JT (2007). Diverse responses of vegetation phenology to a warming climate. Geophysical Research Letters, 34,L19405. doi: 10. 1029/2007GL031447. |
| [32] | Zheng J, Ge Q, Hao Z, Wang W (2006). Spring phenophases in recent decades over eastern china and its possible link to climate changes. Climatic Change, 77,449-462. |
| [33] | Zhou L, Tucker CJ, Kaufmann RK, Slayback D, Shabanov NV, Myneni RB (2001). Variation in northern vegetation activity inferred from satellite data of vegetation index during 1981 to 1999. Journal of Geophysical Research, 106,20069-20083. |
| [34] | Zhu KZ (竺可桢), Wan MW (宛敏渭) (1973). Phenology(物候学). Science Press, Beijing, 1-131. (in Chinese) |
| [1] | TAN Qiu-Yan, ZHANG Qing, GAO Cheng, CHU Hai-Yan, YANG Teng. Ectomycorrhizal fungi: key drivers of carbon and nitrogen cycling in alpine ecosystems [J]. Chin J Plant Ecol, 2026, 50(3): 584-599. |
| [2] | ZHANG Lin, YUAN Wei-Ying, SONG Chuang-Ye, WU Dong-Xiu. Dynamic dataset of environmental elements, species richness and biomass of long-term observation plots of typical ecosystems in China from 1998 to 2010 [J]. Chin J Plant Ecol, 2025, 49(8): 1182-1190. |
| [3] | FAN Ya-Ran, XIA Shao-Pan, YU Bing-Bing, ZHU Zi-Qi, YANG Wei, FAN Yu-Chuan, LIU Xiao-Yu, ZHANG Xu-Hui, ZHENG Ju-Feng. Effects of elevated atmospheric CO2 concentration and warming on stability of soil organic carbon pool accumulation, molecular composition and structure stability [J]. Chin J Plant Ecol, 2025, 49(7): 1053-1069. |
| [4] | WANG Kun-Ying, QIU Gui-Fu, LIU Zi-He, MENG Jun, LIU Yu-Xuan, JIA Guo-Dong. Climate change regulate tree growth and intrinsic water use efficiency of Populus simonii at different levels of degradation [J]. Chin J Plant Ecol, 2025, 49(2): 343-355. |
| [5] | HUANG Mei-Hong, NIU Meng-Qiu, YANG Peng-Fei, LIN Jie, LIAO Zhou-Yu, CHEN Jian-Guo, XIANG Jian-Ying. Effects of temperature and burial depth on seedling emergence and growth of the alpine cushion plant Arenaria oreophila [J]. Chin J Plant Ecol, 2025, 49(12): 2092-2104. |
| [6] | HE Yi, ZHOU Jing, CHEN Chen, FANG Ting-Zhou, SU Jian, GAO Hao-Jie, CAO Jia-Hao, YANG Fei-Yu, FAN Qi-Bo, ZHU Le-Yao, CHEN Yi-Ming, YANG Fei, WANG Yi-Teng, FENG Lei, LIU Fei, LIANG Shuang, JIANG Ming-Kai, CHEN Jun, ZHAO Yun-Peng, CHEN Wei-Le, ZHAO Ying, HUANG Jian-Guo. Protection and restoration of endangered tree species on coastal islands of Zhejiang, China [J]. Chin J Plant Ecol, 2025, 49(10): 1583-1599. |
| [7] | ZHANG Peng, JIAO Liang, XUE Ru-Hong, WEI Meng-Yuan, DU Da-Shi, WU Xuan, WANG Xu-Ge, LI Qian. Drought intensity affected the growth recovery of Picea crassifolia across different altitudes in western Qilian Mountains [J]. Chin J Plant Ecol, 2024, 48(8): 977-987. |
| [8] | SHI Qian, TONG Xiao-Juan, XU Ling-Ling, MENG Ping, YU Pei-Yang, LI Jun, YANG Ming-Xin. Response of radial growth of early and late wood of planted Pinus tabuliformis to climate variables [J]. Chin J Plant Ecol, 2024, 48(8): 988-1000. |
| [9] | CHEN Yi-Heng, Yusufujiang RUSULI, Abdureheman WUSIMAN. Analysis of spatial and temporal variation in grassland vegetation cover in Xinjiang section of Tianshan Mountains and the driving factors from 2001 to 2020 [J]. Chin J Plant Ecol, 2024, 48(5): 561-576. |
| [10] | WU Ru-Ru, LIU Mei-Zhen, GU Xian, CHANG Xin-Yue, GUO Li-Yue, JIANG Gao-Ming, QI Ru-Yi. Prediction of suitable habitat distribution and potential impact of climate change on distribution patterns of Cupressus gigantea [J]. Chin J Plant Ecol, 2024, 48(4): 445-458. |
| [11] | LIANG Yi-Xian, WANG Chuan-Kuan, ZANG Miao-Han, SHANGGUAN Hong-Yu, LIU Yi-Xiao, QUAN Xian-Kui. Responses of radial growth and biomass allocation of Larix gmelinii to climate warming [J]. Chin J Plant Ecol, 2024, 48(4): 459-468. |
| [12] | ZANG Miao-Han, WANG Chuan-Kuan, LIANG Yi-Xian, LIU Yi-Xiao, SHANGGUAN Hong-Yu, QUAN Xian-Kui. Stoichiometric characteristics of leaf, branch and root in Larix gmelinii in response to climate warming based on latitudinal transplantation [J]. Chin J Plant Ecol, 2024, 48(4): 469-482. |
| [13] | ZHANG Ji-Shen, SHI Xin-Jie, LIU Yu-Nuo, WU Yang, PENG Shou-Zhang. Dynamics of ecosystem carbon storage of potential natural vegetation in China under climate change [J]. Chin J Plant Ecol, 2024, 48(4): 428-444. |
| [14] | ZHANG Qi, CHENG Xue-Han, WANG Shu-Zhi. History of forest disturbance recorded by old trees in Xishan Mountain, Beijing [J]. Chin J Plant Ecol, 2024, 48(3): 341-348. |
| [15] | GUO Qiang, HAN Zi-Chen, XIA Yun, YANG Liu-Ming, FAN Yue-Xin, YANG Yu-Sheng. Study advances on the mechanism of soil microbial carbon fixation and associated influencing factors [J]. Chin J Plant Ecol, 2024, 48(11): 1406-1421. |
| Viewed | ||||||
|
Full text |
|
|||||
|
Abstract |
|
|||||
Copyright © 2026 Chinese Journal of Plant Ecology
Tel: 010-62836134, 62836138, E-mail: apes@ibcas.ac.cn, cjpe@ibcas.ac.cn
![]()