
植物生态学报 ›› 2022, Vol. 46 ›› Issue (10): 1268-1279.DOI: 10.17521/cjpe.2022.0234
所属专题: 红树林及红树植物; 全球变化与生态系统; 生态遥感及应用
姜玉峰1,2, 李晶1,2, 信瑞瑞1,2, 李艺1,2,*( )
)
收稿日期:2022-06-06
接受日期:2022-09-05
出版日期:2022-10-20
发布日期:2022-09-28
通讯作者:
*李艺(yili@xmu.edu.cn)
基金资助:
JIANG Yu-Feng1,2, LI Jing1,2, XIN Rui-Rui1,2, LI Yi1,2,*()
Received:2022-06-06
Accepted:2022-09-05
Online:2022-10-20
Published:2022-09-28
Contact:
*LI Yi(yili@xmu.edu.cn)
Supported by:摘要:
随着沿海人类活动的日益加剧, 其对红树林生态系统健康和可持续发展的影响也逐渐凸显, 实现红树林周边典型人类活动时空动态变化监测对红树林生态系统的保护与修复意义重大。该研究基于Landsat多时相遥感数据和Google Earth Engine平台, 通过面向对象的机器学习方法, 融入水体季节波动信息作为分类特征, 获取了1990、2000、2010和2020年4个不同时期中国沿海红树林分布省区(包括广东、福建、浙江、台湾、广西及海南) 30 m分辨率的养殖池塘空间格局及其变化特征, 并进一步解析养殖池塘对红树林生态系统的影响。研究结果表明: (1)研究区域内4个时间节点的沿海养殖池塘面积总量分别为2 963、5 200、5 377及4 805 km2, 呈先增加后减少的趋势, 于2010-2020年间达到峰值。沿海养殖池塘面积变化趋势和达峰时间存在明显区域差异性, 其主要原因是红树林保护政策、养殖池塘规范管理和阶段性经济目标的区域差异化。(2)我国沿海养殖池塘集中分布在21°-24° N区域(广东和广西), 与红树林沿纬度的分布格局呈错峰分布。其中, 红树林与沿海养殖池塘集中分布区(21°-22° N)存在大量养殖池塘堤边生长红树林的特色格局, 此区域内两者交互作用最为紧密, 是探究人类活动对红树林生态系统影响的典型热点地区。(3)养殖池塘侵占红树林是造成红树林损失的最直接原因, 并导致红树林空间分布格局呈现局部破碎化或聚集化的极端发展趋势。该研究通过解析沿海养殖池塘的空间格局, 为精准评估红树林周边典型人类活动变化提供数据支撑, 为进一步监测红树林空间格局动态变化趋势和红树林优先修复区识别提供参考依据。
姜玉峰, 李晶, 信瑞瑞, 李艺. 沿海养殖池塘对红树林生态系统影响的时空变化监测与分析. 植物生态学报, 2022, 46(10): 1268-1279. DOI: 10.17521/cjpe.2022.0234
JIANG Yu-Feng, LI Jing, XIN Rui-Rui, LI Yi. Spatial-temporal dynamics of coastal aquaculture ponds and its impacts on mangrove ecosystems. Chinese Journal of Plant Ecology, 2022, 46(10): 1268-1279. DOI: 10.17521/cjpe.2022.0234
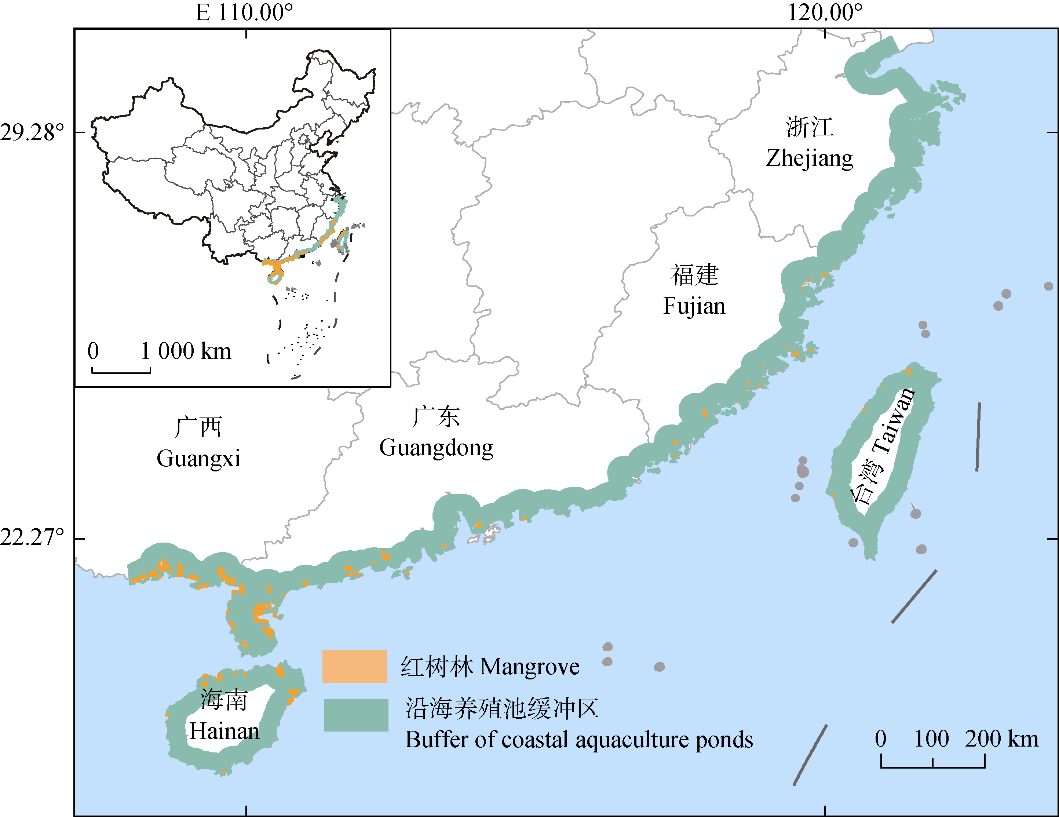
图1 中国红树林分布省区的沿海养殖池塘缓冲区地理位置。
Fig. 1 Distribution of the buffer zone of coastal aquaculture ponds in the provinces with mangroves in China.

图2 水体淹没频率空间分布图。
Fig. 2 Spatial distribution of inundation frequency.
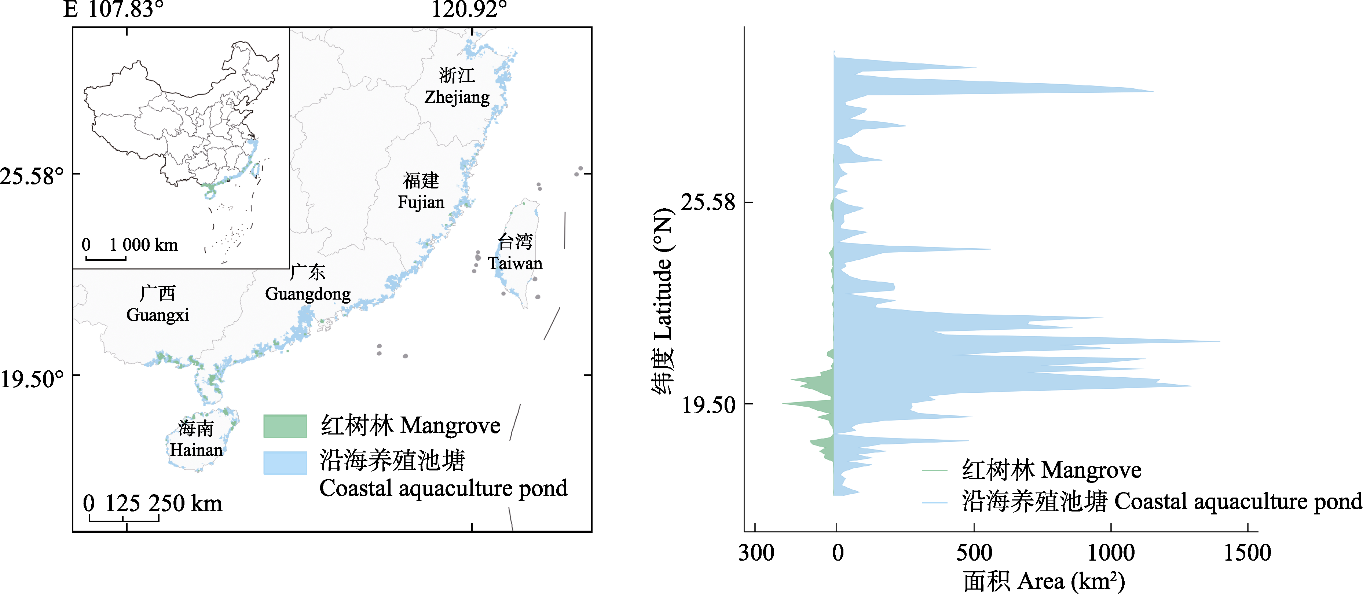
图3 2020年红树林和沿海养殖池塘空间分布和纬度分布统计。
Fig. 3 Spatial distribution and latitudinal distribution of mangroves and coastal aquaculture ponds in 2020.

图4 1990-2020年红树林分布省区的沿海养殖池塘面积变化统计。A, 1990-2020年6个红树林分布省区沿海养殖池塘总面积变化。B, 1990-2020年3个时间阶段沿海养殖池塘面积增量和同比增速。C-H, 6个红树林分布省区沿海养殖池塘面积变化。
Fig. 4 Temporal changes in the area of aquaculture ponds in the provinces with mangroves from 1990 to 2020. A, Total area of aquaculture ponds in six provinces with mangroves from 1990 to 2020. B, Increase in the area of aquaculture ponds and the decadal growth rate in 3 periods from 1990 to 2020. C-H, Total area of aquaculture ponds in each province.
| 年份 Year | 类别 Class | 养殖池塘 Aquaculture ponds | 非养殖池塘 Non-aquaculture ponds | 生产者精度 PA (%) | 用户精度 UA (%) | 总精度 OA (%) | Kappa |
|---|---|---|---|---|---|---|---|
| 2020 | 养殖池塘 Aquaculture ponds | 347 | 53 | 98.58 | 86.75 | 89.34 | 0.75 |
| 非养殖池塘 Non-aquaculture ponds | 5 | 139 | 76.37 | 96.53 | |||
| 2010 | 养殖池塘 Aquaculture ponds | 345 | 55 | 98.80 | 86.25 | 88.60 | 0.74 |
| 非养殖池塘 Non-aquaculture ponds | 7 | 137 | 71.35 | 95.14 | |||
| 2000 | 养殖池塘 Aquaculture ponds | 332 | 58 | 98.81 | 83.00 | 86.76 | 0.71 |
| 非养殖池塘 Non-aquaculture ponds | 4 | 140 | 70.71 | 97.22 | |||
| 1990 | 养殖池塘 Aquaculture ponds | 343 | 57 | 99.42 | 85.75 | 89.15 | 0.77 |
| 非养殖池塘 Non-aquaculture ponds | 2 | 142 | 71.00 | 98.61 |
表1 水产养殖池塘解译结果精度评价
Table 1 Accuracy evaluation of the identification of aquaculture ponds
| 年份 Year | 类别 Class | 养殖池塘 Aquaculture ponds | 非养殖池塘 Non-aquaculture ponds | 生产者精度 PA (%) | 用户精度 UA (%) | 总精度 OA (%) | Kappa |
|---|---|---|---|---|---|---|---|
| 2020 | 养殖池塘 Aquaculture ponds | 347 | 53 | 98.58 | 86.75 | 89.34 | 0.75 |
| 非养殖池塘 Non-aquaculture ponds | 5 | 139 | 76.37 | 96.53 | |||
| 2010 | 养殖池塘 Aquaculture ponds | 345 | 55 | 98.80 | 86.25 | 88.60 | 0.74 |
| 非养殖池塘 Non-aquaculture ponds | 7 | 137 | 71.35 | 95.14 | |||
| 2000 | 养殖池塘 Aquaculture ponds | 332 | 58 | 98.81 | 83.00 | 86.76 | 0.71 |
| 非养殖池塘 Non-aquaculture ponds | 4 | 140 | 70.71 | 97.22 | |||
| 1990 | 养殖池塘 Aquaculture ponds | 343 | 57 | 99.42 | 85.75 | 89.15 | 0.77 |
| 非养殖池塘 Non-aquaculture ponds | 2 | 142 | 71.00 | 98.61 |

图5 1990-2020年沿海养殖池塘周围红树林空间格局演变。正值代表随着时间变化而增加, 负值则相反。
Fig. 5 Evolution of the spatial pattern of mangroves around coastal aquaculture ponds, from 1990 to 2020. Positive values represent an increase in the indicators in each decade, while negative values mean the opposite. AI, aggregation index; AREA_MEAN, mean patch area; ENN_MN, mean euclidean nearest neighbor index; PD, patch density.

图6 本研究产品与其他海岸带水产养殖池塘数据结果在b、c、d 3地的比较。B-D中左图为Ren等(2019)数据产品(2015年), 右图为本研究的数据产品(2020年)。
Fig. 6 Comparisons of coastal aquaculture ponds in three different places (b, c and d). The distributions of aquaculture ponds on the left side in B-D of the diagram group are the dataset acquired from Ren et al. (2015), and those on the right side are the data products from this study.
| [1] | Baig MHA, Zhang LF, Wang SD, Jiang GZ, Lu SL, Tong QX. (2013). Comparison of MNDWI and DFI for water mapping in flooding season//2013 IEEE International Geoscience and Remote Sensing Symposium-IGARSS. IEEE, Melbourne, Australia. 2876-2879. |
| [2] | Barbier EB, Hacker SD, Kennedy C, Koch EW, Stier AC, Silliman BR. (2011). The value of estuarine and coastal ecosystem services. Ecological Monographs, 8, 169-193. |
| [3] |
Bunting P, Rosenqvist A, Lucas RM, Rebelo LM, Hilarides L, Thomas N, Hardy A, Itoh T, Shimada M, Finlayson CM. (2018). The global mangrove watch—A new 2010 global baseline of mangrove extent. Remote Sensing, 10, 1669. DOI: 10.3390/rs10101669.
DOI |
| [4] |
Cao L, Wang WM, Yang Y, Yang CT, Yuan ZH, Xiong SB, Diana J. (2007). Environmental impact of aquaculture and countermeasures to aquaculture pollution in China. Environmental Science and Pollution Research International, 14, 452-462.
DOI URL |
| [5] | de Groot R, Stuip M, Finlayson M, Davidson N. (2006). Valuing wetlands: guidance for valuing the benefits derived from wetland ecosystem services. Ramsar Technical Report No. 3. Ramsar Convention Secretariat, Gland, Switzerland. |
| [6] |
Donato DC, Kauffman JB, Murdiyarso D, Kurnianto S, Stidham M, Kanninen M. (2011). Mangroves among the most carbon-rich forests in the tropics. Nature Geoscience, 4, 293-297.
DOI URL |
| [7] |
Duan YQ, Li X, Zhang LP, Chen D, Liu S, Ji HY. (2020). Mapping national-scale aquaculture ponds based on the Google Earth Engine in the Chinese coastal zone. Aquaculture, 520, 734666. DOI: 10.1016/j.aquaculture.2019.734666.
DOI |
| [8] | Dwivedi RS, Kandrika S. (2005). Delineation and monitoring of aquaculture areas using multi-temporal space-borne multispectral data. Current Science, 89, 1414-1421. |
| [9] |
Feyisa GL, Meilby H, Fensholt R, Proud SR. (2014). Automated Water Extraction Index: a new technique for surface water mapping using Landsat imagery. Remote Sensing of Environment, 140, 23-35.
DOI URL |
| [10] |
Friess DA, Rogers K, Lovelock CE, Krauss KW, Hamilton SE, Lee SY, Lucas R, Primavera J, Rajkaran A, Shi SH. (2019). The state of the world’s mangrove forests: past, present, and future. Annual Review of Environment and Resources, 44, 89-115.
DOI URL |
| [11] |
Giri C, Ochieng E, Tieszen LL, Zhu Z, Singh A, Loveland T, Masek J, Duke N. (2011). Status and distribution of mangrove forests of the world using earth observation satellite data. Global Ecology and Biogeography, 20, 154-159.
DOI URL |
| [12] |
Goldberg L, Lagomasino D, Thomas N, Fatoyinbo T. (2020). Global declines in human-driven mangrove loss. Global Change Biology, 26, 5844-5855.
DOI URL |
| [13] |
Gonçalves G, Andriolo U, Gonçalves L, Sobral P, Bessa F. (2020). Quantifying marine macro litter abundance on a sandy beach using unmanned aerial systems and object- oriented machine learning methods. Remote Sensing, 12, 2599. DOI: 10.3390/rs12162599.
DOI |
| [14] | Jia MM, Wang ZM, Mao DH, Huang CL, Lu CY. (2021). Spatial-temporal changes of China’s mangrove forests over the past 50 years: an analysis towards the Sustainable Development Goals (SDGs). Chinese Science Bulletin, 66, 3886-3901. |
| [贾明明, 王宗明, 毛德华, 黄春林, 路春燕 (2021). 面向可持续发展目标的中国红树林近50年变化分析. 科学通报, 66, 3886-3901.] | |
| [15] |
McFeeters SK. (1996). The use of the Normalized Difference Water Index (NDWI) in the delineation of open water features. International Journal of Remote Sensing, 17, 1425-1432.
DOI URL |
| [16] |
Naylor RL, Hardy RW, Buschmann AH, Bush SR, Cao L, Klinger DH, Little DC, Lubchenco J, Shumway SE, Troell M. (2021). A 20-year retrospective review of global aquaculture. Nature, 591, 551-563.
DOI URL |
| [17] |
Ottinger M, Clauss K, Kuenzer C. (2017). Large-scale assessment of coastal aquaculture ponds with Sentinel-1 time series data. Remote Sensing, 9, 440. DOI: 10.3390/rs9050440.
DOI |
| [18] | Pattanaik C, Narendra Prasad S. (2011). Assessment of aquaculture impact on mangroves of Mahanadi delta (Orissa), east coast of India using remote sensing and GIS. Ocean & Coastal Management, 54, 789-795. |
| [19] |
Peng YS, Li XL, Wu KL, Peng YG, Chen GZ. (2009). Effect of an integrated mangrove-aquaculture system on aquacultural health. Frontiers of Biology in China, 4, 579-584.
DOI URL |
| [20] |
Prasad KA, Ottinger M, Wei C, Leinenkugel P. (2019). Assessment of coastal aquaculture for India from Sentinel-1 SAR Time Series. Remote Sensing, 11, 357. DOI: 10.3390/rs11030357.
DOI |
| [21] |
Rahman AF, Dragoni D, Didan K, Barreto-Munoz A, Hutabarat JA. (2013). Detecting large scale conversion of mangroves to aquaculture with change point and mixed-pixel analyses of high-fidelity MODIS data. Remote Sensing of Environment, 130, 96-107.
DOI URL |
| [22] |
Ren CY, Wang ZM, Zhang YZ, Zhang B, Chen L, Xi YB, Xiao XM, Doughty RB, Liu MY, Jia MM, Mao DH, Song K. (2019). Rapid expansion of coastal aquaculture ponds in China from Landsat observations during 1984-2016. International Journal of Applied Earth Observation and Geoinformation, 82, 101902. DOI: 10.1016/j.jag.2019.101902.
DOI |
| [23] |
Singh KV, Setia R, Sahoo S, Prasad A, Pateriya B. (2015). Evaluation of NDWI and MNDWI for assessment of waterlogging by integrating digital elevation model and groundwater level. Geocarto International, 30, 650-661.
DOI URL |
| [24] |
Sun Z, Luo JH, Yang JZ, Yu QY, Zhang L, Xue K, Lu LR. (2020). Nation-scale mapping of coastal aquaculture ponds with Sentinel-1 SAR data using Google Earth Engine. Remote Sensing, 12, 3086. DOI: 10.3390/rs12183086.
DOI |
| [25] | Wang WQ, Zhang L, Zhang YM, Wang M. (2021). Research progress of mangrove restoration in abandoned ponds. Journal of Xiamen University (Natural Science), 60, 348-354. |
| [王文卿, 张林, 张雅棉, 王瑁 (2021). 红树林退塘还林研究进展. 厦门大学学报(自然科学版), 60, 348-354.] | |
| [26] | Xu HQ. (2005). A study on information extraction of water body with the Modified Normalized Difference Water Index (MNDWI). Journal of Remote Sensing, 9, 589-595. |
| [徐涵秋 (2005). 利用改进的归一化差异水体指数(MNDWI)提取水体信息的研究. 遥感学报, 9, 589-595.] | |
| [27] | Zanaga D, van DK R, Souverijns N, Brockmann C, Quast R, Wevers J, Grosu A, Arino O. (2021). ESA WorldCover 10 m 2020 v100. [2022-05-26]. https://worldcover2020.esa.int/download. |
| [28] |
Zhang Z, Xu N, Li YF, Li Y. (2022). Sub-continental-scale mapping of tidal wetland composition for East Asia: a novel algorithm integrating satellite tide-level and phenological features. Remote Sensing of Environment, 269, 112799. DOI: 10.1016/j.rse.2021.112799.
DOI |
| [29] |
Zou ZH, Dong JW, Menarguez MA, Xiao XM, Qin YW, Doughty RB, Hooker KV, David Hambright K. (2017). Continued decrease of open surface water body area in Oklahoma during 1984-2015. Science of the Total Environment, 595, 451-460.
DOI URL |
| [1] | 杨宇萌, 来全, 刘心怡. 气候变化和人类活动对内蒙古植被总初级生产力的定量影响[J]. 植物生态学报, 2024, 48(3): 306-316. |
| [2] | 王秀英, 陈奇, 杜华礼, 张睿, 马红璐. 基于机器学习的青藏高原高寒沼泽湿地蒸散发插补研究[J]. 植物生态学报, 2023, 47(7): 912-921. |
| [3] | 贺洁, 何亮, 吕渡, 程卓, 薛帆, 刘宝元, 张晓萍. 2001-2020年黄土高原光合植被时空变化及其驱动机制[J]. 植物生态学报, 2023, 47(3): 306-318. |
| [4] | 张文强, 罗格平, 郑宏伟, 王浩, HAMDI Rafiq, 何惠丽, 蔡鹏, 陈春波. 基于随机森林模型的内陆干旱区植被指数变化与驱动力分析: 以北天山北坡中段为例[J]. 植物生态学报, 2020, 44(11): 1113-1126. |
| [5] | 史娜娜, 肖能文, 王琦, 韩煜, 高晓奇, 冯瑾, 全占军. 锡林郭勒植被NDVI时空变化及其驱动力定量分析[J]. 植物生态学报, 2019, 43(4): 331-341. |
| [6] | 王晓春, 及莹. 树木年轮火历史研究进展[J]. 植物生态学报, 2009, 33(3): 587-597. |
| [7] | 吴晓雯, 罗晶, 陈家宽, 李博. 中国外来入侵植物的分布格局及其与环境因子和人类活动的关系[J]. 植物生态学报, 2006, 30(4): 576-584. |
| 阅读次数 | ||||||
|
全文 |
|
|||||
|
摘要 |
|
|||||
Copyright © 2022 版权所有 《植物生态学报》编辑部
地址: 北京香山南辛村20号, 邮编: 100093
Tel.: 010-62836134, 62836138; Fax: 010-82599431; E-mail: apes@ibcas.ac.cn, cjpe@ibcas.ac.cn
备案号: 京ICP备16067583号-19