
植物生态学报 ›› 2022, Vol. 46 ›› Issue (10): 1280-1288.DOI: 10.17521/cjpe.2022.0235
所属专题: 全球变化与生态系统; 生态学研究的方法和技术; 生态遥感及应用; 植被生态学
刘超1,2, 李平1, 武运涛1,2, 潘胜难1,2, 贾舟1,2, 刘玲莉1,*( )
)
收稿日期:2022-06-06
接受日期:2022-08-16
出版日期:2022-10-20
发布日期:2022-08-28
通讯作者:
刘玲莉
作者简介:*ORCID:刘玲莉: 0000-0002-5696-3151(lingli.liu@ibcas.ac.cn)基金资助:
LIU Chao1,2, LI Ping1, WU Yun-Tao1,2, PAN Sheng-Nan1,2, JIA Zhou1,2, LIU Ling-Li1,*()
Received:2022-06-06
Accepted:2022-08-16
Online:2022-10-20
Published:2022-08-28
Contact:
LIU Ling-Li
Supported by:摘要:
草地地上生物量是影响其生态系统功能最重要的因素之一, 也是草地生态学研究中不可或缺的监测指标。草地地上生物量监测多采用收割法进行, 但这种破坏性取样方法会对研究区域带来巨大干扰, 尤其是面积较小的长期定位监测或者控制实验研究样地, 从而使得地上生物量监测的频次受到很大限制。因此, 通过获取某些原位易测变量, 建立地上生物量的估算方法具有重要意义。该研究依托内蒙古典型草地刈割控制实验平台, 通过数码照片获取不同土地利用方式下的植被覆盖度, 并对样方内的叶面积指数、植被高度、物种多样性等参数进行了测定, 最后利用一元回归模型、逐步回归模型和随机森林模型对地上生物量进行估算。结果表明, 植被覆盖度、叶面积指数、植被平均高度、植被最大高度和物种丰富度是影响地上生物量的主要驱动因素。通过构建适宜于本地的逐步回归模型, 可以实现草地地上生物量的准确预测。在该研究区域中, 预测模型的决定系数(R2) = 0.91, 均方根误差(RMSE) = 35.60 g·m-2。该研究提供了一种快速、准确且非破坏性测定草地地上生物量的方法, 可作为传统收割法的有效补充。
刘超, 李平, 武运涛, 潘胜难, 贾舟, 刘玲莉. 一种基于数码相机图像和群落冠层结构调查的草地地上生物量估算方法. 植物生态学报, 2022, 46(10): 1280-1288. DOI: 10.17521/cjpe.2022.0235
LIU Chao, LI Ping, WU Yun-Tao, PAN Sheng-Nan, JIA Zhou, LIU Ling-Li. Estimation of grassland aboveground biomass using digital photograph and canopy structure measurements. Chinese Journal of Plant Ecology, 2022, 46(10): 1280-1288. DOI: 10.17521/cjpe.2022.0235
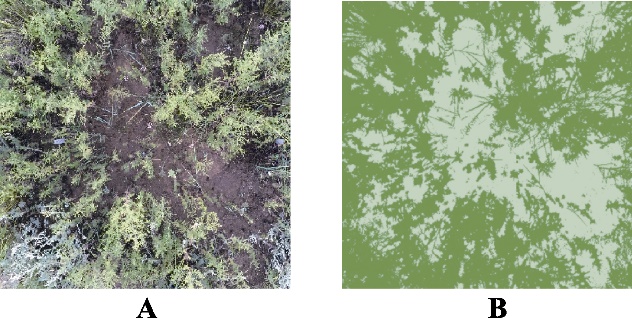
图1 数码相机获取的原始植被图片(A)和ENVI处理后的植被图片(B)。B中绿色区域为植被区域, 浅色区域为非植被区域。
Fig. 1 Original digital photo obtained by digital camera (A) and the photo processed by ENVI (B). The green area in figure B indicates vegetation area, and light-colored area indicates non-vegetation area.
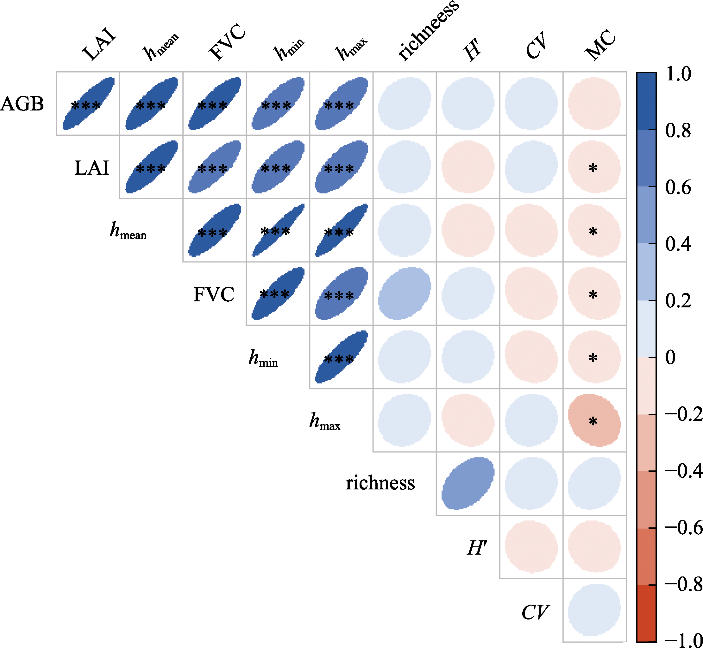
图2 草地地上生物量估算中各变量的相关矩阵。每个方框内的椭圆颜色和尺寸大小代表变量间的相关方向和程度, 蓝色代表正相关, 红色代表负相关, 颜色越深代表相关性越强。AGB, 地上生物量; CV, 高度变异系数; FVC, 植被覆盖度; H', 香农-维纳多样性指数; hmax, 植被最大高度; hmean, 植被平均高度; hmin, 植被最小高度; LAI, 叶面积指数; MC, 含水量; richness, 物种丰富度。*, p < 0.05; ***, p < 0.001。
Fig. 2 Correlation matrix among variables in grassland aboveground biomass estimation. The color and size of each ellipse represent the correlation direction and degree between variables; the blue and red colors represent positive and negative correlations, respectively, and the correlation degree is stronger when the red or blue color of each ellipse gets deeper. AGB, aboveground biomass; CV, coefficient of variation for vegetation height; FVC, fractional vegetation cover; H', Shannon-Wiener index; hmax, maximum vegetation height; hmean, mean vegetation height; hmin, minimum vegetation height; LAI, leaf area index; MC, moisture content; richness, species richness. *, p < 0.05; ***, p < 0.001.
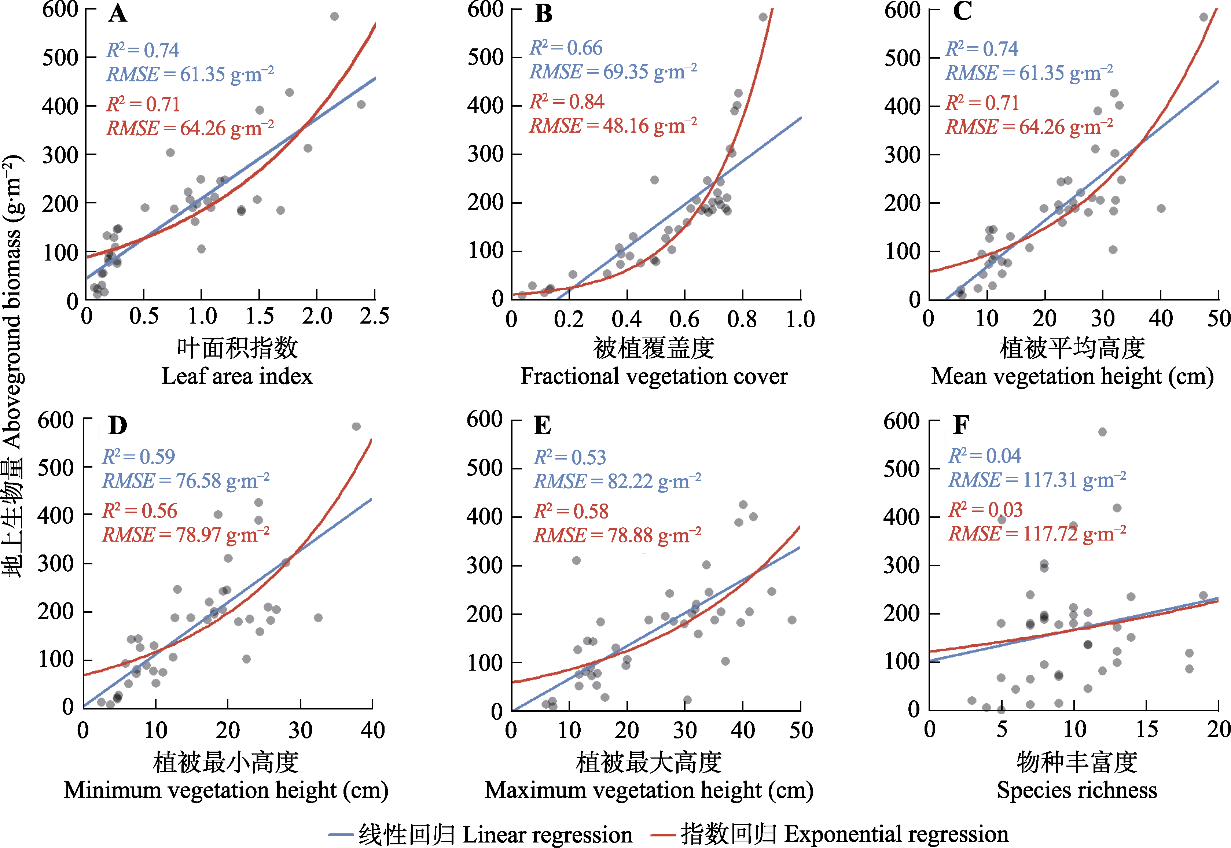
图3 草地地上生物量一元回归模型的预测结果。决定系数(R2)和均方根误差(RMSE)以对应的颜色显示。
Fig. 3 Prediction results of univariate regression model of grassland aboveground biomass. The determination coefficient (R2) and root-mean-square error (RMSE) from linear regression (blue) and exponential regression (red) are given.
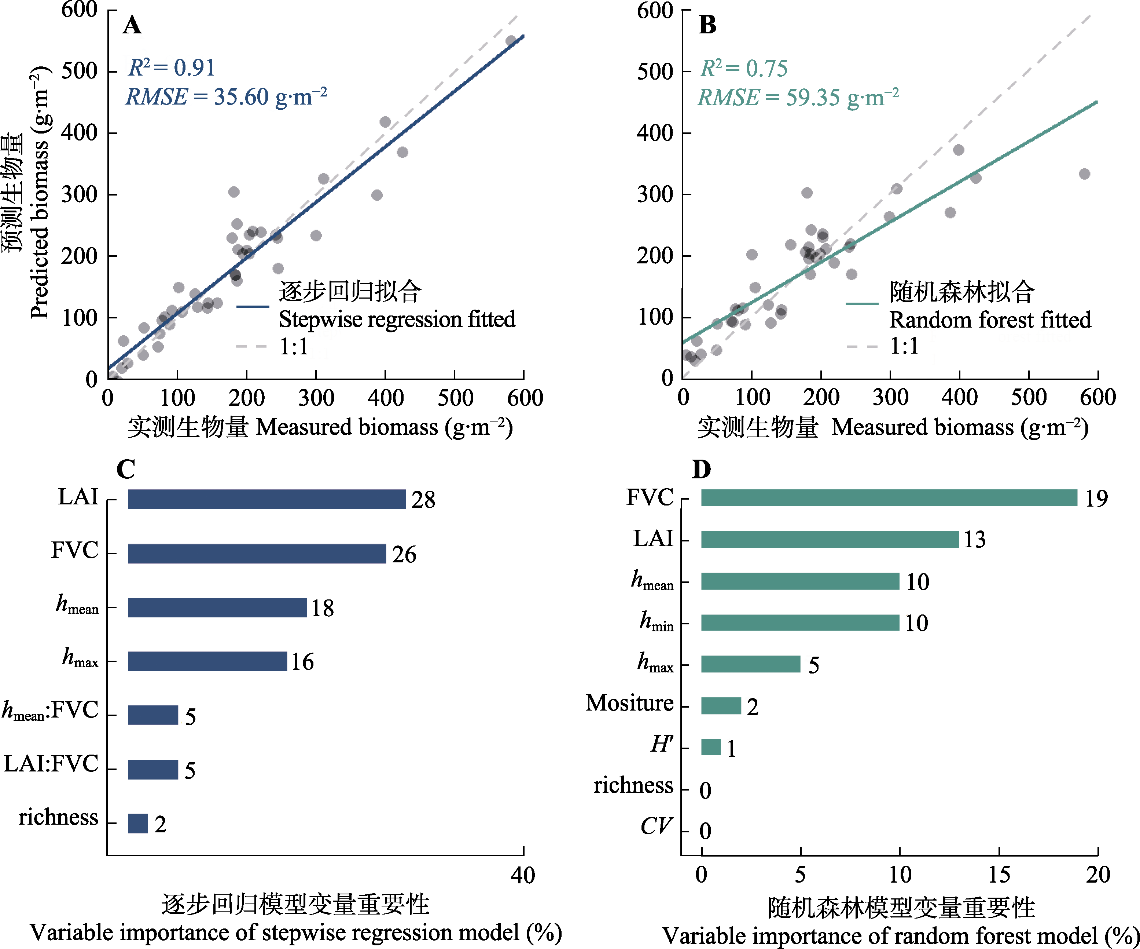
图4 草地地上生物量预测模型及变量相对重要性。蓝色实线代表逐步回归模型(A)的拟合线, 绿色实线代表随机森林模型(B)的拟合线, 灰色虚线为1:1线, 对应模型的决定系数(R2)和均方根误差(RMSE)在左上角进行标示。模型变量重要性: 逐步回归模型(C), 随机森林模型(D)。条柱旁边的数字代表变量对应的相对重要性, 冒号连接的变量代表变量间的交互作用; 逐步回归模型的变量重要性来源于不同变量对R2的贡献, 随机森林模型的变量重要性来源于均值递减精度的方法。CV, 高度变异系数; FVC, 植被覆盖度; hmean, 植被平均高度; hmax, 植被最大高度; hmin, 植被最小高度; H', 香农-维纳多样性指数; LAI, 叶面积指数。
Fig. 4 Grassland aboveground biomass prediction models and relative importance of variables. The blue and green solid lines represent the fitted lines of the stepwise regression model (A) and random forest model (B), respectively; the grey dashed line denotes the 1:1 line. The determination coefficient (R2) and root mean square error (RMSE) of the two models are also marked by the corresponding color. The relative importance of variables in the stepwise regression model (C) and random forest model (D) are shown; numbers next to the bars indicate the relative importance of each variable; variables connected by colons represent interactions between variables; the variable importance of stepwise regression model is derived from the contributions of different variables to R2, and the variable importance of random forest model is derived from the mean decrease accuracy. CV, coefficient of variation for vegetation height; FVC, fractional vegetation cover; hmean, mean vegetation height; hmax, maximum vegetation height; hmin, minimum vegetation height; H', Shannon-Wiener index; LAI, leaf area index.
| [1] |
Abrougui K, Gabsi K, Mercatoris B, Khemis C, Amami R, Chehaibi S. (2019). Prediction of organic potato yield using tillage systems and soil properties by artificial neural network (ANN) and multiple linear regressions (MLR). Soil and Tillage Research, 190, 202-208.
DOI |
| [2] | Bai YF, Zhao YJ, Wang Y, Zhou KL. (2020). Assessment of ecosystem services and ecological regionalization of grasslands support establishment of ecological security barriers in Northern China. Bulletin of Chinese Academy of Sciences, 35, 675-689. |
| [白永飞, 赵玉金, 王扬, 周楷玲 (2020). 中国北方草地生态系统服务评估和功能区划助力生态安全屏障建设. 中国科学院院刊, 35, 675-689.] | |
| [3] |
Breiman L. (2001). Random forests. Machine Learning, 45, 5-32.
DOI URL |
| [4] | Catchpole WR, Wheeler CJ. (1992). Estimating plant biomass: a review of techniques. Australian Journal of Ecology, 17, 121-131. |
| [5] |
Chen DM, Xing W, Lan ZC, Saleem M, Wu Y, Hu SJ, Bai YF. (2019). Direct and indirect effects of nitrogen enrichment on soil organisms and carbon and nitrogen mineralization in a semi-arid grassland. Functional Ecology, 33, 175-187.
DOI URL |
| [6] | Chen JM, Black TA. (1992). Defining leaf area index for non-flat leaves. Plant, Cell & Environment, 15, 421-429. |
| [7] |
Cooper S, Roy D, Schaaf C, Paynter I. (2017). Examination of the potential of terrestrial laser scanning and structure- from-motion photogrammetry for rapid nondestructive field measurement of grass biomass. Remote Sensing, 9, 531. DOI: 10.3390/rs9060531.
DOI |
| [8] |
Cutler DR, Edwards TC, Beard KH, Cutler A, Hess KT, Gibson J, Lawler JJ. (2007). Random forests for classification in ecology. Ecology, 88, 2783-2792.
DOI PMID |
| [9] |
Dusseux P, Hubert-Moy L, Corpetti T, Vertès F. (2015). Evaluation of SPOT imagery for the estimation of grassland biomass. International Journal of Applied Earth Observation and Geoinformation, 38, 72-77.
DOI URL |
| [10] |
Fang HL, Frederic B, Plummer S, Schaepman-Strub G. (2019). An overview of global leaf area index (LAI): methods, products, validation, and applications. Reviews of Geophysics, 57, 739-799.
DOI URL |
| [11] |
Fang HL, Li SJ, Zhang YH, Wei SS, Wang Y. (2021). New insights of global vegetation structural properties through an analysis of canopy clumping index, fractional vegetation cover, and leaf area index. Science of Remote Sensing, 4, 100027. DOI: 10.1016/j.srs.2021.100027.
DOI |
| [12] |
Fang JY, Yang YH, Ma WH, Mohammat A, Shen HH. (2010). Ecosystem carbon stocks and their changes in China’s grasslands. Science China Life Sciences, 53, 757-765.
DOI URL |
| [13] |
Friedl MA, Schimel DS, Michaelsen J, Davis FW, Walker H. (1994). Estimating grassland biomass and leaf area index using ground and satellite data. International Journal of Remote Sensing, 15, 1401-1420.
DOI URL |
| [14] |
Gao XX, Dong SK, Li S, Xu YD, Liu SL, Zhao HD, Yeomans J, Li Y, Shen H, Wu SN, Zhi YL. (2020). Using the random forest model and validated MODIS with the field spectrometer measurement promote the accuracy of estimating aboveground biomass and coverage of alpine grasslands on the Qinghai-Tibetan Plateau. Ecological Indicators, 112, 106114. DOI: 10.1016/j.ecolind.2020.106114.
DOI |
| [15] | Ge J, Meng BP, Yang SX, Gao JL, Feng QS, Liang TG, Huang XD, Gao XH, Li WL, Zhang RP, Wang YL. (2017). Dynamic monitoring of alpine grassland coverage based on UAV technology and MODIS remote sensing data—A case study in the headwaters of the Yellow River. Acta Prataculturae Sinica, 26(3), 1-12. |
| [葛静, 孟宝平, 杨淑霞, 高金龙, 冯琦胜, 梁天刚, 黄晓东, 高新华, 李文龙, 张仁平, 王云龙 (2017). 基于UAV技术和MODIS遥感数据的高寒草地盖度动态变化监测研究——以黄河源东部地区为例. 草业学报, 26(3), 1-12.] | |
| [16] |
Genuer R, Poggi JM, Tuleau-Malot C. (2010). Variable selection using random forests. Pattern Recognition Letters, 31, 2225-2236.
DOI URL |
| [17] |
Gitelson AA, Kaufman YJ, Stark R, Rundquist D. (2002). Novel algorithms for remote estimation of vegetation fraction. Remote Sensing of Environment, 80, 76-87.
DOI URL |
| [18] | Hu JB, Zhang L, Huang W, Wu SH, Liu CB. (2011). Quickly determining grassland cover using the digital image. Pratacultural Science, 28, 1661-1665. |
| [胡健波, 张璐, 黄伟, 吴世红, 刘长兵 (2011). 基于数码照片的草地植被覆盖度快速提取方法. 草业科学, 28, 1661-1665.] | |
| [19] | Jacquemoud S, Verhoef W, Baret F, Bacour C, Zarco-Tejada PJ, Asner GP, François C, Ustin SL. (2009). PROSPECT+ SAIL models: a review of use for vegetation characterization. Remote Sensing of Environment, 113, S56-S66. |
| [20] |
Jia Z, Li P, Wu YT, Yang S, Wang CZ, Wang B, Yang L, Wang X, Li J, Peng ZY, Guo LL, Liu WX, Liu LL. (2021). Deepened snow cover alters biotic and abiotic controls on nitrogen loss during non-growing season in temperate grasslands. Biology and Fertility of Soils, 57, 165-177.
DOI URL |
| [21] |
Jin C, Song G., Shen M., Tang Y., Matsushita B. (2009). Estimating aboveground biomass of grassland having a high canopy cover: an exploratory analysis of in situ hyperspectral data. International Journal of Remote Sensing, 30, 6497-6517.
DOI URL |
| [22] |
Khatami R, Mountrakis G, Stehman SV. (2016). A meta-analysis of remote sensing research on supervised pixel-based land-cover image classification processes: general guidelines for practitioners and future research. Remote Sensing of Environment, 177, 89-100.
DOI URL |
| [23] |
Li P, Sayer EJ, Jia Z, Wu YT, Deng MF, Wang X, Liu C, Wang B, Wang Y, Bai YF, Liu LL. (2021). Deepened snow cover mitigates soil carbon loss from intensive land-use in a semi-arid temperate grassland. Functional Ecology, 36, 635-645.
DOI URL |
| [24] | Li XH. (2013). Using “random forest” for classification and regression. Chinese Journal of Applied Entomology, 50, 1190-1197. |
| [李欣海 (2013). 随机森林模型在分类与回归分析中的应用. 应用昆虫学报, 50, 1190-1197.] | |
| [25] | Li XH. (2019). Random forest is a specific algorithm, not omnipotent for all datasets. Chinese Journal of Applied Entomology, 56, 170-179. |
| [李欣海 (2019). 随机森林是特点鲜明的模型, 不是万能的模型. 应用昆虫学报, 56, 170-179.] | |
| [26] |
Liang TG, Yang SX, Feng QS, Liu BK, Zhang RP, Huang XD, Xie HJ. (2016). Multi-factor modeling of above-ground biomass in alpine grassland: a case study in the Three- River Headwaters Region, China. Remote Sensing of Environment, 186, 164-172.
DOI URL |
| [27] |
Ma WH, Fang JY, Yang YH, Mohammat A. (2010). Biomass carbon stocks and their changes in northern China’s grasslands during 1982-2006. Science China Life Sciences, 53, 841-850.
DOI URL |
| [28] | Piao SL, Fang JY, He JS, Xiao Y. (2004). Spatial distribution of grassland biomass in China. Acta Phytoecologica Sinica, 28, 491-498. |
|
[朴世龙, 方精云, 贺金生, 肖玉 (2004). 中国草地植被生物量及其空间分布格局. 植物生态学报, 28, 491-498.]
DOI |
|
| [29] |
Sanaei A, Ali A, Ahmadaali K, Jahantab E. (2019). Generalized and species-specific prediction models for aboveground biomass in semi-steppe rangelands. Journal of Plant Ecology, 12, 428-437.
DOI |
| [30] | Shen HH, Zhu YK, Zhao X, Geng XQ, Gao SQ, Fang JY. (2016). Analysis of current grassland resources in China. Chinese Science Bulletin, 61, 139-154. |
| [沈海花, 朱言坤, 赵霞, 耿晓庆, 高树琴, 方精云 (2016). 中国草地资源的现状分析. 科学通报, 61, 139-154.] | |
| [31] |
Spehn EM, Joshi J, Schmid B, Diemer M, Körner C. (2000). Above-ground resource use increases with plant species richness in experimental grassland ecosystems. Functional Ecology, 14, 326-337.
DOI URL |
| [32] | Stone M. (1977). An asymptotic equivalence of choice of model by cross-validation and Akaike’s criterion. Journal of the Royal Statistical Society: Series B, 39, 44-47. |
| [33] |
Strahler AH. (1980). The use of prior probabilities in maximum likelihood classification of remotely sensed data. Remote Sensing of Environment, 10, 135-163.
DOI URL |
| [34] |
Tappeiner U, Cernusca A. (1989). Canopy structure and light climate of different alpine plant communities: analysis by means of a model. Theoretical and Applied Climatology, 40, 81-92.
DOI URL |
| [35] |
Wang DL, Xin XP, Shao QQ, Brolly M, Zhu ZL, Chen J. (2017). Modeling aboveground biomass in Hulunber grassland ecosystem by using unmanned aerial vehicle discrete lidar. Sensors (Basel), 17, 180. DOI: 10.3390/s17010180.
DOI |
| [36] |
Wang J, Xiao XM, Bajgain R, Starks P, Steiner J, Doughty RB, Chang Q. (2019). Estimating leaf area index and aboveground biomass of grazing pastures using Sentinel-1, Sentinel-2 and Landsat images. Journal of Photogrammetry and Remote Sensing, 154, 189-201.
DOI URL |
| [37] |
Wei XF. (2010). Biomass estimation: a remote sensing approach. Geography Compass, 4, 1635-1647.
DOI URL |
| [38] |
Xu DW, Wang C, Chen J, Shen MG, Shen BB, Yan RR, Li ZW, Karnieli A, Chen JQ, Yan YC, Wang X, Chen BR, Yin DM, Xin XP. (2021). The superiority of the normalized difference phenology index (NDPI) for estimating grassland aboveground fresh biomass. Remote Sensing of Environment, 264, 112578. DOI: 10.1016/j.rse.2021.112578.
DOI |
| [39] |
Xu KX, Su YJ, Liu J, Hu TY, Jin SC, Ma Q, Zhai QP, Wang R, Zhang J, Li YM, Liu HY, Guo QH. (2020). Estimation of degraded grassland aboveground biomass using machine learning methods from terrestrial laser scanning data. Ecological Indicators, 108, 105747. DOI: 10.1016/j.ecolind.2019.105747.
DOI |
| [40] |
Yang SX, Feng QS, Liang TG, Liu BK, Zhang WJ, Xie HJ. (2018). Modeling grassland above-ground biomass based on artificial neural network and remote sensing in the Three-River Headwaters Region. Remote Sensing of Environment, 204, 448-455.
DOI URL |
| [41] | Zhang WB, Fu SH, Liu BY. (2001). Error assessment of visual estimation plant coverage. Journal of Beijing Normal University (Natural Science), 37, 402-408. |
| [章文波, 符素华, 刘宝元 (2001). 目估法测量植被覆盖度的精度分析. 北京师范大学学报(自然科学版), 37, 402-408.] | |
| [42] | Zhang YX, Li XB, Chen YH. (2003). Overview of field and multi-scale remote sensing measurement approaches to grassland vegetation coverage. Advance in Earth Sciences, 18, 85-90. |
|
[张云霞, 李晓兵, 陈云浩 (2003). 草地植被盖度的多尺度遥感与实地测量方法综述. 地球科学进展, 18, 85-90.]
DOI |
| [1] | 陈以恒 玉素甫江·如素力 阿卜杜热合曼·吾斯曼. 2001-2020年天山新疆段草地植被覆盖度时空变化及驱动因素分析[J]. 植物生态学报, 2024, 48(5): 561-576. |
| [2] | 吴瀚, 白洁, 李均力, 古丽•加帕尔, 包安明. 新疆地区植被覆盖度时空变化及其影响因素分析[J]. 植物生态学报, 2024, 48(1): 41-55. |
| [3] | 郑周涛, 张扬建. 1982-2018年青藏高原水分利用效率变化及归因分析[J]. 植物生态学报, 2022, 46(12): 1486-1496. |
| [4] | 刘兵兵, 魏建新, 胡天宇, 杨秋丽, 刘小强, 吴发云, 苏艳军, 郭庆华. 卫星遥感监测产品在中国森林生态系统的验证和不确定性分析——基于海量无人机激光雷达数据[J]. 植物生态学报, 2022, 46(10): 1305-1316. |
| [5] | 汲玉河, 周广胜, 王树东, 王丽霞, 周梦子. 2000-2019年秦岭地区植被生态质量演变特征及 驱动力分析[J]. 植物生态学报, 2021, 45(6): 617-625. |
| [6] | 黄松宇, 贾昕, 郑甲佳, 杨睿智, 牟钰, 袁和第. 中国典型陆地生态系统波文比特征及影响因素[J]. 植物生态学报, 2021, 45(2): 119-130. |
| [7] | 张文强, 罗格平, 郑宏伟, 王浩, HAMDI Rafiq, 何惠丽, 蔡鹏, 陈春波. 基于随机森林模型的内陆干旱区植被指数变化与驱动力分析: 以北天山北坡中段为例[J]. 植物生态学报, 2020, 44(11): 1113-1126. |
| [8] | 张雪皎, 高贤明, 吉成均, 康慕谊, 王仁卿, 岳明, 张峰, 唐志尧. 中国北方5种栎属树木多度分布及其对未来气候变化的响应[J]. 植物生态学报, 2019, 43(9): 774-782. |
| [9] | 杨焕莹, 宋建达, 周焘, 金光泽, 姜峰, 刘志理. 林分、土壤及空间因子对谷地云冷杉林叶面积指数空间异质性的影响[J]. 植物生态学报, 2019, 43(4): 342-351. |
| [10] | 刘泽彬, 王彦辉, 刘宇, 田奥, 王亚蕊, 左海军. 宁夏六盘山半湿润区华北落叶松林冠层叶面积指数的时空变化及坡面尺度效应[J]. 植物生态学报, 2017, 41(7): 749-760. |
| [11] | 高林, 王晓菲, 顾行发, 田庆久, 焦俊男, 王培燕, 李丹. 植冠下土壤类型差异对遥感估算冬小麦叶面积指数的影响[J]. 植物生态学报, 2017, 41(12): 1273-1288. |
| [12] | 周明, 刘志理, 金光泽. 利用3种校正方案提高间接法测定兴安落叶松人工林叶面积指数的精度[J]. 植物生态学报, 2016, 40(6): 574-584. |
| [13] | 朱绪超, 袁国富, 邵明安, 易小波, 杜涛. 塔里木河下游河岸带植被的空间结构特征[J]. 植物生态学报, 2015, 39(11): 1053-1061. |
| [14] | 刘志理, 金光泽, 周明. 利用直接法和间接法测定针阔混交林叶面积指数的季节动态[J]. 植物生态学报, 2014, 38(8): 843-856. |
| [15] | 穆少杰, 周可新, 齐杨, 陈奕兆, 方颖, 朱超. 内蒙古植被降水利用效率的时空格局及其驱动因素[J]. 植物生态学报, 2014, 38(1): 1-16. |
| 阅读次数 | ||||||
|
全文 |
|
|||||
|
摘要 |
|
|||||
Copyright © 2026 版权所有 《植物生态学报》编辑部
地址: 北京香山南辛村20号, 邮编: 100093
Tel.: 010-62836134, 62836138; Fax: 010-82599431; E-mail: apes@ibcas.ac.cn, cjpe@ibcas.ac.cn
备案号: 京ICP备16067583号-19
![]()