
植物生态学报 ›› 2018, Vol. 42 ›› Issue (12): 1168-1178.DOI: 10.17521/cjpe.2018.0196
所属专题: 植物功能性状
朱弘,朱淑霞,李涌福,伊贤贵,段一凡,王贤荣( )
)
收稿日期:2018-08-10
修回日期:2018-11-02
出版日期:2018-12-20
发布日期:2019-04-04
通讯作者:
王贤荣 ORCID: 0000-0003-4048-2748
基金资助:
ZHU Hong,ZHU Shu-Xia,LI Yong-Fu,YI Xian-Gui,DUAN Yi-Fan,WANG Xian-Rong()
Received:2018-08-10
Revised:2018-11-02
Online:2018-12-20
Published:2019-04-04
Contact:
WANG Xian-Rong ORCID: 0000-0003-4048-2748
摘要:
为揭示中国特有植物尾叶樱桃(Cerasus dielsiana)在现代核心分布区天然种群的叶表型地理变异规律及其生态适应性特征, 该研究通过多重比较、巢氏方差分析、相关性分析、主成分分析(PCA)、主坐标分析(PCoA)、非加权配对算术平均法(UPGMA)聚类分析等数理方法, 对来自四川、湖北、湖南、江西、台湾5省8个尾叶樱桃天然种群的11个叶表型性状进行了比较分析, 研究其不同地理单元间叶表型多样性和地理变异规律及对地理气候的响应。结果显示: 1)尾叶樱桃主要叶表型性状变异在种群内和种群间均存在显著差异, 平均变异系数为22.44%, 其中变异系数最大和最小的分别为叶面积(50.83%)与一级侧脉数(7.96%); 平均叶表型性状的分化系数为30.78%, 种群内的变异(51.55%)大于种群间的变异(22.55%)。2) PCA表明对尾叶樱桃叶表型性状变异起主要贡献作用的前三大主成分累计贡献率达到92.400%, 可以综合概括和排序为“大小性状” (73.242%)与“形状性状” (19.158%)。3)叶宽(r = -0.641)、叶面积(r = -0.658)和一级侧脉数(r = 0.659)性状均与经度呈显著负相关或正相关关系, 气温季节变化和最湿季降水量对叶表型性状变异影响较大。4)基于PCoA和UPGMA聚类分析可将8个天然种群划分为4类。尾叶樱桃天然种群叶表型性状变异丰富, 在数量上表现出一定的连续性, “大小性状”是性状间变异的主要来源, 平均表型分化处于中等程度水平, 种群内是叶表型性状变异的主要来源; 各种群间表型分化划分结果与地理位置基本一致, 在地理空间上呈现以经度为主的梯度变异模式, “气候变异性”与“展叶期降水量”是驱动叶表型性状变异的主要气候因子, 推测这是尾叶樱桃在长期进化中与亚热带季风气候环境相适应的结果。
朱弘, 朱淑霞, 李涌福, 伊贤贵, 段一凡, 王贤荣. 尾叶樱桃天然种群叶表型性状变异研究. 植物生态学报, 2018, 42(12): 1168-1178. DOI: 10.17521/cjpe.2018.0196
ZHU Hong, ZHU Shu-Xia, LI Yong-Fu, YI Xian-Gui, DUAN Yi-Fan, WANG Xian-Rong. Leaf phenotypic variation in natural populations of Cerasus dielsiana. Chinese Journal of Plant Ecology, 2018, 42(12): 1168-1178. DOI: 10.17521/cjpe.2018.0196
| 代码 Code | 气候变量 Climatic variables | 特征值 Eigenvalue | 作为第1主成分的贡献率 Variance contribution rate as first principal component (%) |
|---|---|---|---|
| bio4 | 气温季节变化 Temperature seasonality (SD × 100) | -0.151 | 97.459% |
| bio12 | 年降水量 Annual precipitation (mm) | 0.784 | |
| bio16 | 最湿季降水量 Precipitation of wettest quarter (mm) | 0.420 | |
| bio18 | 最暖季降水量 Precipitation of warmest quarter (mm) | 0.403 |
表1 主成分分析(PCA)筛选后影响尾叶樱桃的4个主导气候变量及其贡献率
Table 1 Four dominant climatic variables that affect Cerasus dielsiana after principal component analysis (PCA) screening and its contributions
| 代码 Code | 气候变量 Climatic variables | 特征值 Eigenvalue | 作为第1主成分的贡献率 Variance contribution rate as first principal component (%) |
|---|---|---|---|
| bio4 | 气温季节变化 Temperature seasonality (SD × 100) | -0.151 | 97.459% |
| bio12 | 年降水量 Annual precipitation (mm) | 0.784 | |
| bio16 | 最湿季降水量 Precipitation of wettest quarter (mm) | 0.420 | |
| bio18 | 最暖季降水量 Precipitation of warmest quarter (mm) | 0.403 |
| 种群 Population | 纬度 Latitude (N) | 经度 Longitude (E) | 平均海拔 Mean altitude (m) | 气温季节变化 Temperature Seasonality bio4 (SD × 100) | 年降水量 Annual precipitation bio12 (mm) | 最湿季降水量 Precipitation of wettest quarter bio16 (mm) | 最暖季降水量 Precipitation of warmest quarter bio18 (mm) |
|---|---|---|---|---|---|---|---|
| 四川峨眉山 Mt. Emei, Sichuan (EMS) | 29.57° | 103.37° | 1 365 | 7.53 | 1 264.00 | 92.13 | 710.00 |
| 湖北神农架 Shennongjia, Hubei (SNJ) | 31.45° | 110.25° | 860 | 8.15 | 1 696.00 | 51.61 | 557.00 |
| 湖北星斗山 Mt. Xingdou, Hubei (XDS) | 30.02° | 109.12° | 839 | 8.19 | 1 772.00 | 60.22 | 568.00 |
| 湖南莽山 Mt. Mangshan, Hunan (MS) | 24.97° | 112.88° | 1 228 | 7.66 | 1 492.00 | 56.44 | 601.00 |
| 湖南张家界 Zhangjiajie, Hunan (ZJJ) | 29.32° | 110.42° | 1 118 | 7.91 | 1 591.00 | 62.14 | 556.00 |
| 江西金竹飞瀑 Jinzhufeipu, Jiangxi (JZFP) | 27.00° | 115.92° | 966 | 7.20 | 1 508.00 | 60.26 | 609.00 |
| 江西仙姑坛 Xiangutan, Jiangxi (XGT) | 28.45° | 114.38° | 1 364 | 6.86 | 1 405.00 | 62.72 | 591.00 |
| 台湾阿里山 Mt. Ali, Taiwan (ALS) | 23.50° | 120.80° | 1 182 | 8.20 | 3 747.00 | 80.66 | 1 780.00 |
表2 尾叶樱桃8个天然种群的地理位置及主导气候因子特征
Table 2 Geographical locations of the eight natural populations of Cerasus dielsiana and characters of dominant climatic factors
| 种群 Population | 纬度 Latitude (N) | 经度 Longitude (E) | 平均海拔 Mean altitude (m) | 气温季节变化 Temperature Seasonality bio4 (SD × 100) | 年降水量 Annual precipitation bio12 (mm) | 最湿季降水量 Precipitation of wettest quarter bio16 (mm) | 最暖季降水量 Precipitation of warmest quarter bio18 (mm) |
|---|---|---|---|---|---|---|---|
| 四川峨眉山 Mt. Emei, Sichuan (EMS) | 29.57° | 103.37° | 1 365 | 7.53 | 1 264.00 | 92.13 | 710.00 |
| 湖北神农架 Shennongjia, Hubei (SNJ) | 31.45° | 110.25° | 860 | 8.15 | 1 696.00 | 51.61 | 557.00 |
| 湖北星斗山 Mt. Xingdou, Hubei (XDS) | 30.02° | 109.12° | 839 | 8.19 | 1 772.00 | 60.22 | 568.00 |
| 湖南莽山 Mt. Mangshan, Hunan (MS) | 24.97° | 112.88° | 1 228 | 7.66 | 1 492.00 | 56.44 | 601.00 |
| 湖南张家界 Zhangjiajie, Hunan (ZJJ) | 29.32° | 110.42° | 1 118 | 7.91 | 1 591.00 | 62.14 | 556.00 |
| 江西金竹飞瀑 Jinzhufeipu, Jiangxi (JZFP) | 27.00° | 115.92° | 966 | 7.20 | 1 508.00 | 60.26 | 609.00 |
| 江西仙姑坛 Xiangutan, Jiangxi (XGT) | 28.45° | 114.38° | 1 364 | 6.86 | 1 405.00 | 62.72 | 591.00 |
| 台湾阿里山 Mt. Ali, Taiwan (ALS) | 23.50° | 120.80° | 1 182 | 8.20 | 3 747.00 | 80.66 | 1 780.00 |
| 叶表型性状 Leaf phenotypic trait | 种群 Population | |||||||||
|---|---|---|---|---|---|---|---|---|---|---|
| EMS | SNJ | XDS | MS | ZJJ | JZFP | XGT | ALS | 平均值 Mean | 变异系数 CV (%) | |
| 叶长 LL (mm) | 88.80 ± 22.85a | 79.08 ± 8.62b | 83.40 ± 17.18ab | 87.48 ± 11.27a | 89.63 ± 12.56a | 54.57 ± 12.41d | 62.87 ± 8.19c | 69.17 ± 9.14c | 76.94 | 23.61 |
| 叶宽 LW (mm) | 43.95 ± 8.73a | 37.15 ± 5.44bc | 33.90 ± 9.02c | 34.93 ± 4.96bc | 38.92 ± 8.12b | 22.64 ± 6.34e | 26.68 ± 4.44d | 37.43 ± 3.93bc | 34.45 | 26.39 |
| 叶长宽比 LWR | 2.01 ± 0.21c | 2.15 ± 0.19c | 2.50 ± 0.27ab | 2.53 ± 0.35a | 2.36 ± 0.38b | 2.44 ± 0.27ab | 2.37 ± 0.19b | 1.86 ± 0.14d | 2.28 | 14.93 |
| 叶柄长 PL (mm) | 11.84 ± 3.86a | 8.86 ± 1.49b | 7.59 ± 2.46cd | 11.10 ± 2.11a | 8.25 ± 1.60bc | 6.63 ± 1.35d | 8.53 ± 0.89bc | 7.54 ± 0.89cd | 8.80 | 29.92 |
| 叶面积 LA (mm2) | 2 746.99 ± 1 337.93a | 1 870.77 ± 476.40bc | 2 045.84 ± 1 040.24bc | 2 020.51 ± 516.34bc | 2 306.43 ± 829.25a | 890.91 ± 463.20f | 1 095.62 ± 295.07e | 1 826.66 ± 482.46d | 1 846.13 | 50.83 |
| 叶周长 LP (mm) | 213.94 ± 50.90a | 183.08 ± 21.64cd | 191.98 ± 44.07bc | 198.99 ± 24.00abc | 207.05 ± 32.44ab | 127.23 ± 29.26e | 146.15 ± 18.91d | 171.85 ± 22.61c | 179.81 | 23.77 |
| 叶形指数 LI | 0.73 ± 0.04b | 0.69 ± 0.05c | 0.65 ± 0.05d | 0.63 ± 0.06d | 0.65 ± 0.07d | 0.64 ± 0.06d | 0.63 ± 0.03d | 0.77 ± 0.03a | 0.67 | 8.90 |
| 一级侧脉数 PLV | 11.00 ± 0.46c | 12.00 ± 0.71b | 12.00 ± 1.32b | 12.00 ± 0.44b | 12.00 ± 0.70b | 12.00 ± 0.77b | 13.00 ± 0.46a | 13.00 ± 0.34a | 11.88 | 7.96 |
| 叶脉密度 VD | 0.06 ± 0.01d | 0.07 ± 0.01c | 0.07 ± 0.01c | 0.07 ± 0.01cd | 0.07 ± 0.03cd | 0.11 ± 0.01a | 0.10 ± 0.01b | 0.10 ± 0.01b | 0.08 | 24.42 |
| 叶尖夹角 AA (°) | 27.57 ± 3.42cd | 28.99 ± 3.5bc | 28.54 ± 4.36bc | 24.56 ± 2.79e | 31.02 ± 5.67b | 25.22 ± 7.02de | 22.99 ± 2.64e | 40.24 ± 4.46a | 28.64 | 22.87 |
| 叶基夹角 BA (°) | 114.47 ± 14.05b | 114.88 ± 11.04b | 113.87 ± 14.78b | 128.34 ± 8.24a | 103.60 ± 9.34c | 121.53 ± 17.54b | 116.68 ± 15.03b | 130.67 ± 13.33a | 116.72 | 13.31 |
| 平均值 Mean | - | - | - | - | - | - | - | - | - | 22.44 |
表3 尾叶樱桃8个天然种群11个叶表型性状的变异情况
Table 3 Variations of eleven leaf phenotypic traits among eight natural populations of Cerasus dielsiana
| 叶表型性状 Leaf phenotypic trait | 种群 Population | |||||||||
|---|---|---|---|---|---|---|---|---|---|---|
| EMS | SNJ | XDS | MS | ZJJ | JZFP | XGT | ALS | 平均值 Mean | 变异系数 CV (%) | |
| 叶长 LL (mm) | 88.80 ± 22.85a | 79.08 ± 8.62b | 83.40 ± 17.18ab | 87.48 ± 11.27a | 89.63 ± 12.56a | 54.57 ± 12.41d | 62.87 ± 8.19c | 69.17 ± 9.14c | 76.94 | 23.61 |
| 叶宽 LW (mm) | 43.95 ± 8.73a | 37.15 ± 5.44bc | 33.90 ± 9.02c | 34.93 ± 4.96bc | 38.92 ± 8.12b | 22.64 ± 6.34e | 26.68 ± 4.44d | 37.43 ± 3.93bc | 34.45 | 26.39 |
| 叶长宽比 LWR | 2.01 ± 0.21c | 2.15 ± 0.19c | 2.50 ± 0.27ab | 2.53 ± 0.35a | 2.36 ± 0.38b | 2.44 ± 0.27ab | 2.37 ± 0.19b | 1.86 ± 0.14d | 2.28 | 14.93 |
| 叶柄长 PL (mm) | 11.84 ± 3.86a | 8.86 ± 1.49b | 7.59 ± 2.46cd | 11.10 ± 2.11a | 8.25 ± 1.60bc | 6.63 ± 1.35d | 8.53 ± 0.89bc | 7.54 ± 0.89cd | 8.80 | 29.92 |
| 叶面积 LA (mm2) | 2 746.99 ± 1 337.93a | 1 870.77 ± 476.40bc | 2 045.84 ± 1 040.24bc | 2 020.51 ± 516.34bc | 2 306.43 ± 829.25a | 890.91 ± 463.20f | 1 095.62 ± 295.07e | 1 826.66 ± 482.46d | 1 846.13 | 50.83 |
| 叶周长 LP (mm) | 213.94 ± 50.90a | 183.08 ± 21.64cd | 191.98 ± 44.07bc | 198.99 ± 24.00abc | 207.05 ± 32.44ab | 127.23 ± 29.26e | 146.15 ± 18.91d | 171.85 ± 22.61c | 179.81 | 23.77 |
| 叶形指数 LI | 0.73 ± 0.04b | 0.69 ± 0.05c | 0.65 ± 0.05d | 0.63 ± 0.06d | 0.65 ± 0.07d | 0.64 ± 0.06d | 0.63 ± 0.03d | 0.77 ± 0.03a | 0.67 | 8.90 |
| 一级侧脉数 PLV | 11.00 ± 0.46c | 12.00 ± 0.71b | 12.00 ± 1.32b | 12.00 ± 0.44b | 12.00 ± 0.70b | 12.00 ± 0.77b | 13.00 ± 0.46a | 13.00 ± 0.34a | 11.88 | 7.96 |
| 叶脉密度 VD | 0.06 ± 0.01d | 0.07 ± 0.01c | 0.07 ± 0.01c | 0.07 ± 0.01cd | 0.07 ± 0.03cd | 0.11 ± 0.01a | 0.10 ± 0.01b | 0.10 ± 0.01b | 0.08 | 24.42 |
| 叶尖夹角 AA (°) | 27.57 ± 3.42cd | 28.99 ± 3.5bc | 28.54 ± 4.36bc | 24.56 ± 2.79e | 31.02 ± 5.67b | 25.22 ± 7.02de | 22.99 ± 2.64e | 40.24 ± 4.46a | 28.64 | 22.87 |
| 叶基夹角 BA (°) | 114.47 ± 14.05b | 114.88 ± 11.04b | 113.87 ± 14.78b | 128.34 ± 8.24a | 103.60 ± 9.34c | 121.53 ± 17.54b | 116.68 ± 15.03b | 130.67 ± 13.33a | 116.72 | 13.31 |
| 平均值 Mean | - | - | - | - | - | - | - | - | - | 22.44 |
| 叶表型性状 Leaf phenotypic trait | 均方 Mean square | F值 F value | |||
|---|---|---|---|---|---|
| 种群间 Among polulations | 种群内 Within polulations | 随机误差 Random errors | 种群间 Among polulations | 种群内 Within polulations | |
| LL (mm) | 174.11 | 333.09 | 203.98 | 23.41** | 44.79** |
| LW (mm) | 41.10 | 83.58 | 47.29 | 27.00** | 54.91** |
| LWR | 0.16 | 0.12 | 0.07 | 21.94** | 16.46** |
| PL (mm) | 6.80 | 18.95 | 4.21 | 19.45** | 54.20** |
| LA (mm2) | 442 870.00 | 889 674.00 | 636 437.00 | 16.55** | 33.25** |
| LP (mm) | 262.46 | 1 858.26 | 1 160.49 | 22.60** | 117.18** |
| LI | 0.01 | 0.00 | 0.00 | 24.74** | 11.63** |
| PLV | 3.46 | 0.84 | 0.47 | 23.06** | 5.60 |
| VD | 0.00 | 0.00 | 0.00 | 43.74** | 55.25** |
| AA (°) | 30.31 | 42.98 | 19.13 | 39.61** | 56.17** |
| BA (°) | 905.20 | 227.54 | 159.85 | 10.97** | 2.76 |
表4 尾叶樱桃8个天然种群11个叶表型性状的巢氏方差分析
Table 4 Nested variance analysis of eleven leaf phenotypic traits among eight natural populations of Cerasus dielsiana
| 叶表型性状 Leaf phenotypic trait | 均方 Mean square | F值 F value | |||
|---|---|---|---|---|---|
| 种群间 Among polulations | 种群内 Within polulations | 随机误差 Random errors | 种群间 Among polulations | 种群内 Within polulations | |
| LL (mm) | 174.11 | 333.09 | 203.98 | 23.41** | 44.79** |
| LW (mm) | 41.10 | 83.58 | 47.29 | 27.00** | 54.91** |
| LWR | 0.16 | 0.12 | 0.07 | 21.94** | 16.46** |
| PL (mm) | 6.80 | 18.95 | 4.21 | 19.45** | 54.20** |
| LA (mm2) | 442 870.00 | 889 674.00 | 636 437.00 | 16.55** | 33.25** |
| LP (mm) | 262.46 | 1 858.26 | 1 160.49 | 22.60** | 117.18** |
| LI | 0.01 | 0.00 | 0.00 | 24.74** | 11.63** |
| PLV | 3.46 | 0.84 | 0.47 | 23.06** | 5.60 |
| VD | 0.00 | 0.00 | 0.00 | 43.74** | 55.25** |
| AA (°) | 30.31 | 42.98 | 19.13 | 39.61** | 56.17** |
| BA (°) | 905.20 | 227.54 | 159.85 | 10.97** | 2.76 |
| 叶表型性状 Leaf phenotypic trait | 方差分量 Variance component | 方差分量百分比 Percentage of variance component (%) | 表型分化系数 Phenotype differentiation coefficient (%) | ||||
|---|---|---|---|---|---|---|---|
| 种群间 Among populations | 种群内 Within populations | 随机误差 Random errors | 种群间 Among populations | 种群内 Within populations | 随机误差 Random Errors | ||
| LL (mm) | 6.359 | 25.822 | 13.324 | 13.98 | 56.75 | 29.28 | 19.76 |
| LW (mm) | 1.699 | 7.259 | 3.343 | 13.81 | 59.01 | 27.18 | 18.97 |
| LWR | 0.002 | 0.001 | 0.005 | 29.27 | 60.67 | 29.27 | 14.22 |
| PL (mm) | 0.486 | 0.517 | 0.272 | 38.13 | 40.54 | 21.33 | 48.47 |
| LA (mm2) | 17 872.160 | 50 647.400 | 35 586.960 | 17.17 | 48.65 | 34.18 | 26.08 |
| LP (mm) | 63.832 | 139.554 | 74.330 | 22.98 | 50.25 | 26.76 | 31.38 |
| LI | 0.000 | 0.001 | 0.000 | 22.49 | 55.32 | 22.19 | 28.91 |
| PLV | 0.105 | 0.075 | 0.034 | 15.74 | 35.19 | 15.74 | 58.23 |
| VD | 0.000 | 0.000 | 0.000 | 12.69 | 65.29 | 22.02 | 16.27 |
| AA (°) | 0.507 | 4.771 | 1.719 | 7.25 | 68.18 | 24.57 | 9.61 |
| BA (°) | 22.105 | 13.537 | 9.101 | 54.49 | 27.21 | 18.30 | 66.69 |
| 平均值 Mean | - | - | - | 22.55 | 51.55 | 24.62 | 30.78 |
表5 尾叶樱桃叶表型性状的方差分量与表型分化系数
Table 5 Variance component and phenotypic differentiation coefficient of leaf phenotypic traits among Cerasus dielsiana populations
| 叶表型性状 Leaf phenotypic trait | 方差分量 Variance component | 方差分量百分比 Percentage of variance component (%) | 表型分化系数 Phenotype differentiation coefficient (%) | ||||
|---|---|---|---|---|---|---|---|
| 种群间 Among populations | 种群内 Within populations | 随机误差 Random errors | 种群间 Among populations | 种群内 Within populations | 随机误差 Random Errors | ||
| LL (mm) | 6.359 | 25.822 | 13.324 | 13.98 | 56.75 | 29.28 | 19.76 |
| LW (mm) | 1.699 | 7.259 | 3.343 | 13.81 | 59.01 | 27.18 | 18.97 |
| LWR | 0.002 | 0.001 | 0.005 | 29.27 | 60.67 | 29.27 | 14.22 |
| PL (mm) | 0.486 | 0.517 | 0.272 | 38.13 | 40.54 | 21.33 | 48.47 |
| LA (mm2) | 17 872.160 | 50 647.400 | 35 586.960 | 17.17 | 48.65 | 34.18 | 26.08 |
| LP (mm) | 63.832 | 139.554 | 74.330 | 22.98 | 50.25 | 26.76 | 31.38 |
| LI | 0.000 | 0.001 | 0.000 | 22.49 | 55.32 | 22.19 | 28.91 |
| PLV | 0.105 | 0.075 | 0.034 | 15.74 | 35.19 | 15.74 | 58.23 |
| VD | 0.000 | 0.000 | 0.000 | 12.69 | 65.29 | 22.02 | 16.27 |
| AA (°) | 0.507 | 4.771 | 1.719 | 7.25 | 68.18 | 24.57 | 9.61 |
| BA (°) | 22.105 | 13.537 | 9.101 | 54.49 | 27.21 | 18.30 | 66.69 |
| 平均值 Mean | - | - | - | 22.55 | 51.55 | 24.62 | 30.78 |
| 叶表型性状 Leaf phenotypic trait | 主成分 Main components | 叶表型性状 Leaf phenotypic trait | 主成分 Main components | ||||
|---|---|---|---|---|---|---|---|
| PC1 | PC2 | PC3 | PC1 | PC2 | PC3 | ||
| LL (mm) | 0.312 | -0.093 | -0.268 | PLV | -0.020 | 0.071 | 0.021 |
| LW (mm) | 0.367 | 0.149 | 0.163 | VD | -0.332 | 0.182 | 0.302 |
| LWR | -0.055 | -0.242 | -0.431 | AA (°) | 0.109 | 0.604 | 0.244 |
| PL (mm) | 0.186 | -0.667 | 0.650 | BA (°) | 0.022 | 0.102 | 0.242 |
| LA (mm2) | 0.706 | 0.117 | -0.027 | 特征值 Eigenvalue | 0.092 | 0.015 | 0.011 |
| LP (mm) | 0.327 | -0.039 | -0.139 | 贡献率 Variance contribution rate (%) | 73.242 | 11.319 | 7.839 |
| LI | 0.051 | 0.195 | 0.251 | 累计贡献率 Cumulative Contribution rate (%) | 73.242 | 84.561 | 92.400 |
表6 尾叶樱桃叶表型性状的主成分分析
Table 6 Principal component analysis of leaf phenotypic traits of Cerasus dielsiana
| 叶表型性状 Leaf phenotypic trait | 主成分 Main components | 叶表型性状 Leaf phenotypic trait | 主成分 Main components | ||||
|---|---|---|---|---|---|---|---|
| PC1 | PC2 | PC3 | PC1 | PC2 | PC3 | ||
| LL (mm) | 0.312 | -0.093 | -0.268 | PLV | -0.020 | 0.071 | 0.021 |
| LW (mm) | 0.367 | 0.149 | 0.163 | VD | -0.332 | 0.182 | 0.302 |
| LWR | -0.055 | -0.242 | -0.431 | AA (°) | 0.109 | 0.604 | 0.244 |
| PL (mm) | 0.186 | -0.667 | 0.650 | BA (°) | 0.022 | 0.102 | 0.242 |
| LA (mm2) | 0.706 | 0.117 | -0.027 | 特征值 Eigenvalue | 0.092 | 0.015 | 0.011 |
| LP (mm) | 0.327 | -0.039 | -0.139 | 贡献率 Variance contribution rate (%) | 73.242 | 11.319 | 7.839 |
| LI | 0.051 | 0.195 | 0.251 | 累计贡献率 Cumulative Contribution rate (%) | 73.242 | 84.561 | 92.400 |
| 叶表型性状 Leaf phenotypic trait | 纬度 Latitude (N) | 经度 Longitude (E) | 海拔 Altitude (m) | 气温季节变化Temperature seasonality bio4 (SD × 100) | 年降水量 Annual precipitation bio12 (mm) | 最湿季降水量 Precipitation of wettest quarter bio16 (mm) | 最暖季降水量 Precipitation of warmest quarter bio18 (mm) |
|---|---|---|---|---|---|---|---|
| LL (mm) | 0.163 | -0.554 | 0.091 | -0.613* | -0.008 | 0.221 | -0.017 |
| LW (mm) | 0.284 | -0.641* | 0.176 | 0.545 | 0.002 | 0.443 | 0.057 |
| LWR | -0.363 | 0.431 | -0.260 | -0.098 | -0.028 | -0.600* | -0.175 |
| PL (mm) | -0.094 | -0.469 | 0.430 | 0.006 | -0.151 | 0.482 | 0.040 |
| LA (mm2) | 0.227 | -0.658* | 0.162 | 0.551 | -0.016 | 0.459 | 0.037 |
| LP (mm) | 0.184 | -0.593 | 0.141 | 0.585 | -0.009 | 0.315 | 0.008 |
| LI | 0.347 | -0.535 | 0.093 | 0.340 | 0.084 | 0.651* | 0.206 |
| PLV | -0.248 | 0.659* | 0.087 | -0.395 | 0.118 | -0.499 | 0.017 |
| VD | -0.220 | 0.590 | -0.035 | 0.651* | 0.007 | -0.222 | 0.018 |
| AA (°) | 0.324 | -0.249 | -0.429 | 0.809** | 0.303 | 0.127 | 0.181 |
| BA (°) | -0.478 | 0.168 | 0.277 | -0.090 | 0.059 | -0.075 | 0.121 |
表7 尾叶樱桃叶表型性状与地理、气候因子的Person相关性分析
Table 7 Person correlation analysis among leaf phenotypic traits and geographic-climatic factors of Cerasus dielsiana
| 叶表型性状 Leaf phenotypic trait | 纬度 Latitude (N) | 经度 Longitude (E) | 海拔 Altitude (m) | 气温季节变化Temperature seasonality bio4 (SD × 100) | 年降水量 Annual precipitation bio12 (mm) | 最湿季降水量 Precipitation of wettest quarter bio16 (mm) | 最暖季降水量 Precipitation of warmest quarter bio18 (mm) |
|---|---|---|---|---|---|---|---|
| LL (mm) | 0.163 | -0.554 | 0.091 | -0.613* | -0.008 | 0.221 | -0.017 |
| LW (mm) | 0.284 | -0.641* | 0.176 | 0.545 | 0.002 | 0.443 | 0.057 |
| LWR | -0.363 | 0.431 | -0.260 | -0.098 | -0.028 | -0.600* | -0.175 |
| PL (mm) | -0.094 | -0.469 | 0.430 | 0.006 | -0.151 | 0.482 | 0.040 |
| LA (mm2) | 0.227 | -0.658* | 0.162 | 0.551 | -0.016 | 0.459 | 0.037 |
| LP (mm) | 0.184 | -0.593 | 0.141 | 0.585 | -0.009 | 0.315 | 0.008 |
| LI | 0.347 | -0.535 | 0.093 | 0.340 | 0.084 | 0.651* | 0.206 |
| PLV | -0.248 | 0.659* | 0.087 | -0.395 | 0.118 | -0.499 | 0.017 |
| VD | -0.220 | 0.590 | -0.035 | 0.651* | 0.007 | -0.222 | 0.018 |
| AA (°) | 0.324 | -0.249 | -0.429 | 0.809** | 0.303 | 0.127 | 0.181 |
| BA (°) | -0.478 | 0.168 | 0.277 | -0.090 | 0.059 | -0.075 | 0.121 |
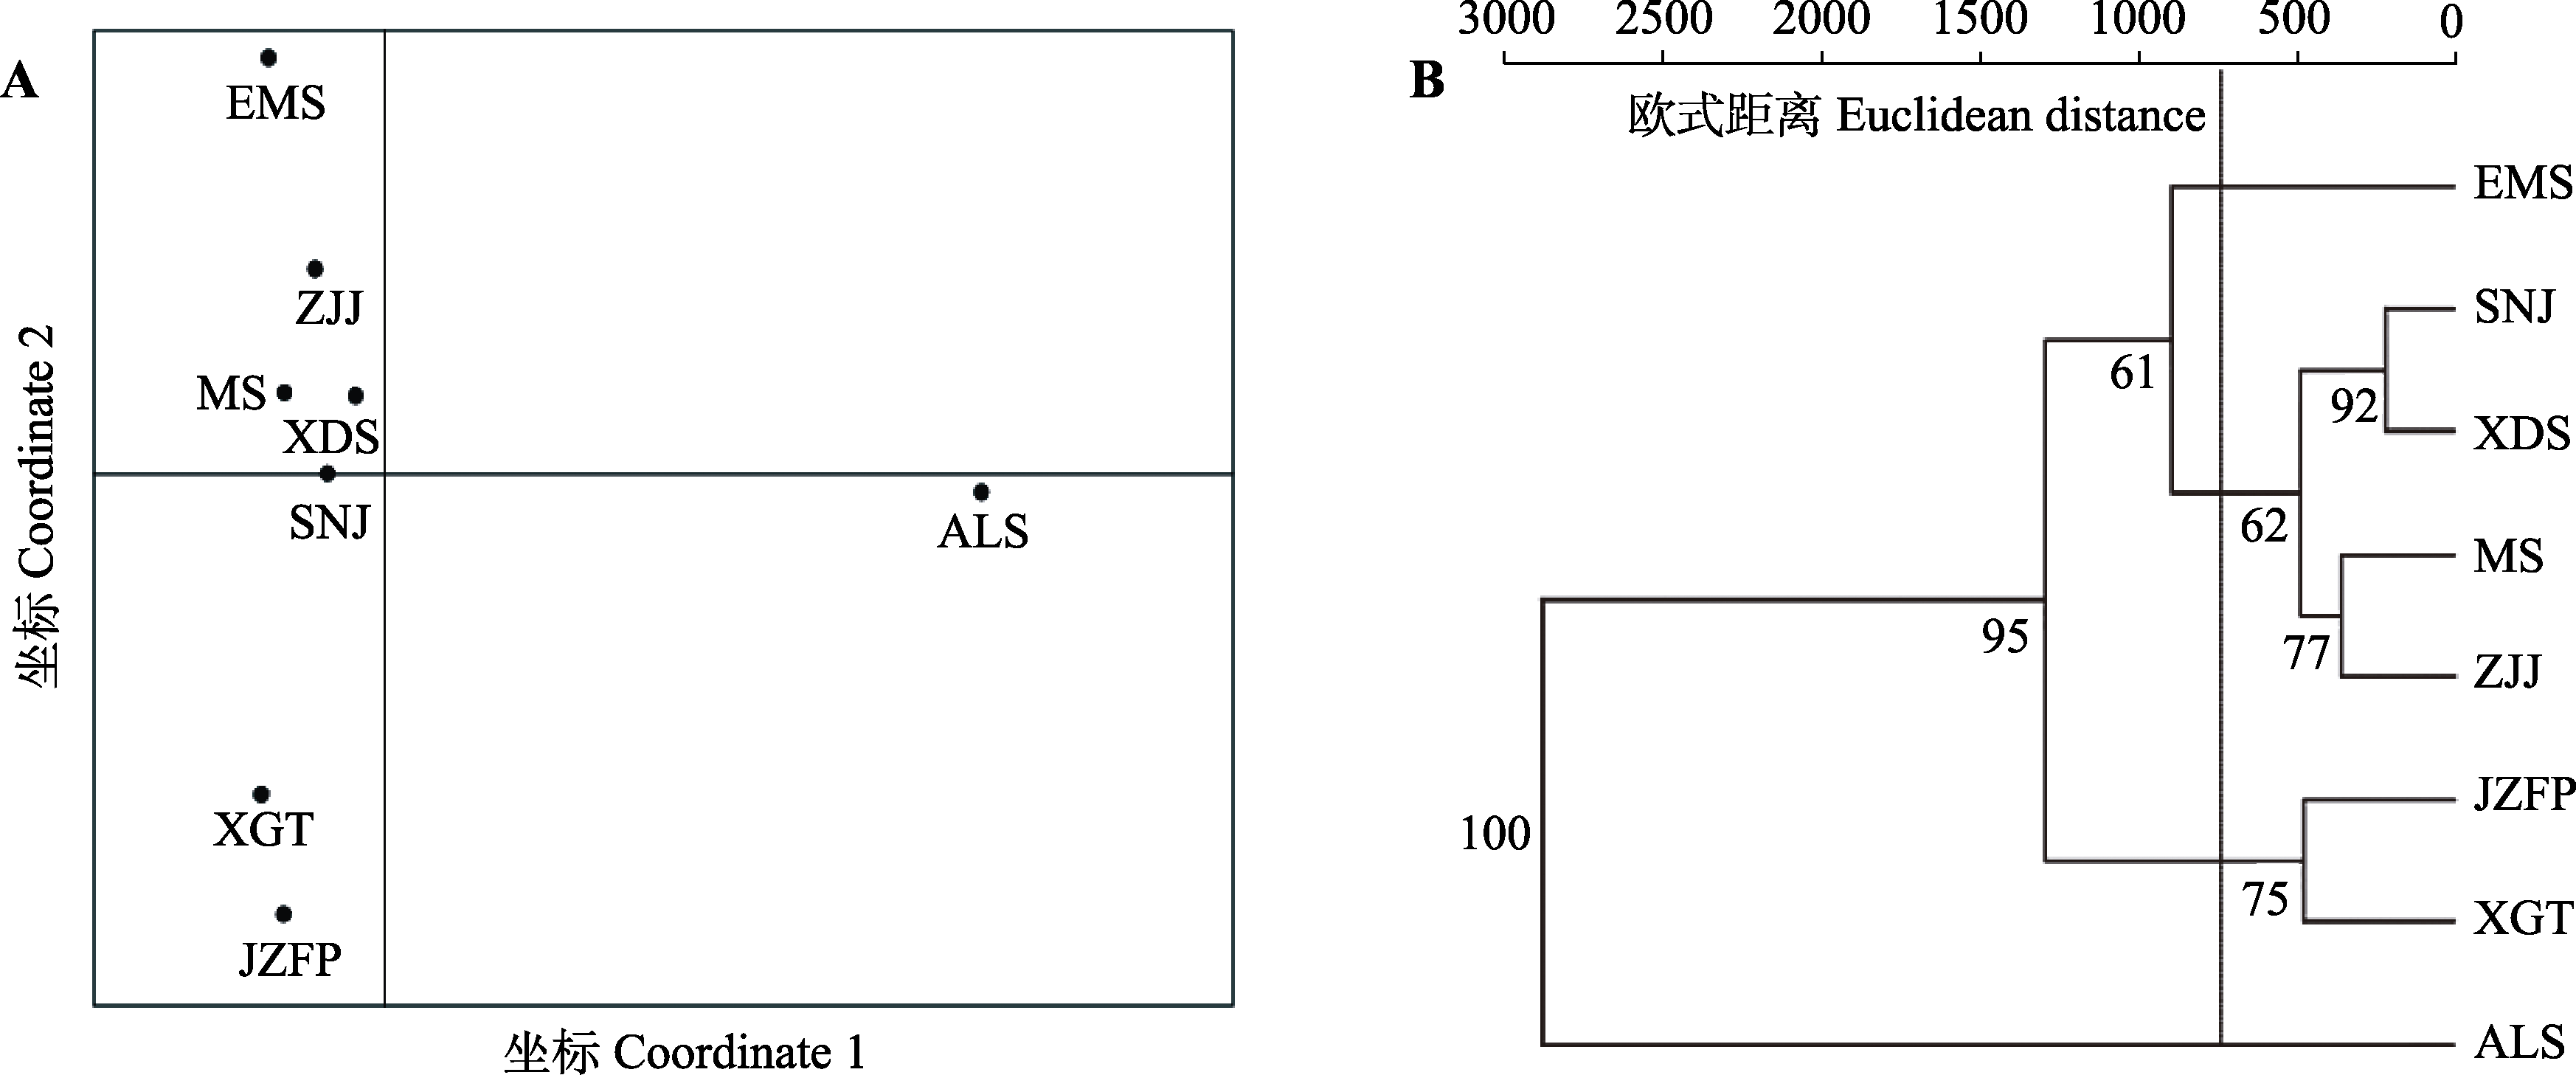
图1 基于叶表型性状和地理-气候因子的8个尾叶樱桃天然种群关系示意图。A, 主坐标分析输出结果。B, 非加权配对算术平均法聚类分析输出结果。ALS, 台湾阿里山; EMS, 四川峨眉山; JZFP, 江西金竹飞瀑; MS, 湖南莽山; SNJ, 湖北神农架; XDS, 湖北星斗山; XGT, 江西仙姑坛; ZJJ, 湖南张家界。
Fig. 1 Relationships between leaf phenotypic traits and geographic-climatic factors of the eight natural populations of Cerasus dielsiana. A, Output from principal coordinate analysis. B, Output from unweighted pair-group method with arithmetic mean cluster analysis. ALS, Mt. Ali, Taiwan. EMS, Mt. Emei, Sichuan; JZFP, Jinzhufeipu, Jiangxi; MS, Mt. Mangshan, Hunan; SNJ, Shennongjia, Hubei; XDS, Mt. Xingdou; Hubei; XGT, Xiangutan, Jiangxi; ZJJ, Zhangjiajie, Hunan.
| [1] | Ali K ( 2018). Phenotypic characterization of Elaeagnus angustifolia using multivariate analysis. Industrial Crops and Products, 120, 155-161. |
| [2] | Chen J, Wang XR, Tang HR, Chen T, Huang XJ, Liang QB ( 2013). Assessment of genetic diversity and populations genetic structure in wild Chinese cherry from Sichuan Province using SSR markers. Acta Horticulturae Sinica, 40, 333-340. |
| [ 陈娇, 王小蓉, 汤浩茹, 陈涛, 黄晓姣, 梁勤彪 ( 2013). 基于SSR标记的四川野生中国樱桃遗传多样性和居群遗传结构分析. 园艺学报, 40, 333-340.] | |
| [3] |
Dai ZC, Du DL, Si CC, Lin Y, Hao JL, Sun F ( 2009). A method to exactly measure the morphological quantity of leaf using scanner and Image J software. Guihaia, 29, 342-347.
DOI URL |
|
[ 戴志聪, 杜道林, 司春灿, 林英, 郝建良, 孙凤 ( 2009). 用扫描仪及Image J软件精确测量叶片形态数量特征的方法. 广西植物, 29, 342-347.]
DOI URL |
|
| [4] |
Diao SF, Shao WH, Dong RX, Sun HG ( 2014). Phenotypic diversity in natural populations of Sapindus mukorossi based on fruit and seed traits. Acta Ecologica Sinica, 34, 1451-1460.
DOI URL |
|
[ 刁松锋, 邵文豪, 董汝湘, 孙洪刚 ( 2014). 基于种实性状的无患子天然群体表型多样性研究. 生态学报, 34, 1451-1460.]
DOI URL |
|
| [5] | Du HC, Jiang YT, Zhang Y, Tian M, Duan GM ( 2018). Phenotypic trait variation of seed and fruit of wild populations of Chimonanthus praecox in Zhejiang Province and its relationship with soil related factors. Journal of Plant Resources and Environment, 27(2), 77-84. |
| [ 杜会聪, 蒋雅婷, 张莹, 田敏, 段国敏 ( 2018). 浙江省蜡梅野生种群种实表型性状变异及其与土壤相关因子的关系. 植物资源与环境学报, 27(2), 77-84.] | |
| [6] | Fang YM, Ding YL ( 2016). Special Topic in Plant Biology. Chinese Forestry Publishing House, Beijing. |
| [ 方炎明, 丁雨龙 . ( 2016). 植物生物学专题. 中国林业出版社, 北京.] | |
| [7] | Ge S, Wang MX, Chen YW ( 1988). An analysis of population genetic structure of masson pine by isozyme technique. Scientia Silvae Sinicae, 24, 399-409. |
| [ 葛颂, 王明庥, 陈岳武 ( 1988). 用同工酶研究马尾松群体的遗传结构. 林业科学, 24, 399-409.] | |
| [8] | Hijmans RJ, Guarino L, Cruz M, Rojas E ( 2001). Computer tools for spatial analysis of plant genetic resources data: 1. DIVA-GIS. Plant Genetic Resources Newsletter, 127, 15-19. |
| [9] |
Humphrey PT, Gloss AG, Frazier J, Nelson-Dittrich AC, Faries S, Whiteman NK ( 2018). Heritable plant phenotypes track light and herbivory levels at fine spatial scales. Oecologia, 187, 427-445.
DOI URL PMID |
| [10] |
Jiang C, Tan K, Ren MX ( 2017). Effects of monsoon on distribution patterns of tropical plants in Asia patterns of tropical plants in Asia. Chinese Journal of Plant Ecology, 41, 1103-1112.
DOI URL |
|
[ 姜超, 谭珂, 任明迅 ( 2017). 季风对亚洲热带植物分布格局的影响. 植物生态学报, 41, 1103-1112.]
DOI URL |
|
| [11] |
Jiang XB, Gong BC, Li DW, Wu KY, Zhao XM ( 2013). Variation analysis of phenotypic traits in natural population of Idesia polycarpa. Forest Research, 26, 113-117.
DOI URL |
|
[ 江锡兵, 龚榜初, 李大伟, 吴开云, 赵献民 ( 2013). 山桐子自然群体表型性状变异分析. 林业科学研究, 26, 113-117.]
DOI URL |
|
| [12] | Jing ZH, Li H, Shao WH, Yue HF, Jiang JM ( 2010). Phenotypic diversity of natural populations in Diospyros glaucifolia. Bulletin of Botanical Research, 30, 325-331. |
| [ 井振华, 李皓, 邵文豪, 岳华峰, 姜景民 ( 2010). 浙江柿天然群体表型多样性研究. 植物研究, 30, 325-331.] | |
| [13] |
Li B, Gu WC, Lu BM ( 2002). A study on phenotypic diversity of seeds and cones characteristics in Pinus bungeana. Biodiversity Science, 10, 181-188.
DOI URL |
|
[ 李斌, 顾万春, 卢宝明 ( 2002). 白皮松天然群体种实性状表型多样性研究. 生物多样性, 10, 181-188.]
DOI URL |
|
| [14] |
Li DS, Shi ZM, Feng QH, Liu F ( 2013). Response of leaf morphometric traits of Quercus species to climate in the temperate zone of the North-South Transect of Eastern China. Chinese Journal of Plant Ecology, 37, 793-802.
DOI URL |
|
[ 李东胜, 史作民, 冯秋红, 刘峰 ( 2013). 中国东部南北样带暖温带区栎属树种叶片形态性状对气候条件的响应. 植物生态学报, 37, 793-802.]
DOI URL |
|
| [15] |
Li M, Han HR, Kang FF, Ma QY ( 2005). Morphologic variation of leaves of Quercus liaotungensis Koidz. in Lingkong Mountain, Shanxi Province. Journal of Beijing Forestry University, 27(5), 10-16.
DOI URL |
|
[ 李梅, 韩海荣, 康峰峰, 马钦彦 ( 2005). 山西灵空山辽东栎种群叶性状表型变异研究. 北京林业大学学报, 27(5), 10-16.]
DOI URL |
|
| [16] | Li S, Gan XH, Han HY, Xu N, Hiu ZY, Chen Y, Deng XJ ( 2016). Leaf phenotypic traits of Tetracentron sinense, an endangered plant species. Forest Research, 29, 687-697. |
| [ 李珊, 甘小洪, 憨宏艳, 许宁, 侯正扬, 陈杨, 邓晓娟 ( 2016). 濒危植物水青树叶的表型性状变异. 林业科学研究, 29, 687-697.] | |
| [17] |
Li Y, Liu X, Ma J, Zhang X, Xu L ( 2018). Phenotypic variation in Phoebe bournei populations preserved in the primary distribution area. Journal of Forestry Research, 29(1), 35-44.
DOI URL |
| [18] |
Li YH, Li Z, Xin ZM, Liu MH, Li YL, Hao YG ( 2018). Effects of leaf shape plasticity on leaf surface temperature. Chinese Journal of Plant Ecology, 42, 202-208.
DOI URL |
|
[ 李永华, 李臻, 辛智鸣, 刘明虎, 李艳丽, 郝玉光 ( 2018). 形态变化对叶片表面温度的影响. 植物生态学报, 42, 202-208.]
DOI URL |
|
| [19] | Liu JQ, Yin MY, Zuo SY, Yang SB ( 2017). Phenotypic variations in natural populations of Amygdalus pedunculata. Chinese Journal of Plant Ecology, 41, 1091-1102. |
| [ 柳江群, 尹明宇, 左丝雨, 杨绍斌 ( 2017). 长柄扁桃天然种群表型变异. 植物生态学报, 41, 1091-1102.] | |
| [20] | Liu ZL, Yu MK, Ma Y, Tang LZ, Fang SZ ( 2011). A trend surface analysis of geographic variation in the triats of seeds and seedlings from different Quercus acutissima provenances. Acta Ecologica Sinica, 31, 6796-6804. |
| [ 刘志龙, 虞木奎, 马跃, 唐罗忠, 方升佐 ( 2011). 不同种源麻栎种子和苗木性状地理变异趋势面分析. 生态学报, 31, 6796-6804.] | |
| [21] |
Lu YF, Pei NC, Zhu YJ, Bai ZJ, Yang AN, Zhang JH, Lou LH, Tong ZK ( 2018). Community structure and leaf trait diversity in a vulnerable species, Phoebe chekiangensis. Chinese Journal of Applied Ecology, 29, 2101-2110.
DOI URL |
|
[ 陆云峰, 裴男才, 朱亚军, 柏志靓, 杨安娜, 张俊红, 楼炉焕, 童再康 ( 2018). 渐危植物浙江楠群落结构及叶片性状多样性. 应用生态学报, 29, 2101-2110.]
DOI URL |
|
| [22] |
McDonald PG, Fonseca CR, Overton JM, Westoby M ( 2003). Leaf-size divergence along rainfall and soil-nutrient gradients: Is the method of size reduction common among clades?Functional Ecology, 17, 50-57.
DOI URL |
| [23] |
Meng H, Wei X, Franklin SB, Wu H, Jiang M ( 2017). Geographical variation and the role of climate in leaf traits of a relict tree species across its distribution in China. Plant Biology, 19, 522-561.
DOI URL |
| [24] |
Niinemets ü, Portsmuth A, Tobias M ( 2010). Leaf size modifies support biomass distribution among stems, petioles and mid-ribs in temperate plants. New Phytologist, 171, 91-104.
DOI URL PMID |
| [25] | Pang GC, Jiang DM ( 1995). Population genetic diversity and data analysis. Scientia Silvae Sinicae, 31, 543-550. |
| [ 庞广昌, 姜冬梅 ( 1995). 群体遗传多样性和数据分析. 林业科学, 31, 543-550.] | |
| [26] |
Peng XM, Wu JC, Zheng YX, Zhang YP, Li GQ ( 2012). Phenotypic variation in cultivated populations of Azadirachta indica in Yunnan, China. Chinese Journal of Plant Ecology, 36, 560-571.
DOI URL |
|
[ 彭兴民, 吴疆翀, 郑益兴, 张燕平, 李根前 ( 2012). 云南引种印楝实生种群的表型变异. 植物生态学报, 36, 560-571.]
DOI URL |
|
| [27] |
Qian H, Klinka K, Kayahara G ( 1998). Longitudinal patterns of plant diversity in the North American boreal forest. Plant Ecology, 138, 161-178.
DOI URL |
| [28] |
Saenger P, West PW ( 2018) Phenotypic variation of the mangrove species Avicennia marina( Forssk.) Vierh. from seven provenances around Australia. Aquatic Botany, 149, 28-32.
DOI URL |
| [29] | She CQ, Yang WX, Fang SZ, Shang XL ( 2009). Phenotypic diversity of natural Cyclocarya paliurus populations seed traits. Chinese Journal of Applied Ecology, 20, 2351-2356. |
| [ 佘诚棋, 杨万霞, 方升佐, 尚旭岚 ( 2009). 青钱柳天然群体种子性状表型多样性. 应用生态学报, 20, 2351-2356.] | |
| [30] | Verbeeck H, Betehndoh E, Maes WH, Hubau W, Kearsley E, Buggenhout L, Hufkens K, Huygens D, van Acker J, Beeckman H, Mweru JPM, Boeckx P, Steppe K ( 2014). Functional leaf trait diversity of 10 tree species in Congolese secondary tropical forest. Journal of Tropical Forest Science, 26, 409-419. |
| [31] | Wang MZ, Bu XQ, Li L, Dong BC, Li HL, Yu FH ( 2018). Constraints on the evolution of phenotypic plasticity in the clonal plant Hydrocotyle vulgaris. Journal of Evolutionary Biology, 31, 1006-1017. |
| [32] | Wang XR ( 2014). An Illustrated Monograph of Cherry Cultivars in China. Science Press, Beijing. |
| [ 王贤荣 ( 2014). 中国樱花品种图志. 科学出版社, 北京.] | |
| [33] |
Wang XR, Xie CP, Yi XG, Xiang QB ( 2007). Study on the morphological variations of Cerasus subhirtella var. ascendens in different populations. Bulletin of Botanical Research, 27, 746-752.
DOI URL |
|
[ 王贤荣, 谢春平, 伊贤贵, 向其柏 ( 2007). 不同居群野生早樱形态变异研究. 植物研究, 27, 746-752.]
DOI URL |
|
| [34] |
Wang Y, Tian YE, Gan XY, Song F ( 2018). Geographic trend surface analysis of phenotypic variance of Toona ciliata in natural populations of Hubei. Journal of Forest and Environment, 28, 309-317.
DOI URL |
|
[ 汪洋, 田玉娥, 甘小燕, 宋菲 ( 2018). 湖北红椿天然居群表型变异地理趋势面研究. 森林与环境学报, 28, 309-317.]
DOI URL |
|
| [35] |
Wright IJ, Ackerly DD, Bongers F, Harms KE, Ibarra-?Manriquez G, Martinez-Ramos M, Mazer SJ, Muller- Landau, HC, Paz H, Pitman NCA, Poorter L, Silman MR, Vriesendorp CF, Webb CO, Westoby M, Wright SJ ( 2007). Relationships among ecologically important dimensions of plant trait variation in seven neotropical forests. Annals of Botany, 99, 1003-1015.
DOI URL PMID |
| [36] |
Yang HY, Wei HY, Sang MJ, Shang ZH, Mao YJ, Wang XR, Liu F, Gu W ( 2016). Phenotypic plasticity of Schisandra sphenanthera leaf and the effect of environmental factors on leaf phenotype. Chinese Bulletin of Botany, 51, 322-334.
DOI URL |
|
[ 杨贺雨, 卫海燕, 桑满杰, 尚忠慧, 毛亚娟, 王小蕊, 刘芳, 顾蔚 ( 2016). 华中五味子叶表型可塑性及环境因子对叶表型的影响. 植物学报, 51, 322-334.]
DOI URL |
|
| [37] |
Yang XX, Leng PS, Zheng J, Hu ZH, Liu XY, Yang XH, Dou DQ ( 2016). Variation of phenotypic traits of seed and seedling of different provenances and their correlations with geographic-climatic factors Syringa reticulata subsp amurensis from different provenances and their correlations with geographic-climatic factors. Journal of Plant Resources and Environment, 25(3), 80-89.
DOI URL |
|
[ 杨晓霞, 冷平生, 郑健, 胡增辉, 刘学娅, 杨晓红, 窦德泉 ( 2016). 暴马丁香不同种源种子和幼苗的表型性状变异及其与地理-气候因子的相关性. 植物资源与环境学报, 25(3), 80-89.]
DOI URL |
|
| [38] |
Yang Y, Liu J, Yin X, Chen JZ, Jiang LJ ( 2015). Phenotypic diversity and environment relations in Symplocos paniculata of Hunan. Journal of Plant Genetic Resources, 16, 80-86.
DOI URL |
|
[ 杨艳, 刘强, 尹翔, 陈景震, 蒋丽娟 ( 2015). 湖南白檀居群形态多样性及与环境的相关性. 植物遗传资源学报, 16, 80-86.]
DOI URL |
|
| [39] |
Yuan J, Yin GT, Yang JC, Li RS, Zou WT ( 2013). Phenotypic diversity of seed and fruits in natural populations of Mytilaria laosensis. Chinese Journal of Tropical Crops, 34, 2057-2062.
DOI URL |
|
[ 袁洁, 尹光天, 杨锦昌, 李荣生, 邹文涛 ( 2013). 米老排天然群体的种实表型变异研究初报. 热带作物学报, 34, 2057-2062.]
DOI URL |
|
| [40] |
Zhang WX, Fan JJ, Yang P, Zhou T, Pu J, Cao FL ( 2017). Analysis of phenotypic characteristics of the Malus ‘Purple Prince’ half-sib progenies at the seedling stage.Journal of Nanjing Forestry University (Natural Science Edition), 41(6), 33-40.
DOI URL |
|
[ 张往祥, 范俊俊, 杨萍, 周婷, 浦静, 曹福亮 ( 2017). “紫王子”海棠半同胞家系苗期表型特征分析. 南京林业大学学报(自然科学版), 41(6), 33-40.]
DOI URL |
|
| [41] |
Zhu H, You LX, Li YF, Wang HC, Wang XR ( 2017). Modeling the geographical distribution pattern and climatic limited factors of Cerasus schneideriana. Journal of Tropical and Subtropical Botany, 25, 315-322.
DOI URL |
|
[ 朱弘, 尤禄祥, 李涌福, 王华辰, 王贤荣 ( 2017). 浙闽樱桃地理分布模拟及气候限制因子分析. 热带亚热带植物学报, 25, 315-322.]
DOI URL |
| [1] | 何庆海, 杨少宗, 李因刚, 沈鑫, 柳新红. 枫香树种群种子与果实表型性状变异分析[J]. 植物生态学报, 2018, 42(7): 752-763. |
| [2] | 柳江群, 尹明宇, 左丝雨, 杨绍斌, 乌云塔娜. 长柄扁桃天然种群表型变异[J]. 植物生态学报, 2017, 41(10): 1091-1102. |
| [3] | 辜云杰, 罗建勋, 吴远伟, 曹小军. 川西云杉天然种群表型多样性[J]. 植物生态学报, 2009, 33(2): 291-301. |
| 阅读次数 | ||||||
|
全文 |
|
|||||
|
摘要 |
|
|||||
Copyright © 2022 版权所有 《植物生态学报》编辑部
地址: 北京香山南辛村20号, 邮编: 100093
Tel.: 010-62836134, 62836138; Fax: 010-82599431; E-mail: apes@ibcas.ac.cn, cjpe@ibcas.ac.cn
备案号: 京ICP备16067583号-19