
植物生态学报 ›› 2018, Vol. 42 ›› Issue (10): 1000-1008.DOI: 10.17521/cjpe.2018.0129 cstr: 32100.14.cjpe.2018.0129
叶子飘1,段世华2,安婷1,康华靖3,*( )
)
收稿日期:2018-05-29
出版日期:2018-10-20
发布日期:2019-01-30
基金资助:
YE Zi-Piao1,DUAN Shi-Hua2,AN Ting1,KANG Hua-Jing3,*()
Received:2018-05-29
Online:2018-10-20
Published:2019-01-30
Supported by:摘要:
准确估算光合电子流对CO2响应的变化趋势对深入了解光合过程具有重要意义。该研究在植物光合作用对CO2响应新模型(模型I)的基础上构建了电子传递速率(J)对CO2的响应模型(模型II), 并对用LI-6400-40便携式光合仪测量的玉米(Zea mays)和千穗谷(Amaranthus hypochondriacus)的数据进行了拟合。结果表明, 模型II可以很好地拟合玉米和千穗谷叶片J对CO2浓度的响应曲线(J-Ca曲线), 得到玉米和千穗谷的最大电子传递速率分别为262.41和393.07 mmol·m -2·s -1, 与估算值相符合。在此基础上, 对光合电子流分配到其他路径进行了探讨。结果显示, 380 mmol·mol -1 CO2浓度下玉米和千穗谷碳同化所需的电子流为247.92和285.16 mmol·m -2·s -1, 分配到其他途径的光合电子流为14.49和107.91 mmol·m -2·s -1(考虑植物CO2的回收利用)。比较两种植物的其他途径光合电子流分配值发现, 两者相差6倍之多。分析认为这与千穗谷和玉米的催化脱羧反应酶种类以及脱羧反应发生的部位不同密切相关。该发现为人们研究C4植物中烟酰胺腺嘌呤二核苷磷酸苹果酸酶型和烟酰胺腺嘌呤二核苷酸苹果酸酶型两种亚型之间的差异提供了一个新的视角。此外, 构建的电子传递速率对CO2的响应模型为人们研究C4植物的光合电子流的变化规律提供了一个可供选择的数学工具。
叶子飘, 段世华, 安婷, 康华靖. C4作物电子传递速率对CO2响应模型的构建及应用. 植物生态学报, 2018, 42(10): 1000-1008. DOI: 10.17521/cjpe.2018.0129
YE Zi-Piao, DUAN Shi-Hua, AN Ting, KANG Hua-Jing. Construction of CO2-response model of electron transport rate in C4 crop and its application. Chinese Journal of Plant Ecology, 2018, 42(10): 1000-1008. DOI: 10.17521/cjpe.2018.0129
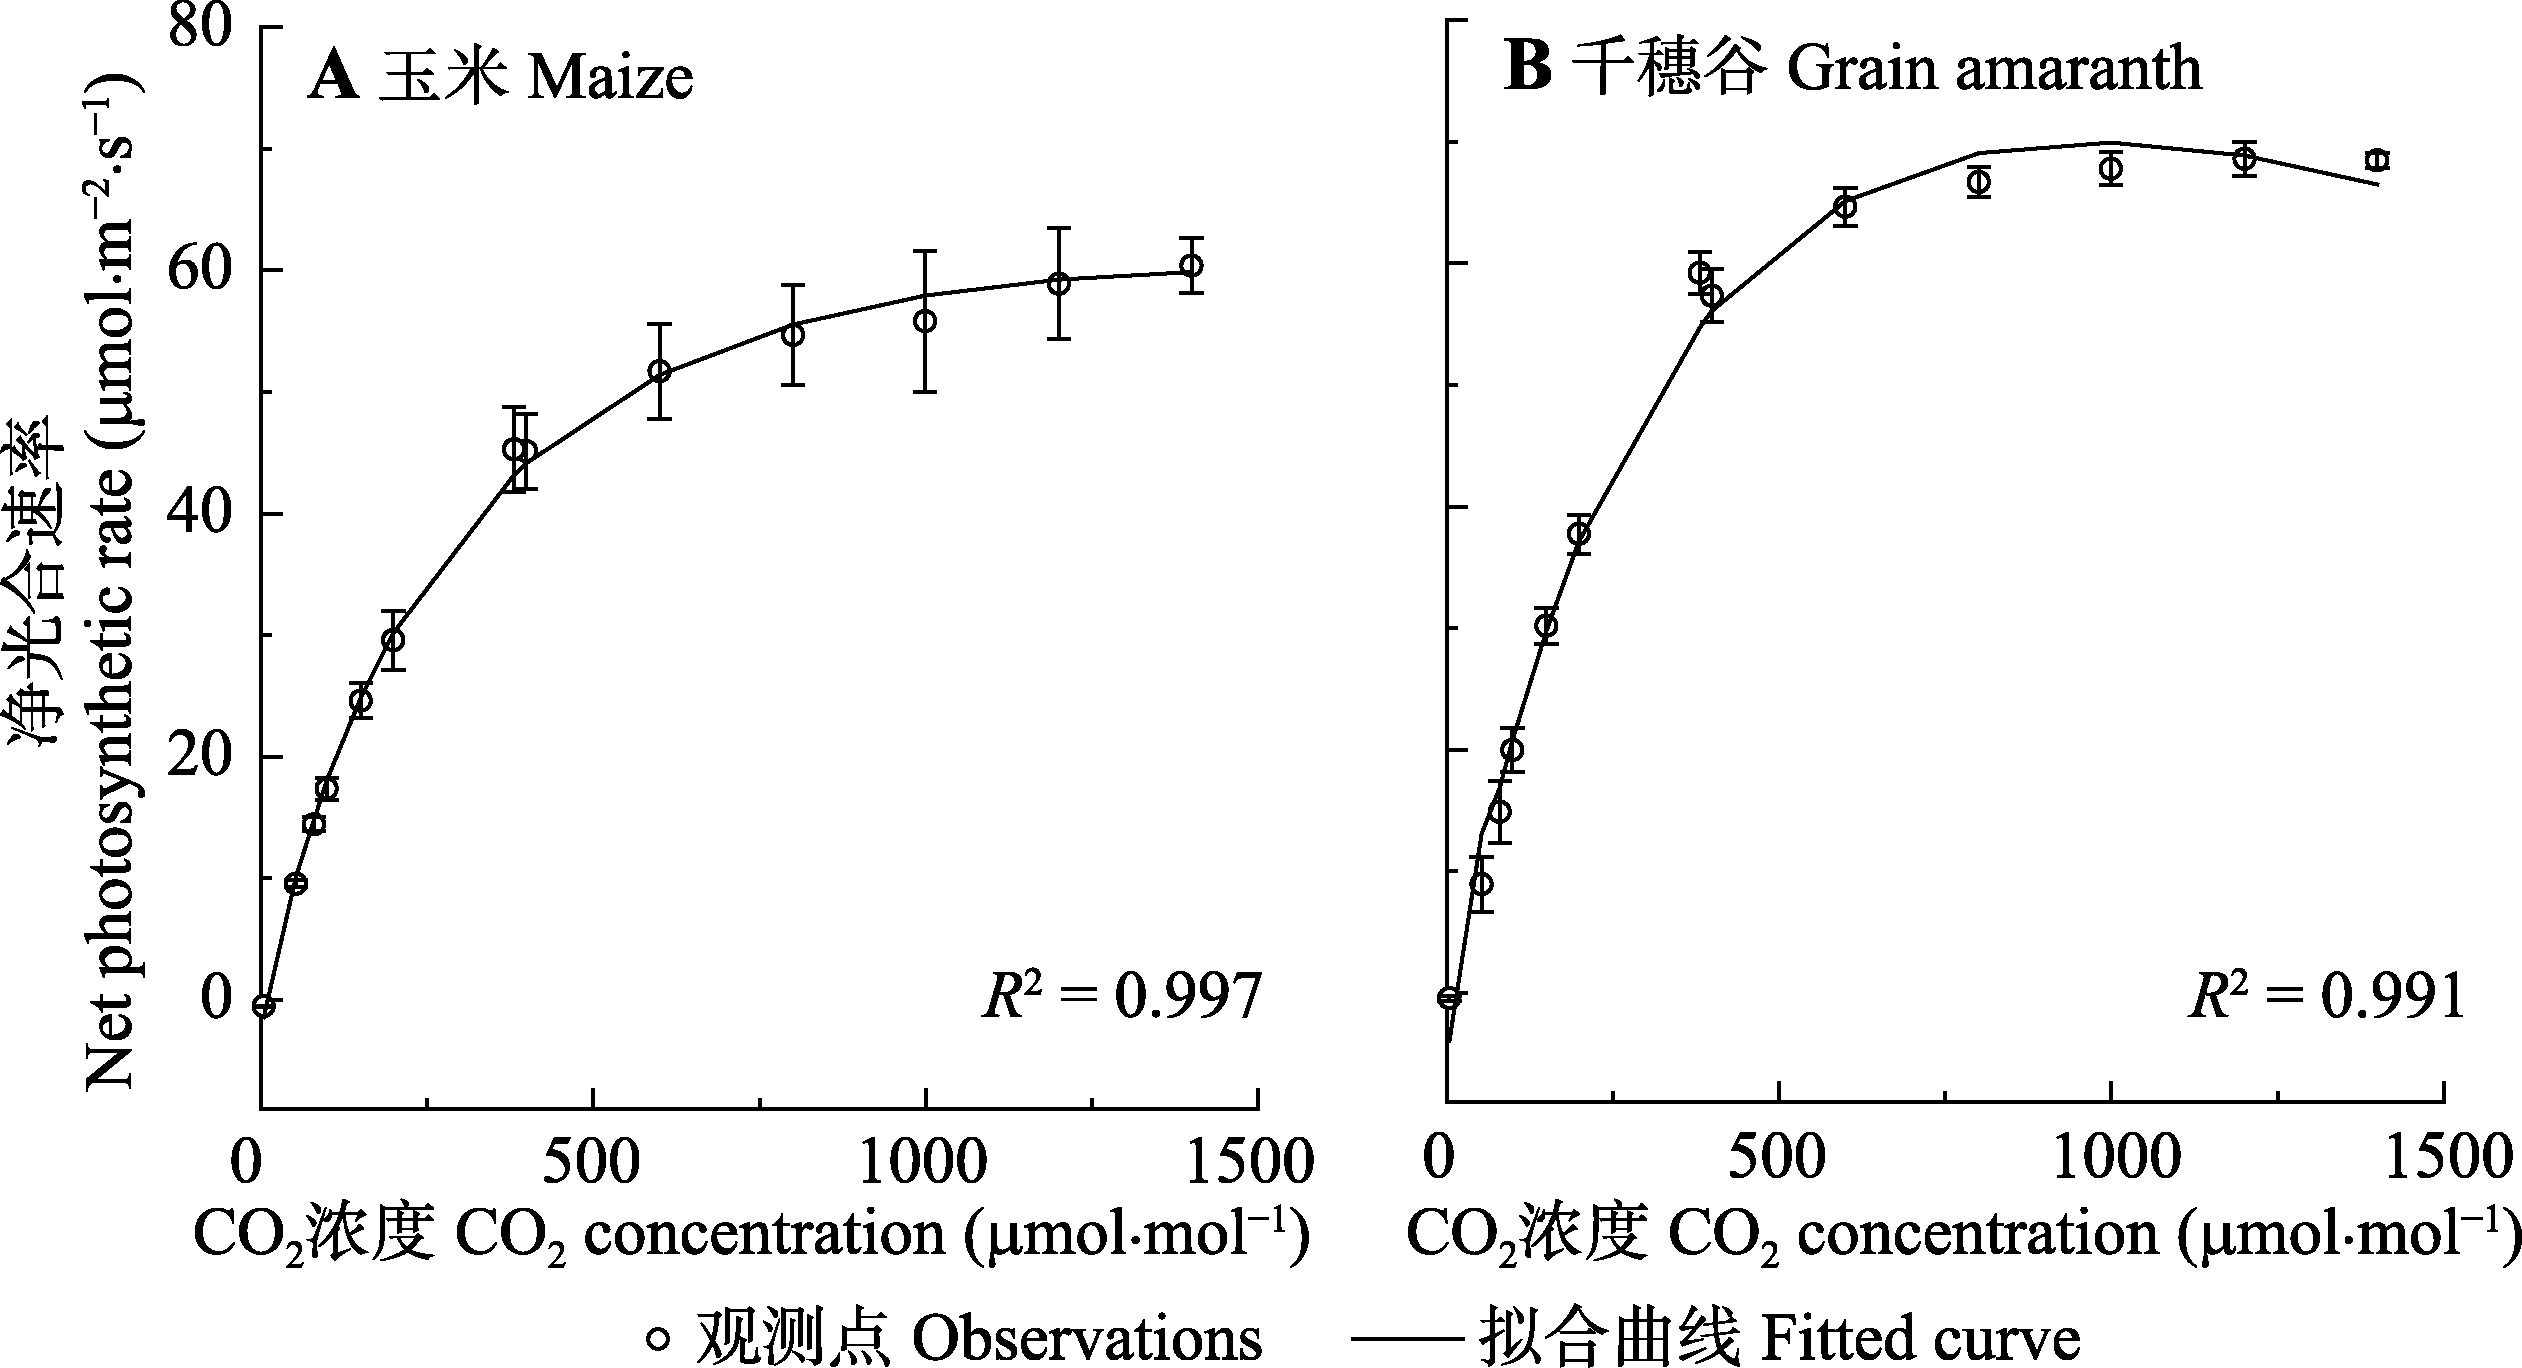
图1 玉米和千穗谷光合作用对CO2的响应曲线(平均值±标准误差, n = 5)。
Fig. 1 CO2-response curves of photosynthesis in maize and grain amaranth (mean ± SE, n = 5).
| 光合参数 Photosynthetic parameter | 玉米 Maize | 千穗谷 Grain amaranth | ||
|---|---|---|---|---|
| 拟合值 Fitted value | 估算值 Estimated value | 拟合值 Fitted value | 估算值 Estimated value | |
| αc | 0.247 ± 0.033b | — | 0.334 ± 0.022a | — |
| Ac-max (mmol·m-2·s-1) | 59.12 ± 0.67b | ? 60.39 | 69.97 ± 0.71a | ? 70.49 |
| Ca-sat (mmol·mol-1) | 1 335.74 ± 196.52a | ? 1 400 | 976.25 ± 12.06b | ? 1 000 |
| Γ (mmol·mol-1) | 4.35 ± 2.08b | ? 4.25b | 12.77 ± 0.53a | ? 13.41 |
| Rl (mmol·m-2·s-1) | 1.13 ± 0.64b | ? 0.24 | 2.44 ± 0.15a | ? 0.28 |
| R2 | 0.997 | — | 0.991 | — |
表1 由模型I拟合玉米和千穗谷的光合作用对CO2的响应曲线(Ac-Ca)得到光合参数以及相应的估算值(平均值±标准误差, n = 5)
Table 1 Estimated values and results fitted by model I for CO2-response curves of photosynthesis (Ac-Ca) in maize and grain amaranth (mean ± SE, n = 5)
| 光合参数 Photosynthetic parameter | 玉米 Maize | 千穗谷 Grain amaranth | ||
|---|---|---|---|---|
| 拟合值 Fitted value | 估算值 Estimated value | 拟合值 Fitted value | 估算值 Estimated value | |
| αc | 0.247 ± 0.033b | — | 0.334 ± 0.022a | — |
| Ac-max (mmol·m-2·s-1) | 59.12 ± 0.67b | ? 60.39 | 69.97 ± 0.71a | ? 70.49 |
| Ca-sat (mmol·mol-1) | 1 335.74 ± 196.52a | ? 1 400 | 976.25 ± 12.06b | ? 1 000 |
| Γ (mmol·mol-1) | 4.35 ± 2.08b | ? 4.25b | 12.77 ± 0.53a | ? 13.41 |
| Rl (mmol·m-2·s-1) | 1.13 ± 0.64b | ? 0.24 | 2.44 ± 0.15a | ? 0.28 |
| R2 | 0.997 | — | 0.991 | — |
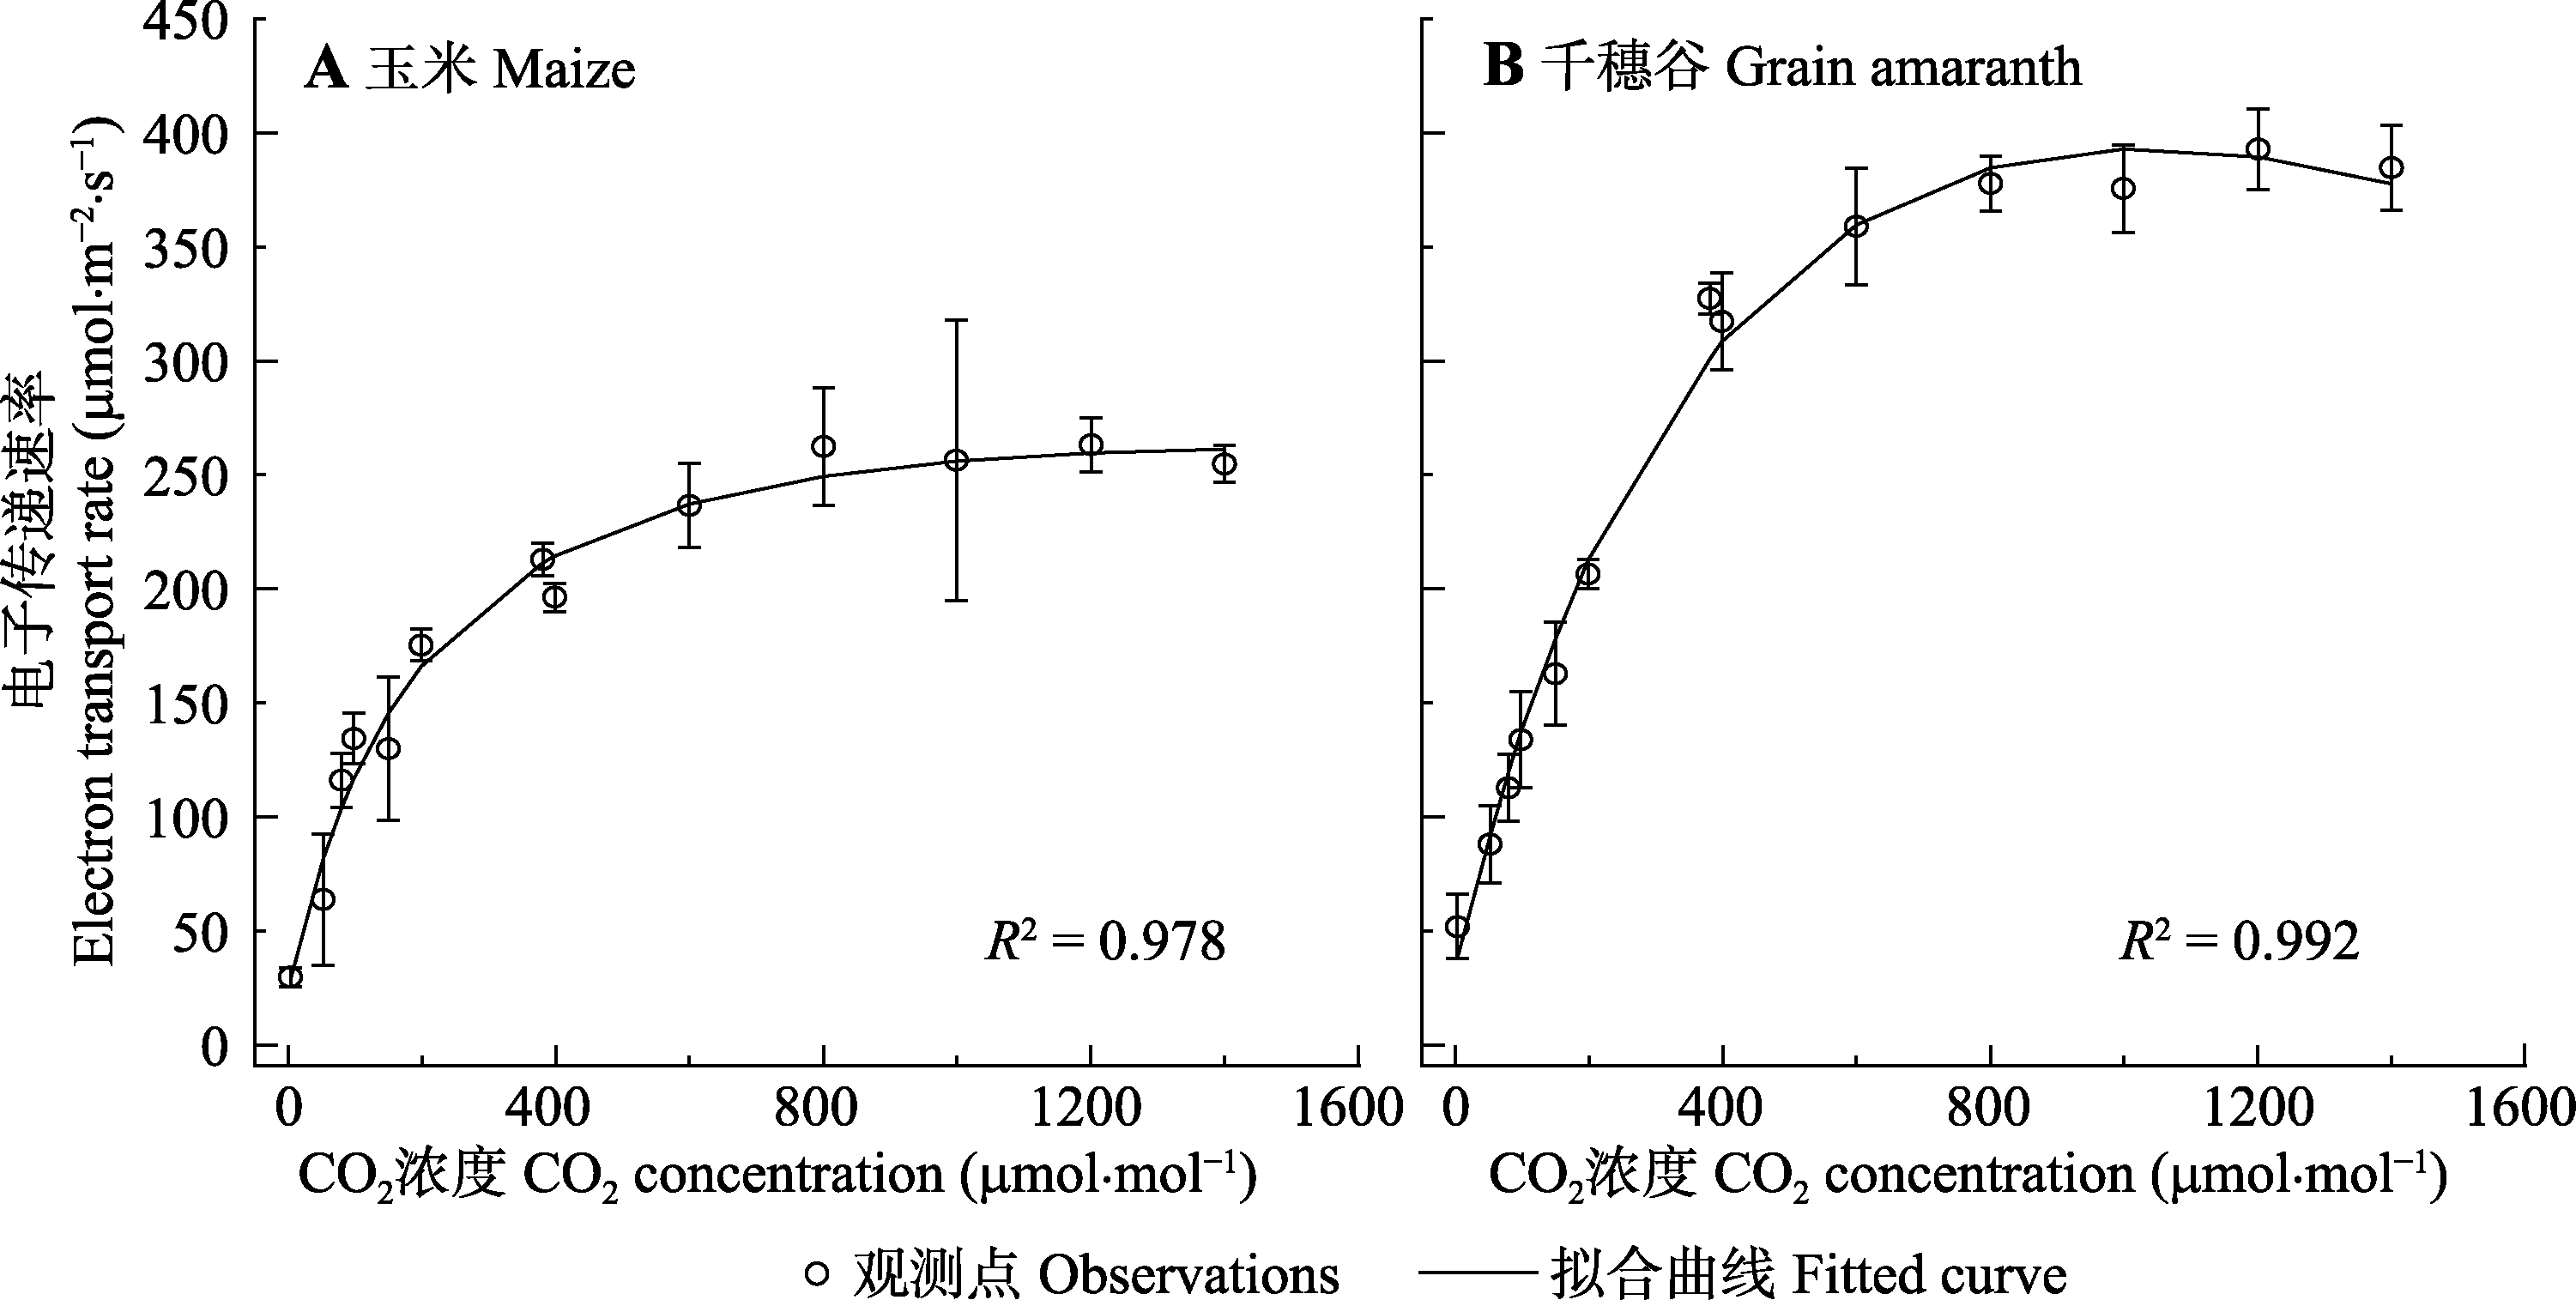
图2 玉米和千穗谷的光合电子传递速率对CO2的响应曲线(平均值±标准误差, n = 5)。
Fig. 2 CO2-response curves of photosynthetic electron transport rate (J-Ca) in maize and grain amaranth (mean ± SE, n = 5).
| 光合参数 Photosynthetic parameter | 玉米 Maize | 千穗谷 Grain amaranth | ||
|---|---|---|---|---|
| 拟合值 Fitted value | 估算值 Estimated value | 拟合值 Fitted value | 估算值 Estimated value | |
| αce (mol·m-2·s-1) | 1.215 ± 0.543a | — | 1.208 ± 0.357a | — |
| Jmax (mmol·m-2·s-1) | 262.41 ± 1.64b | ? 265.66 | 393.07 ± 37.84a | ? 397.82 |
| Ca-sat (mmol·mol-1) | 1 198.58 ± 342.78a | ? 1 200 | 1 229.10 ± 59.14a | ? 1 200 |
| J0 (mmol·m-2·s-1) | 22.22 ± 8.35a | ? 27.69 | 27.43 ± 4.97a | ? 29.26 |
| R2 | 0.978 | — | 0.992 | — |
表2 由模型II拟合玉米和千穗谷的光合电子传递速率对CO2的响应曲线(J-Ca )得到Jmax和Ca-sat等参数以及相应的估算值(平均值±标准误差, n = 5)
Table 2 Estimated values and results fitted by model II for CO2-response curves of photosynthetic electron transport rate (J-Ca) in maize and grain amaranth (mean ± SE, n = 5)
| 光合参数 Photosynthetic parameter | 玉米 Maize | 千穗谷 Grain amaranth | ||
|---|---|---|---|---|
| 拟合值 Fitted value | 估算值 Estimated value | 拟合值 Fitted value | 估算值 Estimated value | |
| αce (mol·m-2·s-1) | 1.215 ± 0.543a | — | 1.208 ± 0.357a | — |
| Jmax (mmol·m-2·s-1) | 262.41 ± 1.64b | ? 265.66 | 393.07 ± 37.84a | ? 397.82 |
| Ca-sat (mmol·mol-1) | 1 198.58 ± 342.78a | ? 1 200 | 1 229.10 ± 59.14a | ? 1 200 |
| J0 (mmol·m-2·s-1) | 22.22 ± 8.35a | ? 27.69 | 27.43 ± 4.97a | ? 29.26 |
| R2 | 0.978 | — | 0.992 | — |
| 光合作用参数 Photosynthetic parameter (mmol·m-2·s-1) | [CO2] = 380 mmol·mol-1 | [CO2] = 0 mmol·mol-1 | ||
|---|---|---|---|---|
| 玉米 Maize | 千穗谷 Grain amaranth | 玉米 Maize | 千穗谷Grain amaranth | |
| Ac-max | 59.12 | 69.97 | - | - |
| Rn | 2.86 | 1.32 | 3.27 | 3.17 |
| Rd | 1.43 | 0.66 | 0.24 | 0.28 |
| Re | 1.43 | 0.66 | 3.02 | 2.89 |
| Jmax | 262.41 | 393.07 | - | - |
| J0 | - | - | 22.22 | 27.43 |
| Jc | 242.20 | 282.52 | 0.96 | 1.12 |
| Ja | 20.21 | 110.55 | 21.26 | 26.31 |
| J°c | 247.92 | 285.16 | 13.08 | 12.68 |
| J°a | 14.49 | 107.91 | 9.14 | 14.75 |
表3 2 000 μmol·m-2·s-1光强下玉米和千穗谷光合作用相关参数及电子流分配比较
Table 3 Comparison of photosynthetic parameters and allocation of electron flow in maize and grain amaranth at 2 000 μmol·m-2·s-1 light intensity
| 光合作用参数 Photosynthetic parameter (mmol·m-2·s-1) | [CO2] = 380 mmol·mol-1 | [CO2] = 0 mmol·mol-1 | ||
|---|---|---|---|---|
| 玉米 Maize | 千穗谷 Grain amaranth | 玉米 Maize | 千穗谷Grain amaranth | |
| Ac-max | 59.12 | 69.97 | - | - |
| Rn | 2.86 | 1.32 | 3.27 | 3.17 |
| Rd | 1.43 | 0.66 | 0.24 | 0.28 |
| Re | 1.43 | 0.66 | 3.02 | 2.89 |
| Jmax | 262.41 | 393.07 | - | - |
| J0 | - | - | 22.22 | 27.43 |
| Jc | 242.20 | 282.52 | 0.96 | 1.12 |
| Ja | 20.21 | 110.55 | 21.26 | 26.31 |
| J°c | 247.92 | 285.16 | 13.08 | 12.68 |
| J°a | 14.49 | 107.91 | 9.14 | 14.75 |
| 1 | Baker NR ( 2008). Chlorophyll fluorescence: A probe of photosynthesis in vivo. Annual Review of Plant Biology, 59, 89-113. |
| 2 | Berry JA, Farquhar GD ( 1978). The CO2 concentrating function of C4 photosynthesis: A biochemical model. In: Hall D, Coombs J, Goodwin T eds. The Proceedings of the Fourth International Congress on Photosynthesis. Biochemical Society of London, London. 119-131. |
| 3 | Collatz GJ, Ribas-Carbo M, Berry JA ( 1992). Coupled photosynthesis stomatal model for leaves of C4 plants. Australian Journal of Plant Physiology, 19, 519-538. |
| 4 |
Eichelmann H, Oja V, Peterson RB, Laisk A ( 2011). The rate of nitrite reduction in leaves as indicated by O2 and CO2 exchange during photosynthesis. Journal of Experimental Botany, 62, 2205-2215.
DOI URL PMID |
| 5 | Epron D, Godard D, Cornic G, Genty B ( 1995). Limitation of net CO2 assimilation rate by internal resistances to CO2 transfer in the leaves of two tree species (Fagus sylvatica L. and Castanea sativa Mill.). Plant, Cell & Environment, 18, 43-51. |
| 6 |
Farquhar GD, Busch FA ( 2017). Changes in the chloroplastic CO2 concentration explain much of the observed Kok effect: A model. New Phytologist, 214, 570-584.
DOI URL PMID |
| 7 |
Feng RY, Bai YF, Li P, Zhang WF, Wang YY, Yang WD ( 2011). Molecular cloning and expression analysis of C4 phosphoenolpyruvate carboxylase gene from A. hypochondriacus L. Acta Agronomica Sinica, 37, 1801-1808.
DOI URL |
|
[ 冯瑞云, 白云凤, 李平, 张维锋, 王媛媛, 杨武德 ( 2011). 籽粒苋C4型磷酸烯醇式丙酮酸羧化酶基因的克隆和表达. 作物学报, 37, 1801-1808.]
DOI URL |
|
| 8 |
Fila G, Badeck FW, Meyer S, Cerovic Z, Ghashghaie J ( 2006). Relationships between leaf conductance to CO2 diffusion and photosynthesis in micropropagated grapevine plants, before and after ex vitro acclimatization. Journal of Experimental Botany, 57, 2687-2695.
DOI URL PMID |
| 9 |
Foyer CH, Noctor G ( 2000). Oxygen processing in photosynthesis: Regulation and signaling. New Phytologist, 146, 359-388.
DOI URL |
| 10 |
Hatch MD ( 1987). C4 photosynthesis: a unique blend of modified biochemistry, anatomy and ultrastructure. Biochimica et Biophysica Acta, 895, 81-106.
DOI URL |
| 11 |
He FY, Yan JJ, Bai YF, Feng RY, Zhang WF ( 2017). Prokaryotic expression and enzyme activity determination of C4 key enzyme pyruvate phosphate dikinase gene in Amaranth hypochondriacus. Acta Agriculturae Boreli-Sinica, 32, 61-65.
DOI URL |
|
[ 贺飞燕, 闫建俊, 白云凤, 冯瑞云, 张维锋 ( 2017). 籽粒苋C4关键酶丙酮酸磷酸双激酶基因的原核表达及酶活性测定. 华北农学报, 32, 61-65.]
DOI URL |
|
| 12 |
Heber U ( 2002). Irrungen, Wirrungen? The Mehler reaction in relation to cyclic electron transport in C3 plants. Photosynthesis Research, 73, 223-231.
DOI URL |
| 13 |
Kang HJ, Li H, Quan W, Ouyang Z ( 2014). Causes of decreasing mitochondrial respiration under light in four crops, Chinese Journal of Plant Ecology, 38, 1110-1116.
DOI URL |
|
[ 康华靖, 李红, 权伟, 欧阳竹 ( 2014). 四种作物光下暗呼吸速率降低的原因. 植物生态学报, 38, 1110-1116.]
DOI URL |
|
| 14 |
Ku MSB, Agarie S, Nomura M, Fukayama H, Tsuchida H, Ono K, Hirose S, Toki S, Miyao M, Matsuoka M ( 1999). High-level expression of maize phosphoenolpyruvate carboxylase in transgenic rice plants. Nature Biotechnology, 17, 76-80.
DOI URL PMID |
| 15 | Li XB, Xu WG, Lei MY, Zhang QC, Wang HW, Li Y, Hua X, Gao C ( 2017). The response of photosynthetic characteristics of maize C4-type pepc, ppdk and nadp-me transgenetic Arabidopsis thaliana to high light stress. Molecular Plant Breeding, 15, 911-919. |
| [ 李小博, 许为钢, 雷明月, 张庆琛, 王会伟, 李艳, 华夏, 高崇 ( 2017). 转玉米C4光合途径pepc、ppdk、nadp-me基因拟南芥光合特性对强光胁迫的反应. 分子植物育种, 15, 911-919.] | |
| 16 |
Liang XY, Liu SR ( 2017). A review on the FvCB biochemical model of photosynthesis and the measurement of A-Ci curves. Chinese Journal of Plant Ecology, 41, 693-706.
DOI URL |
|
[ 梁星云, 刘世荣 ( 2017). FvCB生物化学光合模型及A-Ci曲线测定. 植物生态学报, 41, 693-706.]
DOI URL |
|
| 17 |
Lin ZF, Peng CL, Sun ZJ, Lin GZ ( 2000). The influence of light intensity on photosynthetic electron transport partitioning in photorespiration for four subtropical forest species. Science China (Ser C), 30, 72-77.
DOI URL |
|
[ 林植芳, 彭长连, 孙梓健, 林桂珠 ( 2000). 光强对4种亚热带森林植物光合电子传递向光呼吸分配的影响. 中国科学(C辑), 30, 72-77. ]
DOI URL |
|
| 18 |
Loreto F, Delfine S, Di-marco G ( 1999). Estimation of photorespiratory carbon dioxide recycling during photosynthesis. Australian Journal of Plant Physiology, 26, 733-736.
DOI URL |
| 19 | Loreto F, Velikova VB, Marco GDA ( 2001). Respiration in the light measured by 12CO2 emission in 13CO2 atmosphere in maize leaves . Australian Journal of Plant Physiology, 28, 1103-1108. |
| 20 |
Miyake C ( 2010). Alternative electron flows (water-water cycle and cyclic electron flow around PSI) in photosynthesis: Molecular mechanisms and physiological functions. Plant and Cell Physiology, 51, 1951-1963.
DOI URL PMID |
| 21 |
Miyake C, Yonekura K, Kobayashi Y, Yokota A ( 2002). Cyclic electron flow within PSII functions in intact chloroplasts from spinach leaves. Plant and Cell Physiology, 43, 951-957.
DOI URL PMID |
| 22 |
Peltier G, Tolleter D, Billon E, Cournac L ( 2010). Auxiliary electron transport pathways in chloroplasts of micro algae. Photosynthesis Research, 106, 19-31.
DOI URL |
| 23 |
Silva-Pérez V, Furbank RT, Condon AG, Evans J ( 2017). Biochemical model of C3 photosynthesis applied to wheat at different temperatures. Plant, Cell and Environment, 40, 1552-1564.
DOI URL PMID |
| 24 | Tang XL, Cao YH, Gu LH, Zhou BZ ( 2017 a). Advances in photo-physiological responses of leaves to environmental factors based on the FvCB model. Acta Ecologica Sinica, 37, 6633-6645. |
| [ 唐星林, 曹永慧, 顾连宏, 周本智 ( 2017 a). 基于FvCB模型的叶片光合生理对环境因子的响应研究进展. 生态学报, 37, 6633-6645.] | |
| 25 |
Tang XL, Zhou BZ, Zhou Y, Ni X, Cao YH, Gu LH ( 2017 b). Photo-physiological and photo-biochemical characteristics of several herbaceous and woody species based on FvCB model. Chinese Journal of Applied Ecology, 28, 1482-1488.
DOI URL |
|
[ 唐星林, 周本智, 周燕, 倪霞, 曹永慧, 顾连宏 ( 2017 b). 基于FvCB 模型的几种草本和木本植物光合生理生化特性. 应用生态学报, 28, 1482-1488.]
DOI URL |
|
| 26 |
Taylor L, Nunes-Nesi A, Parsley K, Leiss A, Leach G, Coates S, Wingler A, Fernie AR, Hibberd JM ( 2010). Cytosolic pyruvate, orthophosphate dikinase functions in nitrogen remobilization during leaf senescence and limits individual seed growth and nitrogen content. Plant Journal, 62, 641-652.
DOI URL PMID |
| 27 |
Valentini R, Epron D, de Angelis P, Matteucci G, Dreyer E ( 1995). In situ estimation of net CO2 assimilation, photosynthetic electron flow and photorespiration in Tukey oak (Q. cerris L.) leaves: Diurnal cycles under different levels of water supply. Plant, Cell and Environment, 18, 631-640.
DOI URL |
| 28 |
von Caemmerer S ( 2013). Steady-state models of photosynthesis. Plant, Cell and Environment, 36, 1617-1630.
DOI URL PMID |
| 29 | von Caemmerer S, Furbank RT ( 1999). Modeling of C4 photosynthesis. In: Sage RF, Monson R eds. C4 Plant Biology. Academic Press, San Diego, USA. 169-207. |
| 30 | Xue X, Xu HM, Wu HY, Shen YB, Xiao JW, Wan YL ( 2017). Research progress of cyclic electron transport in plant photosynthesis. Plant Physiology Journal, 53, 145-158. |
| [ 薛娴, 许会敏, 吴鸿洋, 沈应柏, 肖建伟, 万迎朗 ( 2017). 植物光合作用循环电子传递的研究进展. 植物生理学报, 53, 145-158.] | |
| 31 |
Ye ZP ( 2010). A review on modeling of responses of photosynthesis to light and CO2. Chinese Journal of Plant Ecology, 34, 727-740.
DOI URL |
|
[ 叶子飘 ( 2010). 光合作用对光和CO2响应模型的研究进展. 植物生态学报, 34, 727-740.]
DOI URL |
|
| 32 |
Ye ZP, Wang YJ, Wang LL, Kang HJ ( 2017). Response of photorespiration of Glycine max leaves to light intensity and CO2 concentration. Chinese Journal of Ecology, 36, 2535-2541.
DOI URL |
|
[ 叶子飘, 王怡娟, 王令俐, 康华靖 ( 2017). 大豆叶片光呼吸对光强和CO2浓度的响应. 生态学杂志, 36, 2535-2541.]
DOI URL |
|
| 33 |
Yin XY, Sun ZP, Struik PC, Gu JF ( 2011). Evaluating a new method to estimate the rate of leaf respiration in the light by analysis of combined gas exchange and chlorophyll fluorescence measurements. Journal of Experimental Botany, 62, 3489-3499.
DOI URL PMID |
| [1] | 王复标, 叶子飘. 植物电子传递速率光响应模型的研究进展[J]. 植物生态学报, 2024, 48(3): 287-305. |
| [2] | 叶子飘, 于冯, 安婷, 王复标, 康华靖. 植物气孔导度对CO2响应模型的构建[J]. 植物生态学报, 2021, 45(4): 420-428. |
| [3] | 叶子飘, 段世华, 安婷, 康华靖. 最大电子传递速率的确定及其对电子流分配的影响[J]. 植物生态学报, 2018, 42(4): 498-507. |
| [4] | 李理渊, 李俊, 同小娟, 孟平, 张劲松, 张静茹. 黄河小浪底栓皮栎、刺槐叶片电子传递速率-光响应的模拟[J]. 植物生态学报, 2018, 42(10): 1009-1021. |
| [5] | 叶子飘, 胡文海, 闫小红. 光系统II实际光化学量子效率对光的响应模型的比较[J]. 植物生态学报, 2016, 40(11): 1208-1217. |
| [6] | 罗辅燕,陈卫英,陈真勇. 指数改进模型在大麦光合-CO2响应曲线中的适用性[J]. 植物生态学报, 2013, 37(7): 650-655. |
| [7] | 苏华, 李永庚, 苏本营, 孙建新. 地下水位下降对浑善达克沙地榆树光合及抗逆性的影响[J]. 植物生态学报, 2012, 36(3): 177-186. |
| [8] | 焦娟玉, 尹春英, 陈珂. 土壤水、氮供应对麻疯树幼苗光合特性的影响[J]. 植物生态学报, 2011, 35(1): 91-99. |
| [9] | 叶子飘. 光合作用对光和CO2响应模型的研究进展[J]. 植物生态学报, 2010, 34(6): 727-740. |
| [10] | 徐振锋, 胡庭兴, 张力, 张远彬, 鲜骏仁, 王开运. 青藏高原东缘林线交错带糙皮桦幼苗光合特性对模拟增温的短期响应[J]. 植物生态学报, 2010, 34(3): 263-270. |
| [11] | 简在友, 王文全, 孟丽, 许桂芳, 王秋玲, 李卫东, 俞敬波. 芍药组内不同类群间光合特性及叶绿素荧光特性比较[J]. 植物生态学报, 2010, 34(12): 1463-1471. |
| [12] | 张绪成, 于显枫, 高世铭. 高大气CO2浓度下氮素对小麦叶片光能利用的影响[J]. 植物生态学报, 2010, 34(10): 1196-1203. |
| [13] | 祖元刚, 张衷华, 王文杰, 杨逢建, 贺海升. 薇甘菊叶和茎的光合特性[J]. 植物生态学报, 2006, 30(6): 998-1004. |
| 阅读次数 | ||||||
|
全文 |
|
|||||
|
摘要 |
|
|||||
Copyright © 2026 版权所有 《植物生态学报》编辑部
地址: 北京香山南辛村20号, 邮编: 100093
Tel.: 010-62836134, 62836138; Fax: 010-82599431; E-mail: apes@ibcas.ac.cn, cjpe@ibcas.ac.cn
备案号: 京ICP备16067583号-19
![]()